Pay vs Performance Disclosure
Apr. 03, 2026
USD ($)
Mar. 28, 2025
USD ($)
Mar. 29, 2024
USD ($)
Mar. 31, 2023
USD ($)
Apr. 01, 2022
USD ($)
Pay Versus Performance
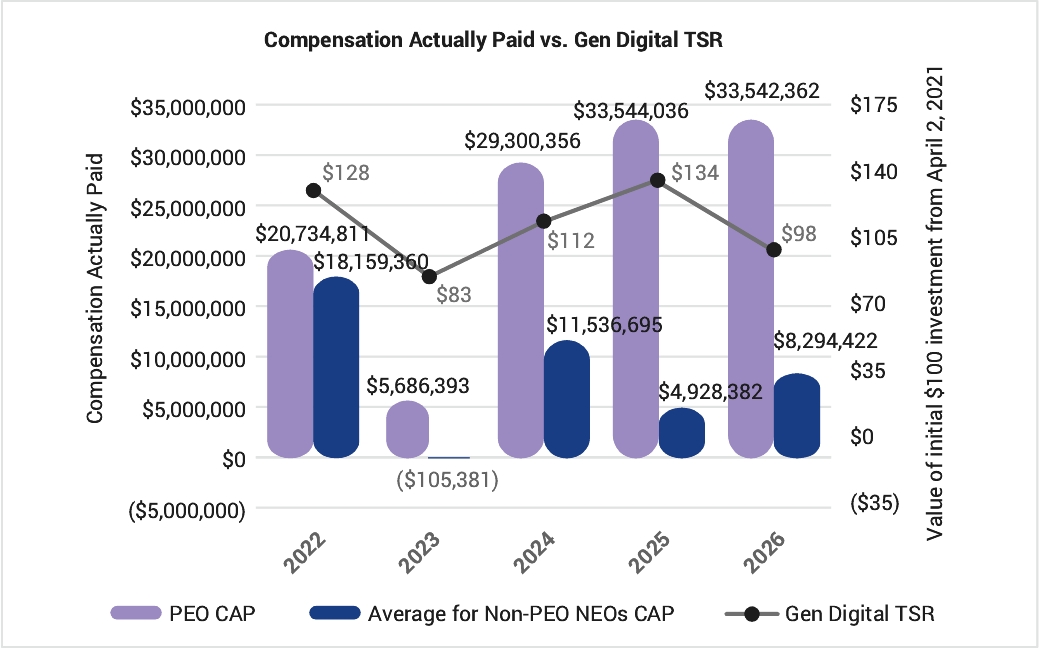
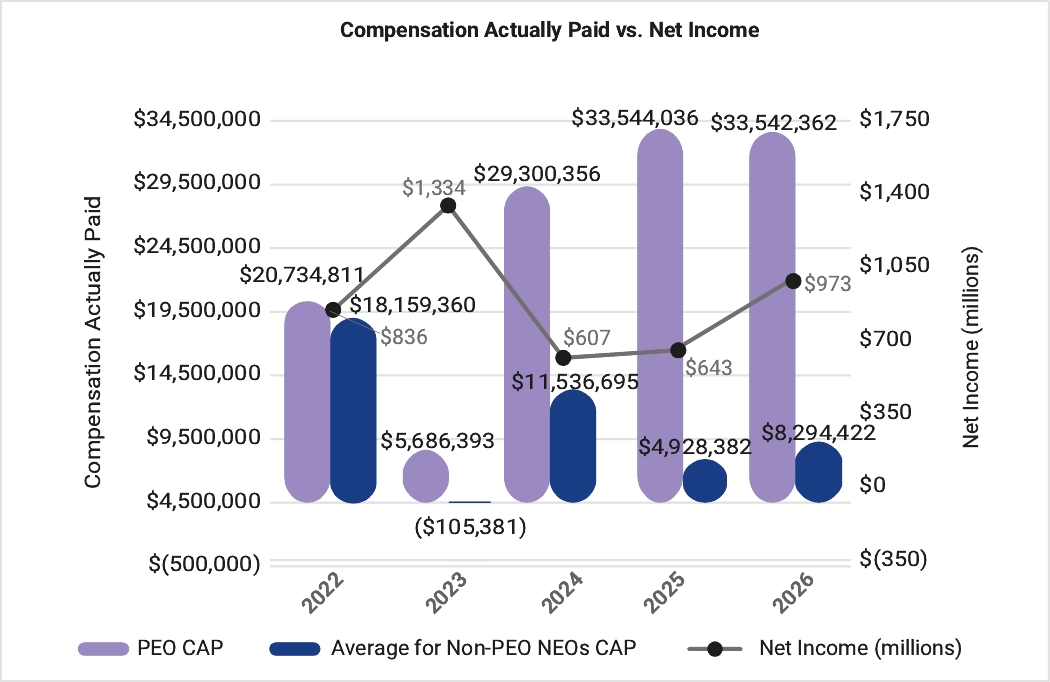
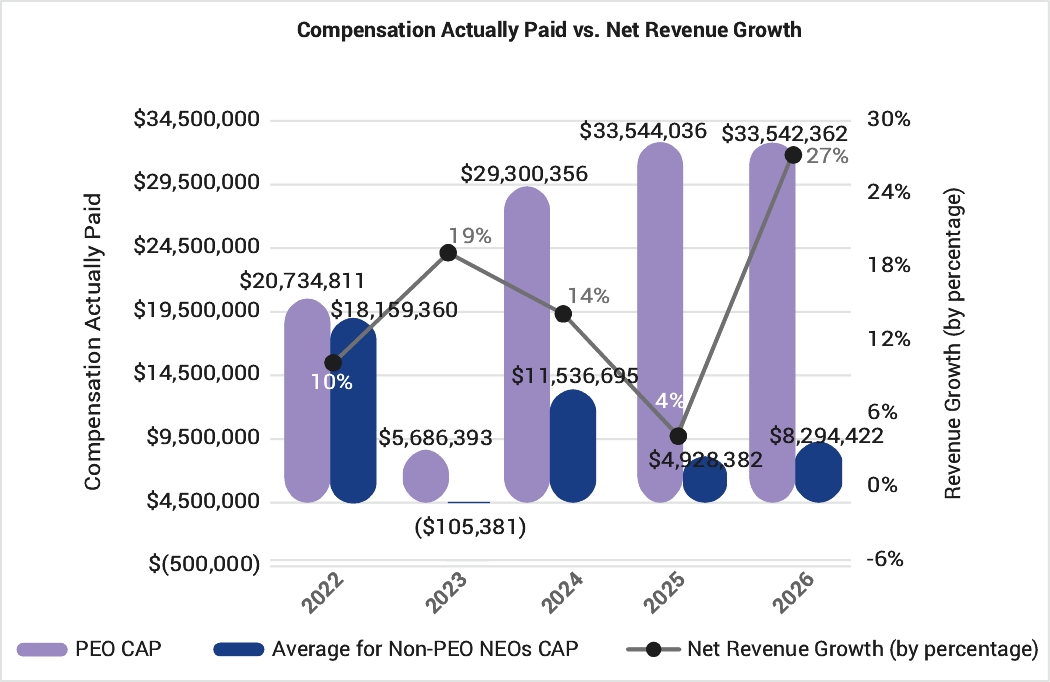
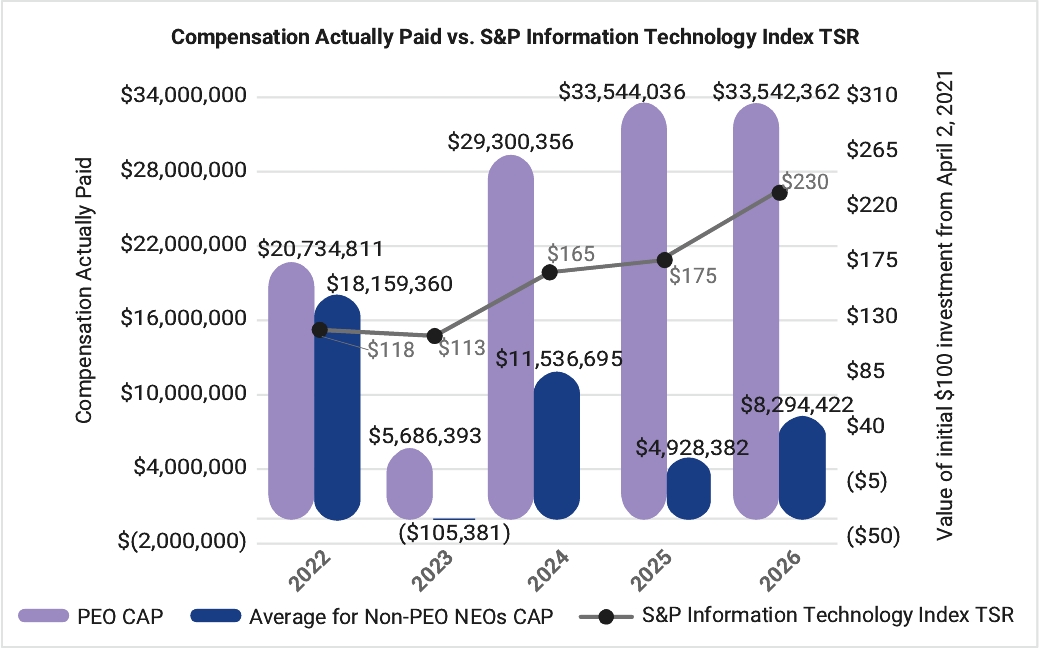
This section provides disclosure about the relationship between executive compensation actually paid to our principal executive officer (PEO) and non-PEO NEOs and certain financial performance measures of the Company for the fiscal years listed below. This disclosure has been prepared in accordance with Item 402(v) of Regulation S-K under the Exchange Act (Pay Versus Performance Rules) and does not necessarily reflect how the Compensation and Leadership Development Committee evaluates compensation decisions.
Value of Initial Fixed $100 Investment Based On:(5) | ||||||||||||||||||||||||
Year(1) (a) | Summary Compensation Table Total for PEO (b) | Compensation Actually Paid to PEO(2)(3) (c) | Average Summary Compensation Table Total for Non-PEO NEOs (d) | Average Compensation Actually Paid to Non-PEO NEOs(2)(4) (e) | Total Shareholder Return (f) | Peer Group Total Shareholder Return (g) | Net Income (in millions) (h) | Net Revenue Growth (by percentage)(6) (i) | ||||||||||||||||
2026 | $83,577,342 | $33,542,362 | $22,154,285 | $8,294,422 | $98 | $230 | $973 | 27% | ||||||||||||||||
2025 | $22,510,196 | $33,544,036 | $7,591,115 | $4,928,382 | $134 | $175 | $643 | 4% | ||||||||||||||||
2024 | $15,362,827 | $29,300,356 | $6,219,954 | $11,536,695 | $112 | $165 | $607 | 14% | ||||||||||||||||
2023 | $25,291,365 | $5,686,393 | $9,006,551 | $(105,381) | $83 | $113 | $1,334 | 19% | ||||||||||||||||
2022 | $13,517,505 | $20,734,811 | $12,126,077 | $18,159,360 | $128 | $118 | $836 | 10% | ||||||||||||||||
(1) | The following table lists the PEO and non-PEO NEOs for each of fiscal years 2022, 2023, 2024, 2025 and 2026. |
PEO | Non-PEO NEOs | |||||
2026 | Vincent Pilette | Natalie Derse and Bryan Ko | ||||
2025 | Vincent Pilette | Natalie Derse and Bryan Ko | ||||
2024 | Vincent Pilette | Ondrej Vlcek, Natalie Derse, and Bryan Ko | ||||
2023 | Vincent Pilette | Ondrej Vlcek, Natalie Derse, and Bryan Ko | ||||
2022 | Vincent Pilette | Natalie Derse and Bryan Ko | ||||
(2) | The dollar amounts reported represent the amount of “compensation actually paid,” as calculated in accordance with the Pay Versus Performance Rules. These dollar amounts do not reflect the actual amounts of compensation earned by or paid to our NEOs during the applicable year. For purposes of calculating “compensation actually paid,” the fair value of equity awards is calculated in accordance with ASC Topic 718 using the same assumption methodologies used to calculate the grant date fair value of awards for purposes of the Summary Compensation Table (refer to “Executive Compensation and Related Information — Executive Compensation Tables — Summary Compensation Table” for additional information). |
(3) | The following table shows the amounts deducted from and added to the Summary Compensation Table total to calculate “compensation actually paid” to Mr. Pilette in accordance with the Pay Versus Performance Rules: |
Pension Plan Adjustments | Equity Award Adjustments | ||||||||||||||||||||||||||||||||
Summary Compensation Table Total for PEO | Change in Pension Value | Pension Service Cost | Stock Awards | Year End Fair Value of Equity Awards Granted in the Year and Unvested at Year End | Year over Year Change in Fair Value of Outstanding and Unvested Equity Awards Granted in Prior Years | Fair Value as of Vesting Date of Equity Awards Granted and Vested in the Year | Change in Fair Value of Equity Awards Granted in Prior Years that Vested in the Year | Fair Value at the End of the Prior Year of Equity Awards that Failed to Meet Vesting Conditions in the Year | Value of Dividends or other Earnings Paid on Stock or Option Awards not Otherwise Reflected in Fair Value | Compensation Actually Paid to PEO | |||||||||||||||||||||||
2026 | $83,577,342 | N/A | N/A | $(80,495,844) | $41,800,388 | $(11,168,830) | — | $(1,424,101) | — | $1,253,407 | $33,542,362 | ||||||||||||||||||||||
2025 | $22,510,196 | N/A | N/A | $(19,831,802) | $22,927,750 | $2,162,792 | — | $4,934,262 | — | $840,838 | $33,544,036 | ||||||||||||||||||||||
2024 | $15,362,827 | N/A | N/A | $(13,386,893) | $17,963,298 | $4,235,771 | — | $4,261,074 | — | $864,279 | $29,300,356 | ||||||||||||||||||||||
2023 | $25,291,365 | N/A | N/A | $(23,336,211) | $10,908,779 | $(5,774,617) | — | $(2,068,928) | — | $666,005 | $5,686,393 | ||||||||||||||||||||||
2022 | $13,517,505 | N/A | N/A | $(11,437,131) | $15,110,461 | $3,167,247 | — | $356,090 | — | $20,639 | $20,734,811 | ||||||||||||||||||||||
(4) | The following table shows the amounts deducted from and added to the average Summary Compensation Table total compensation to calculate the average “compensation actually paid” to our non-PEO NEOs in accordance with the Pay Versus Performance Rules. |
Pension Plan Adjustments | Equity Award Adjustments | ||||||||||||||||||||||||||||||||
Average Summary Compensation Table Total for Non-PEO NEOs | Change in Pension Value | Pension Service Cost | Stock Awards | Year End Fair Value of Equity Awards Granted in the Year and Unvested at Year End | Year over Year Change in Fair Value of Outstanding and Unvested Equity Awards Granted in Prior Years | Fair Value as of Vesting Date of Equity Awards Granted and Vested in the Year | Change in Fair Value of Equity Awards Granted in Prior Years that Vested in the Year | Fair Value at the End of the Prior Year of Equity Awards that Failed to Meet Vesting Conditions in the Year | Value of Dividends or other Earnings Paid on Stock or Option Awards not Otherwise Reflected in Fair Value | Average Compensation Actually Paid to Non-PEO NEOs | |||||||||||||||||||||||
2026 | $22,154,285 | N/A | N/A | $(20,666,704) | $10,765,130 | $(3,906,887) | $— | $(436,096) | $— | $384,695 | $8,294,422 | ||||||||||||||||||||||
2025 | $7,591,115 | N/A | N/A | $(6,154,702) | $7,115,515 | $923,819 | $— | $1,409,980 | $(6,246,581) | $289,237 | $4,928,382 | ||||||||||||||||||||||
2024 | $6,219,954 | N/A | N/A | $(5,088,586) | $6,828,155 | $2,218,641 | $— | $1,122,822 | $— | $235,709 | $11,536,695 | ||||||||||||||||||||||
2023 | $9,006,551 | N/A | N/A | $(8,173,767) | $5,095,792 | $(5,796,603) | $— | $(517,328) | $— | $279,974 | $(105,381) | ||||||||||||||||||||||
2022 | $12,126,077 | N/A | N/A | $(11,197,900) | $13,885,671 | $1,213,977 | $— | $1,000,832 | $— | $1,130,703 | $18,159,360 | ||||||||||||||||||||||
(5) | In accordance with the Pay Versus Performance Rules, the Company and the Company’s peer group total shareholder return (Peer Group TSR) is determined based on the value of an initial fixed investment of $100 on April 1, 2022, through the end of the listed fiscal year. The Peer Group TSR set forth in this table was determined using the S&P Information Technology Index, which we also use in preparing the stock performance graph required by Item 201(e) of Regulation S-K for our Annual Report for the fiscal year ended April 3, 2026. |
(6) | We have determined that Net Revenue Growth is the financial performance measure that, in the Company’s assessment, represents the most important financial performance measure used to link “compensation actually paid” to our NEOs, for fiscal year 2026, to company performance (Company Selected Measure (as defined in the Pay Versus Performance Rules)). “Net Revenue Growth” refers to the percentage of year-over-year growth in annual GAAP net revenue. |
(7) | On June 13, 2024, Ondrej Vlcek departed from the Company as President. As a result: |
His PRU awards that were granted on October 10, 2022, and May 10, 2023, were fully cancelled upon departure and are not included in “Compensation Actually Paid to Non-PEO NEOs.”
His RSU awards that were granted on October 10, 2022, and May 10, 2023 were partially cancelled. The first and second tranches of these RSU awards, which vested before his departure, are included in the “Compensation Actually Paid to Non-PEO NEOs” for prior fiscal years, while the third tranches of these RSU awards, which were unvested at the time of his departure were cancelled and excluded from “Compensation Actually Paid to Non-PEO NEOs.”
(1) | The following table lists the PEO and non-PEO NEOs for each of fiscal years 2022, 2023, 2024, 2025 and 2026. |
PEO | Non-PEO NEOs | |||||
2026 | Vincent Pilette | Natalie Derse and Bryan Ko | ||||
2025 | Vincent Pilette | Natalie Derse and Bryan Ko | ||||
2024 | Vincent Pilette | Ondrej Vlcek, Natalie Derse, and Bryan Ko | ||||
2023 | Vincent Pilette | Ondrej Vlcek, Natalie Derse, and Bryan Ko | ||||
2022 | Vincent Pilette | Natalie Derse and Bryan Ko | ||||
(5) | In accordance with the Pay Versus Performance Rules, the Company and the Company’s peer group total shareholder return (Peer Group TSR) is determined based on the value of an initial fixed investment of $100 on April 1, 2022, through the end of the listed fiscal year. The Peer Group TSR set forth in this table was determined using the S&P Information Technology Index, which we also use in preparing the stock performance graph required by Item 201(e) of Regulation S-K for our Annual Report for the fiscal year ended April 3, 2026. |
(3) | The following table shows the amounts deducted from and added to the Summary Compensation Table total to calculate “compensation actually paid” to Mr. Pilette in accordance with the Pay Versus Performance Rules: |
Pension Plan Adjustments | Equity Award Adjustments | ||||||||||||||||||||||||||||||||
Summary Compensation Table Total for PEO | Change in Pension Value | Pension Service Cost | Stock Awards | Year End Fair Value of Equity Awards Granted in the Year and Unvested at Year End | Year over Year Change in Fair Value of Outstanding and Unvested Equity Awards Granted in Prior Years | Fair Value as of Vesting Date of Equity Awards Granted and Vested in the Year | Change in Fair Value of Equity Awards Granted in Prior Years that Vested in the Year | Fair Value at the End of the Prior Year of Equity Awards that Failed to Meet Vesting Conditions in the Year | Value of Dividends or other Earnings Paid on Stock or Option Awards not Otherwise Reflected in Fair Value | Compensation Actually Paid to PEO | |||||||||||||||||||||||
2026 | $83,577,342 | N/A | N/A | $(80,495,844) | $41,800,388 | $(11,168,830) | — | $(1,424,101) | — | $1,253,407 | $33,542,362 | ||||||||||||||||||||||
2025 | $22,510,196 | N/A | N/A | $(19,831,802) | $22,927,750 | $2,162,792 | — | $4,934,262 | — | $840,838 | $33,544,036 | ||||||||||||||||||||||
2024 | $15,362,827 | N/A | N/A | $(13,386,893) | $17,963,298 | $4,235,771 | — | $4,261,074 | — | $864,279 | $29,300,356 | ||||||||||||||||||||||
2023 | $25,291,365 | N/A | N/A | $(23,336,211) | $10,908,779 | $(5,774,617) | — | $(2,068,928) | — | $666,005 | $5,686,393 | ||||||||||||||||||||||
2022 | $13,517,505 | N/A | N/A | $(11,437,131) | $15,110,461 | $3,167,247 | — | $356,090 | — | $20,639 | $20,734,811 | ||||||||||||||||||||||
(4) | The following table shows the amounts deducted from and added to the average Summary Compensation Table total compensation to calculate the average “compensation actually paid” to our non-PEO NEOs in accordance with the Pay Versus Performance Rules. |
Pension Plan Adjustments | Equity Award Adjustments | ||||||||||||||||||||||||||||||||
Average Summary Compensation Table Total for Non-PEO NEOs | Change in Pension Value | Pension Service Cost | Stock Awards | Year End Fair Value of Equity Awards Granted in the Year and Unvested at Year End | Year over Year Change in Fair Value of Outstanding and Unvested Equity Awards Granted in Prior Years | Fair Value as of Vesting Date of Equity Awards Granted and Vested in the Year | Change in Fair Value of Equity Awards Granted in Prior Years that Vested in the Year | Fair Value at the End of the Prior Year of Equity Awards that Failed to Meet Vesting Conditions in the Year | Value of Dividends or other Earnings Paid on Stock or Option Awards not Otherwise Reflected in Fair Value | Average Compensation Actually Paid to Non-PEO NEOs | |||||||||||||||||||||||
2026 | $22,154,285 | N/A | N/A | $(20,666,704) | $10,765,130 | $(3,906,887) | $— | $(436,096) | $— | $384,695 | $8,294,422 | ||||||||||||||||||||||
2025 | $7,591,115 | N/A | N/A | $(6,154,702) | $7,115,515 | $923,819 | $— | $1,409,980 | $(6,246,581) | $289,237 | $4,928,382 | ||||||||||||||||||||||
2024 | $6,219,954 | N/A | N/A | $(5,088,586) | $6,828,155 | $2,218,641 | $— | $1,122,822 | $— | $235,709 | $11,536,695 | ||||||||||||||||||||||
2023 | $9,006,551 | N/A | N/A | $(8,173,767) | $5,095,792 | $(5,796,603) | $— | $(517,328) | $— | $279,974 | $(105,381) | ||||||||||||||||||||||
2022 | $12,126,077 | N/A | N/A | $(11,197,900) | $13,885,671 | $1,213,977 | $— | $1,000,832 | $— | $1,130,703 | $18,159,360 | ||||||||||||||||||||||
Required Tabular Disclosure of Most Important Measures
In accordance with the Pay Versus Performance Rules, the following table lists the most important financial and non-financial performance measures that, in the Company’s assessment, represent the most important performance measures used to link “compensation actually paid” to our NEOs, for fiscal year 2026, to company performance, as further described in our Compensation Discussion and Analysis within the sections titled “Executive Compensation and Related Information — Executive Compensation Summary — FY25 Performance Highlights and Pay for Performance Alignment” (see page 44), “Executive Compensation and Related Information — Executive Compensation Summary — Compensation Components” (see page 47), “Executive Compensation and Related Information — Executive Compensation Summary — Executive Annual Incentive Plan (EAIP)” (see page 51), and “Executive Compensation and Related Information — Executive Compensation Summary — Equity Incentive Awards” (see page 53).
Most Important Performance Measures | |||
Net Revenue Growth | | ||
Non-GAAP Operating Income | | ||
Non-GAAP Operating Margin | | ||
Relative Total Shareholder Return | | ||
Absolute Total Shareholder Return | | ||
Bookings Growth | | ||