Exhibit 99.2
Second Quarter 2026 Earnings Presentation July 28, 2026
Cautionary Forward-Looking Statements This presentation is for informational
purposes only and does not purport to include a complete discussion of the topics mentioned and should not be relied upon as a basis for making an investment decision in the Company’s securities. This presentation also includes “forward-looking
statements” within the meaning of the safe harbor provisions of the United States Private Securities Litigation Reform Act of 1995. Forward-looking statements often include words such as “expect,” “estimate,” “project,” “budget,” “forecast,”
“anticipate,” “intend,” “plan,” “may,” “will,” “could,” “should,” “believes,” “predicts,” “potential,” “continue,” and similar expressions, but the absence of such words or expressions does not mean a statement is not forward-looking. These
forward‑looking statements are subject to risks and uncertainties, including those identified below, which could cause actual future results to differ materially from historical results or from those anticipated or implied by such statements.
The following factors, among others, could cause future results to differ materially from historical results or from those indicated by forward‑looking statements included in this press release: (1) the level of demand for mortgage and
commercial loans, which is affected by such external factors as general economic conditions, market interest rate levels, tax laws, and the demographics of our lending markets; (2) the direction and magnitude of changes in interest rates and
the relationship between market interest rates and the yield on our interest‑earning assets and the cost of our interest‑bearing liabilities; (3) the rate and amount of loan losses incurred and projected to be incurred by us, increases in the
amounts of our nonperforming assets, the level of our loss reserves and management’s judgments regarding the collectability of loans; (4) changes in the regulation of lending and deposit operations or other regulatory actions, whether
industry-wide or focused on our operations, including increases in capital requirements or directives to increase allowances for loan losses or make other changes in our business operations; (5) legislative or regulatory changes, including
those that may be implemented by the current administration in Washington, D.C. and the Federal Reserve Board; (6) possible adverse rulings, judgments, settlements and other outcomes of litigation; (7) actions undertaken by both current and
potential new competitors; (8) the possibility of adverse trends in property values or economic trends in the residential and commercial real estate markets in which we compete; (9) the effect of changes in general economic conditions; (10) the
effect of geopolitical uncertainties; (11) the impact of health crises on our future financial condition and operations; (12) the impact of any volatility in the banking sector due to the failure of certain banks due to high levels of exposure
to liquidity risk, interest rate risk, uninsured deposits and cryptocurrency risk; (13) the loss of our CDFI certification could potentially limit our grant income awards; and (14) other risks and uncertainties. All such factors are difficult
to predict and are beyond our control. Additional factors that could cause results to differ materially from those described above can be found in our annual reports on Form 10-K, quarterly reports on Form 10-Q, current reports on Form 8-K or
other filings made with the SEC and are available on our website at http://www.cityfirstbank.com and on the SEC’s website at http://www.sec.gov. Forward-looking statements in this presentation speak only as of the date they are made, and
we undertake no obligation, and do not intend, to update these forward-looking statements to reflect events or circumstances occurring after the date of this presentation, except to the extent required by law. You are cautioned not to place
undue reliance on these forward-looking statements, which speak only as of the date of this presentation.
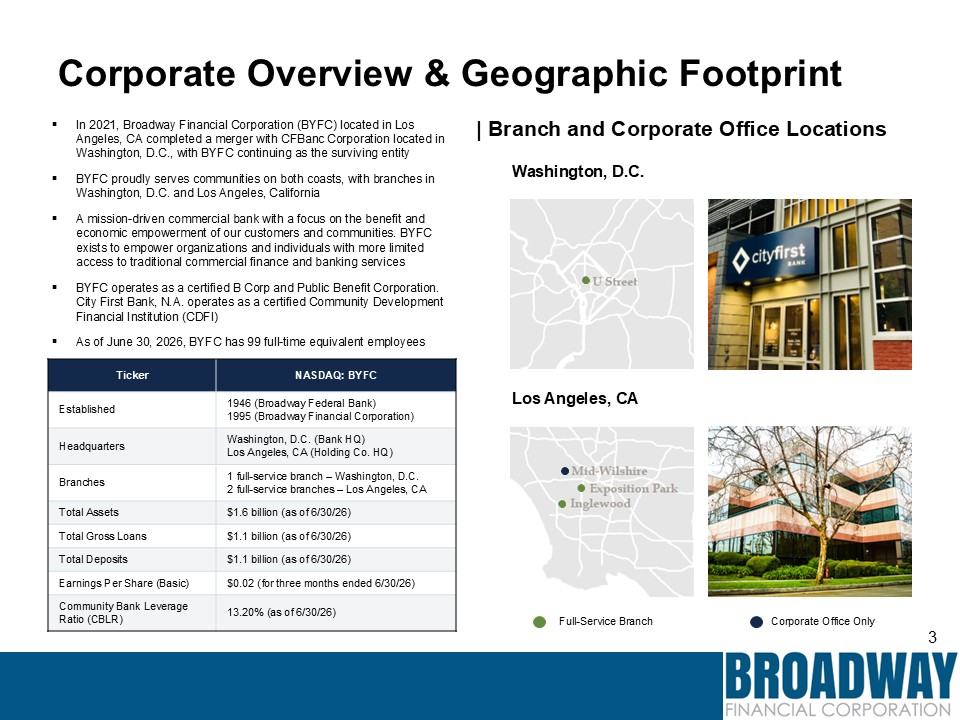
Corporate Overview & Geographic Footprint In 2021, Broadway Financial
Corporation (BYFC) located in Los Angeles, CA completed a merger with CFBanc Corporation located in Washington, D.C., with BYFC continuing as the surviving entity BYFC proudly serves communities on both coasts, with branches in Washington,
D.C. and Los Angeles, California A mission-driven commercial bank with a focus on the benefit and economic empowerment of our customers and communities. BYFC exists to empower organizations and individuals with more limited access to
traditional commercial finance and banking services BYFC operates as a certified B Corp and Public Benefit Corporation. City First Bank, N.A. operates as a certified Community Development Financial Institution (CDFI) As of June 30, 2026, BYFC
has 99 full-time equivalent employees Ticker NASDAQ: BYFC Established 1946 (Broadway Federal Bank) 1995 (Broadway Financial Corporation) Headquarters Washington, D.C. (Bank HQ) Los Angeles, CA (Holding Co. HQ) Branches 1 full-service
branch – Washington, D.C. 2 full-service branches – Los Angeles, CA Total Assets $1.6 billion (as of 6/30/26) Total Gross Loans $1.1 billion (as of 6/30/26) Total Deposits $1.1 billion (as of 6/30/26) Earnings Per Share (Basic) $0.02
(for three months ended 6/30/26) Community Bank Leverage Ratio (CBLR) 13.20% (as of 6/30/26) Los Angeles, CA Washington, D.C. | Branch and Corporate Office Locations Full-Service Branch Corporate Office Only
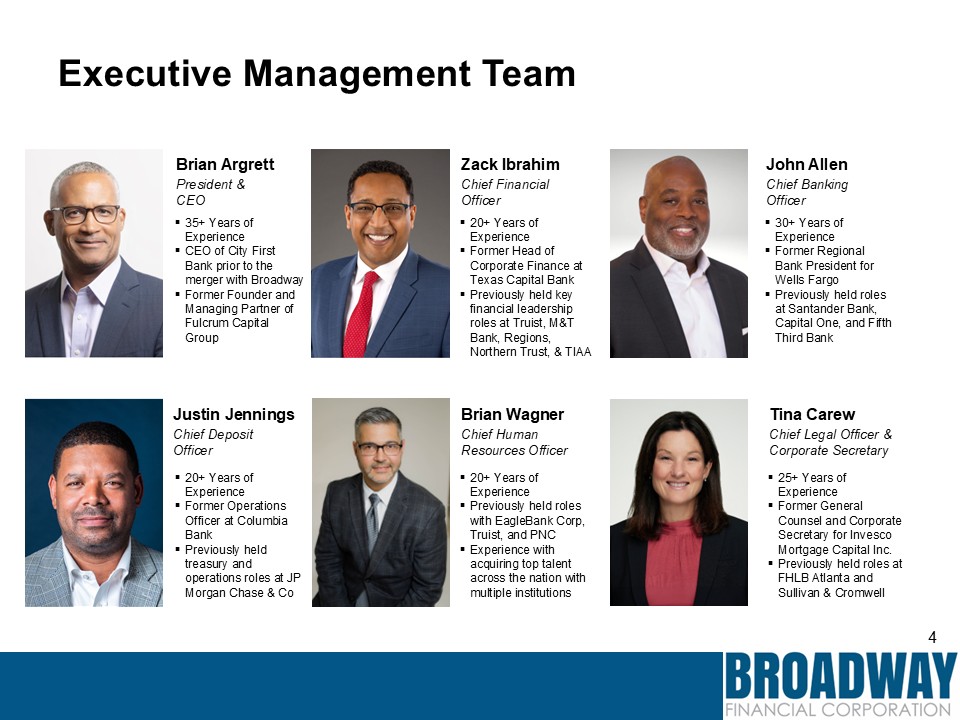
Executive Management Team Brian Argrett President & CEO 35+ Years of
Experience CEO of City First Bank prior to the merger with Broadway Former Founder and Managing Partner of Fulcrum Capital Group Zack Ibrahim Chief Financial Officer 20+ Years of Experience Former Head of Corporate Finance at Texas
Capital Bank Previously held key financial leadership roles at Truist, M&T Bank, Regions, Northern Trust, & TIAA John Allen Chief Banking Officer 30+ Years of Experience Former Regional Bank President for Wells Fargo Previously
held roles at Santander Bank, Capital One, and Fifth Third Bank Justin Jennings Chief Deposit Officer Brian Wagner Chief Human Resources Officer 20+ Years of Experience Previously held roles with EagleBank Corp, Truist, and
PNC Experience with acquiring top talent across the nation with multiple institutions Tina Carew Chief Legal Officer & Corporate Secretary 25+ Years of Experience Former General Counsel and Corporate Secretary for Invesco Mortgage
Capital Inc. Previously held roles at FHLB Atlanta and Sullivan & Cromwell 20+ Years of Experience Former Operations Officer at Columbia Bank Previously held treasury and operations roles at JP Morgan Chase & Co
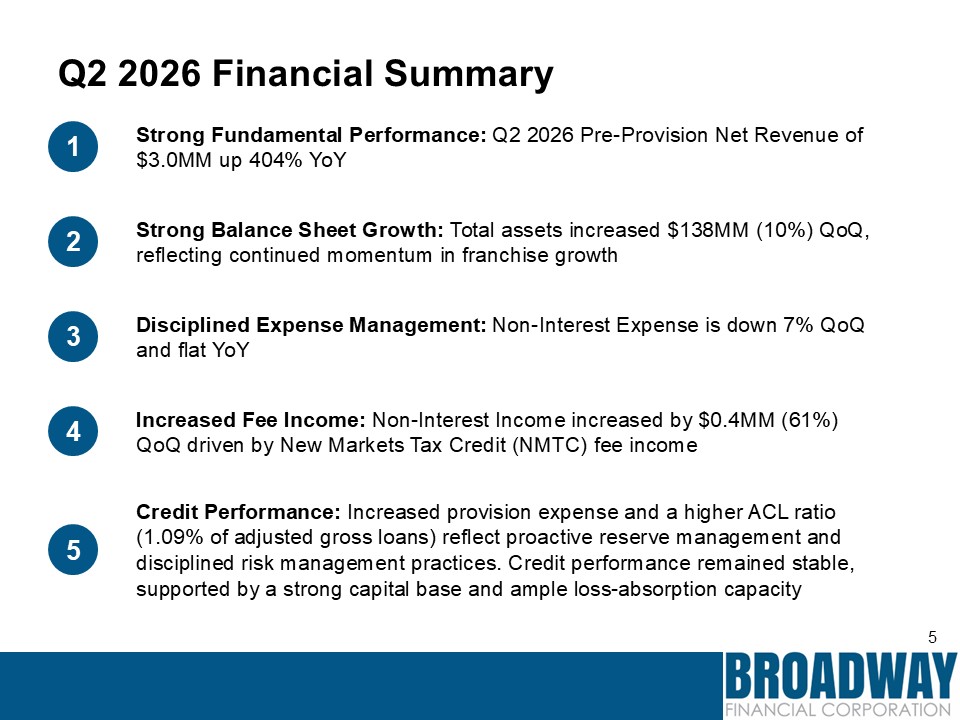
Q2 2026 Financial Summary 1 Strong Fundamental Performance: Q2 2026
Pre-Provision Net Revenue of $3.0MM up 404% YoY 2 Strong Balance Sheet Growth: Total assets increased $138MM (10%) QoQ, reflecting continued momentum in franchise growth 3 Disciplined Expense Management: Non-Interest Expense is down 7% QoQ
and flat YoY 4 Increased Fee Income: Non-Interest Income increased by $0.4MM (61%) QoQ driven by New Markets Tax Credit (NMTC) fee income 5 Credit Performance: Increased provision expense and a higher ACL ratio (1.09% of adjusted gross
loans) reflect proactive reserve management and disciplined risk management practices. Credit performance remained stable, supported by a strong capital base and ample loss-absorption capacity
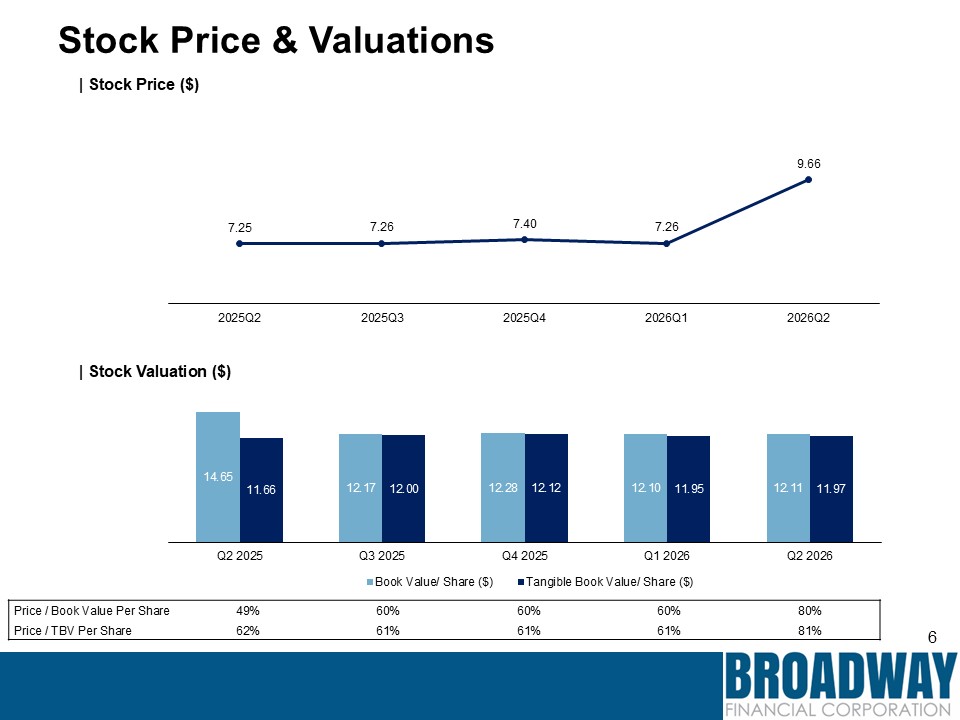
Stock Price & Valuations | Stock Valuation ($) | Stock Price ($) Price /
Book Value Per Share 49% 60% 60% 60% 80% Price / TBV Per Share 62% 61% 61% 61% 81%
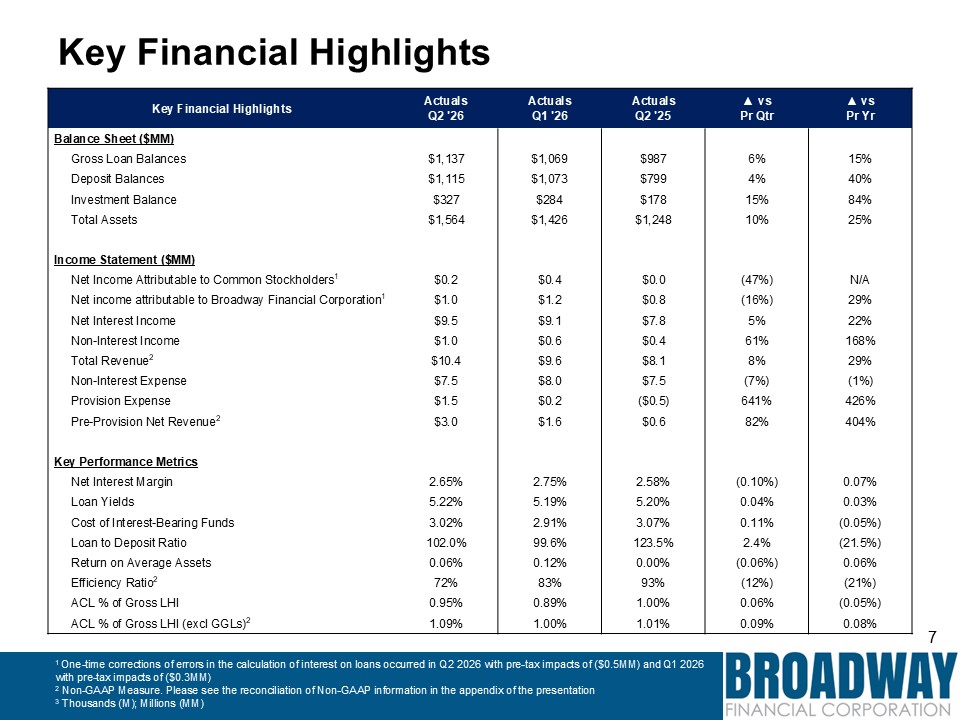
Key Financial Highlights ActualsQ2 '26 ActualsQ1 '26 ActualsQ2 '25 ▲ vsPr
Qtr ▲ vsPr Yr Balance Sheet ($MM) Gross Loan Balances $1,137 $1,069 $987 6% 15% Deposit Balances $1,115 $1,073 $799 4% 40% Investment Balance $327 $284 $178 15% 84% Total
Assets $1,564 $1,426 $1,248 10% 25% Income Statement ($MM) Net Income Attributable to Common Stockholders1 $0.2 $0.4 $0.0 (47%) N/A Net income attributable to Broadway Financial Corporation1 $1.0
$1.2 $0.8 (16%) 29% Net Interest Income $9.5 $9.1 $7.8 5% 22% Non-Interest Income $1.0 $0.6 $0.4 61% 168% Total Revenue2 $10.4 $9.6 $8.1 8% 29% Non-Interest Expense $7.5 $8.0 $7.5 (7%) (1%) Provision
Expense $1.5 $0.2 ($0.5) 641% 426% Pre-Provision Net Revenue2 $3.0 $1.6 $0.6 82% 404% Key Performance Metrics Net Interest Margin 2.65% 2.75% 2.58% (0.10%) 0.07% Loan
Yields 5.22% 5.19% 5.20% 0.04% 0.03% Cost of Interest-Bearing Funds 3.02% 2.91% 3.07% 0.11% (0.05%) Loan to Deposit Ratio 102.0% 99.6% 123.5% 2.4% (21.5%) Return on Average Assets
0.06% 0.12% 0.00% (0.06%) 0.06% Efficiency Ratio2 72% 83% 93% (12%) (21%) ACL % of Gross LHI 0.95% 0.89% 1.00% 0.06% (0.05%) ACL % of Gross LHI (excl GGLs)2 1.09% 1.00% 1.01% 0.09% 0.08% Key Financial Highlights 1
One-time corrections of errors in the calculation of interest on loans occurred in Q2 2026 with pre-tax impacts of ($0.5MM) and Q1 2026 with pre-tax impacts of ($0.3MM) 2 Non-GAAP Measure. Please see the reconciliation of Non-GAAP information
in the appendix of the presentation 3 Thousands (M); Millions (MM)
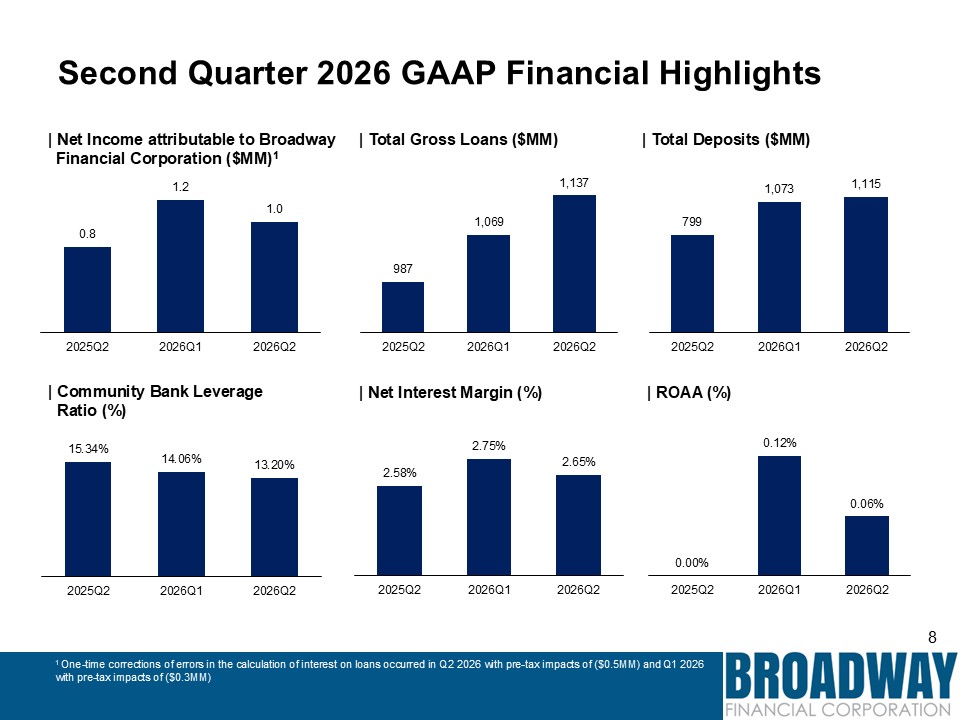
Second Quarter 2026 GAAP Financial Highlights | Net Income attributable to
Broadway _Financial Corporation ($MM)1 | Total Gross Loans ($MM) | Total Deposits ($MM) | Community Bank Leverage _Ratio (%) | Net Interest Margin (%) | ROAA (%) 1 One-time corrections of errors in the calculation of interest on loans
occurred in Q2 2026 with pre-tax impacts of ($0.5MM) and Q1 2026 with pre-tax impacts of ($0.3MM)
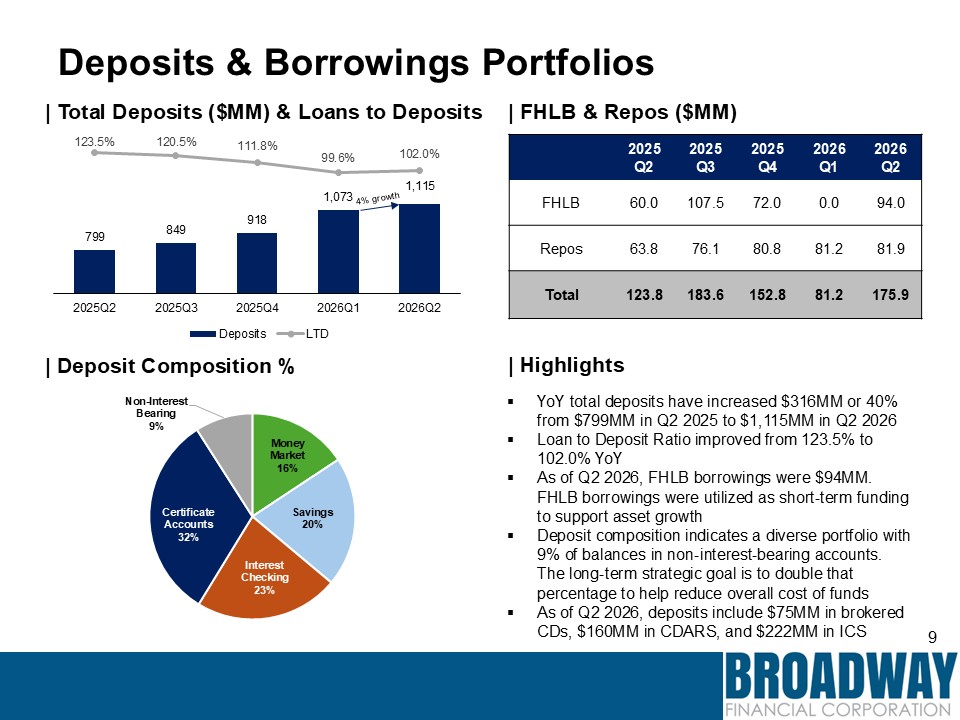
Deposits & Borrowings Portfolios | Total Deposits ($MM) & Loans to
Deposits | Deposit Composition % | FHLB & Repos ($MM) | Highlights YoY total deposits have increased $316MM or 40% from $799MM in Q2 2025 to $1,115MM in Q2 2026 Loan to Deposit Ratio improved from 123.5% to 102.0% YoY As of Q2 2026,
FHLB borrowings were $94MM. FHLB borrowings were utilized as short-term funding to support asset growth Deposit composition indicates a diverse portfolio with 9% of balances in non-interest-bearing accounts. The long-term strategic goal is to
double that percentage to help reduce overall cost of funds As of Q2 2026, deposits include $75MM in brokered CDs, $160MM in CDARS, and $222MM in
ICS 2025 Q2 2025 Q3 2025 Q4 2026 Q1 2026 Q2 FHLB 60.0 107.5 72.0 0.0 94.0 Repos 63.8 76.1 80.8 81.2 81.9 Total 123.8 183.6 152.8 81.2 175.9 4% growth
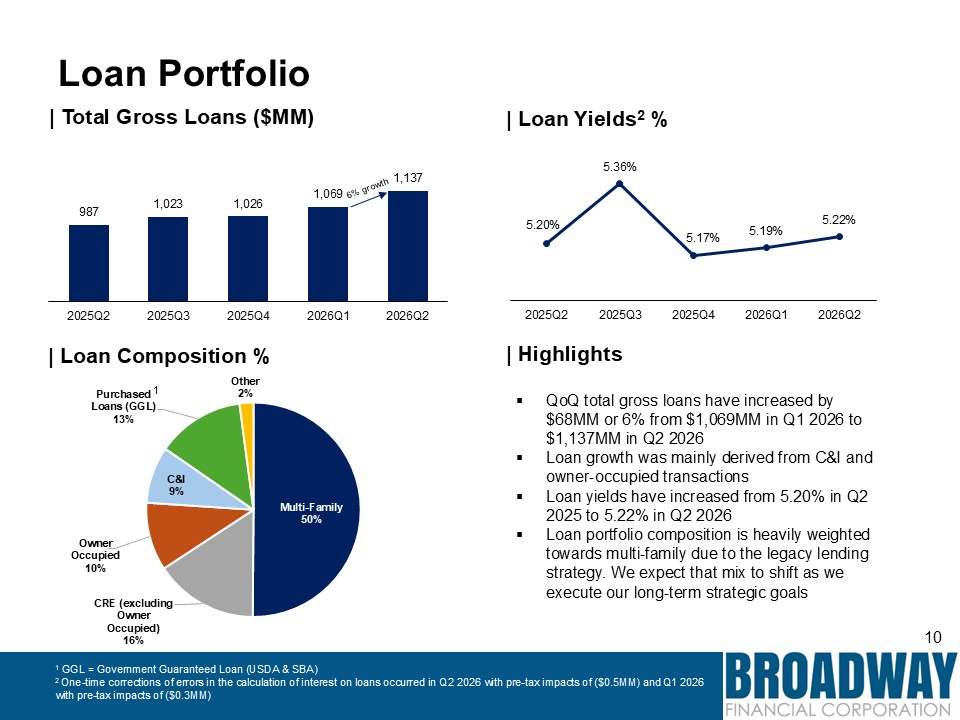
6% growth | Loan Yields2 % Loan Portfolio | Loan Composition % | Total Gross
Loans ($MM) | Highlights QoQ total gross loans have increased by $68MM or 6% from $1,069MM in Q1 2026 to $1,137MM in Q2 2026 Loan growth was mainly derived from C&I and owner-occupied transactions Loan yields have increased from 5.20%
in Q2 2025 to 5.22% in Q2 2026 Loan portfolio composition is heavily weighted towards multi-family due to the legacy lending strategy. We expect that mix to shift as we execute our long-term strategic goals 1 1 GGL = Government Guaranteed
Loan (USDA & SBA) 2 One-time corrections of errors in the calculation of interest on loans occurred in Q2 2026 with pre-tax impacts of ($0.5MM) and Q1 2026 with pre-tax impacts of ($0.3MM)
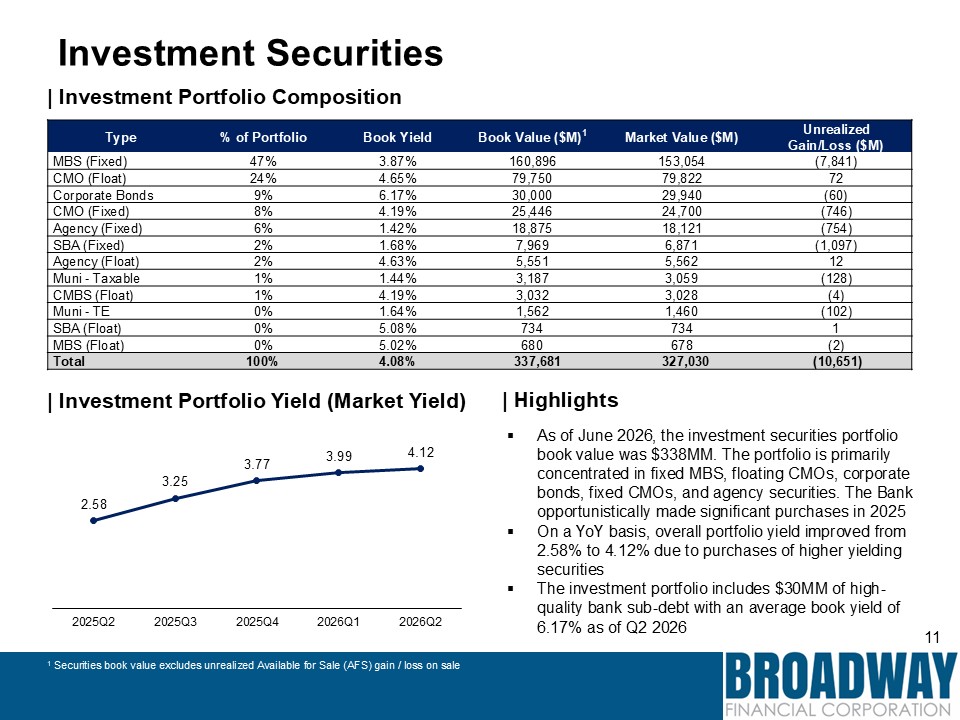
Type % of Portfolio Book Yield Book Value ($M)1 Market Value
($M) Unrealized Gain/Loss ($M) MBS (Fixed) 47% 3.87% 160,896 153,054 (7,841) CMO (Float) 24% 4.65% 79,750 79,822 72 Corporate Bonds 9% 6.17% 30,000 29,940 (60) CMO (Fixed) 8% 4.19% 25,446 24,700 (746) Agency
(Fixed) 6% 1.42% 18,875 18,121 (754) SBA (Fixed) 2% 1.68% 7,969 6,871 (1,097) Agency (Float) 2% 4.63% 5,551 5,562 12 Muni - Taxable 1% 1.44% 3,187 3,059 (128) CMBS (Float) 1% 4.19% 3,032 3,028 (4) Muni -
TE 0% 1.64% 1,562 1,460 (102) SBA (Float) 0% 5.08% 734 734 1 MBS (Float) 0% 5.02% 680 678 (2) Total 100% 4.08% 337,681 327,030 (10,651) Investment Securities | Investment Portfolio Composition | Investment
Portfolio Yield (Market Yield) | Highlights As of June 2026, the investment securities portfolio book value was $338MM. The portfolio is primarily concentrated in fixed MBS, floating CMOs, corporate bonds, fixed CMOs, and agency securities.
The Bank opportunistically made significant purchases in 2025 On a YoY basis, overall portfolio yield improved from 2.58% to 4.12% due to purchases of higher yielding securities The investment portfolio includes $30MM of high-quality bank
sub-debt with an average book yield of 6.17% as of Q2 2026 1 Securities book value excludes unrealized Available for Sale (AFS) gain / loss on sale
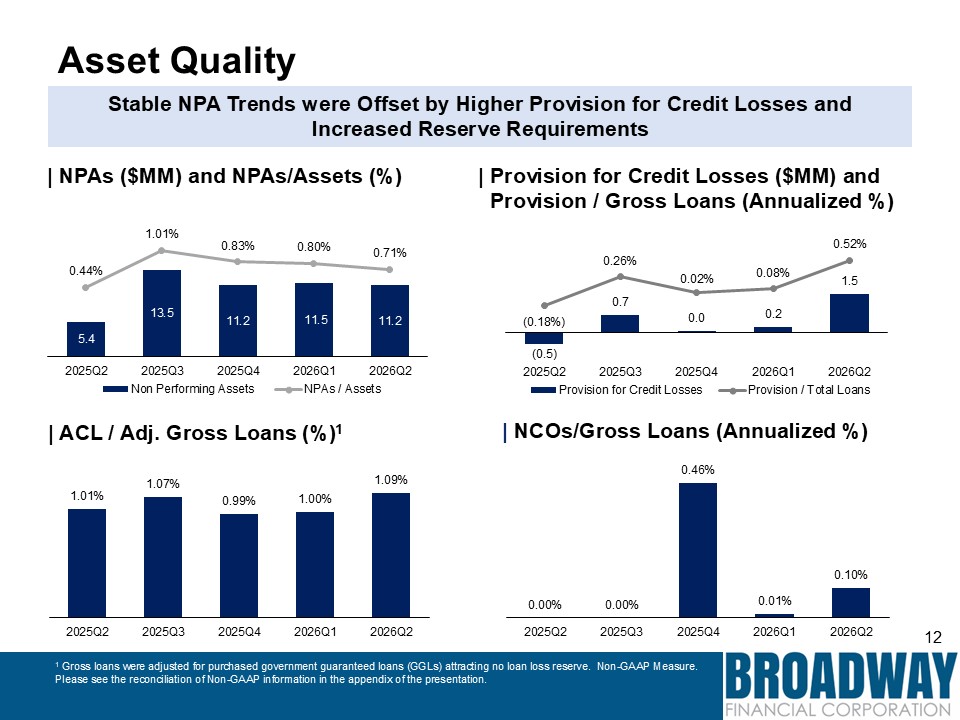
Asset Quality 1 Gross loans were adjusted for purchased government guaranteed
loans (GGLs) attracting no loan loss reserve. Non-GAAP Measure. Please see the reconciliation of Non-GAAP information in the appendix of the presentation. | NPAs ($MM) and NPAs/Assets (%) | Provision for Credit Losses ($MM) and _Provision
/ Gross Loans (Annualized %) | ACL / Adj. Gross Loans (%)1 | NCOs/Gross Loans (Annualized %) Stable NPA Trends were Offset by Higher Provision for Credit Losses and Increased Reserve Requirements
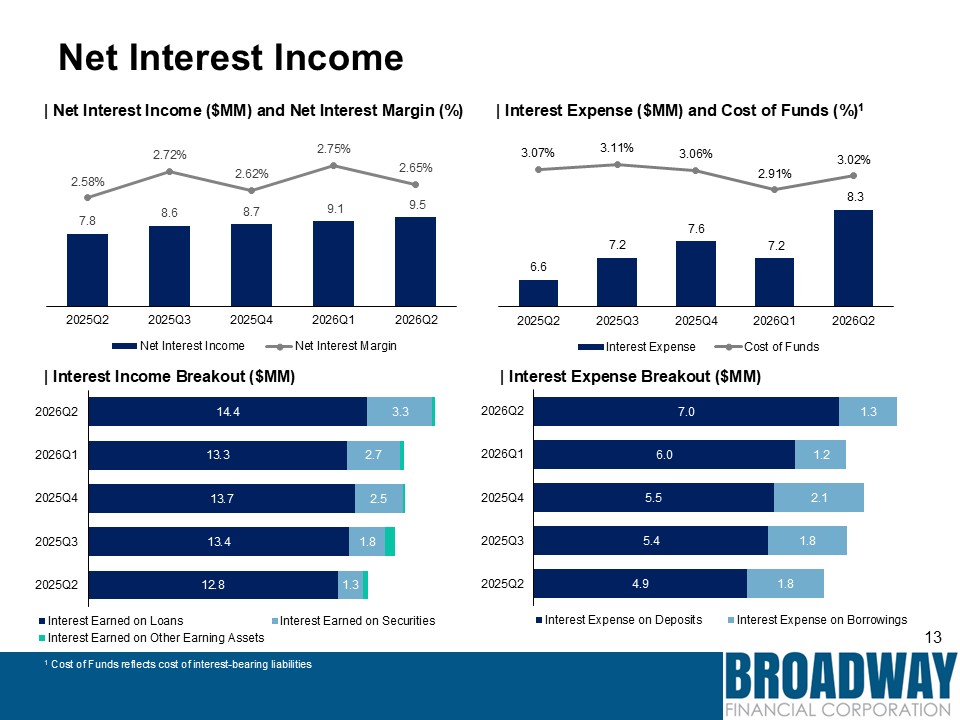
Net Interest Income | Net Interest Income ($MM) and Net Interest Margin (%) |
Interest Expense Breakout ($MM) | Interest Income Breakout ($MM) | Interest Expense ($MM) and Cost of Funds (%)1 1 Cost of Funds reflects cost of interest-bearing liabilities
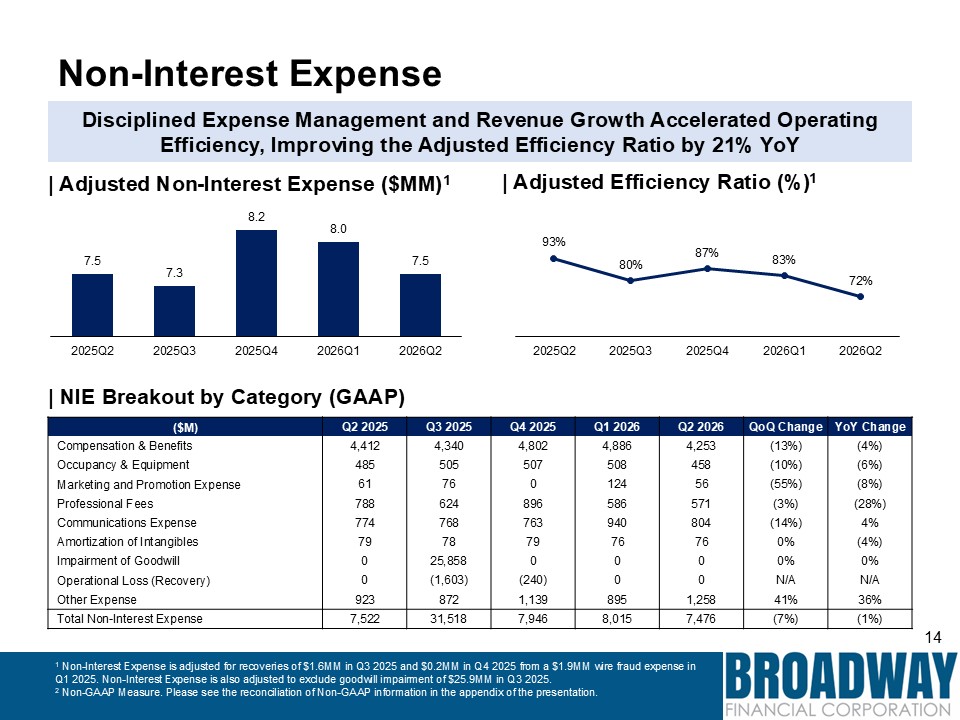
Non-Interest Expense | NIE Breakout by Category (GAAP) 1 Non-Interest Expense
is adjusted for recoveries of $1.6MM in Q3 2025 and $0.2MM in Q4 2025 from a $1.9MM wire fraud expense in Q1 2025. Non-Interest Expense is also adjusted to exclude goodwill impairment of $25.9MM in Q3 2025. 2 Non-GAAP Measure. Please see the
reconciliation of Non-GAAP information in the appendix of the presentation. ($M) Q2 2025 Q3 2025 Q4 2025 Q1 2026 Q2 2026 QoQ Change YoY Change Compensation & Benefits 4,412 4,340 4,802 4,886 4,253 (13%) (4%) Occupancy &
Equipment 485 505 507 508 458 (10%) (6%) Marketing and Promotion Expense 61 76 0 124 56 (55%) (8%) Professional Fees 788 624 896 586 571 (3%) (28%) Communications Expense 774 768 763 940 804 (14%) 4% Amortization
of Intangibles 79 78 79 76 76 0% (4%) Impairment of Goodwill 0 25,858 0 0 0 0% 0% Operational Loss (Recovery) 0 (1,603) (240) 0 0 N/A N/A Other Expense 923 872 1,139 895 1,258 41% 36% Total Non-Interest
Expense 7,522 31,518 7,946 8,015 7,476 (7%) (1%) | Adjusted Non-Interest Expense ($MM)1 | Adjusted Efficiency Ratio (%)1 Disciplined Expense Management and Revenue Growth Accelerated Operating Efficiency, Improving the Adjusted
Efficiency Ratio by 21% YoY
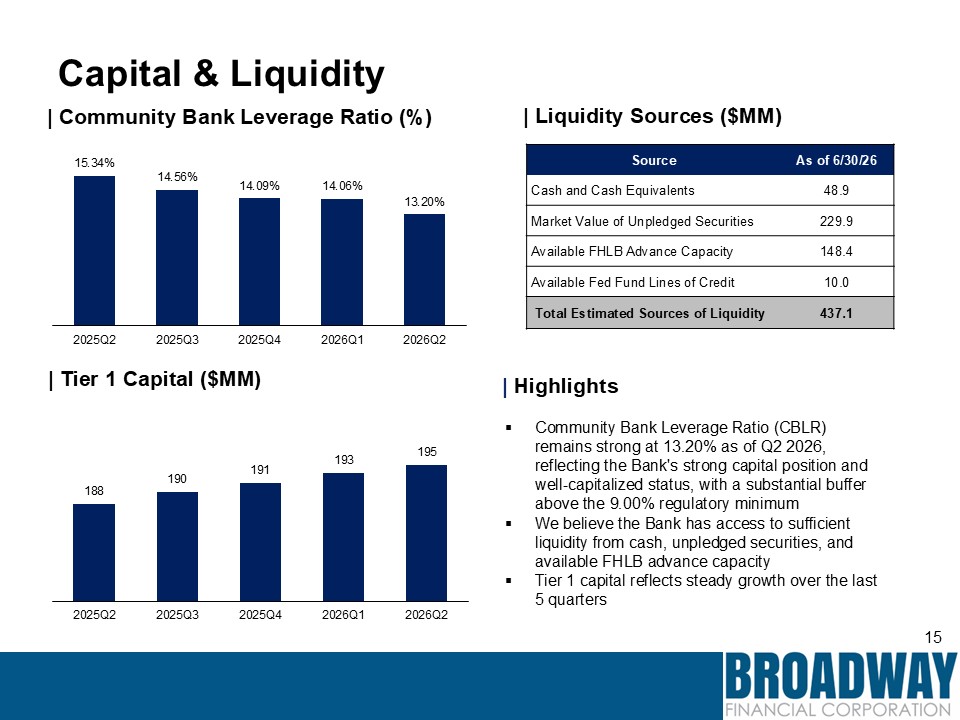
Capital & Liquidity | Community Bank Leverage Ratio (%) | Tier 1 Capital
($MM) | Liquidity Sources ($MM) | Highlights Community Bank Leverage Ratio (CBLR) remains strong at 13.20% as of Q2 2026, reflecting the Bank's strong capital position and well-capitalized status, with a substantial buffer above the 9.00%
regulatory minimum We believe the Bank has access to sufficient liquidity from cash, unpledged securities, and available FHLB advance capacity Tier 1 capital reflects steady growth over the last 5 quarters Source As of 6/30/26 Cash and
Cash Equivalents 48.9 Market Value of Unpledged Securities 229.9 Available FHLB Advance Capacity 148.4 Available Fed Fund Lines of Credit 10.0 Total Estimated Sources of Liquidity 437.1
Appendix
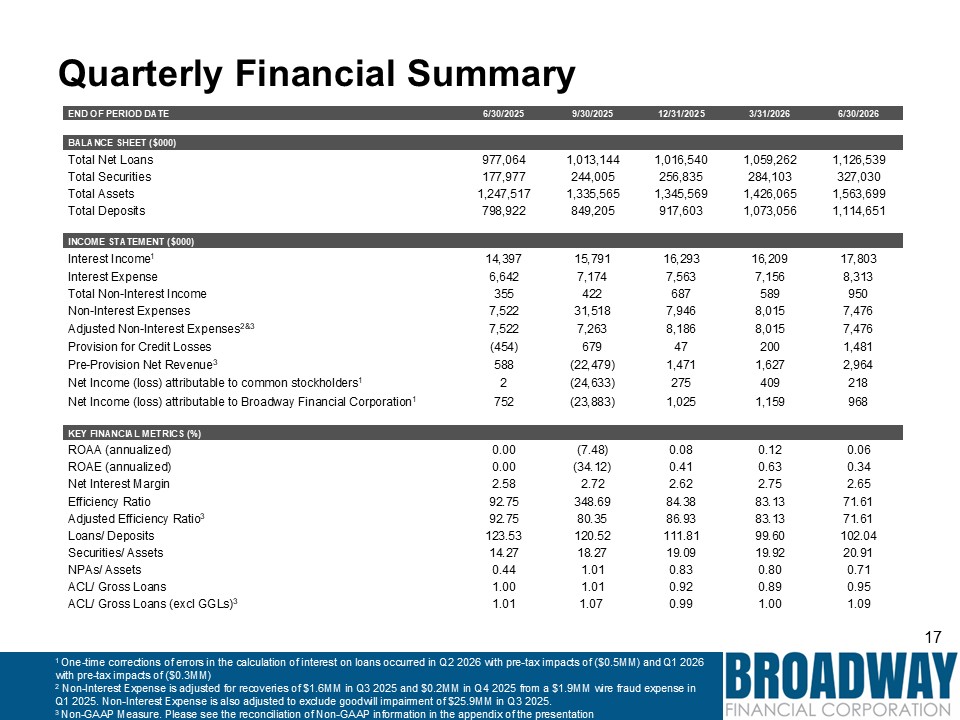
Quarterly Financial Summary 1 One-time corrections of errors in the calculation
of interest on loans occurred in Q2 2026 with pre-tax impacts of ($0.5MM) and Q1 2026 with pre-tax impacts of ($0.3MM) 2 Non-Interest Expense is adjusted for recoveries of $1.6MM in Q3 2025 and $0.2MM in Q4 2025 from a $1.9MM wire fraud
expense in Q1 2025. Non-Interest Expense is also adjusted to exclude goodwill impairment of $25.9MM in Q3 2025. 3 Non-GAAP Measure. Please see the reconciliation of Non-GAAP information in the appendix of the presentation END OF PERIOD
DATE 6/30/2025 9/30/2025 12/31/2025 3/31/2026 6/30/2026 BALANCE SHEET ($000) Total Net Loans 977,064 1,013,144 1,016,540 1,059,262 1,126,539 Total
Securities 177,977 244,005 256,835 284,103 327,030 Total Assets 1,247,517 1,335,565 1,345,569 1,426,065 1,563,699 Total Deposits 798,922 849,205 917,603 1,073,056 1,114,651 INCOME STATEMENT
($000) Interest Income1 14,397 15,791 16,293 16,209 17,803 Interest Expense 6,642 7,174 7,563 7,156 8,313 Total Non-Interest Income 355 422 687 589 950 Non-Interest Expenses 7,522 31,518
7,946 8,015 7,476 Adjusted Non-Interest Expenses2&3 7,522 7,263 8,186 8,015 7,476 Provision for Credit Losses (454) 679 47 200 1,481 Pre-Provision Net Revenue3 588 (22,479) 1,471 1,627 2,964 Net
Income (loss) attributable to common stockholders1 2 (24,633) 275 409 218 Net Income (loss) attributable to Broadway Financial Corporation1 752 (23,883) 1,025 1,159 968 KEY FINANCIAL METRICS
(%) ROAA (annualized) 0.00 (7.48) 0.08 0.12 0.06 ROAE (annualized) 0.00 (34.12) 0.41 0.63 0.34 Net Interest Margin 2.58 2.72 2.62 2.75 2.65 Efficiency Ratio 92.75 348.69 84.38 83.13 71.61
Adjusted Efficiency Ratio3 92.75 80.35 86.93 83.13 71.61 Loans/ Deposits 123.53 120.52 111.81 99.60 102.04 Securities/ Assets 14.27 18.27 19.09 19.92 20.91 NPAs/ Assets 0.44 1.01 0.83 0.80 0.71 ACL/
Gross Loans 1.00 1.01 0.92 0.89 0.95 ACL/ Gross Loans (excl GGLs)3 1.01 1.07 0.99 1.00 1.09
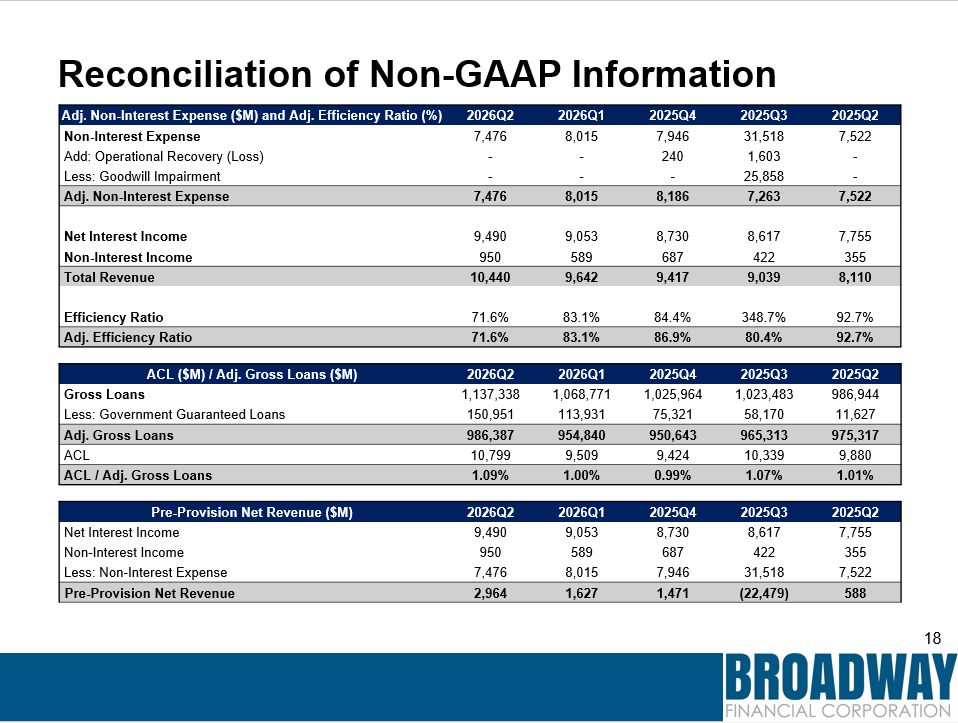
Reconciliation of Non-GAAP Information Adj. Non-Interest Expense ($M) and Adj.
Efficiency Ratio (%) 2026Q2 2026Q1 2025Q4 2025Q3 2025Q2 Non-Interest Expense 7,476 8,015 7,946 31,518 7,522 Add: Operational Recovery (Loss) - - 240 1,603 - Less: Goodwill Impairment - - - 25,858 - Adj.
Non-Interest Expense 7,476 8,015 8,186 7,263 7,522 Net Interest Income 9,490 9,053 8,730 8,617 7,755 Non-Interest Income 950 589 687 422 355 Total Revenue 10,440 9,642 9,417 9,039 8,110
Efficiency Ratio 71.6% 83.1% 84.4% 348.7% 92.7% Adj. Efficiency Ratio 71.6% 83.1% 86.9% 80.4% 92.7% ACL ($M) / Adj. Gross Loans ($M) 2026Q2 2026Q1 2025Q4 2025Q3 2025Q2 Gross Loans 1,137,338 1,068,771 1,025,964
1,023,483 986,944 Less: Government Guaranteed Loans 150,951 113,931 75,321 58,170 11,627 Adj. Gross Loans 986,387 954,840 950,643 965,313 975,317 ACL 10,799 9,509 9,424 10,339 9,880 ACL / Adj. Gross
Loans 1.09% 1.00% 0.99% 1.07% 1.01% Pre-Provision Net Revenue ($M) 2026Q2 2026Q1 2025Q4 2025Q3 2025Q2 Net Interest Income 9,490 9,053 8,730 8,617 7,755 Non-Interest Income 950 589 687 422 355 Less: Non-Interest
Expense 7,476 8,015 7,946 31,518 7,522 Pre-Provision Net Revenue 2,964 1,627 1,471 (22,479) 588