
2026 Second Quarter Investor Presentation
2 Readers should carefully consider these risks alongside those detailed in Item 1A, 'Risk Factors' of our most recent Annual Report on Form 10-K filed with the Securities and Exchange Commission, and in subsequent filings available at www.sec.gov. We undertake no obligation to publicly update or revise any forward-looking statements, whether as a result of new information, future events, or otherwise. Safe Harbor Statement CAUTIONARY NOTE REGARDING FORWARD-LOOKING STATEMENTS The Private Securities Litigation Reform Act of 1995 provides a "safe harbor" for forward- looking statements. This presentation or any other written or oral statements made by or on behalf of the Company may include forward-looking statements, which reflect the Company’s current views with respect to future events and financial performance. All statements, other than statements of historical fact included in or incorporated by reference in this presentation are forward-looking statements. In some cases, these forward-looking statements can be identified by the use of forward-looking words such as "may", "should", "could", "anticipate", "estimate", "expect", "plan", "believe", "predict", "potential", "aim", "will", "target", "continue", "intend" or similar statements of a future or forward-looking nature or their negative or similar terminology. Forward-looking statements made in this presentation, such as those related to our performance, pricing, growth prospects, fee income, the outcome of our strategic initiatives, our expectations relating to our ability to successfully implement and manage technology initiatives – including artificial intelligence, our expectations about the current trade and geopolitical environment on our business, economic and market conditions, and other statements that are not historical facts, reflect our current views with respect to future events and financial performance and are made pursuant to the safe harbor provisions of the Private Securities Litigation Reform Act of 1995. Such statements involve risks and uncertainties that could cause actual results to differ materially, including without limitation: Insurance Risk: the cyclical nature of insurance and reinsurance business leading to periods with excess underwriting capacity and unfavorable premium rates; the frequency and severity of natural and man-made disasters; the effects of emerging claims, systemic risks, and coverage and regulatory issues; reserve adequacy; losses relating to geopolitical conflicts; the adverse impact of economic and social inflation; failure of our loss limitation methods; failure of our cedants to adequately evaluate risk; and our reliance on industry models. Strategic Risk: industry competition and consolidation; failure to keep the pace or manage technology developments, including artificial intelligence; general economic, capital, and credit market conditions, including market illiquidity, fluctuations in interest rates, credit spreads, equity securities' prices, foreign currency exchange rates, and evolving impacts of tariffs, sanctions, and international trade tensions; our ability to increase the use of data and analytics, and technology as part of our business strategy and adapt to new technologies; changes in the political environment of certain countries where we operate or underwrite business; loss of business provided to us by major brokers; rating agency actions; key personnel changes; potential strategic opportunities including acquisitions and our ability to achieve them; evolving expectations regarding environmental, social, and governance matters; and the effect of contagious diseases on our business. Credit and Market Risk: reinsurance availability and recoverability; premium collection risks; and counterparty defaults in our program business. Liquidity Risk: the inability to access sufficient cash to meet our obligations when they are due. Operational Risk: technology and cybersecurity challenges; failures in internal or outsourced operational processes, people, or systems; and changes in accounting policies or practices. Regulatory Risk: changes in laws and regulations and potential government intervention in our industry; and inadvertent non-compliance with sanctions, anti-corruption, data protection and privacy requirements. Taxation Risk: changes in tax laws.
3 AXIS Aspiration A leading Specialty Underwriter, generating consistent top-quartile diluted book value per common share (“DBVPS”) growth for shareholders
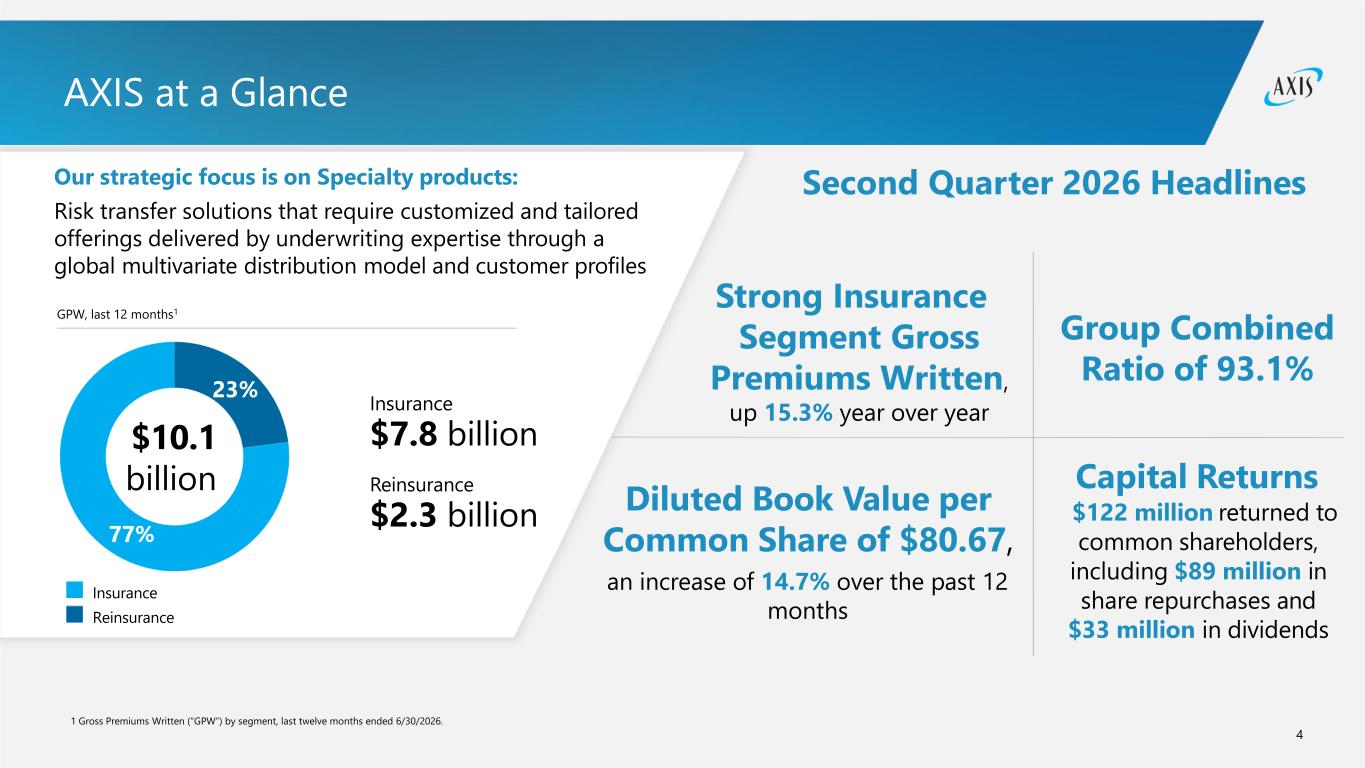
4 AXIS at a Glance Our strategic focus is on Specialty products: Risk transfer solutions that require customized and tailored offerings delivered by underwriting expertise through a global multivariate distribution model and customer profiles Insurance Reinsurance Insurance $7.8 billion Reinsurance $2.3 billion Strong Insurance Segment Gross Premiums Written, up 15.3% year over year Diluted Book Value per Common Share of $80.67, an increase of 14.7% over the past 12 months Second Quarter 2026 Headlines $10.1 billion Group Combined Ratio of 93.1% Capital Returns $122 million returned to common shareholders, including $89 million in share repurchases and $33 million in dividends 1 Gross Premiums Written (“GPW”) by segment, last twelve months ended 6/30/2026. GPW, last 12 months1
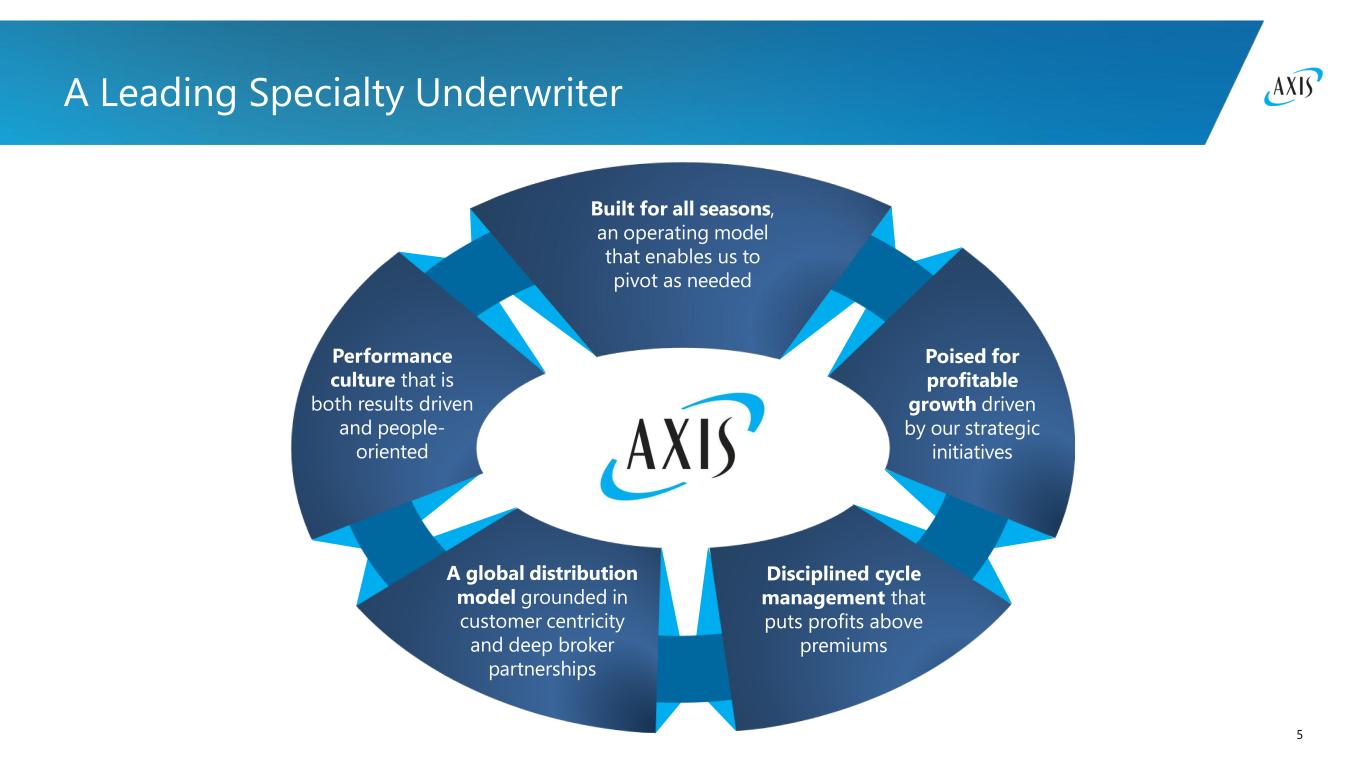
5 A Leading Specialty Underwriter Performance culture that is both results driven and people- oriented Built for all seasons, an operating model that enables us to pivot as needed Poised for profitable growth driven by our strategic initiatives Disciplined cycle management that puts profits above premiums A global distribution model grounded in customer centricity and deep broker partnerships
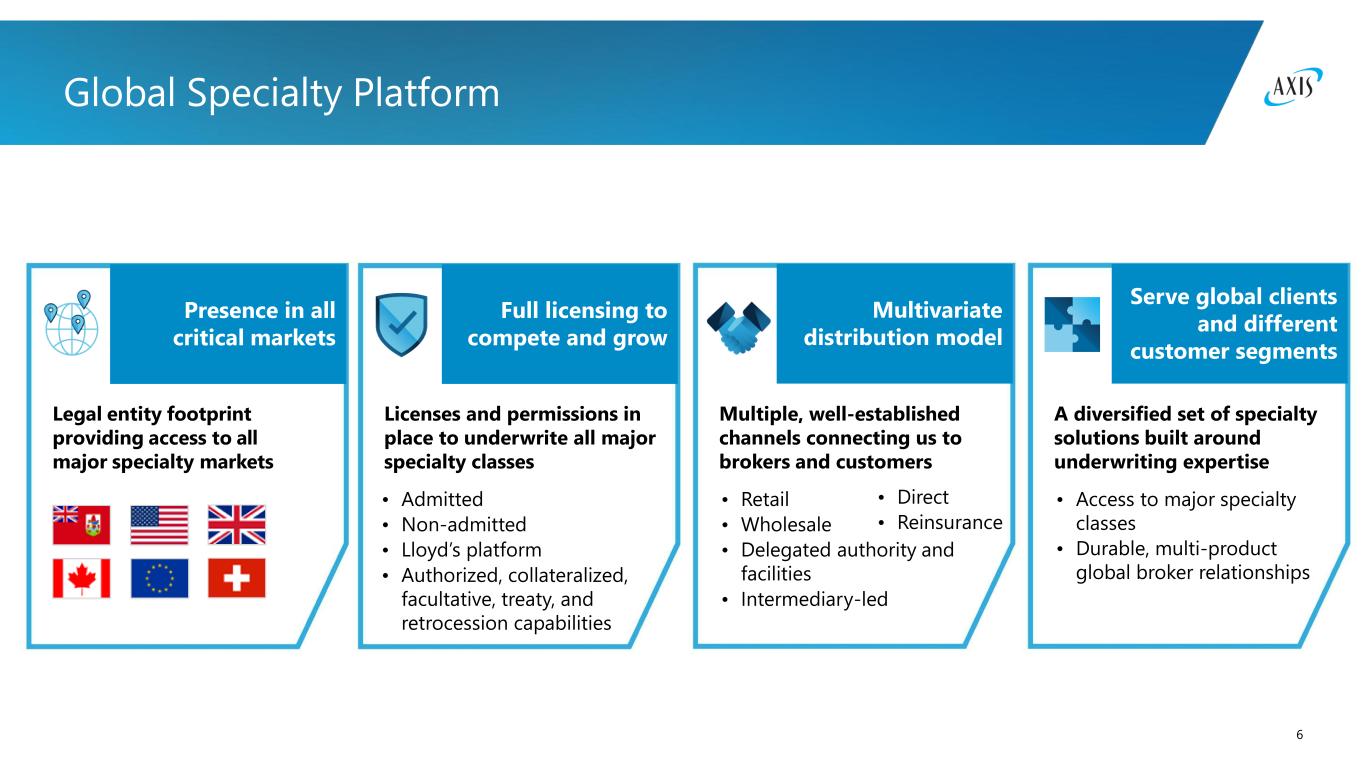
Global Specialty Platform 6 Presence in all critical markets Legal entity footprint providing access to all major specialty markets Full licensing to compete and grow Licenses and permissions in place to underwrite all major specialty classes Multivariate distribution model Multiple, well-established channels connecting us to brokers and customers Serve global clients and different customer segments A diversified set of specialty solutions built around underwriting expertise • Admitted • Non-admitted • Lloyd’s platform • Authorized, collateralized, facultative, treaty, and retrocession capabilities • Retail • Wholesale • Delegated authority and facilities • Intermediary-led • Access to major specialty classes • Durable, multi-product global broker relationships • Direct • Reinsurance
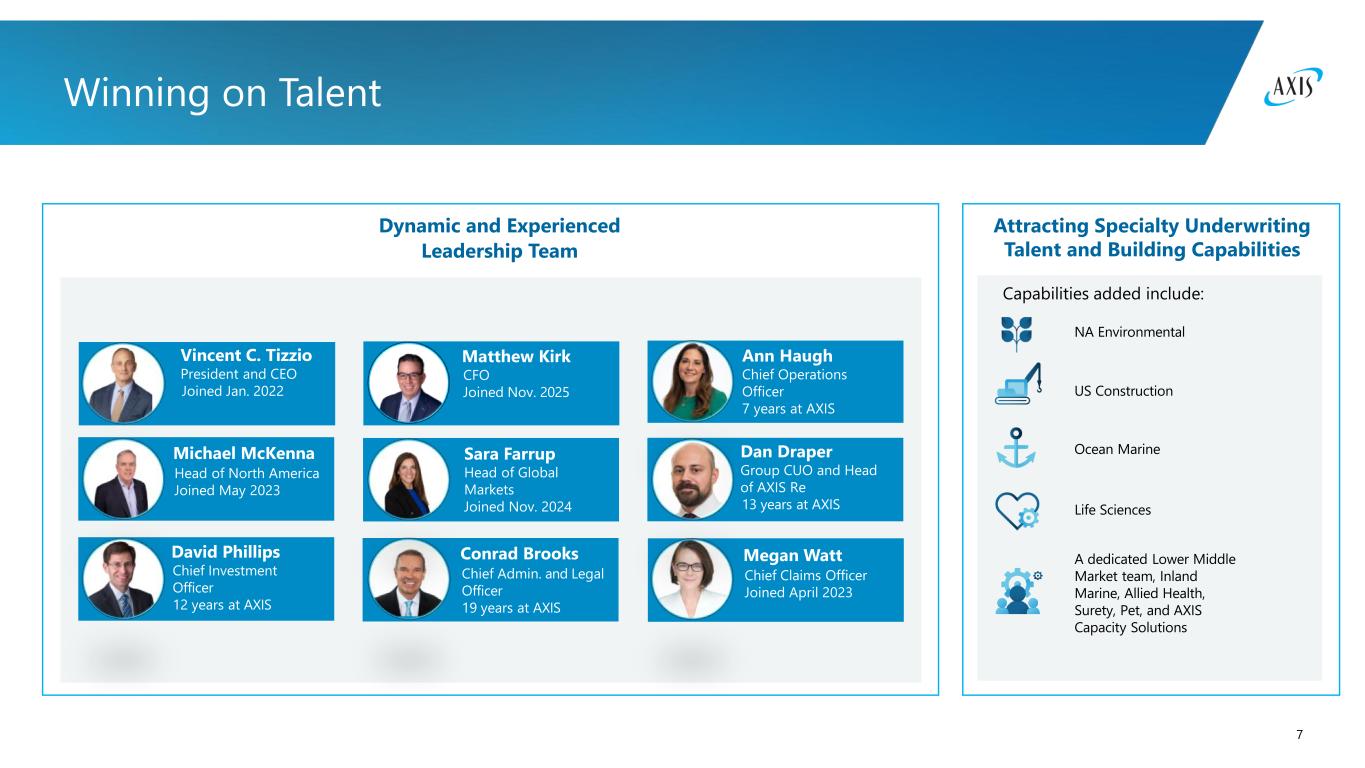
Sara Farrup Head of Global Markets Joined Nov. 2024 Winning on Talent 7 Capabilities added include: Dynamic and Experienced Leadership Team Attracting Specialty Underwriting Talent and Building Capabilities NA Environmental US Construction Ocean Marine Life Sciences Michael McKenna Head of North America Joined May 2023 David Phillips Chief Investment Officer 12 years at AXIS Ann Haugh Chief Operations Officer 7 years at AXIS Matthew Kirk CFO Joined Nov. 2025 Dan Draper Group CUO and Head of AXIS Re 13 years at AXIS Megan Watt Chief Claims Officer Joined April 2023 Vincent C. Tizzio President and CEO Joined Jan. 2022 Conrad Brooks Chief Admin. and Legal Officer 19 years at AXIS A dedicated Lower Middle Market team, Inland Marine, Allied Health, Surety, Pet, and AXIS Capacity Solutions
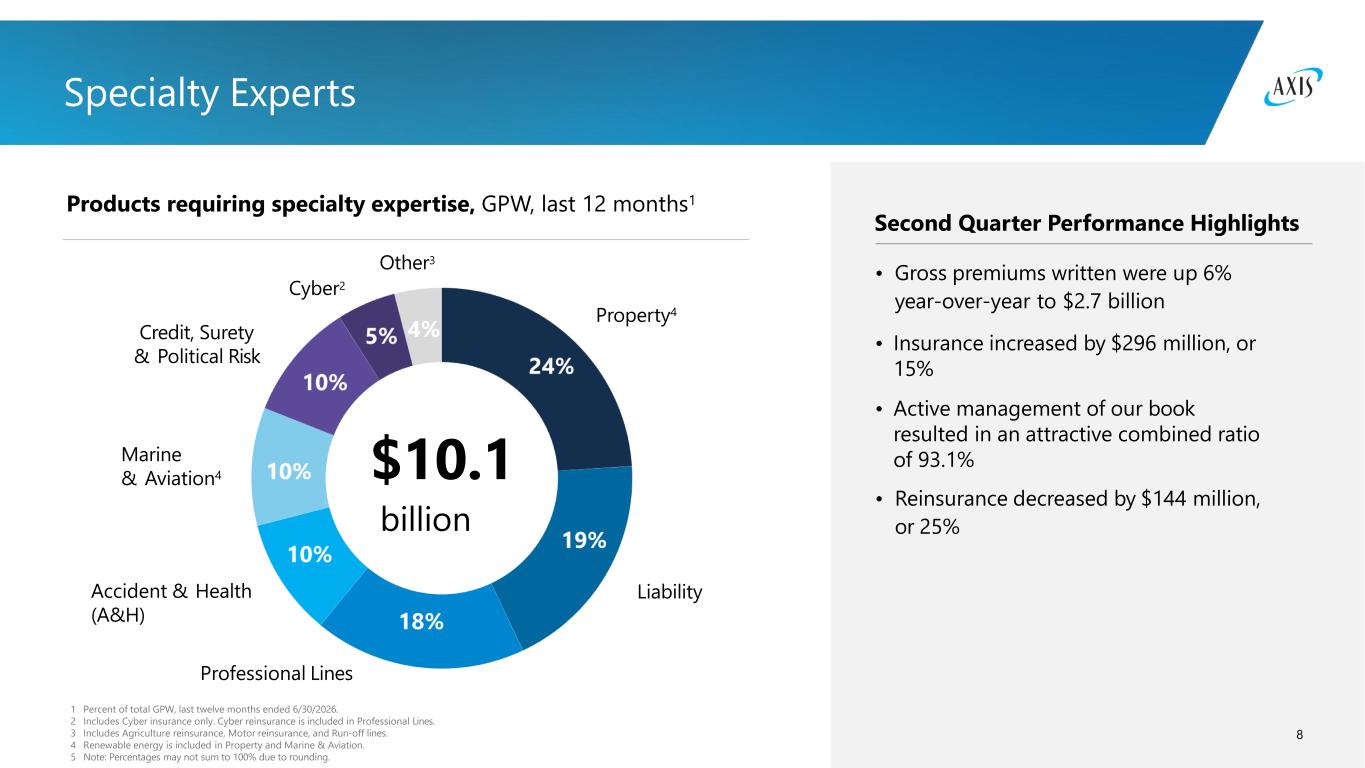
8 Specialty Experts Products requiring specialty expertise, GPW, last 12 months1 Second Quarter Performance Highlights Property4 Cyber2 Liability Marine & Aviation4 Accident & Health (A&H) Other3 Credit, Surety & Political Risk $10.1 billion Professional Lines 1 Percent of total GPW, last twelve months ended 6/30/2026. 2 Includes Cyber insurance only. Cyber reinsurance is included in Professional Lines. 3 Includes Agriculture reinsurance, Motor reinsurance, and Run-off lines. 4 Renewable energy is included in Property and Marine & Aviation. 5 Note: Percentages may not sum to 100% due to rounding. • Gross premiums written were up 6% year-over-year to $2.7 billion • Insurance increased by $296 million, or 15% • Active management of our book resulted in an attractive combined ratio of 93.1% • Reinsurance decreased by $144 million, or 25%
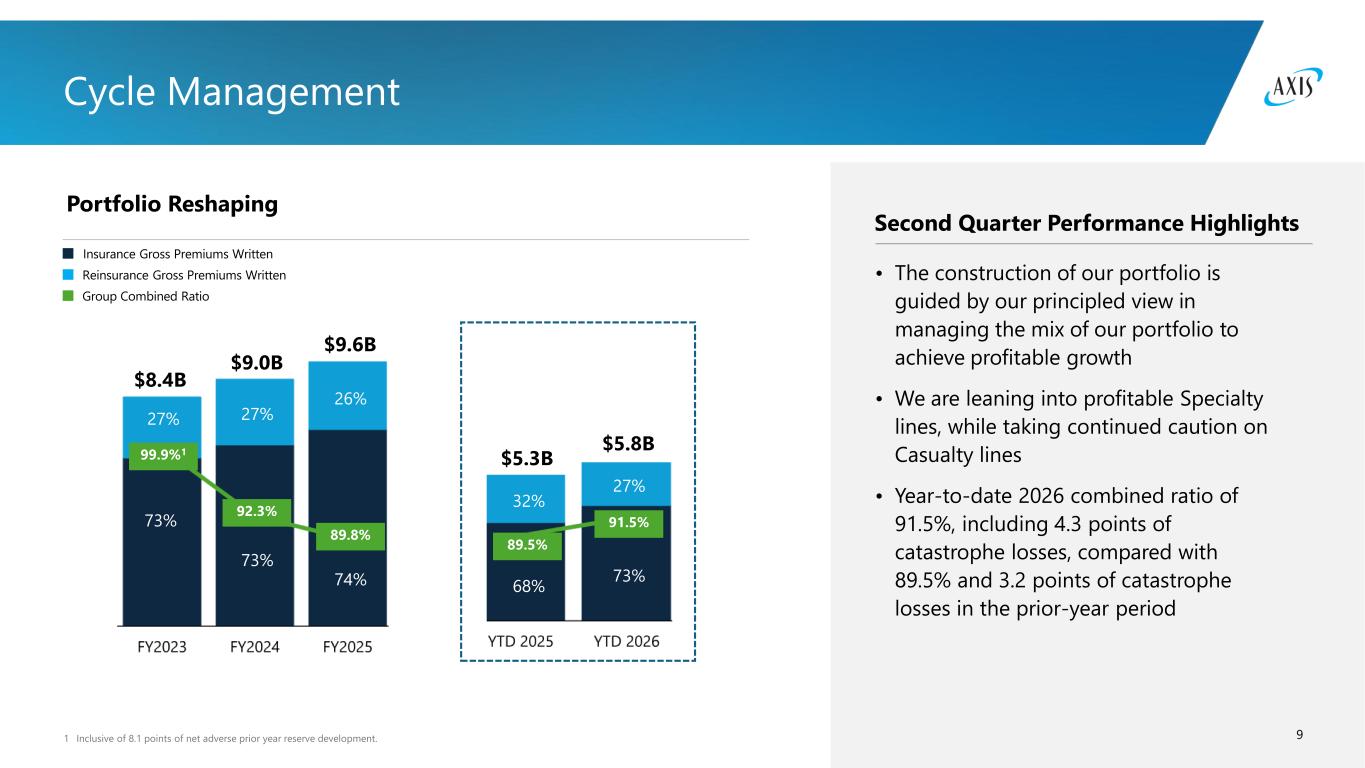
1 Inclusive of 8.1 points of net adverse prior year reserve development. Cycle Management 9 Second Quarter Performance Highlights • The construction of our portfolio is guided by our principled view in managing the mix of our portfolio to achieve profitable growth • We are leaning into profitable Specialty lines, while taking continued caution on Casualty lines • Year-to-date 2026 combined ratio of 91.5%, including 4.3 points of catastrophe losses, compared with 89.5% and 3.2 points of catastrophe losses in the prior-year period Insurance Gross Premiums Written Reinsurance Gross Premiums Written Group Combined Ratio Portfolio Reshaping $8.4B $9.0B $9.6B $5.3B $5.8B 27% 27% 26% 32% 27% 73% 73% 74% 68% 73% 99.9%1 92.3% 89.8% 89.5% 91.5%
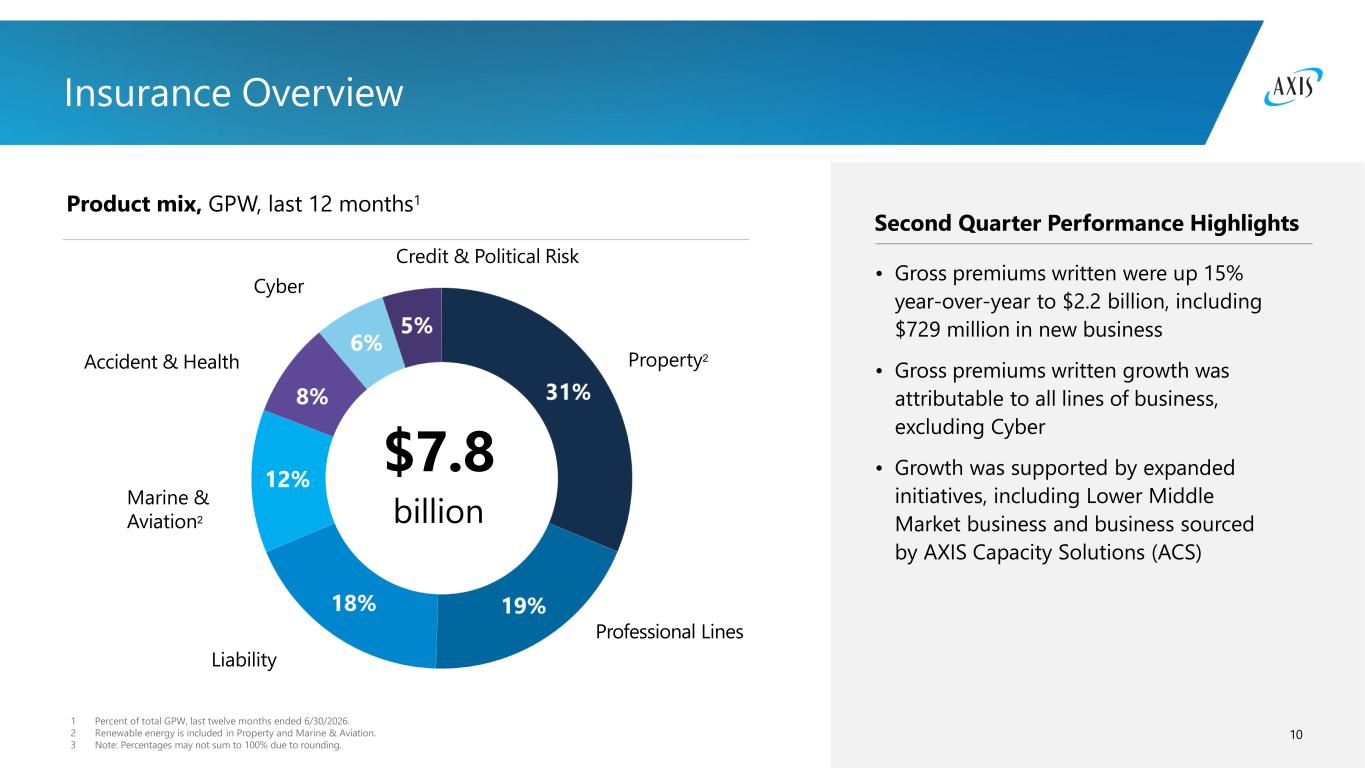
1 Percent of total GPW, last twelve months ended 6/30/2026. 2 Renewable energy is included in Property and Marine & Aviation. 3 Note: Percentages may not sum to 100% due to rounding. 10 Insurance Overview • Gross premiums written were up 15% year-over-year to $2.2 billion, including $729 million in new business • Gross premiums written growth was attributable to all lines of business, excluding Cyber • Growth was supported by expanded initiatives, including Lower Middle Market business and business sourced by AXIS Capacity Solutions (ACS) Product mix, GPW, last 12 months1 Property2 Cyber Liability Marine & Aviation2 Accident & Health $7.8 billion Credit & Political Risk Second Quarter Performance Highlights Professional Lines
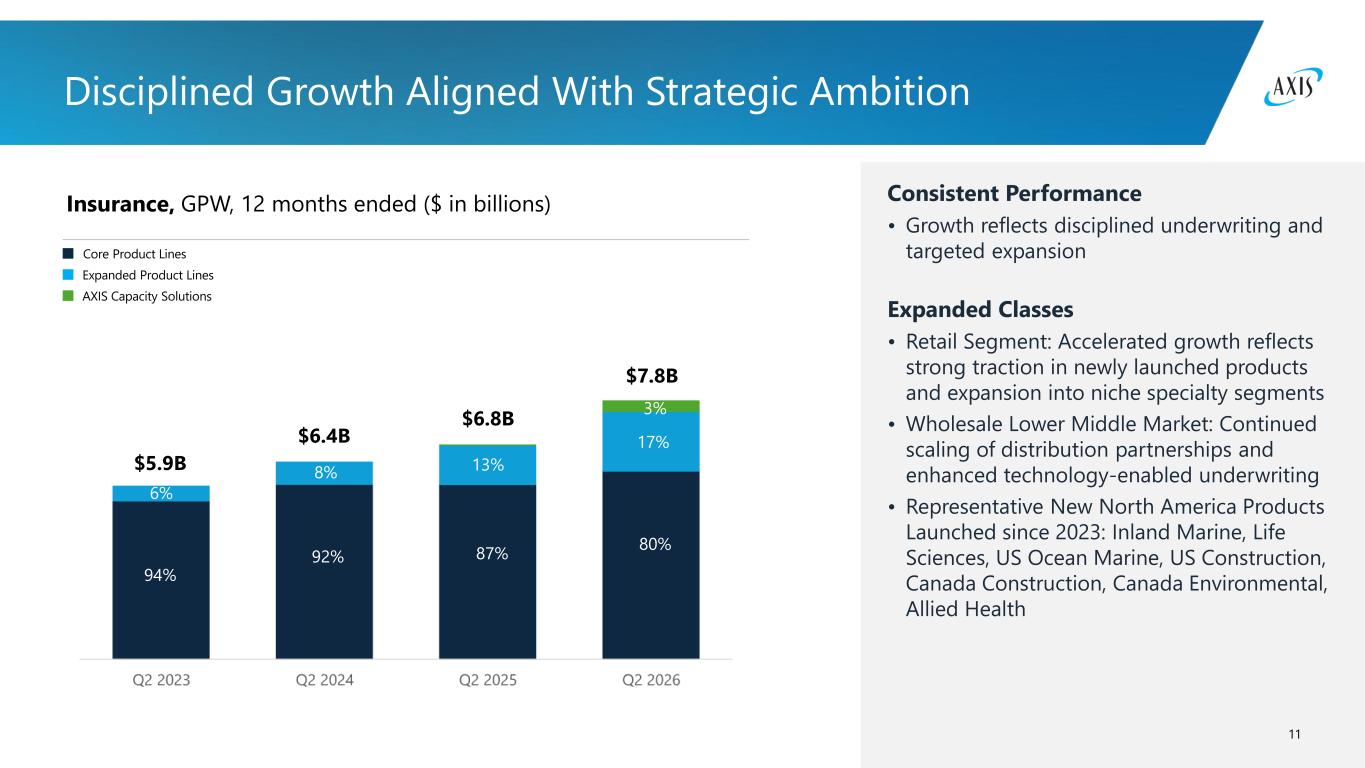
10 Disciplined Growth Aligned With Strategic Ambition Insurance, GPW, 12 months ended ($ in billions) Core Product Lines Expanded Product Lines AXIS Capacity Solutions $5.9B $6.4B $7.8B $6.8B Consistent Performance • Growth reflects disciplined underwriting and targeted expansion Expanded Classes • Retail Segment: Accelerated growth reflects strong traction in newly launched products and expansion into niche specialty segments • Wholesale Lower Middle Market: Continued scaling of distribution partnerships and enhanced technology-enabled underwriting • Representative New North America Products Launched since 2023: Inland Marine, Life Sciences, US Ocean Marine, US Construction, Canada Construction, Canada Environmental, Allied Health 94% 92% 87% 80% 6% 8% 13% 17% 3% 1
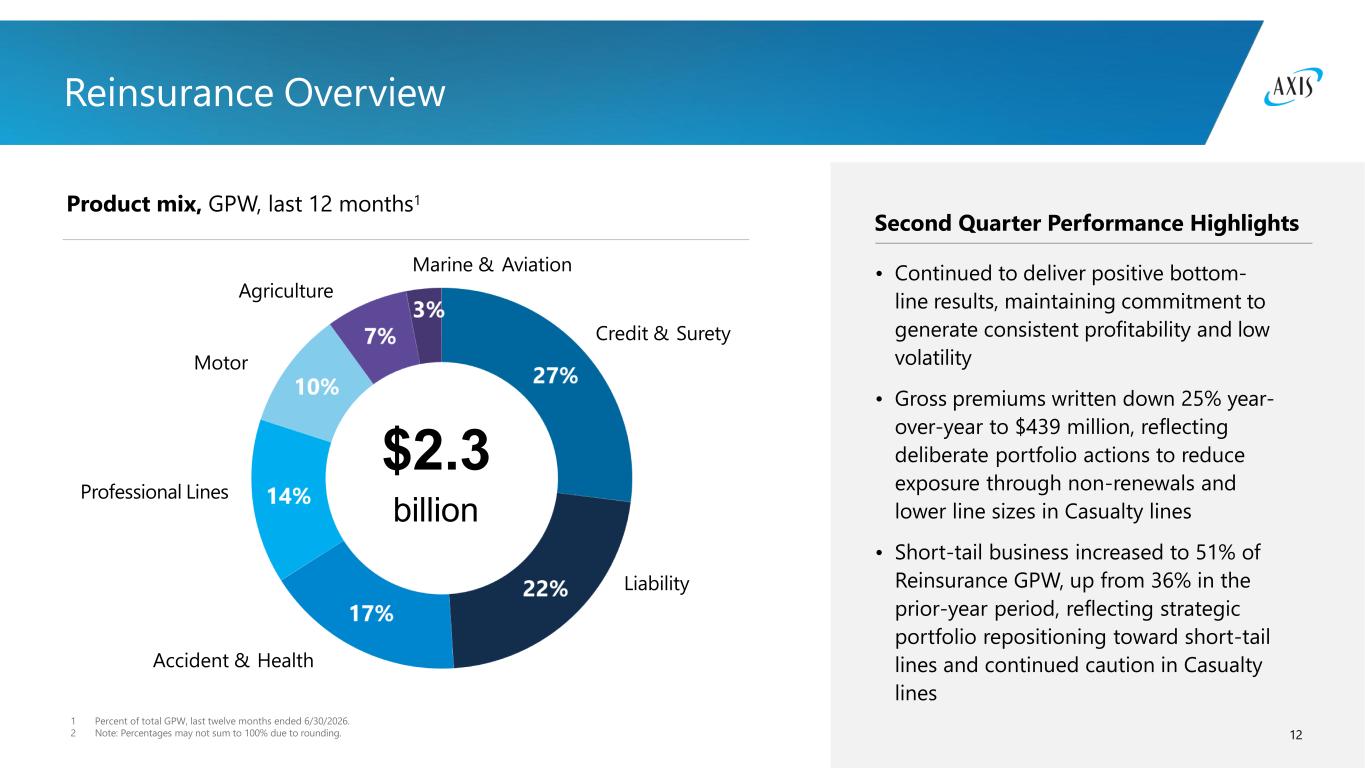
1 Percent of total GPW, last twelve months ended 6/30/2026. 2 Note: Percentages may not sum to 100% due to rounding. 11 Reinsurance Overview Product mix, GPW, last 12 months1 Marine & Aviation 27% 21% Credit & Surety Motor 17% Liability 15% 11% 7% Agriculture $2.3 billion Accident & Health • Continued to deliver positive bottom- line results, maintaining commitment to generate consistent profitability and low volatility • Gross premiums written down 25% year- over-year to $439 million, reflecting deliberate portfolio actions to reduce exposure through non-renewals and lower line sizes in Casualty lines • Short-tail business increased to 51% of Reinsurance GPW, up from 36% in the prior-year period, reflecting strategic portfolio repositioning toward short-tail lines and continued caution in Casualty lines Second Quarter Performance Highlights 2 Professional Lines
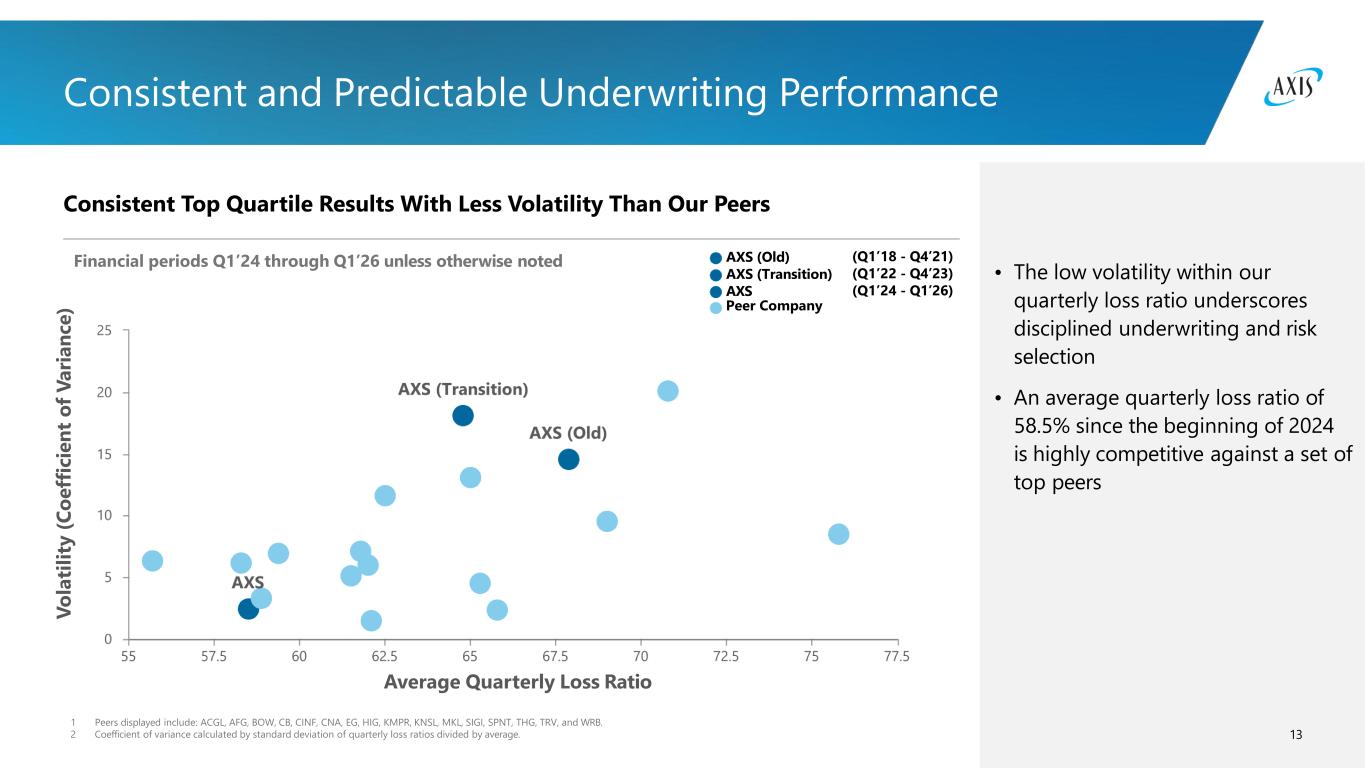
13 V o la ti li ty (C o e ff ic ie n t o f V a ri a n c e ) Average Quarterly Loss Ratio 1 Peers displayed include: ACGL, AFG, BOW, CB, CINF, CNA, EG, HIG, KMPR, KNSL, MKL, SIGI, SPNT, THG, TRV, and WRB. 2 Coefficient of variance calculated by standard deviation of quarterly loss ratios divided by average. • The low volatility within our quarterly loss ratio underscores disciplined underwriting and risk selection • An average quarterly loss ratio of 58.5% since the beginning of 2024 is highly competitive against a set of top peers Financial periods Q1’24 through Q1’26 unless otherwise noted AXS (Old) AXS (Transition) AXS (Q1’18 - Q4’21) (Q1’22 - Q4’23) (Q1’24 - Q1’26) Peer Company Consistent Top Quartile Results With Less Volatility Than Our Peers Consistent and Predictable Underwriting Performance
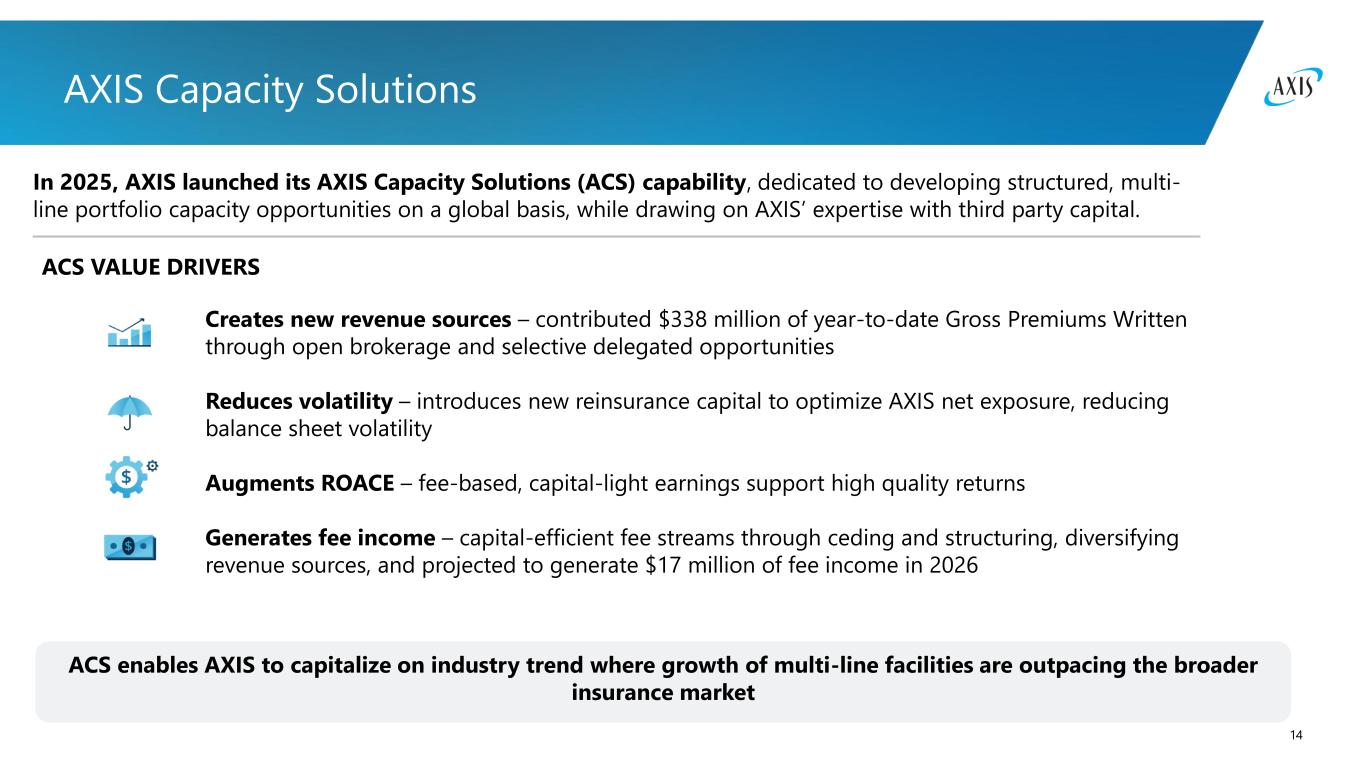
14 AXIS Capacity Solutions In 2025, AXIS launched its AXIS Capacity Solutions (ACS) capability, dedicated to developing structured, multi- line portfolio capacity opportunities on a global basis, while drawing on AXIS’ expertise with third party capital. ACS VALUE DRIVERS Creates new revenue sources – contributed $338 million of year-to-date Gross Premiums Written through open brokerage and selective delegated opportunities Reduces volatility – introduces new reinsurance capital to optimize AXIS net exposure, reducing balance sheet volatility Augments ROACE – fee-based, capital-light earnings support high quality returns Generates fee income – capital-efficient fee streams through ceding and structuring, diversifying revenue sources, and projected to generate $17 million of fee income in 2026 ACS enables AXIS to capitalize on industry trend where growth of multi-line facilities are outpacing the broader insurance market
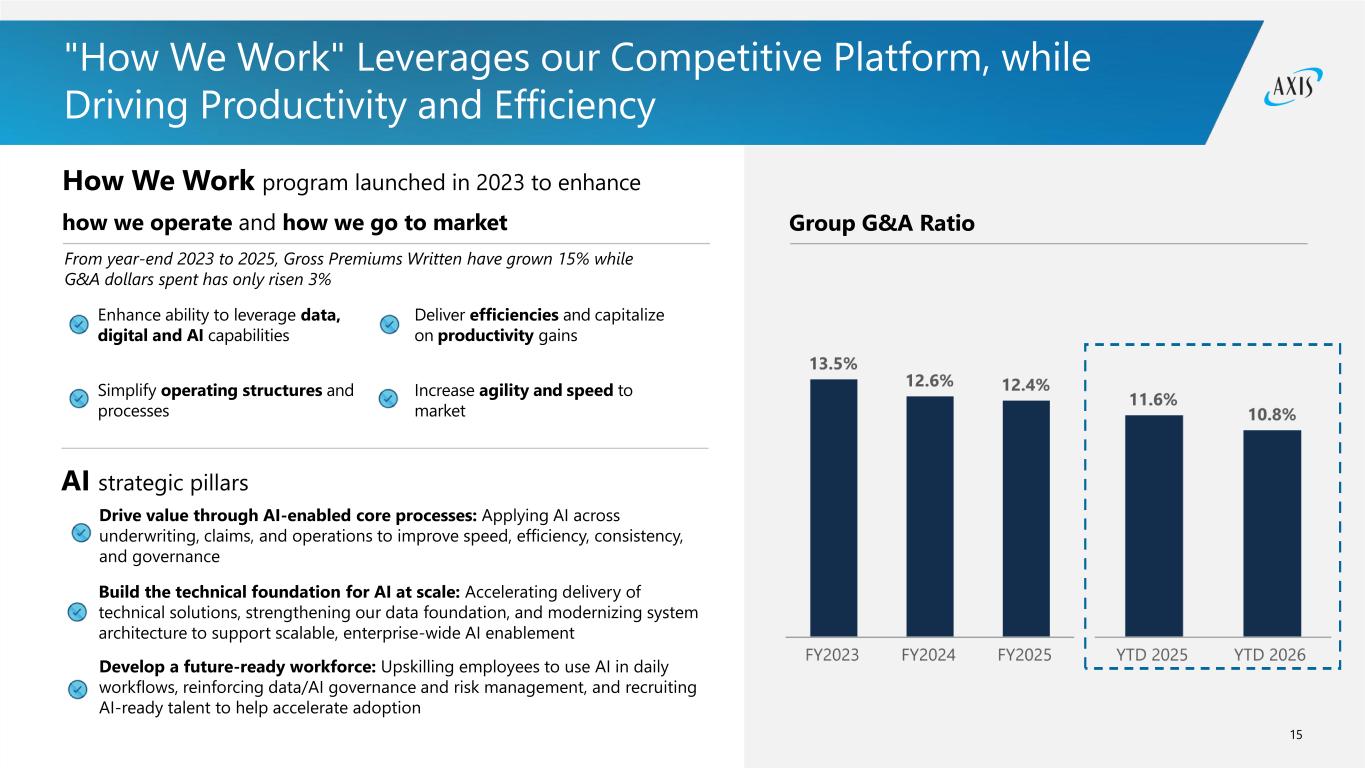
15 "How We Work" Leverages our Competitive Platform, while Driving Productivity and Efficiency How We Work program launched in 2023 to enhance how we operate and how we go to market Simplify operating structures and processes Increase agility and speed to market Deliver efficiencies and capitalize on productivity gains Enhance ability to leverage data, digital and AI capabilities Group G&A Ratio From year-end 2023 to 2025, Gross Premiums Written have grown 15% while G&A dollars spent has only risen 3% AI strategic pillars Drive value through AI-enabled core processes: Applying AI across underwriting, claims, and operations to improve speed, efficiency, consistency, and governance Build the technical foundation for AI at scale: Accelerating delivery of technical solutions, strengthening our data foundation, and modernizing system architecture to support scalable, enterprise-wide AI enablement Develop a future-ready workforce: Upskilling employees to use AI in daily workflows, reinforcing data/AI governance and risk management, and recruiting AI-ready talent to help accelerate adoption
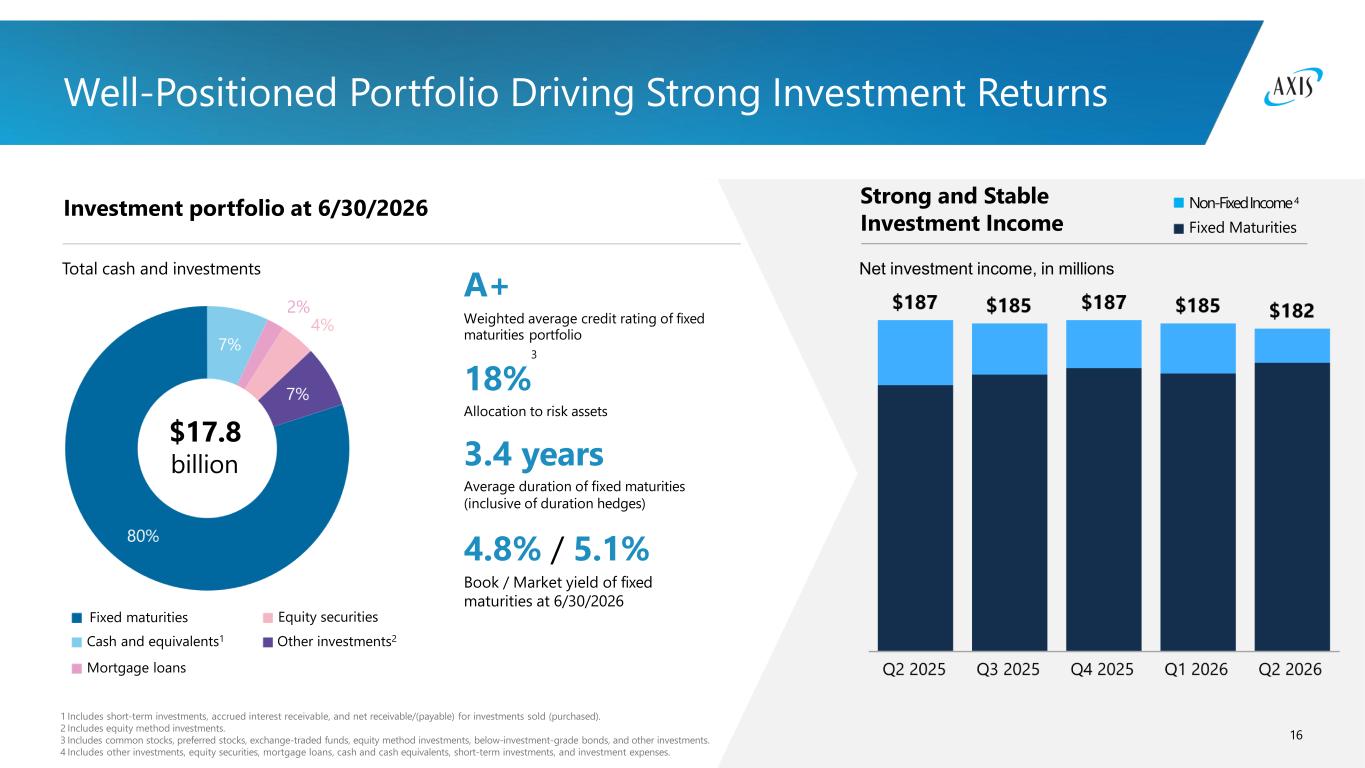
16 A+ Weighted average credit rating of fixed 1 Includes short-term investments, accrued interest receivable, and net receivable/(payable) for investments sold (purchased). 2 Includes equity method investments. 3 Includes common stocks, preferred stocks, exchange-traded funds, equity method investments, below-investment-grade bonds, and other investments. 4 Includes other investments, equity securities, mortgage loans, cash and cash equivalents, short-term investments, and investment expenses. Well-Positioned Portfolio Driving Strong Investment Returns Investment portfolio at 6/30/2026 Strong and Stable Investment Income Total cash and investments Net investment income, in millions Non-Fixed Income 4 Fixed Maturities maturities portfolio 18% Allocation to risk assets 3.4 years Average duration of fixed maturities (inclusive of duration hedges) 4.8% / 5.1% Book / Market yield of fixed maturities at 6/30/2026 $17.8 billion Mortgage loans Cash and equivalents1 Fixed maturities Equity securities Other investments2 3
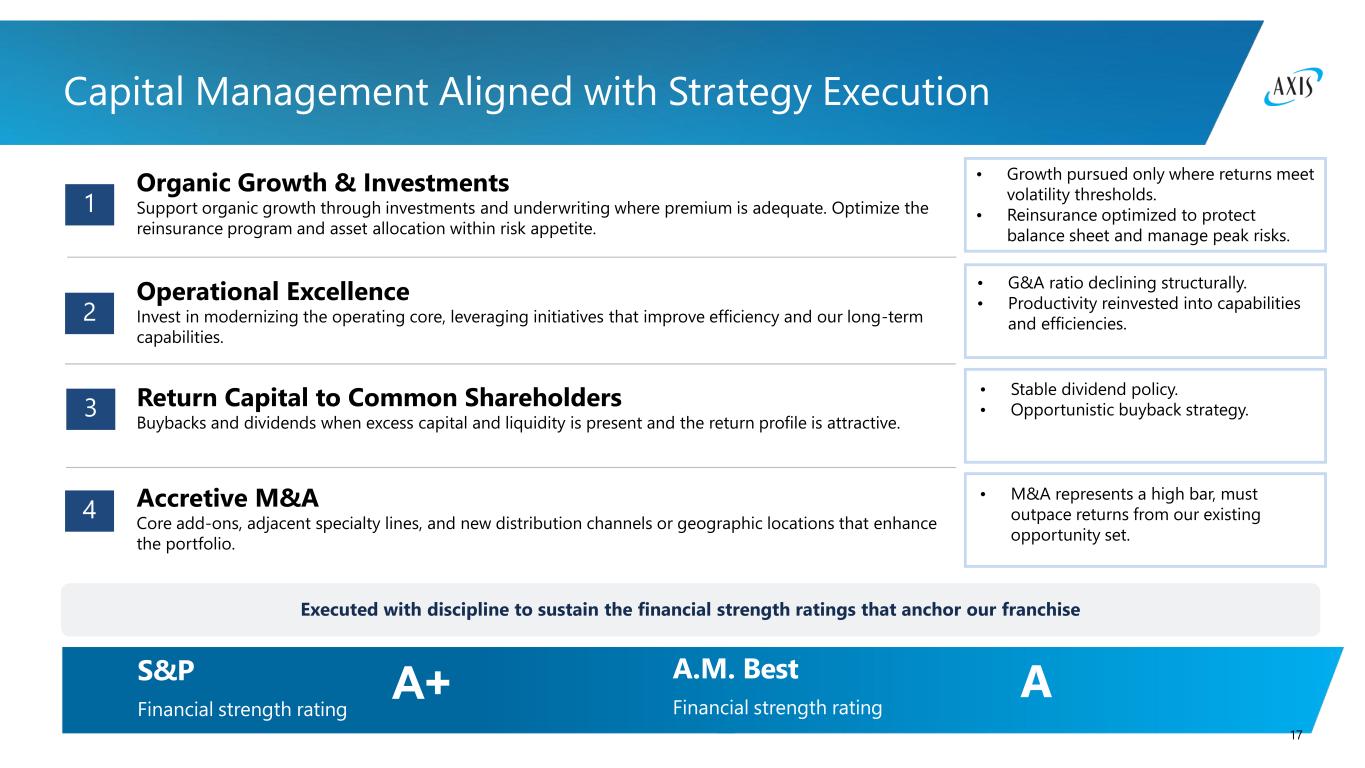
A.M. Best Financial strength rating AS&P Financial strength rating A+ Capital Management Aligned with Strategy Execution 1 2 3 4 Organic Growth & Investments Support organic growth through investments and underwriting where premium is adequate. Optimize the reinsurance program and asset allocation within risk appetite. Operational Excellence Invest in modernizing the operating core, leveraging initiatives that improve efficiency and our long-term capabilities. Return Capital to Common Shareholders Buybacks and dividends when excess capital and liquidity is present and the return profile is attractive. Accretive M&A Core add-ons, adjacent specialty lines, and new distribution channels or geographic locations that enhance the portfolio. • Growth pursued only where returns meet volatility thresholds. • Reinsurance optimized to protect balance sheet and manage peak risks. • G&A ratio declining structurally. • Productivity reinvested into capabilities and efficiencies. • Stable dividend policy. • Opportunistic buyback strategy. • M&A represents a high bar, must outpace returns from our existing opportunity set. Executed with discipline to sustain the financial strength ratings that anchor our franchise 17