| Year | Summary Compensation Table Total for PEO($)(1)(2) | Compensation Actually Paid to PEO ($)(1)(2) | Average Summary Compensation Table Total for Non-PEO Named Executive Officers ($)(1)(3) | Average Compensation Actually Paid to Non-PEO Named Executive Officers ($)(1)(4) | Value of Initial Fixed $100 Investment Based on Total Shareholder Return ($)(5) | Net Loss (in thousands) ($)(6) |
| 2026 | 741,116 | 641,728 | 411,157 | 324,913 | $10.91 | 3,175 |
| 2025 | 597,075 | 553,871 | 444,948 | 406,176 | $11.22 | 3,457 |
| 2024 | 726,543 | 697,361 | 483,063 | 468,238 | $17.03 | 4,835 |
| (1) | During fiscal years 2026, 2025 and 2024 the principal executive officer, or PEO, was Amy Trombly, and our non-PEO NEOs were Mr. Dvonch and Mr. Thornton. Mr. Thorton, our former Executive Vice President and Chief Operating Officer, was terminated on October 18, 2025. |
| (5) | The amounts reported represent the measurement period value of an investment of $100 in our stock on March 31, 2023 (the last trading day before the 2023 fiscal year), and then valued again on each of March 31, 2024 (the last trading day of the 2024 fiscal year), March 28, 2025 (the last trading day of the 2025 fiscal year), and March 31, 2026 (the last trading day of the 2026 fiscal year) based on the closing price per share of the Company’s common stock as of such dates and assuming the reinvestment of dividends. |
| (6) | The amounts reported represent net loss for the applicable fiscal year calculated in accordance with generally accepted accounting principles in the United States. |
| (7) | Net Loss: The dollar amounts reported represent the amount of net loss reflected in the Company’s audited financial statements for the applicable year. |
* The valuation assumptions for stock option awards included in Compensation Actually Paid are: (i) the expected life of each stock option, which is determined using the “simplified method” and which takes into account the average of the remaining vesting period and remaining term as of the vest or fiscal year end date; (ii) the exercise price and the asset price, which are based on the closing price of our Common Stock traded on the Nasdaq on the vest and fiscal year end date, respectively; (iii) the risk-free rate, which is based on the Treasury Constant Maturity rate closest to the remaining expected life as of the vest or fiscal year end date; (iv) historical volatility, which is based on the daily price history for our Common stock for each expected life period prior to each vest or fiscal year end date; and (v) the annual dividend yield, which was zero.
| (2) | The dollar amounts reported are the amounts of total compensation reported for Ms. Trombly and the average total compensation reported for Non-PEO Named Executive Officers for the applicable fiscal year in the “Total” column of the Summary Compensation Table (SCT). |
| (3) | The following table sets forth the adjustments made to the SCT total for each year represented in the pay versus performance table to arrive at “compensation actually paid” to our PEO, as computed in accordance with Item 402(v) of Regulation S-K: |
| 2026 | 2025 | 2024 | ||||||||||
| SCT Total for PEO | $ | 741,116 | $ | 597,075 | $ | 726,543 | ||||||
| Less: Amount reported under the “Stock Awards” and “Option Awards” columns in the SCT | $ | 74,875 | $ | 37,732 | $ | 117,725 | ||||||
| Add: Fair value as of fiscal year-end of awards granted during the fiscal year that are outstanding and unvested as of the end of the fiscal year | $ | (24,820 | ) | $ | (4,900 | ) | $ | 8,202 | ||||
| Add: Change in fair value as of fiscal year-end, compared to prior fiscal year-end, of awards granted in any prior fiscal year that are outstanding and unvested as of the end of the fiscal year | $ | (898 | ) | $ | (12,416 | ) | $ | (26,706 | ) | |||
| Add: Fair value as of vest date of awards granted and vested in the fiscal year | $ | – | $ | 10,932 | $ | 109,053 | ||||||
| Add: Change in fair value as of vesting date, compared to prior fiscal year-end, of awards granted in any prior fiscal year for which all vesting conditions were satisfied at fiscal year-end or during the fiscal year | $ | 1,205 | $ | 912 | $ | (2,006 | ) | |||||
| Less: Forfeitures during fiscal year equal to prior fiscal year-end value | $ | – | $ | – | $ | – | ||||||
| Total Adjustments | $ | (99,388 | ) | $ | (43,204 | ) | $ | (29,182 | ) | |||
| Compensation Actually Paid to PEO | $ | 641,728 | $ | 553,871 | $ | 697,361 | ||||||
| (4) | The following table sets forth the adjustments made to the SCT total for each year represented in the pay versus performance table to arrive at “compensation actually paid” to our non-PEO NEOs, as computed in accordance with Item 402(v) of Regulation S-K: |
| 2026 | 2025 | 2024 | ||||||||||
| Average SCT Total for Non-PEO NEOs | $ | 411,157 | $ | 444,948 | $ | 483,063 | ||||||
| Less: Amount reported under the “Stock Awards” and “Option Awards” columns in the SCT | $ | 47,575 | $ | 37,732 | $ | 78,199 | ||||||
| Add: Fair value as of fiscal year-end of awards granted during the fiscal year that are outstanding and unvested as of the end of the fiscal year | $ | (8,635 | ) | $ | (4,900 | ) | $ | 8,202 | ||||
| Add: Fair value as of vest date of awards granted and vested in the fiscal year | $ | – | $ | 10,932 | $ | 69,527 | ||||||
| Add: Change in fair value as of fiscal year-end, compared to prior fiscal year-end, of awards granted in any prior fiscal year that are outstanding and unvested as of the end of the fiscal year | $ | (449 | ) | $ | (7,074 | ) | $ | (13,352 | ) | |||
| Less: Forfeitures during fiscal year equal to prior fiscal year-end value | $ | 30,188 | $ | – | $ | – | ||||||
| Add: Change in fair value as of vesting date, compared to prior fiscal year-end, of awards granted in any prior fiscal year for which all vesting conditions were satisfied at fiscal year-end or during the fiscal year | $ | 603 | $ | 3 | $ | (1,003 | ) | |||||
| Total Adjustments | $ | (86,244 | ) | $ | (38,772 | ) | $ | (14,825 | ) | |||
| Average Compensation Actually Paid to Non-PEO NEOs* | $ | 324,913 | $ | 406,176 | $ | 468,238 | ||||||
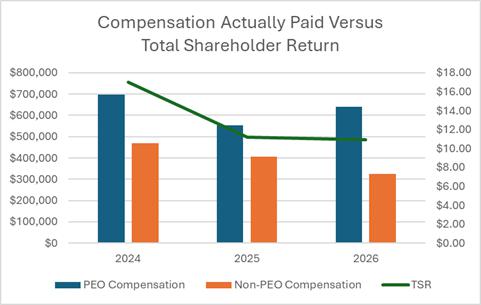
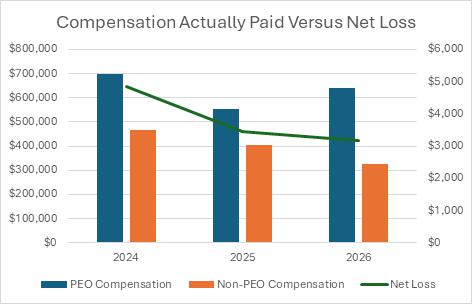
The charts below show, for the past three years, the relationship of the PEO and the other non-PEO NEOs compensation “actually paid” and (i) the Company’s Total Shareholder Return (TSR) and (ii) the Company’s net loss. While the Compensation Committee makes executive compensation decisions in consideration of a variety of factors, including corporate and individual performance, the decisions of the Compensation Committee and Board of Directors in 2026, 2025 and 2024 were made independently of these disclosure requirements.