Performance Management |
Mar. 31, 2026 |
||||||||||||||||||||||||||||||||||||
|---|---|---|---|---|---|---|---|---|---|---|---|---|---|---|---|---|---|---|---|---|---|---|---|---|---|---|---|---|---|---|---|---|---|---|---|---|---|
| Eaton Vance National Ultra-Short Municipal Income Fund | Eaton Vance National Ultra-Short Municipal Income Fund | |||||||||||||||||||||||||||||||||||||
| Prospectus [Line Items] | |||||||||||||||||||||||||||||||||||||
| Bar Chart and Performance Table [Heading] | Performance | ||||||||||||||||||||||||||||||||||||
| Performance Past Does Not Indicate Future [Text] | Past performance (both before and after taxes) is not necessarily an indication of how the Fund will perform in the future. | ||||||||||||||||||||||||||||||||||||
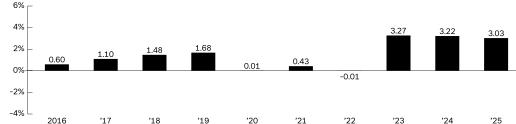
| Performance Information Illustrates Variability of Returns [Text] | The following bar chart and table provide some indication of the risks of investing in the Fund by showing changes in the Fund’s performance from year to year and how the Fund’s average annual returns over time compare with those of one or more indexes intended to measure broad market performance. The Fund’s primary benchmark index was changed from the Bloomberg 1 Year Municipal Bond Index to the Bloomberg Municipal Bond Index effective May 1, 2024 to comply with the regulation that requires the Fund’s primary benchmark to represent the overall applicable market. The additional index(es) in the table provide a means to compare the Fund’s average annual returns to a benchmark that the investment adviser believes is representative of the Fund’s investment universe. | ||||||||||||||||||||||||||||||||||||
| Bar Chart Does Not Reflect Sales Loads [Text] | The returns in the bar chart are for Class A shares and do not reflect a sales charge. If the sales charge was reflected, the returns would be lower. | ||||||||||||||||||||||||||||||||||||
| Bar Chart [Table] | ![]() |
||||||||||||||||||||||||||||||||||||
| Bar Chart Closing [Text Block] |
The year-to-date total return through the end of the most recent calendar quarter (December 31, 2025 to June 30, 2026) was 1.29%.
|
||||||||||||||||||||||||||||||||||||
| Performance Table Heading | Average Annual Total Return as of December 31, 2025 | ||||||||||||||||||||||||||||||||||||
| Performance Table Does Reflect Sales Loads | These returns reflect the maximum current sales charge for Class A (2.25%). | ||||||||||||||||||||||||||||||||||||
| Performance Table Uses Highest Federal Rate | After-tax returns are calculated using the highest historical individual U.S. federal income tax rate and do not reflect the impact of state and local taxes. Actual after-tax returns depend on a shareholder’s tax situation and the actual characterization of distributions, and may differ from those shown. | ||||||||||||||||||||||||||||||||||||
| Performance Table Not Relevant to Tax Deferred | After-tax returns are not relevant to shareholders who hold shares in tax-deferred accounts or to shares held by non-taxable entities. | ||||||||||||||||||||||||||||||||||||
| Performance Table Explanation after Tax Higher | Return After Taxes on Distributions for a period may be the same as Return Before Taxes for that period because no taxable distributions were made during that period. Also, Return After Taxes on Distributions and Sale of Fund Shares for a period may be greater than or equal to Return Before Taxes and/or Return After Taxes on Distributions for the same period because of losses realized on the sale of Fund shares. | ||||||||||||||||||||||||||||||||||||
| Performance [Table] |
|
||||||||||||||||||||||||||||||||||||
| Performance Table Footnotes, Reason Performance Information for Class Different from Immediately Preceding Period [Text] | Advisers Class performance shown above for the period prior to November 20, 2020 (commencement of operations) is the performance of Class A shares at net asset value without adjustment for any differences in the expenses of the two classes. If adjusted for such differences, returns would be different. | ||||||||||||||||||||||||||||||||||||
| Performance Table One Class of after Tax Shown [Text] | After-tax returns for other Classes of shares will vary from the after-tax returns presented for Class A shares. | ||||||||||||||||||||||||||||||||||||
| Index No Deduction for Fees, Expenses, or Taxes [Text] | (reflects no deduction for fees, expenses or taxes) | ||||||||||||||||||||||||||||||||||||
| Performance Table Closing [Text Block] | These returns reflect the maximum current sales charge for Class A (2.25%). Advisers Class performance shown above for the period prior to November 20, 2020 (commencement of operations) is the performance of Class A shares at net asset value without adjustment for any differences in the expenses of the two classes. If adjusted for such differences, returns would be different. Effective January 1, 2022, the Fund changed its name and investment strategy to no longer require it to invest at least 80% of its total assets in (i) municipal floating-rate bonds or obligations and (ii) fixed-rate municipal obligations with respect to which the Fund enters into agreements to swap the fixed rate for a floating rate (the “Floating Rate 80% Policy”). The Floating-Rate 80% Policy was in effect since August 19, 2013 and, at that time, the Fund also changed its objective. Investors cannot invest directly in an Index. BLOOMBERG® is a trademark and service mark of Bloomberg Finance L.P. and its affiliates (collectively “Bloomberg”). BARCLAYS® is a trademark and service mark of Barclays Bank Plc (collectively with its affiliates, “Barclays”), used under license. Bloomberg or Bloomberg’s licensors, including Barclays, own all proprietary rights in the Bloomberg Barclays Indices. Neither Bloomberg nor Barclays is affiliated with BMR, and neither approves, endorses, reviews or recommends the Fund. Neither Bloomberg nor Barclays guarantees the timeliness, accurateness or completeness of any data or information relating to Bloomberg Municipal Bond Index and Bloomberg 1 Year Municipal Bond Index, and neither shall be liable in any way to BMR, investors in the Fund or other third parties in respect of the use or accuracy of Bloomberg Municipal Bond Index and Bloomberg 1 Year Municipal Bond Index or any data included therein. After-tax returns are calculated using the highest historical individual U.S. federal income tax rate and do not reflect the impact of state and local taxes. Actual after-tax returns depend on a shareholder’s tax situation and the actual characterization of distributions, and may differ from those shown. After-tax returns are not relevant to shareholders who hold shares in tax-deferred accounts or to shares held by non-taxable entities. After-tax returns for other Classes of shares will vary from the after-tax returns presented for Class A shares. Return After Taxes on Distributions for a period may be the same as Return Before Taxes for that period because no taxable distributions were made during that period. Also, Return After Taxes on Distributions and Sale of Fund Shares for a period may be greater than or equal to Return Before Taxes and/or Return After Taxes on Distributions for the same period because of losses realized on the sale of Fund shares.
|
||||||||||||||||||||||||||||||||||||
| Performance Availability Website Address [Text] | www.eatonvance.com | ||||||||||||||||||||||||||||||||||||
| Eaton Vance National Ultra-Short Municipal Income Fund | Eaton Vance National Ultra-Short Municipal Income Fund | Class A | |||||||||||||||||||||||||||||||||||||
| Prospectus [Line Items] | |||||||||||||||||||||||||||||||||||||
| Year to Date Return, Label [Optional Text] | The year-to-date total return through the end of the most recent calendar quarter (December 31, 2025 to June 30, 2026) was 1.29%. | ||||||||||||||||||||||||||||||||||||
| Bar Chart, Year to Date Return | 1.29% | ||||||||||||||||||||||||||||||||||||
| Bar Chart, Year to Date Return, Date | Jun. 30, 2026 | ||||||||||||||||||||||||||||||||||||
| Highest Quarterly Return, Label [Optional Text] | High Quarter | ||||||||||||||||||||||||||||||||||||
| Highest Quarterly Return | 1.34% | ||||||||||||||||||||||||||||||||||||
| Highest Quarterly Return, Date | Dec. 31, 2023 | ||||||||||||||||||||||||||||||||||||
| Lowest Quarterly Return, Label [Optional Text] | Low Quarter | ||||||||||||||||||||||||||||||||||||
| Lowest Quarterly Return | (0.71%) | ||||||||||||||||||||||||||||||||||||
| Lowest Quarterly Return, Date | Jun. 30, 2020 | ||||||||||||||||||||||||||||||||||||
| Eaton Vance National Limited Maturity Municipal Income Fund | Eaton Vance National Limited Maturity Municipal Income Fund | |||||||||||||||||||||||||||||||||||||
| Prospectus [Line Items] | |||||||||||||||||||||||||||||||||||||
| Bar Chart and Performance Table [Heading] | Performance | ||||||||||||||||||||||||||||||||||||
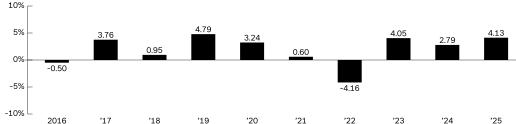
| Performance Narrative [Text Block] | The following bar chart and table provide some indication of the risks of investing in the Fund by showing changes in the Fund’s performance from year to year and how the Fund’s average annual returns over time compare with those of one or more indexes intended to measure broad market performance. The Fund’s primary benchmark index was changed from the Bloomberg Short-Intermediate 1-10 Year Municipal Bond Index to the Bloomberg Municipal Bond Index effective May 1, 2024 to comply with the regulation that requires the Fund’s primary benchmark to represent the overall applicable market. The additional index(es) in the table provide a means to compare the Fund’s average annual returns to a benchmark that the investment adviser believes is representative of the Fund’s investment universe. The returns in the bar chart are for Class A shares and do not reflect a sales charge. If the sales charge was reflected, the returns would be lower. Past performance (both before and after taxes) is not necessarily an indication of how the Fund will perform in the future. Updated Fund performance information can be obtained by visiting www.eatonvance.com.
|
||||||||||||||||||||||||||||||||||||
| Performance Past Does Not Indicate Future [Text] | Past performance (both before and after taxes) is not necessarily an indication of how the Fund will perform in the future. | ||||||||||||||||||||||||||||||||||||
| Performance Information Illustrates Variability of Returns [Text] | The following bar chart and table provide some indication of the risks of investing in the Fund by showing changes in the Fund’s performance from year to year and how the Fund’s average annual returns over time compare with those of one or more indexes intended to measure broad market performance. The Fund’s primary benchmark index was changed from the Bloomberg Short-Intermediate 1-10 Year Municipal Bond Index to the Bloomberg Municipal Bond Index effective May 1, 2024 to comply with the regulation that requires the Fund’s primary benchmark to represent the overall applicable market. The additional index(es) in the table provide a means to compare the Fund’s average annual returns to a benchmark that the investment adviser believes is representative of the Fund’s investment universe. | ||||||||||||||||||||||||||||||||||||
| Bar Chart Does Not Reflect Sales Loads [Text] | The returns in the bar chart are for Class A shares and do not reflect a sales charge. If the sales charge was reflected, the returns would be lower. | ||||||||||||||||||||||||||||||||||||
| Bar Chart [Table] | ![]() |
||||||||||||||||||||||||||||||||||||
| Bar Chart Closing [Text Block] |
The year-to-date total return through the end of the most recent calendar quarter (December 31, 2025 to June 30, 2026) was 1.51%.
|
||||||||||||||||||||||||||||||||||||
| Performance Table Heading | Average Annual Total Return (for the calendar periods ended December 31, 2025) | ||||||||||||||||||||||||||||||||||||
| Performance Table Does Reflect Sales Loads | These returns reflect the maximum current sales charge for Class A (3.25%) and any applicable contingent deferred sales charge (“CDSC”) for Class C. | ||||||||||||||||||||||||||||||||||||
| Performance Table Uses Highest Federal Rate | After-tax returns are calculated using the highest historical individual U.S. federal income tax rate and do not reflect the impact of state and local taxes. Actual after-tax returns depend on a shareholder’s tax situation and the actual characterization of distributions, and may differ from those shown. | ||||||||||||||||||||||||||||||||||||
| Performance Table Not Relevant to Tax Deferred | After-tax returns are not relevant to shareholders who hold shares in tax-deferred accounts or to shares held by non-taxable entities. | ||||||||||||||||||||||||||||||||||||
| Performance Table Explanation after Tax Higher | Return After Taxes on Distributions for a period may be the same as Return Before Taxes for that period because no taxable distributions were made during that period. Also, Return After Taxes on Distributions and Sale of Fund Shares for a period may be greater than or equal to Return Before Taxes and/or Return After Taxes on Distributions for the same period because of losses realized on the sale of Fund shares. | ||||||||||||||||||||||||||||||||||||
| Performance [Table] |
|
||||||||||||||||||||||||||||||||||||
| Performance Table One Class of after Tax Shown [Text] | After-tax returns for other Classes of shares will vary from the after-tax returns presented for Class A shares. | ||||||||||||||||||||||||||||||||||||
| Index No Deduction for Fees, Expenses, or Taxes [Text] | reflects no deduction for fees, expenses or taxes | ||||||||||||||||||||||||||||||||||||
| Performance Table Closing [Text Block] | These returns reflect the maximum current sales charge for Class A (3.25%) and any applicable contingent deferred sales charge (“CDSC”) for Class C. Effective November 5, 2020, Class C shares automatically convert to Class A shares eight years after purchase. The average annual total returns listed for Class C reflect conversion to Class A shares after eight years. Prior to November 5, 2020, Class C shares automatically converted to Class A shares ten years after purchase. Investors cannot invest directly in an Index. BLOOMBERG® is a trademark and service mark of Bloomberg Finance L.P. and its affiliates (collectively “Bloomberg”). BARCLAYS® is a trademark and service mark of Barclays Bank Plc (collectively with its affiliates, “Barclays”), used under license. Bloomberg or Bloomberg’s licensors, including Barclays, own all proprietary rights in the Bloomberg Barclays Indices. Neither Bloomberg nor Barclays is affiliated with BMR, and neither approves, endorses, reviews or recommends the Fund. Neither Bloomberg nor Barclays guarantees the timeliness, accurateness or completeness of any data or information relating to Bloomberg Municipal Bond Index and Bloomberg Short-Intermediate 1-10 Year Municipal Bond Index, and neither shall be liable in any way to BMR, investors in the Fund or other third parties in respect of the use or accuracy of Bloomberg Municipal Bond Index and Bloomberg Short-Intermediate 1-10 Year Municipal Bond Index or any data included therein. After-tax returns are calculated using the highest historical individual U.S. federal income tax rate and do not reflect the impact of state and local taxes. Actual after-tax returns depend on a shareholder’s tax situation and the actual characterization of distributions, and may differ from those shown. After-tax returns are not relevant to shareholders who hold shares in tax-deferred accounts or to shares held by non-taxable entities. After-tax returns for other Classes of shares will vary from the after-tax returns presented for Class A shares. Return After Taxes on Distributions for a period may be the same as Return Before Taxes for that period because no taxable distributions were made during that period. Also, Return After Taxes on Distributions and Sale of Fund Shares for a period may be greater than or equal to Return Before Taxes and/or Return After Taxes on Distributions for the same period because of losses realized on the sale of Fund shares.
|
||||||||||||||||||||||||||||||||||||
| Performance Availability Website Address [Text] | www.eatonvance.com | ||||||||||||||||||||||||||||||||||||
| Eaton Vance National Limited Maturity Municipal Income Fund | Eaton Vance National Limited Maturity Municipal Income Fund | Class A | |||||||||||||||||||||||||||||||||||||
| Prospectus [Line Items] | |||||||||||||||||||||||||||||||||||||
| Year to Date Return, Label [Optional Text] | The year-to-date total return through the end of the most recent calendar quarter (December 31, 2025 to June 30, 2026) was 1.51%. | ||||||||||||||||||||||||||||||||||||
| Bar Chart, Year to Date Return | 1.51% | ||||||||||||||||||||||||||||||||||||
| Bar Chart, Year to Date Return, Date | Jun. 30, 2026 | ||||||||||||||||||||||||||||||||||||
| Highest Quarterly Return, Label [Optional Text] | High Quarter | ||||||||||||||||||||||||||||||||||||
| Highest Quarterly Return | 3.69% | ||||||||||||||||||||||||||||||||||||
| Highest Quarterly Return, Date | Dec. 31, 2023 | ||||||||||||||||||||||||||||||||||||
| Lowest Quarterly Return, Label [Optional Text] | Low Quarter | ||||||||||||||||||||||||||||||||||||
| Lowest Quarterly Return | (3.50%) | ||||||||||||||||||||||||||||||||||||
| Lowest Quarterly Return, Date | Mar. 31, 2022 | ||||||||||||||||||||||||||||||||||||
| Eaton Vance Short Duration Municipal Opportunities Fund | Eaton Vance Short Duration Municipal Opportunities Fund | |||||||||||||||||||||||||||||||||||||
| Prospectus [Line Items] | |||||||||||||||||||||||||||||||||||||
| Bar Chart and Performance Table [Heading] | Performance | ||||||||||||||||||||||||||||||||||||
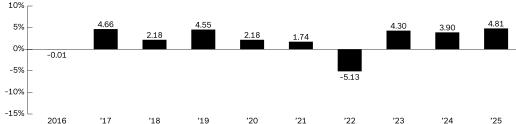
| Performance Narrative [Text Block] | The following bar chart and table provide some indication of the risks of investing in the Fund by showing changes in the Fund’s performance from year to year and how the Fund’s average annual returns over time compare with those of one or more indexes intended to measure broad market performance. The Fund’s primary benchmark index was changed from the Bloomberg Short-Intermediate 1-10 Year Municipal Bond Index to the Bloomberg Municipal Bond Index effective May 1, 2024 to comply with the regulation that requires the Fund’s primary benchmark to represent the overall applicable market. The additional index(es) in the table provide a means to compare the Fund’s average annual returns to a benchmark that the investment adviser believes is representative of the Fund’s investment universe. The returns in the bar chart are for Class A shares and do not reflect a sales charge. If the sales charge was reflected, the returns would be lower. Past performance (both before and after taxes) is not necessarily an indication of how the Fund will perform in the future. The Fund’s performance reflects the effects of expense reductions. Absent these reductions, performance would have been lower. Updated Fund performance information can be obtained by visiting www.eatonvance.com.
|
||||||||||||||||||||||||||||||||||||
| Performance Past Does Not Indicate Future [Text] | Past performance (both before and after taxes) is not necessarily an indication of how the Fund will perform in the future. | ||||||||||||||||||||||||||||||||||||
| Performance Information Illustrates Variability of Returns [Text] | The following bar chart and table provide some indication of the risks of investing in the Fund by showing changes in the Fund’s performance from year to year and how the Fund’s average annual returns over time compare with those of one or more indexes intended to measure broad market performance. The Fund’s primary benchmark index was changed from the Bloomberg Short-Intermediate 1-10 Year Municipal Bond Index to the Bloomberg Municipal Bond Index effective May 1, 2024 to comply with the regulation that requires the Fund’s primary benchmark to represent the overall applicable market. The additional index(es) in the table provide a means to compare the Fund’s average annual returns to a benchmark that the investment adviser believes is representative of the Fund’s investment universe. | ||||||||||||||||||||||||||||||||||||
| Bar Chart Does Not Reflect Sales Loads [Text] | The returns in the bar chart are for Class A shares and do not reflect a sales charge. If the sales charge was reflected, the returns would be lower. | ||||||||||||||||||||||||||||||||||||
| Bar Chart [Table] | ![]() |
||||||||||||||||||||||||||||||||||||
| Bar Chart Closing [Text Block] |
The year-to-date total return through the end of the most recent calendar quarter (as of December 31, 2025 to June 30, 2026) was 1.59%.
|
||||||||||||||||||||||||||||||||||||
| Performance Table Heading | Average Annual Total Return (for the calendar periods ended as of December 31, 2025) | ||||||||||||||||||||||||||||||||||||
| Performance Table Does Reflect Sales Loads | These returns reflect the maximum current sales charge for Class A (3.25%) and any applicable contingent deferred sales charge (“CDSC”) for Class C. | ||||||||||||||||||||||||||||||||||||
| Performance Table Uses Highest Federal Rate | After-tax returns are calculated using the highest historical individual U.S. federal income tax rate and do not reflect the impact of state and local taxes. Actual after-tax returns depend on a shareholder’s tax situation and the actual characterization of distributions, and may differ from those shown. | ||||||||||||||||||||||||||||||||||||
| Performance Table Not Relevant to Tax Deferred | After-tax returns are not relevant to shareholders who hold shares in tax-deferred accounts or to shares held by non-taxable entities. | ||||||||||||||||||||||||||||||||||||
| Performance Table Explanation after Tax Higher | Return After Taxes on Distributions for a period may be the same as Return Before Taxes for that period because no taxable distributions were made during that period. Also, Return After Taxes on Distributions and Sale of Fund Shares for a period may be greater than or equal to Return Before Taxes and/or Return After Taxes on Distributions for the same period because of losses realized on the sale of Fund shares. | ||||||||||||||||||||||||||||||||||||
| Performance [Table] |
|
||||||||||||||||||||||||||||||||||||
| Performance Table One Class of after Tax Shown [Text] | After-tax returns for other Classes of shares will vary from the after-tax returns presented for Class A shares. | ||||||||||||||||||||||||||||||||||||
| Index No Deduction for Fees, Expenses, or Taxes [Text] | reflects no deduction for fees, expenses or taxes | ||||||||||||||||||||||||||||||||||||
| Performance Table Closing [Text Block] | These returns reflect the maximum current sales charge for Class A (3.25%) and any applicable contingent deferred sales charge (“CDSC”) for Class C. Effective November 5, 2020, Class C shares automatically convert to Class A shares eight years after purchase. The average annual total returns listed for Class C reflect conversion to Class A shares after eight years. Prior to November 5, 2020, Class C shares automatically converted to Class A shares ten years after purchase. Effective November 14, 2016, the Fund changed its objective and investment strategy to invest at least 80% of its net assets (plus any borrowings for investment purposes) in municipal obligations that are exempt from regular federal income tax. Investors cannot invest directly in an Index. BLOOMBERG® is a trademark and service mark of Bloomberg Finance L.P. and its affiliates (collectively “Bloomberg”). BARCLAYS® is a trademark and service mark of Barclays Bank Plc (collectively with its affiliates, “Barclays”), used under license. Bloomberg or Bloomberg’s licensors, including Barclays, own all proprietary rights in the Bloomberg Barclays Indices. Neither Bloomberg nor Barclays is affiliated with Eaton Vance, and neither approves, endorses, reviews or recommends the Fund. Neither Bloomberg nor Barclays guarantees the timeliness, accurateness or completeness of any data or information relating to Bloomberg Municipal Bond Index and Bloomberg Short-Intermediate 1-10 Year Municipal Bond Index, and neither shall be liable in any way to Eaton Vance, investors in the Fund or other third parties in respect of the use or accuracy of Bloomberg Municipal Bond Index and Bloomberg Short-Intermediate 1-10 Year Municipal Bond Index or any data included therein. After-tax returns are calculated using the highest historical individual U.S. federal income tax rate and do not reflect the impact of state and local taxes. Actual after-tax returns depend on a shareholder’s tax situation and the actual characterization of distributions, and may differ from those shown. After-tax returns are not relevant to shareholders who hold shares in tax-deferred accounts or to shares held by non-taxable entities. After-tax returns for other Classes of shares will vary from the after-tax returns presented for Class A shares. Return After Taxes on Distributions for a period may be the same as Return Before Taxes for that period because no taxable distributions were made during that period. Also, Return After Taxes on Distributions and Sale of Fund Shares for a period may be greater than or equal to Return Before Taxes and/or Return After Taxes on Distributions for the same period because of losses realized on the sale of Fund shares.
|
||||||||||||||||||||||||||||||||||||
| Performance Availability Website Address [Text] | www.eatonvance.com | ||||||||||||||||||||||||||||||||||||
| Eaton Vance Short Duration Municipal Opportunities Fund | Eaton Vance Short Duration Municipal Opportunities Fund | Class A | |||||||||||||||||||||||||||||||||||||
| Prospectus [Line Items] | |||||||||||||||||||||||||||||||||||||
| Year to Date Return, Label [Optional Text] | The year-to-date total return through the end of the most recent calendar quarter (as of December 31, 2025 to June 30, 2026) was 1.59%. | ||||||||||||||||||||||||||||||||||||
| Bar Chart, Year to Date Return | 1.59% | ||||||||||||||||||||||||||||||||||||
| Bar Chart, Year to Date Return, Date | Jun. 30, 2026 | ||||||||||||||||||||||||||||||||||||
| Highest Quarterly Return, Label [Optional Text] | High Quarter | ||||||||||||||||||||||||||||||||||||
| Highest Quarterly Return | 3.73% | ||||||||||||||||||||||||||||||||||||
| Highest Quarterly Return, Date | Dec. 31, 2023 | ||||||||||||||||||||||||||||||||||||
| Lowest Quarterly Return, Label [Optional Text] | Low Quarter | ||||||||||||||||||||||||||||||||||||
| Lowest Quarterly Return | (3.91%) | ||||||||||||||||||||||||||||||||||||
| Lowest Quarterly Return, Date | Mar. 31, 2022 |