v3.26.1
Performance Management - T. Rowe Price Government Money Fund, Inc.
Jul. 27, 2026
Prospectus [Line Items]  
Bar Chart and Performance Table [Heading] Performance
Performance Narrative [Text Block]

The following performance information provides some indication of the risks of investing in the fund. The fund’s performance information represents only past performance and is not necessarily an indication of future results.

Prior to August 1, 2016, the fund operated as a prime money market fund and invested in certain types of securities that the fund is no longer permitted to hold. Consequently, the performance information below may have been different if the current investment limitations had been in effect during the period prior to the fund’s conversion to a government money market fund.

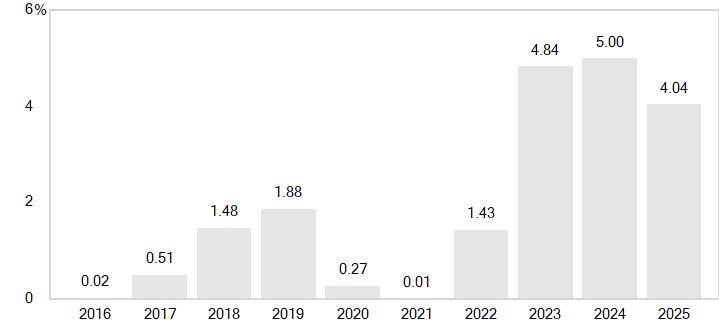
The following bar chart illustrates how much returns can differ from year to year by showing calendar year returns and the best and worst calendar quarter returns during those years for the fund’s Investor Class. Returns for other share classes vary since they have different expenses.
Performance Past Does Not Indicate Future [Text] The fund’s performance information represents only past performance and is not necessarily an indication of future results.
Performance Information Illustrates Variability of Returns [Text] The following performance information provides some indication of the risks of investing in the fund.The following bar chart illustrates how much returns can differ from year to year by showing calendar year returns and the best and worst calendar quarter returns during those years for the fund’s Investor Class. Returns for other share classes vary since they have different expenses.The following table shows the average annual total returns for each class of the fund that has been in operation for at least one full calendar year. In addition, the table also includes a comparative index that has investment characteristics similar to those of the fund.
Bar Chart [Heading] Calendar Year Returns
Bar Chart [Table]
year returns
2016
2017
2018
2019
2020
2021
2022
2023
2024
2025

PerformanceBarChartData(2016:0.02,2017:0.51,2018:1.48,2019:1.88,2020:0.27,2021:0.01,2022:1.43,2023:4.84,2024:5,2025:4.04)


Bar Chart Closing [Text Block]
    Quarter
Ended

Total

Return

    Quarter
Ended

Total

Return

 
  Best Quarter 12/31/23 1.29%   Worst Quarter 3/31/21 0.00%  


The fund’s return for the six months ended 6/30/26 was 1.69%.

Year to Date Return, Label [Optional Text] The fund’s return for the six months ended
Bar Chart, Year to Date Return 1.69%
Bar Chart, Year to Date Return, Date Jun. 30, 2026
Highest Quarterly Return, Label [Optional Text] Best Quarter
Highest Quarterly Return 1.29%
Highest Quarterly Return, Date Dec. 31, 2023
Lowest Quarterly Return, Label [Optional Text] Worst Quarter
Lowest Quarterly Return none
Lowest Quarterly Return, Date Mar. 31, 2021
Performance Table Heading Average Annual Total Returns Periods ended December 31, 2025
Performance Table Narrative

The following table shows the average annual total returns for each class of the fund that has been in operation for at least one full calendar year. In addition, the table also includes a comparative index that has investment characteristics similar to those of the fund.

Performance [Table]
Average Annual Total Returns               
      Periods ended   
      December 31, 2025  
                             
                        Since Inception  
      1 Year      5 Years      10 Years      inception date  
  Investor Class                       01/26/1976  
    4.04  %   3.05  %   1.93  %   %    
  I Class                       05/03/2017  
      4.17      3.14          2.32      
                               
  Lipper U.S. Government Money Market Funds Average    
    3.77      2.82      1.72      2.04 a    
                               
aReturn since 4/30/17.
Performance Table Closing [Text Block]

Updated performance information is available through troweprice.com.

Performance Availability Website Address [Text] troweprice.com