Shareholder Report
|
12 Months Ended |
|
May 31, 2026
USD ($)
Holding
|
|---|
| Shareholder Report [Line Items] |
|
| Document Type |
N-CSR
|
| Amendment Flag |
false
|
| Registrant Name |
Federated Hermes Institutional Trust
|
| Entity Central Index Key |
0000925723
|
| Entity Investment Company Type |
N-1A
|
| Document Period End Date |
May 31, 2026
|
| Shareholder Report Annual or Semi-Annual |
Annual Shareholder Report
|
| C000026761 |
|
| Shareholder Report [Line Items] |
|
| Fund Name |
Federated Hermes Government Ultrashort Fund
|
| Class Name |
Class A Shares
|
| Trading Symbol |
FGUAX
|
| Annual or Semi-Annual Statement [Text Block] |
This annual shareholder report contains important information about the Federated Hermes Government Ultrashort Fund (the "Fund") for the period of June 1, 2025 to May 31, 2026.
|
| Additional Information [Text Block] |
You can find additional information at FederatedHermes.com/us/FundInformation. You can also request this information by contacting us at 1-800-341-7400, Option 4, or your financial advisor.
|
| Additional Information Phone Number |
1-800-341-7400
|
| Additional Information Website |
FederatedHermes.com/us/FundInformation
|
| Expenses [Text Block] |
What were the Fund costs for the last year? (based on a hypothetical $10,000 investment) Table SummaryClass Name | Costs of a $10,000 investment | Costs paid as a percentage of a $10,000 investment |
|---|
Class A Shares | $42 | 0.41% |
|---|
|
| Expenses Paid, Amount |
$ 42
|
| Expense Ratio, Percent |
0.41%
|
| Factors Affecting Performance [Text Block] |
Management's Discussion of Fund PerformanceThe following discussion compares the performance of the Fund to the ICE BofA US 6-Month Treasury Bill Index (the “Index”) to show how the Fund’s performance compares to the returns of similar investments for the reporting period. See the Average Annual Total Returns table below for the returns of the Fund and related indexes, including the Bloomberg US Aggregate Bond Index, a required broad-based index which represents the overall U.S. fixed-income market. The Fund seeks to provide current income by investing primarily in U.S. government securities and U.S. government agency securities, including U.S. government agency mortgage-backed securities. Top Contributors to Performance Sector allocation positively contributed to the Fund’s relative performance as the Fund maintained a significant overweight allocation to U.S. government agency mortgage-backed securities (MBS) over the period. The higher income available in floating rate collateralized mortgage obligations propelled overall returns for the period, as did the Fund’s holdings of conventional fixed-rate mortgage obligations. The Fund maintained a longer duration relative to the Index which contributed positively to the Fund’s relative performance.
Top Detractors from Performance The Fund’s allocation to government money market instruments, while enhancing principal stability and liquidity, detracted from Fund performance as interest rates on short-term government securities were lower than on the yields available in the Mortgage sector. Volatility at the longer end of the yield curve toward the end of the period resulted in price declines on some MBS holdings of the Fund.
|
| Performance Past Does Not Indicate Future [Text] |
Keep in mind that the Fund’s past performance is not a predictor of how the Fund will perform in the future.
|
| Line Graph [Table Text Block] |
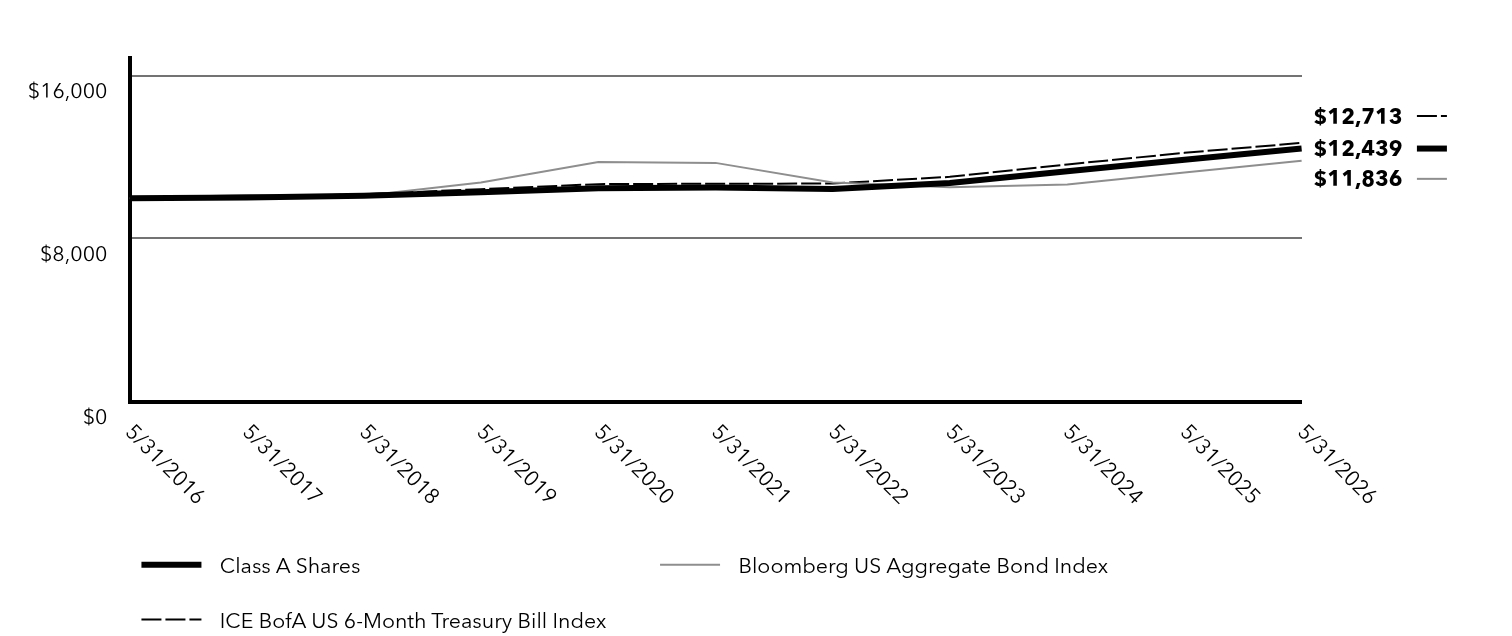
Table Summary | Class A Shares | Bloomberg US Aggregate Bond Index | ICE BofA US 6-Month Treasury Bill Index |
|---|
5/31/2016 | $10,000 | $10,000 | $10,000 |
|---|
5/31/2017 | $10,037 | $10,158 | $10,065 |
|---|
5/31/2018 | $10,124 | $10,120 | $10,198 |
|---|
5/31/2019 | $10,294 | $10,768 | $10,443 |
|---|
5/31/2020 | $10,491 | $11,781 | $10,691 |
|---|
5/31/2021 | $10,525 | $11,734 | $10,711 |
|---|
5/31/2022 | $10,457 | $10,769 | $10,720 |
|---|
5/31/2023 | $10,746 | $10,538 | $11,048 |
|---|
5/31/2024 | $11,323 | $10,676 | $11,658 |
|---|
5/31/2025 | $11,889 | $11,258 | $12,227 |
|---|
5/31/2026 | $12,439 | $11,836 | $12,713 |
|---|
|
| Average Annual Return [Table Text Block] |
Table SummaryFund/Index | 1 Year | 5 Years | 10 Years |
|---|
Class A Shares | 4.63% | 3.40% | 2.21% |
|---|
Bloomberg US Aggregate Bond Index | 5.13% | 0.17% | 1.70% |
|---|
ICE BofA US 6-Month Treasury Bill Index | 3.97% | 3.49% | 2.43% |
|---|
|
| No Deduction of Taxes [Text Block] |
The graph and table do not reflect the deduction of taxes that a shareholder would pay on fund distributions or redemption of fund shares.
|
| Updated Performance Information Location [Text Block] |
FederatedHermes.com/us/FundInformation
|
| AssetsNet |
$ 2,333,680,775
|
| Holdings Count | Holding |
265
|
| Advisory Fees Paid, Amount |
$ 2,488,025
|
| InvestmentCompanyPortfolioTurnover |
24.00%
|
| Additional Fund Statistics [Text Block] |
- Net Assets$2,333,680,775
- Number of Investments265
- Portfolio Turnover24%
- Total Advisory Fees Paid$2,488,025
|
| Holdings [Text Block] |
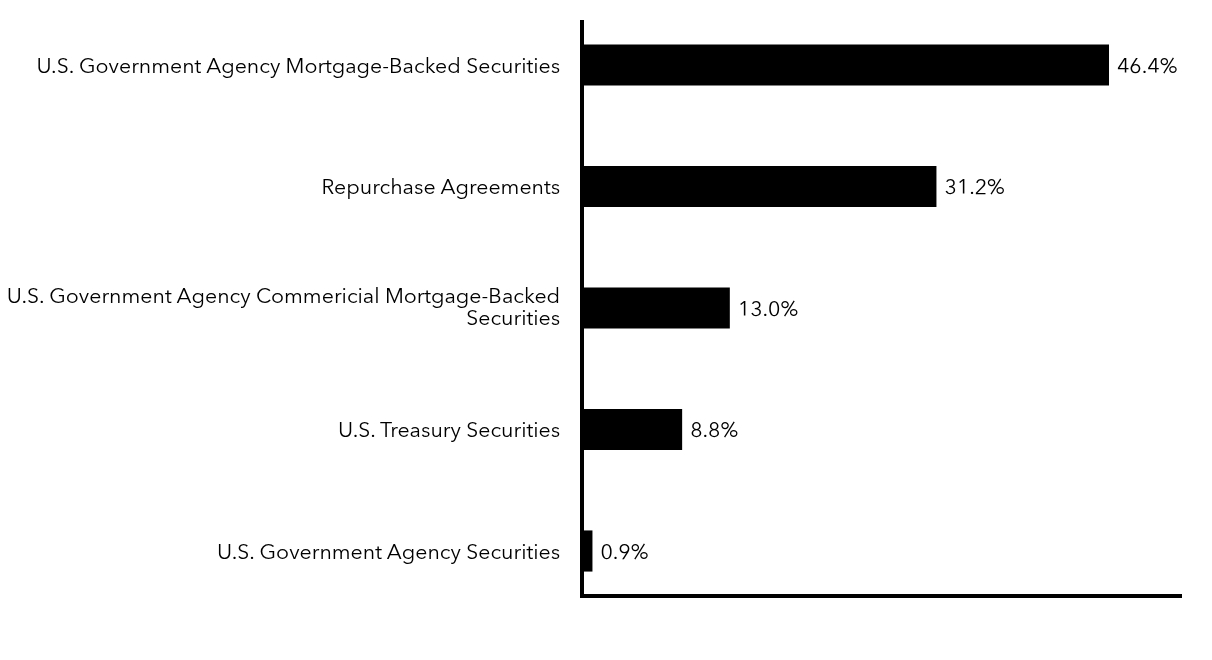
Top Security Types (% of Net Assets)Table SummaryValue | Value |
|---|
U.S. Government Agency Securities | 0.9% | U.S. Treasury Securities | 8.8% | U.S. Government Agency Commericial Mortgage-Backed Securities | 13.0% | Repurchase Agreements | 31.2% | U.S. Government Agency Mortgage-Backed Securities | 46.4% | |
| Material Fund Change [Text Block] |
|
| C000026763 |
|
| Shareholder Report [Line Items] |
|
| Fund Name |
Federated Hermes Government Ultrashort Fund
|
| Class Name |
Institutional Shares
|
| Trading Symbol |
FGUSX
|
| Annual or Semi-Annual Statement [Text Block] |
This annual shareholder report contains important information about the Federated Hermes Government Ultrashort Fund (the "Fund") for the period of June 1, 2025 to May 31, 2026.
|
| Additional Information [Text Block] |
You can find additional information at FederatedHermes.com/us/FundInformation. You can also request this information by contacting us at 1-800-341-7400, Option 4, or your financial advisor.
|
| Additional Information Phone Number |
1-800-341-7400
|
| Additional Information Website |
FederatedHermes.com/us/FundInformation
|
| Expenses [Text Block] |
What were the Fund costs for the last year? (based on a hypothetical $10,000 investment) Table SummaryClass Name | Costs of a $10,000 investment | Costs paid as a percentage of a $10,000 investment |
|---|
Institutional Shares | $27 | 0.26% |
|---|
|
| Expenses Paid, Amount |
$ 27
|
| Expense Ratio, Percent |
0.26%
|
| Factors Affecting Performance [Text Block] |
Management's Discussion of Fund PerformanceThe following discussion compares the performance of the Fund to the ICE BofA US 6-Month Treasury Bill Index (the “Index”) to show how the Fund’s performance compares to the returns of similar investments for the reporting period. See the Average Annual Total Returns table below for the returns of the Fund and related indexes, including the Bloomberg US Aggregate Bond Index, a required broad-based index which represents the overall U.S. fixed-income market. The Fund seeks to provide current income by investing primarily in U.S. government securities and U.S. government agency securities, including U.S. government agency mortgage-backed securities. Top Contributors to Performance Sector allocation positively contributed to the Fund’s relative performance as the Fund maintained a significant overweight allocation to U.S. government agency mortgage-backed securities (MBS) over the period. The higher income available in floating rate collateralized mortgage obligations propelled overall returns for the period, as did the Fund’s holdings of conventional fixed-rate mortgage obligations. The Fund maintained a longer duration relative to the Index which contributed positively to the Fund’s relative performance.
Top Detractors from Performance The Fund’s allocation to government money market instruments, while enhancing principal stability and liquidity, detracted from Fund performance as interest rates on short-term government securities were lower than on the yields available in the Mortgage sector. Volatility at the longer end of the yield curve toward the end of the period resulted in price declines on some MBS holdings of the Fund.
|
| Performance Past Does Not Indicate Future [Text] |
Keep in mind that the Fund’s past performance is not a predictor of how the Fund will perform in the future.
|
| Line Graph [Table Text Block] |
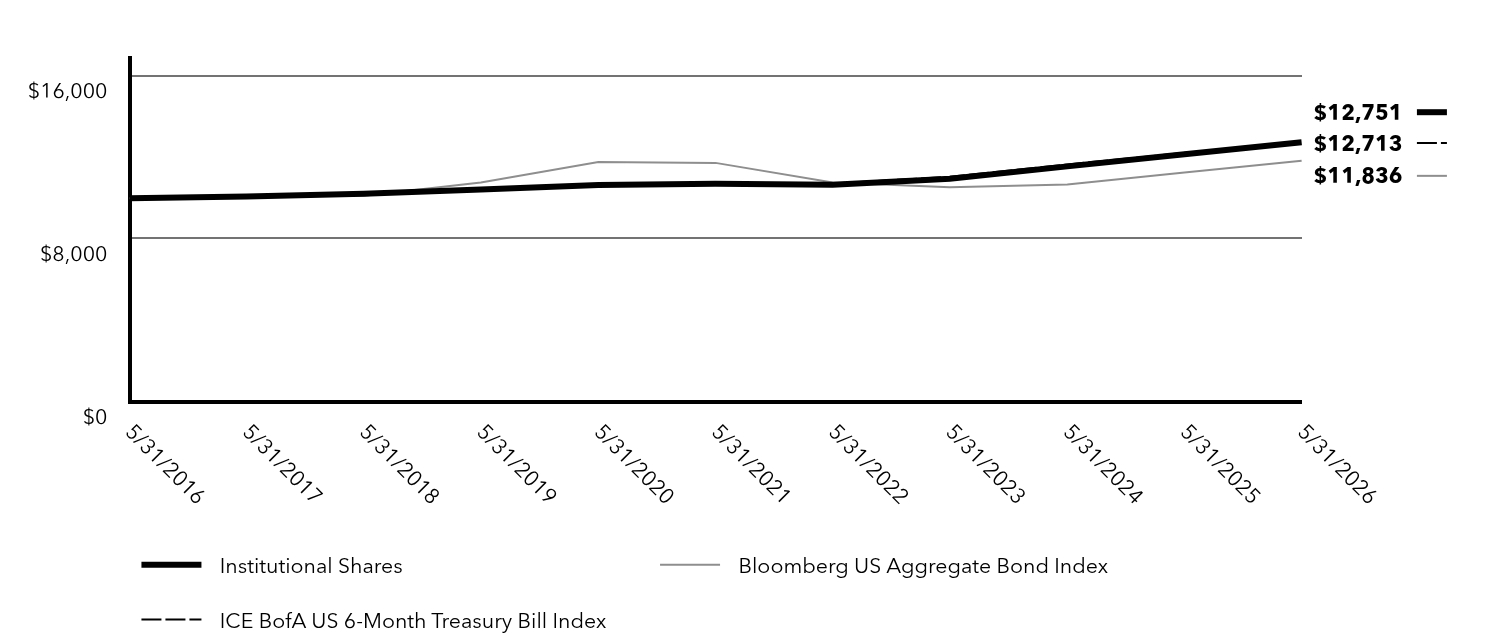
Table Summary | Institutional Shares | Bloomberg US Aggregate Bond Index | ICE BofA US 6-Month Treasury Bill Index |
|---|
5/31/2016 | $10,000 | $10,000 | $10,000 |
|---|
5/31/2017 | $10,081 | $10,158 | $10,065 |
|---|
5/31/2018 | $10,214 | $10,120 | $10,198 |
|---|
5/31/2019 | $10,432 | $10,768 | $10,443 |
|---|
5/31/2020 | $10,653 | $11,781 | $10,691 |
|---|
5/31/2021 | $10,714 | $11,734 | $10,711 |
|---|
5/31/2022 | $10,656 | $10,769 | $10,720 |
|---|
5/31/2023 | $10,956 | $10,538 | $11,048 |
|---|
5/31/2024 | $11,562 | $10,676 | $11,658 |
|---|
5/31/2025 | $12,157 | $11,258 | $12,227 |
|---|
5/31/2026 | $12,751 | $11,836 | $12,713 |
|---|
|
| Average Annual Return [Table Text Block] |
Table SummaryFund/Index | 1 Year | 5 Years | 10 Years |
|---|
Institutional Shares | 4.89% | 3.54% | 2.46% |
|---|
Bloomberg US Aggregate Bond Index | 5.13% | 0.17% | 1.70% |
|---|
ICE BofA US 6-Month Treasury Bill Index | 3.97% | 3.49% | 2.43% |
|---|
|
| No Deduction of Taxes [Text Block] |
The graph and table do not reflect the deduction of taxes that a shareholder would pay on fund distributions or redemption of fund shares.
|
| Updated Performance Information Location [Text Block] |
FederatedHermes.com/us/FundInformation
|
| AssetsNet |
$ 2,333,680,775
|
| Holdings Count | Holding |
265
|
| Advisory Fees Paid, Amount |
$ 2,488,025
|
| InvestmentCompanyPortfolioTurnover |
24.00%
|
| Additional Fund Statistics [Text Block] |
- Net Assets$2,333,680,775
- Number of Investments265
- Portfolio Turnover24%
- Total Advisory Fees Paid$2,488,025
|
| Holdings [Text Block] |
Top Security Types (% of Net Assets)Table SummaryValue | Value |
|---|
U.S. Government Agency Securities | 0.9% | U.S. Treasury Securities | 8.8% | U.S. Government Agency Commericial Mortgage-Backed Securities | 13.0% | Repurchase Agreements | 31.2% | U.S. Government Agency Mortgage-Backed Securities | 46.4% | |
| Material Fund Change [Text Block] |
|
| C000168177 |
|
| Shareholder Report [Line Items] |
|
| Fund Name |
Federated Hermes Government Ultrashort Fund
|
| Class Name |
Class R6 Shares
|
| Trading Symbol |
FGULX
|
| Annual or Semi-Annual Statement [Text Block] |
This annual shareholder report contains important information about the Federated Hermes Government Ultrashort Fund (the "Fund") for the period of June 1, 2025 to May 31, 2026.
|
| Additional Information [Text Block] |
You can find additional information at FederatedHermes.com/us/FundInformation. You can also request this information by contacting us at 1-800-341-7400, Option 4, or your financial advisor.
|
| Additional Information Phone Number |
1-800-341-7400
|
| Additional Information Website |
FederatedHermes.com/us/FundInformation
|
| Expenses [Text Block] |
What were the Fund costs for the last year? (based on a hypothetical $10,000 investment) Table SummaryClass Name | Costs of a $10,000 investment | Costs paid as a percentage of a $10,000 investment |
|---|
Class R6 Shares | $25 | 0.24% |
|---|
|
| Expenses Paid, Amount |
$ 25
|
| Expense Ratio, Percent |
0.24%
|
| Factors Affecting Performance [Text Block] |
Management's Discussion of Fund PerformanceThe following discussion compares the performance of the Fund to the ICE BofA US 6-Month Treasury Bill Index (the “Index”) to show how the Fund’s performance compares to the returns of similar investments for the reporting period. See the Average Annual Total Returns table below for the returns of the Fund and related indexes, including the Bloomberg US Aggregate Bond Index, a required broad-based index which represents the overall U.S. fixed-income market. The Fund seeks to provide current income by investing primarily in U.S. government securities and U.S. government agency securities, including U.S. government agency mortgage-backed securities. Top Contributors to Performance Sector allocation positively contributed to the Fund’s relative performance as the Fund maintained a significant overweight allocation to U.S. government agency mortgage-backed securities (MBS) over the period. The higher income available in floating rate collateralized mortgage obligations propelled overall returns for the period, as did the Fund’s holdings of conventional fixed-rate mortgage obligations. The Fund maintained a longer duration relative to the Index which contributed positively to the Fund’s relative performance.
Top Detractors from Performance The Fund’s allocation to government money market instruments, while enhancing principal stability and liquidity, detracted from Fund performance as interest rates on short-term government securities were lower than on the yields available in the Mortgage sector. Volatility at the longer end of the yield curve toward the end of the period resulted in price declines on some MBS holdings of the Fund.
|
| Performance Past Does Not Indicate Future [Text] |
Keep in mind that the Fund’s past performance is not a predictor of how the Fund will perform in the future.
|
| Line Graph [Table Text Block] |
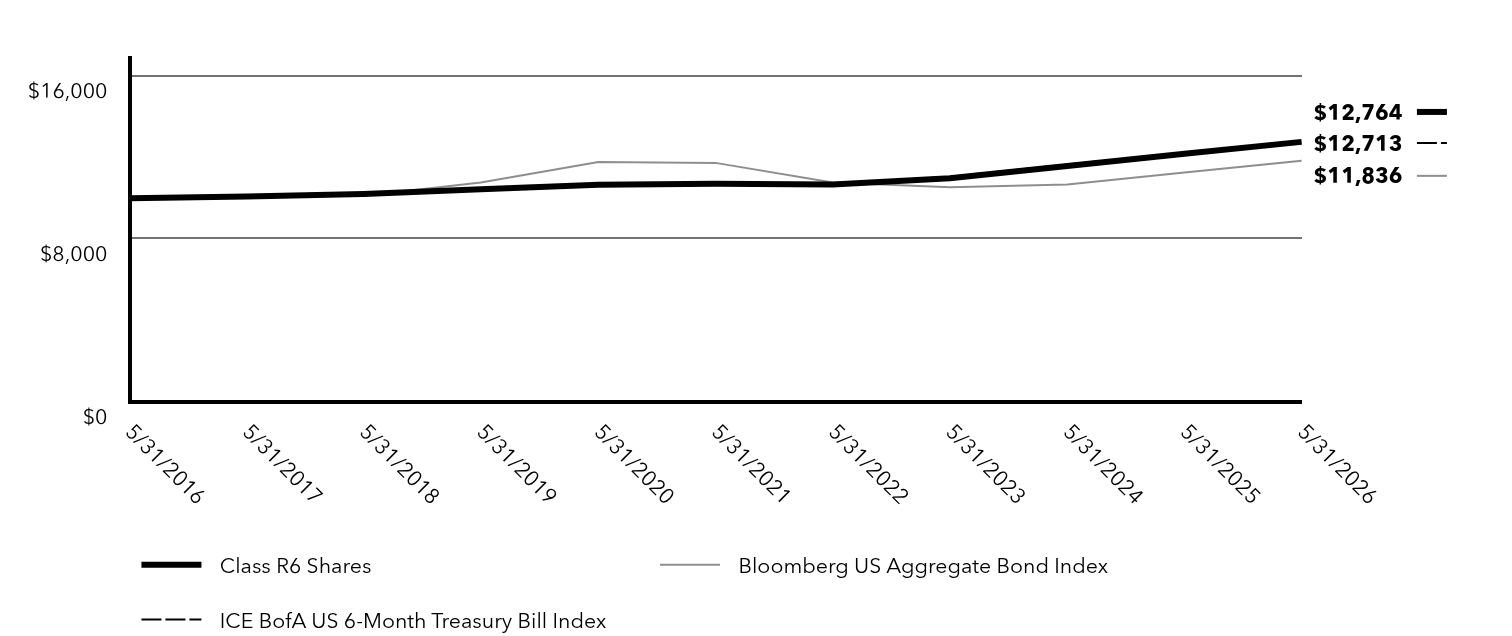
Table Summary | Class R6 Shares | Bloomberg US Aggregate Bond Index | ICE BofA US 6-Month Treasury Bill Index |
|---|
5/31/2016 | $10,000 | $10,000 | $10,000 |
|---|
5/31/2017 | $10,083 | $10,158 | $10,065 |
|---|
5/31/2018 | $10,208 | $10,120 | $10,198 |
|---|
5/31/2019 | $10,438 | $10,768 | $10,443 |
|---|
5/31/2020 | $10,661 | $11,781 | $10,691 |
|---|
5/31/2021 | $10,713 | $11,734 | $10,711 |
|---|
5/31/2022 | $10,669 | $10,769 | $10,720 |
|---|
5/31/2023 | $10,983 | $10,538 | $11,048 |
|---|
5/31/2024 | $11,580 | $10,676 | $11,658 |
|---|
5/31/2025 | $12,179 | $11,258 | $12,227 |
|---|
5/31/2026 | $12,764 | $11,836 | $12,713 |
|---|
|
| Average Annual Return [Table Text Block] |
Table SummaryFund/Index | 1 Year | 5 Years | 10 Years |
|---|
Class R6 Shares | 4.80% | 3.56% | 2.47% |
|---|
Bloomberg US Aggregate Bond Index | 5.13% | 0.17% | 1.70% |
|---|
ICE BofA US 6-Month Treasury Bill Index | 3.97% | 3.49% | 2.43% |
|---|
|
| No Deduction of Taxes [Text Block] |
The graph and table do not reflect the deduction of taxes that a shareholder would pay on fund distributions or redemption of fund shares.
|
| Updated Performance Information Location [Text Block] |
FederatedHermes.com/us/FundInformation
|
| AssetsNet |
$ 2,333,680,775
|
| Holdings Count | Holding |
265
|
| Advisory Fees Paid, Amount |
$ 2,488,025
|
| InvestmentCompanyPortfolioTurnover |
24.00%
|
| Additional Fund Statistics [Text Block] |
- Net Assets$2,333,680,775
- Number of Investments265
- Portfolio Turnover24%
- Total Advisory Fees Paid$2,488,025
|
| Holdings [Text Block] |
Top Security Types (% of Net Assets)Table SummaryValue | Value |
|---|
U.S. Government Agency Securities | 0.9% | U.S. Treasury Securities | 8.8% | U.S. Government Agency Commericial Mortgage-Backed Securities | 13.0% | Repurchase Agreements | 31.2% | U.S. Government Agency Mortgage-Backed Securities | 46.4% | |
| Material Fund Change [Text Block] |
|
| C000026762 |
|
| Shareholder Report [Line Items] |
|
| Fund Name |
Federated Hermes Government Ultrashort Fund
|
| Class Name |
Service Shares
|
| Trading Symbol |
FEUSX
|
| Annual or Semi-Annual Statement [Text Block] |
This annual shareholder report contains important information about the Federated Hermes Government Ultrashort Fund (the "Fund") for the period of June 1, 2025 to May 31, 2026.
|
| Additional Information [Text Block] |
You can find additional information at FederatedHermes.com/us/FundInformation. You can also request this information by contacting us at 1-800-341-7400, Option 4, or your financial advisor.
|
| Additional Information Phone Number |
1-800-341-7400
|
| Additional Information Website |
FederatedHermes.com/us/FundInformation
|
| Expenses [Text Block] |
What were the Fund costs for the last year? (based on a hypothetical $10,000 investment) Table SummaryClass Name | Costs of a $10,000 investment | Costs paid as a percentage of a $10,000 investment |
|---|
Service Shares | $37 | 0.36% |
|---|
|
| Expenses Paid, Amount |
$ 37
|
| Expense Ratio, Percent |
0.36%
|
| Factors Affecting Performance [Text Block] |
Management's Discussion of Fund PerformanceThe following discussion compares the performance of the Fund to the ICE BofA US 6-Month Treasury Bill Index (the “Index”) to show how the Fund’s performance compares to the returns of similar investments for the reporting period. See the Average Annual Total Returns table below for the returns of the Fund and related indexes, including the Bloomberg US Aggregate Bond Index, a required broad-based index which represents the overall U.S. fixed-income market. The Fund seeks to provide current income by investing primarily in U.S. government securities and U.S. government agency securities, including U.S. government agency mortgage-backed securities. Top Contributors to Performance Sector allocation positively contributed to the Fund’s relative performance as the Fund maintained a significant overweight allocation to U.S. government agency mortgage-backed securities (MBS) over the period. The higher income available in floating rate collateralized mortgage obligations propelled overall returns for the period, as did the Fund’s holdings of conventional fixed-rate mortgage obligations. The Fund maintained a longer duration relative to the Index which contributed positively to the Fund’s relative performance.
Top Detractors from Performance The Fund’s allocation to government money market instruments, while enhancing principal stability and liquidity, detracted from Fund performance as interest rates on short-term government securities were lower than on the yields available in the Mortgage sector. Volatility at the longer end of the yield curve toward the end of the period resulted in price declines on some MBS holdings of the Fund.
|
| Performance Past Does Not Indicate Future [Text] |
Keep in mind that the Fund’s past performance is not a predictor of how the Fund will perform in the future.
|
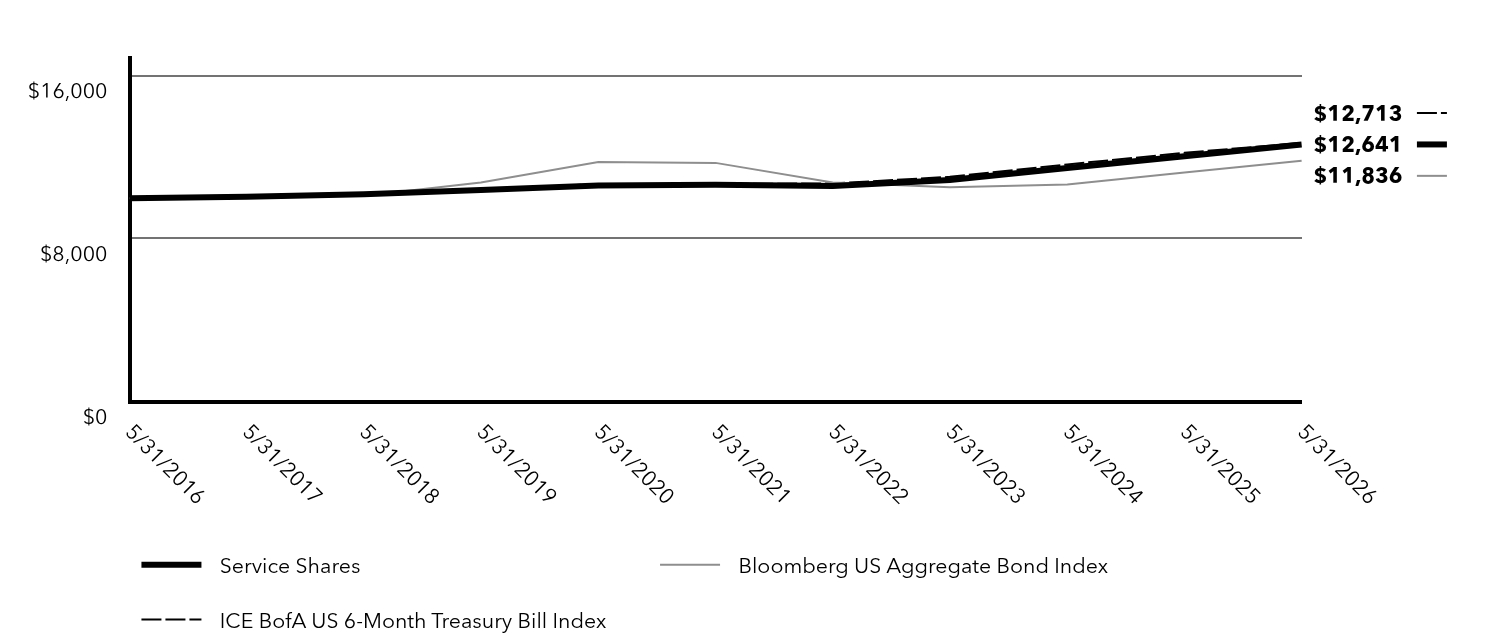
| Line Graph [Table Text Block] |
Table Summary | Service Shares | Bloomberg US Aggregate Bond Index | ICE BofA US 6-Month Treasury Bill Index |
|---|
5/31/2016 | $10,000 | $10,000 | $10,000 |
|---|
5/31/2017 | $10,071 | $10,158 | $10,065 |
|---|
5/31/2018 | $10,193 | $10,120 | $10,198 |
|---|
5/31/2019 | $10,401 | $10,768 | $10,443 |
|---|
5/31/2020 | $10,622 | $11,781 | $10,691 |
|---|
5/31/2021 | $10,661 | $11,734 | $10,711 |
|---|
5/31/2022 | $10,605 | $10,769 | $10,720 |
|---|
5/31/2023 | $10,893 | $10,538 | $11,048 |
|---|
5/31/2024 | $11,484 | $10,676 | $11,658 |
|---|
5/31/2025 | $12,064 | $11,258 | $12,227 |
|---|
5/31/2026 | $12,641 | $11,836 | $12,713 |
|---|
|
| Average Annual Return [Table Text Block] |
Table SummaryFund/Index | 1 Year | 5 Years | 10 Years |
|---|
Service Shares | 4.78% | 3.46% | 2.37% |
|---|
Bloomberg US Aggregate Bond Index | 5.13% | 0.17% | 1.70% |
|---|
ICE BofA US 6-Month Treasury Bill Index | 3.97% | 3.49% | 2.43% |
|---|
|
| No Deduction of Taxes [Text Block] |
The graph and table do not reflect the deduction of taxes that a shareholder would pay on fund distributions or redemption of fund shares.
|
| Updated Performance Information Location [Text Block] |
FederatedHermes.com/us/FundInformation
|
| AssetsNet |
$ 2,333,680,775
|
| Holdings Count | Holding |
265
|
| Advisory Fees Paid, Amount |
$ 2,488,025
|
| InvestmentCompanyPortfolioTurnover |
24.00%
|
| Additional Fund Statistics [Text Block] |
- Net Assets$2,333,680,775
- Number of Investments265
- Portfolio Turnover24%
- Total Advisory Fees Paid$2,488,025
|
| Holdings [Text Block] |
Top Security Types (% of Net Assets)Table SummaryValue | Value |
|---|
U.S. Government Agency Securities | 0.9% | U.S. Treasury Securities | 8.8% | U.S. Government Agency Commericial Mortgage-Backed Securities | 13.0% | Repurchase Agreements | 31.2% | U.S. Government Agency Mortgage-Backed Securities | 46.4% | |
| Material Fund Change [Text Block] |
|