Pay vs Performance Disclosure - USD ($)
Mar. 31, 2026
Mar. 31, 2025
Mar. 31, 2024
Mar. 31, 2023
Mar. 31, 2022
Pay Versus Perfor
ma
nce Pay Versus Performance Table
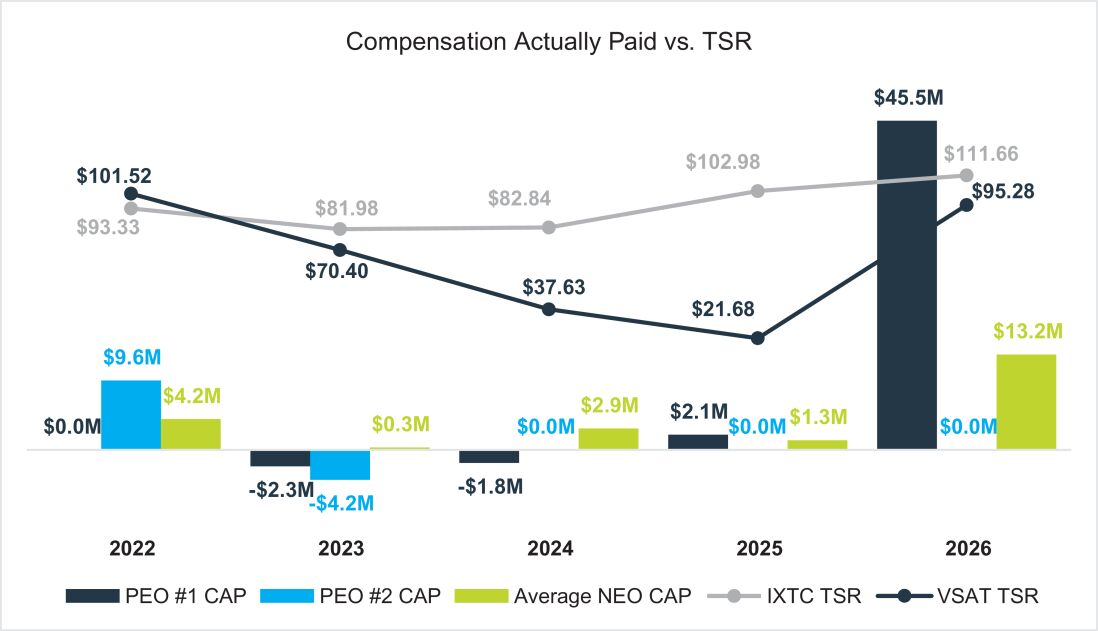
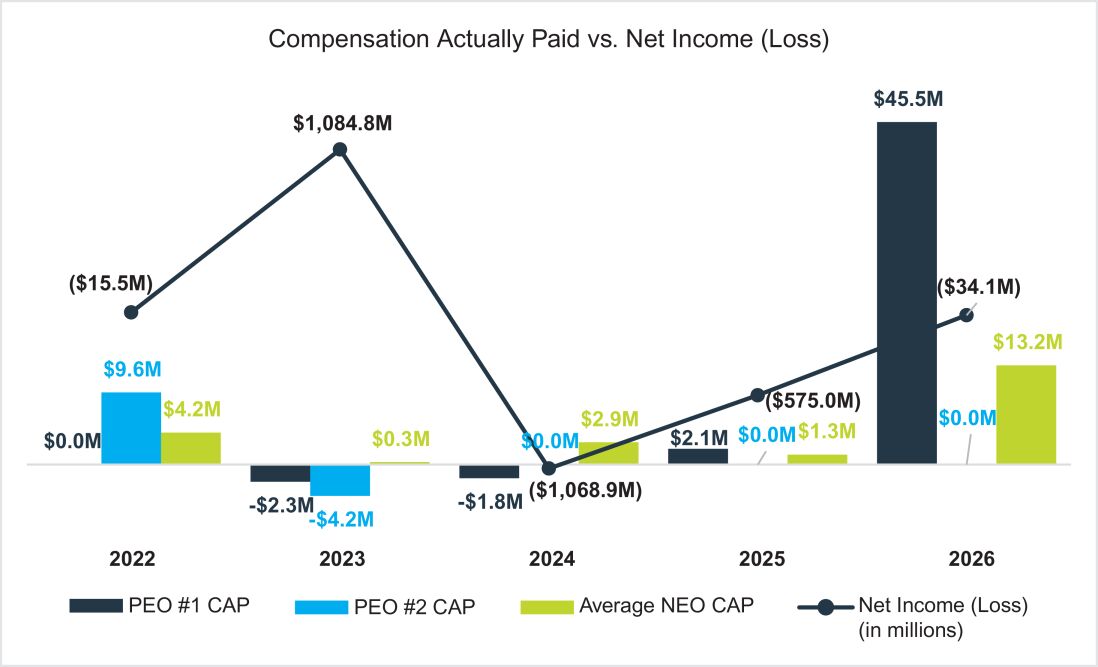
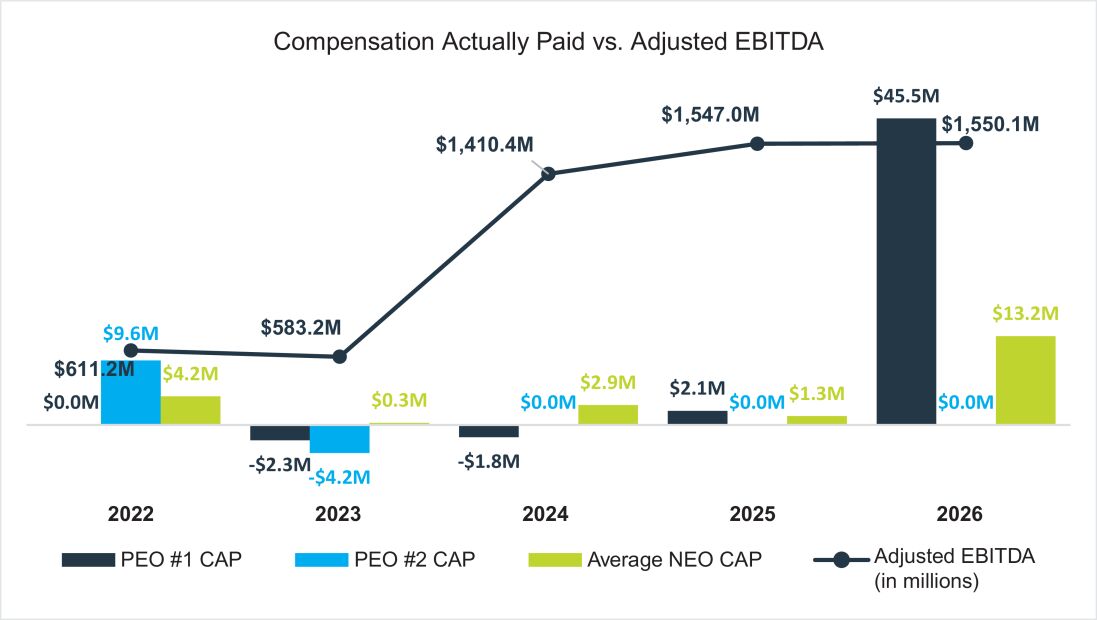
The following table sets forth information concerning the compensation of our principal executive officer(s) (“PEO(s)”) and Named Executive Officers (“NEOs”), with certain adjustments to reflect “compensation actually paid” to such individuals, as defined under SEC rules, for each of the fiscal years ended March 31, 2026, 2025, 2024, 2023 and 2022, our cumulative total shareholder return (“TSR”), the cumulative TSR of our peer group, net income (loss) and Adjusted EBITDA for each such fiscal year in accordance with SEC rules:
Value of Initial Fixed $100 Investment Based on: |
||||||||||||||||||||||||||||||||||||||||||||||||||
Fiscal Year |
Summary Compensation Table Total for First PEO (Mr. Dankberg) ($) |
Compensation Actually Paid to First PEO (Mr. Dankberg) ($) (1)(2) |
Summary Compensation Table Total for Second PEO (Mr. Baldridge) ($) |
Compensation Actually Paid to Second PEO (Mr. Baldridge) ($) (1)(2) |
Average Summary Compensation Table Total for Non-PEO NEOs ($) |
Average Compensation Actually Paid to Non-PEO NEOs ($) (1)(2) |
Total Shareholder Return ($) |
Peer Group Total Shareholder Return ($) (3) |
Net Income (Loss) ($) (in thousands) (4) |
Adjusted EBITDA ($) (in thousands) (5)(6) | ||||||||||||||||||||||||||||||||||||||||
2026 |
14,208,178 |
45,460,706 |
N/A |
N/A |
4,657,935 |
13,152,513 |
95.28 |
111.66 |
(34,086) |
1,550,082 |
||||||||||||||||||||||||||||||||||||||||
2025 |
7,882,902 |
2,075,420 |
N/A |
N/A |
3,323,121 |
1,304,729 |
21.68 |
102.98 |
(574,962) |
1,546,970 |
||||||||||||||||||||||||||||||||||||||||
2024 |
8,960,679 |
(1,818,672) |
N/A |
N/A |
6,586,506 |
2,940,276 |
37.63 |
82.84 |
(1,068,904) |
1,410,414 |
||||||||||||||||||||||||||||||||||||||||
2023 |
6,996,915 |
(2,285,665) |
4,854,625 |
(4,154,098) |
2,211,338 |
312,927 |
70.40 |
81.98 |
1,084,806 |
583,170 |
||||||||||||||||||||||||||||||||||||||||
(1) |
Amounts represent compensation actually paid to our PEO(s) and the average compensation actually paid to our remaining NEOs for the relevant fiscal year, as determined under SEC rules (and described below), which includes the individuals indicated in the table below for each fiscal year: |
Fiscal Year |
First PEO |
Second PEO |
Non-PEO NEOs | |||
2026 |
Mark Dankberg |
N/A |
Garrett Chase, Girish Chandran, Craig Miller and Robert Blair | |||
2025 |
Mark Dankberg |
N/A |
Garrett Chase, Shawn Duffy, Girish Chandran, James Dodd, Craig Miller, Evan Dixon and K. Guru Gowrappan | |||
2024 |
Mark Dankberg |
N/A |
Shawn Duffy, K. Guru Gowrappan, Kevin Harkenrider, Craig Miller and Dave Ryan | |||
2023 |
Mark Dankberg |
Richard Baldridge |
Shawn Duffy, Kevin Harkenrider, Craig Miller and Mark Miller | |||
2022 |
N/A |
Richard Baldridge |
Mark Dankberg, Shawn Duffy, Kevin Harkenrider and Mark Miller |
(2) |
Compensation actually paid to our NEOs represents the “Total” compensation reported in the Summary Compensation Table for fiscal year 2026, as adjusted as follows: |
Adjustments(a) |
PEO (Mr. Dankberg) |
Average Non-PEO NEOs | ||||||||
Deduction for Amounts Reported under the “Stock Awards” and “Option Awards” Columns in the Summary Compensation Table for Applicable FY |
(10,305,390 ) |
(2,915,192 ) |
||||||||
Increase based on ASC 718 Fair Value of Awards Granted during Applicable FY that Remain Unvested as of Applicable FY End, determined as of Applicable FY End |
16,746,596 |
4,559,250 |
||||||||
Increase based on ASC 718 Fair Value of Awards Granted during Applicable FY that Vested during Applicable FY, determined as of Vesting Date |
— |
— |
||||||||
Increase/(deduction) for Awards Granted during Prior FYs that were Outstanding and Unvested as of Applicable FY End, determined based on change in ASC 718 Fair Value from Prior FY End to Applicable FY End |
22,441,183 |
5,712,097 |
||||||||
Increase/(deduction) for Awards Granted during Prior FYs that Vested During Applicable FY, determined based on change in ASC 718 Fair Value from Prior FY End to Vesting Date |
2,370,139 |
1,138,423 |
||||||||
COMPENSATION ACTUALLY PAID |
45,460,706 |
13,152,513 |
||||||||
(a) |
Fair value or change in fair value, as applicable, of equity awards in the Compensation Actually Paid columns was determined by reference to (1) for RSU awards, the closing price of a share of our common stock on the vesting date or applicable fiscal year end date, (2) for performance stock options and the TSR performance stock units, using a Monte Carlo simulation as of the applicable vesting date or applicable fiscal year end date which considered the likelihood of achieving the vesting conditions with respect to any relative TSR market condition, and (3) for performance stock units tied to financial performance, the closing price of a |
share of our common stock on the fiscal year end date multiplied by the probability of achievement as of such date. Assumptions used in the Monte -Carlo simulations performed for performance stock options provided for an average remaining contractual term assumption of 1.1 years, an average volatility assumption of 83.09% using the Company’s historical volatility, and an average risk-free interest rate 3.63%, based on the yields of U.S. Treasury securities with maturities approximating the terms of the awards. Assumptions used in the Black-Scholes model performed for performance stock options which have been earned provided for a remaining contractual term assumption ranging between 1.0 - 1.6 years, a volatility assumption ranging between 79.62% - 94.42% using the Company’s historical volatility, and a risk-free interest rate ranging between 3.57% - 3.62%, based on the yields of U.S. Treasury securities with maturities approximating the terms of the awards. Assumptions used in the Monte-Carlo simulations performed for TSR performance stock units provided for an average volatility assumption of 85.22% using the Company’s historical volatility and a risk-free interest rate of 3.68%, based on the yields of U.S. Treasury securities with maturities approximating the terms of the awards. For additional information on the valuation assumptions used in the calculation of these amounts, refer to note 8 to the financial statements included in our annual report on Form 10-K for the fiscal year ended March 31, 2026, as filed with the SEC. |
(3) |
For the relevant fiscal year, represents the cumulative TSR (the “Peer Group TSR”) of the Nasdaq Telecommunications Index (the “Peer Group”). |
(4) |
Represents net income (loss) attributable to Viasat, Inc. Net income (loss) attributable to Viasat, Inc. for fiscal years 2024, 2023 and 2022 includes net income (loss) from discontinued operations. Net income (loss) from continuing operations attributable to Viasat, Inc. would have been ($1,058.5) million, ($217.6) million and ($114.7) million for 2024, 2023 and 2022, respectively. |
(5) |
Adjusted EBITDA is a non-GAAP measure. We define Adjusted EBITDA as earnings before interest, income taxes, depreciation and amortization, as further adjusted to exclude certain non-cash items and non-recurring expenses such as stock-based compensation expense, acquisition and transaction related expenses, loss or gain on disposition of certain assets and/or related businesses, product lines or other similar investments, loss or gain on debt extinguishment, and nonrecurring impairment of satellites and networking assets. We use Adjusted EBITDA to evaluate our operating performance, to allocate resources and capital, to measure performance for incentive compensation programs and to evaluate future growth opportunities. An itemized reconciliation between net income (loss) attributable to Viasat, Inc. and Adjusted EBITDA for fiscal years 2026, 2025, 2024, 2023 and 2022 is set forth below. |
Fiscal Year Ended March 31, 2026 |
Fiscal Year Ended March 31, 2025 |
Fiscal Year Ended March 31, 2024 |
Fiscal Year Ended March 31, 2023 |
Fiscal Year Ended March 31, 2022 |
||||||||||||||||
(In thousands) |
||||||||||||||||||||
GAAP net income (loss) attributable to Viasat, Inc. |
$(34,086) |
$(574,962) |
$(1,068,904) |
$1,084,806 |
$(15,534) |
|||||||||||||||
Provision for (benefit from) income taxes |
116,223 |
(941) |
(140,052) |
474,574 |
(14,237) |
|||||||||||||||
Interest expense (income), net |
154,401 |
338,024 |
304,140 |
7,297 |
28,887 |
|||||||||||||||
Depreciation and amortization (3) |
1,359,159 |
1,360,807 |
1,157,524 |
500,377 |
495,447 |
|||||||||||||||
Stock-based compensation expense |
81,070 |
80,385 |
83,631 |
84,459 |
86,808 |
|||||||||||||||
Acquisition and transaction related expenses (1) |
24,392 |
64,467 |
157,579 |
93,548 |
33,965 |
|||||||||||||||
Ground network (FY25), satellite (FY24) impairment and related charges, net |
— |
169,400 |
905,496 |
— |
— |
|||||||||||||||
Loss (gain) on extinguishment of debt, net |
11,935 |
99,814 |
— |
— |
— |
|||||||||||||||
Other (income) expense, net |
(163,012) |
9,976 |
— |
— |
(4,118) |
|||||||||||||||
Loss (gain) on the Link-16 TDL Sale |
— |
— |
11,000 |
(1,661,891) |
— |
|||||||||||||||
Adjusted EBITDA (2) |
$1,550,082 |
$ 1,546,970 |
$1,410,414 |
$ 583,170 |
$611,218 |
|||||||||||||||
(1) |
Costs typically consist of acquisition, integration, and disposition related costs. |
(2) |
Amounts include both continuing and discontinued operations , Link-16 TDL Sale. |
(3) |
Including amortization of capitalized cloud computing implementation costs. |
(6) |
Adjusted EBITDA for fiscal years 2024, 2023 and 2022 includes adjustments attributable to the Link-16 TDL Business, which was sold to L3 Harris on January 3, 2023. Adjusted EBITDA from continuing operations, which would have excluded this business, would have been $1,410.4 million, $501.1 million and $475.8 million for 2024, 2023 and 2022, respectively. |
(1) |
Amounts represent compensation actually paid to our PEO(s) and the average compensation actually paid to our remaining NEOs for the relevant fiscal year, as determined under SEC rules (and described below), which includes the individuals indicated in the table below for each fiscal year: |
Fiscal Year |
First PEO |
Second PEO |
Non-PEO NEOs | |||
2026 |
Mark Dankberg |
N/A |
Garrett Chase, Girish Chandran, Craig Miller and Robert Blair | |||
2025 |
Mark Dankberg |
N/A |
Garrett Chase, Shawn Duffy, Girish Chandran, James Dodd, Craig Miller, Evan Dixon and K. Guru Gowrappan | |||
2024 |
Mark Dankberg |
N/A |
Shawn Duffy, K. Guru Gowrappan, Kevin Harkenrider, Craig Miller and Dave Ryan | |||
2023 |
Mark Dankberg |
Richard Baldridge |
Shawn Duffy, Kevin Harkenrider, Craig Miller and Mark Miller | |||
2022 |
N/A |
Richard Baldridge |
Mark Dankberg, Shawn Duffy, Kevin Harkenrider and Mark Miller |
(2) |
Compensation actually paid to our NEOs represents the “Total” compensation reported in the Summary Compensation Table for fiscal year 2026, as adjusted as follows: |
Adjustments(a) |
PEO (Mr. Dankberg) |
Average Non-PEO NEOs | ||||||||
Deduction for Amounts Reported under the “Stock Awards” and “Option Awards” Columns in the Summary Compensation Table for Applicable FY |
(10,305,390 ) |
(2,915,192 ) |
||||||||
Increase based on ASC 718 Fair Value of Awards Granted during Applicable FY that Remain Unvested as of Applicable FY End, determined as of Applicable FY End |
16,746,596 |
4,559,250 |
||||||||
Increase based on ASC 718 Fair Value of Awards Granted during Applicable FY that Vested during Applicable FY, determined as of Vesting Date |
— |
— |
||||||||
Increase/(deduction) for Awards Granted during Prior FYs that were Outstanding and Unvested as of Applicable FY End, determined based on change in ASC 718 Fair Value from Prior FY End to Applicable FY End |
22,441,183 |
5,712,097 |
||||||||
Increase/(deduction) for Awards Granted during Prior FYs that Vested During Applicable FY, determined based on change in ASC 718 Fair Value from Prior FY End to Vesting Date |
2,370,139 |
1,138,423 |
||||||||
COMPENSATION ACTUALLY PAID |
45,460,706 |
13,152,513 |
||||||||
(2) |
Compensation actually paid to our NEOs represents the “Total” compensation reported in the Summary Compensation Table for fiscal year 2026, as adjusted as follows: |
Adjustments(a) |
PEO (Mr. Dankberg) |
Average Non-PEO NEOs | ||||||||
Deduction for Amounts Reported under the “Stock Awards” and “Option Awards” Columns in the Summary Compensation Table for Applicable FY |
(10,305,390 ) |
(2,915,192 ) |
||||||||
Increase based on ASC 718 Fair Value of Awards Granted during Applicable FY that Remain Unvested as of Applicable FY End, determined as of Applicable FY End |
16,746,596 |
4,559,250 |
||||||||
Increase based on ASC 718 Fair Value of Awards Granted during Applicable FY that Vested during Applicable FY, determined as of Vesting Date |
— |
— |
||||||||
Increase/(deduction) for Awards Granted during Prior FYs that were Outstanding and Unvested as of Applicable FY End, determined based on change in ASC 718 Fair Value from Prior FY End to Applicable FY End |
22,441,183 |
5,712,097 |
||||||||
Increase/(deduction) for Awards Granted during Prior FYs that Vested During Applicable FY, determined based on change in ASC 718 Fair Value from Prior FY End to Vesting Date |
2,370,139 |
1,138,423 |
||||||||
COMPENSATION ACTUALLY PAID |
45,460,706 |
13,152,513 |
||||||||
Pay Versus Performance Tabular List
We believe the following performance measures represent the most important financial performance measures used by us to link compensation actually paid to our NEOs for the fiscal year ended March 31, 2026:
• |
Revenue |
• |
Adjusted EBITDA |
• |
TSR Relative to the Russell 3000 Index |
• |
Stock Price |
• |
Free Cash Flow |
• |
Capital Expenditures |
(5) |
Adjusted EBITDA is a non-GAAP measure. We define Adjusted EBITDA as earnings before interest, income taxes, depreciation and amortization, as further adjusted to exclude certain non-cash items and non-recurring expenses such as stock-based compensation expense, acquisition and transaction related expenses, loss or gain on disposition of certain assets and/or related businesses, product lines or other similar investments, loss or gain on debt extinguishment, and nonrecurring impairment of satellites and networking assets. We use Adjusted EBITDA to evaluate our operating performance, to allocate resources and capital, to measure performance for incentive compensation programs and to evaluate future growth opportunities. An itemized reconciliation between net income (loss) attributable to Viasat, Inc. and Adjusted EBITDA for fiscal years 2026, 2025, 2024, 2023 and 2022 is set forth below. |
Fiscal Year Ended March 31, 2026 |
Fiscal Year Ended March 31, 2025 |
Fiscal Year Ended March 31, 2024 |
Fiscal Year Ended March 31, 2023 |
Fiscal Year Ended March 31, 2022 |
||||||||||||||||
(In thousands) |
||||||||||||||||||||
GAAP net income (loss) attributable to Viasat, Inc. |
$(34,086) |
$(574,962) |
$(1,068,904) |
$1,084,806 |
$(15,534) |
|||||||||||||||
Provision for (benefit from) income taxes |
116,223 |
(941) |
(140,052) |
474,574 |
(14,237) |
|||||||||||||||
Interest expense (income), net |
154,401 |
338,024 |
304,140 |
7,297 |
28,887 |
|||||||||||||||
Depreciation and amortization (3) |
1,359,159 |
1,360,807 |
1,157,524 |
500,377 |
495,447 |
|||||||||||||||
Stock-based compensation expense |
81,070 |
80,385 |
83,631 |
84,459 |
86,808 |
|||||||||||||||
Acquisition and transaction related expenses (1) |
24,392 |
64,467 |
157,579 |
93,548 |
33,965 |
|||||||||||||||
Ground network (FY25), satellite (FY24) impairment and related charges, net |
— |
169,400 |
905,496 |
— |
— |
|||||||||||||||
Loss (gain) on extinguishment of debt, net |
11,935 |
99,814 |
— |
— |
— |
|||||||||||||||
Other (income) expense, net |
(163,012) |
9,976 |
— |
— |
(4,118) |
|||||||||||||||
Loss (gain) on the Link-16 TDL Sale |
— |
— |
11,000 |
(1,661,891) |
— |
|||||||||||||||
Adjusted EBITDA (2) |
$1,550,082 |
$ 1,546,970 |
$1,410,414 |
$ 583,170 |
$611,218 |
|||||||||||||||
(1) |
Costs typically consist of acquisition, integration, and disposition related costs. |
(2) |
Amounts include both continuing and discontinued operations , Link-16 TDL Sale. |
(3) |
Including amortization of capitalized cloud computing implementation costs. |