The bar chart below shows how the Fund’s investment results have varied from year to year. The table below shows how the Fund’s average annual total returns compare over time to those of a broad-based securities market index and two supplemental performance indices. This information provides some indication of the risks of investing in the Fund. Past performance of the Fund is not necessarily an indication of how it will perform in the future.
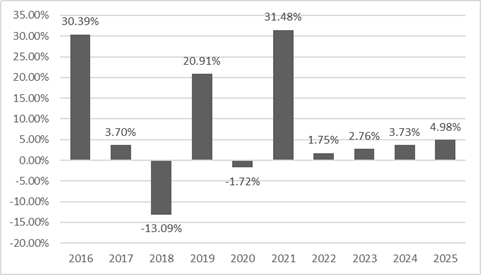
During the period shown in the bar chart, the highest return for a quarter was 27.78% for the quarter ended December 31, 2020 and the lowest return for a quarter was (36.64)% for the quarter ended March 31, 2020.
The Fund’s year to date return as of June 30, 2026 was 22.01%.
| Dean Small Cap Value Fund | 1 Year | 5 Years | 10 Years | |||
| Return Before Taxes | 4.98% | 8.41% | 7.65% | |||
| Return After Taxes on Distributions | 4.51% | 7.90% | 6.46% | |||
| Return After Taxes on Distributions and Sale of Fund Shares | 3.31% | 6.60% | 5.78% | |||
| Russell 3000® Index1 | 17.15% | 13.15% | 14.29% | |||
| Russell 2000® Value Index2 | 12.59% | 8.88% | 9.27% | |||
| Russell 2000® Index2 | 12.81% | 6.09% | 9.62% |
| 1– | The Fund’s primary index, the Russell 3000® Index, is included due to regulatory requirements for broad-based index comparison. The Russell 3000® Index measures the performance of the largest 3,000 US companies representing approximately 96% of the investable US equity market, as of the most recent reconstitution. The Russell 3000® Index is constructed to provide a comprehensive, unbiased and stable barometer of the broad market and is completely reconstituted annually to ensure new and growing equities are included. The Russell 3000® Index is representative of a broader market and range of securities than are found in the Fund’s portfolio. Individuals cannot invest directly in an index. |
| 2– | The Russell 2000® Index is an equity index that measures the performance of the 2,000 smallest companies in the Russell 3000® Index, which is made up of 3,000 of the largest U.S. companies. The Russell 2000® Value Index is an unmanaged index of common stock prices that measures the performance of those Russell 2000 companies with lower price-to-book ratios and lower relative forecasted growth rates. The indices are representative of a broader market and range of securities than are found in the Fund’s portfolio. Individuals cannot invest directly in an index; however, an individual can invest in exchange-traded funds or other investment vehicles that attempt to track the performance of a benchmark index. |
After-tax returns are calculated using the historical highest individual federal income tax rates in effect and do not reflect the impact of state and local taxes. Actual after-tax returns depend on an investor’s tax situation and may differ from those shown. After-tax returns shown are not relevant to investors who hold their Fund shares through tax-deferred arrangements, such as 401(k) plans or IRAs.
Current performance of the Fund may be lower or higher than the performance quoted above. Updated performance information may be obtained by calling (888) 899-8343 or accessed on the Fund’s website at https://deanmutualfunds.com.
The bar chart below shows how the Fund’s investment results have varied from year to year. The table below shows how the Fund’s average annual total returns compare over time to those of a broad-based securities market index and two supplemental performance indices. This information provides some indication of the risks of investing in the Fund. Past performance of the Fund is not necessarily an indication of how it will perform in the future.
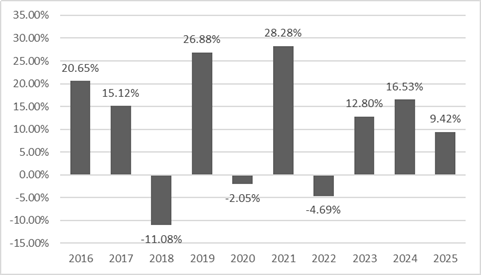
During the period shown in the bar chart, the highest return for a quarter was 18.25% for the quarter ended December 31, 2020, and the lowest return for a quarter was (30.84)% for the quarter ended March 31, 2020.
The Fund’s year to date return as of June 30, 2026 was 14.21%.
| Dean Mid Cap Value Fund | 1 Year | 5 Years | 10 Years | |||
| Return Before Taxes | 9.42% | 11.95% | 10.44% | |||
| Return After Taxes on Distributions | 7.93% | 10.47% | 9.32% | |||
| Return After Taxes on Distributions and Sale of Fund Shares | 6.67% | 9.35% | 8.40% | |||
| Russell 3000® Index1 | 17.15% | 13.15% | 14.29% | |||
| Russell Midcap® Value Index2 | 11.05% | 9.83% | 9.78% | |||
| Russell Midcap® Index2 | 10.60% | 8.67% | 11.01% |
| 1 – | The Fund’s primary index, the Russell 3000® Index, is included due to regulatory requirements for broad-based index comparison. The Russell 3000® Index measures the performance of the largest 3,000 US companies representing approximately 96% of the investable US equity market, as of the most recent reconstitution. The Russell 3000® Index is constructed to provide a comprehensive, unbiased and stable barometer of the broad market and is completely reconstituted annually to ensure new and growing equities are included. The Russell 3000® Index is representative of a broader market and range of securities than are found in the Fund’s portfolio. Individuals cannot invest directly in an index. |
| 2 - | The Russell Midcap® Index is a market capitalization weighted index representing the smallest 800 companies in the Russell 1000® Index. The Russell Midcap® Value Index is an unmanaged index of common stock prices that measures the performance of those Russell Midcap companies with lower price-to-book ratios and lower forecasted growth values. The indices are representative of a broader market and range of securities than are found in the Fund’s portfolio. An individual cannot invest directly in an index. However, an individual may be able to invest in exchange traded funds or other investment vehicles that attempt to track the performance of an index. |
After-tax returns are calculated using the historical highest individual federal income tax rates in effect and do not reflect the impact of state and local taxes. Actual after-tax returns depend on an investor’s tax situation and may differ from those shown. After-tax returns shown are not relevant to investors who hold their Fund shares through tax-deferred arrangements, such as 401(k) plans or IRAs.
Current performance of the Fund may be lower or higher than the performance quoted above. Updated performance information may be obtained by calling (888) 899-8343 or accessed on the Fund’s website at https://deanmutualfunds.com.
The bar chart below shows how the Fund’s investment results have varied from year to year. The table below shows how the Fund’s average annual total returns compare over time to those of a broad-based securities market index and a secondary performance index. This information provides some indication of the risks of investing in the Fund. Past performance of the Fund is not necessarily an indication of how it will perform in the future.
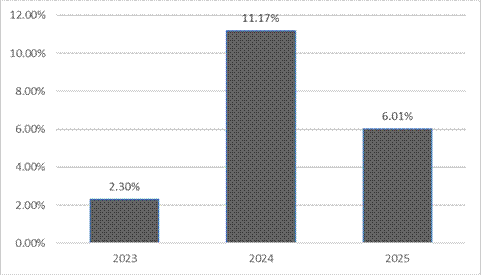
During the period shown in the bar chart, the highest return for a quarter was 11.01% for the quarter ended September 30, 2024, and the lowest return for a quarter was (4.48)% for the quarter ended September 30, 2023.
The Fund’s year to date return as of June 30, 2026 was 9.70%.
| Dean Equity Income Fund | 1 Year | Since Inception (11/22/2022) | ||
| Return Before Taxes | 6.01% | 5.69% | ||
| Return After Taxes on Distributions | 4.96% | 4.66% | ||
| Return After Taxes on Distributions and Sale of Fund Shares | 4.30% | 4.32% | ||
| Russell 1000® Index1 | 17.37% | 20.32% | ||
| Russell 1000® Value Index2 | 15.91% | 12.43% |
| 1 – | The Fund’s primary index, the Russell 1000® Index, is included due to regulatory requirements for broad-based index comparison. The Russell 1000® Index measures the performance of the large-cap segment of the US equity universe. It is a subset of the Russell 3000® Index and includes approximately 1,000 of the largest securities based on a combination of their market cap and current index membership. The Russell 1000® represents approximately 93% of the Russell 3000® Index, as of the most recent reconstitution. The Russell 1000® Index is constructed to provide a comprehensive and unbiased barometer for the large-cap segment and is completely reconstituted annually to ensure new and growing equities are included. |
| 2 – | The Russell 1000® Value Index is an unmanaged index of common stock prices that measure the performance of those Russell 1000® companies with lower price to book ratios and lower relative forecasted growth rates. The Russell 1000® Index is representative of a broader market and range of securities than are found in the Fund’s portfolio. Index returns assume reinvestment of all distributions and do not reflect the deduction of taxes and fees. Individuals cannot invest directly in an index; however, an individual may invest in exchange-traded funds or other investment vehicles that attempt to track the performance of a benchmark index. |
After-tax returns are calculated using the historical highest individual federal income tax rates in effect and do not reflect the impact of state and local taxes. Actual after-tax returns depend on an investor’s tax situation and may differ from those shown. After-tax returns shown are not relevant to investors who hold their Fund shares through tax-deferred arrangements, such as 401(k) plans or IRAs.