
The Q2 2026 Investor Update should be read in conjunction with the Q2 2026 Earnings Release issued on July 27, 2026. Investor Update Q2 2026 Exhibit 99.2
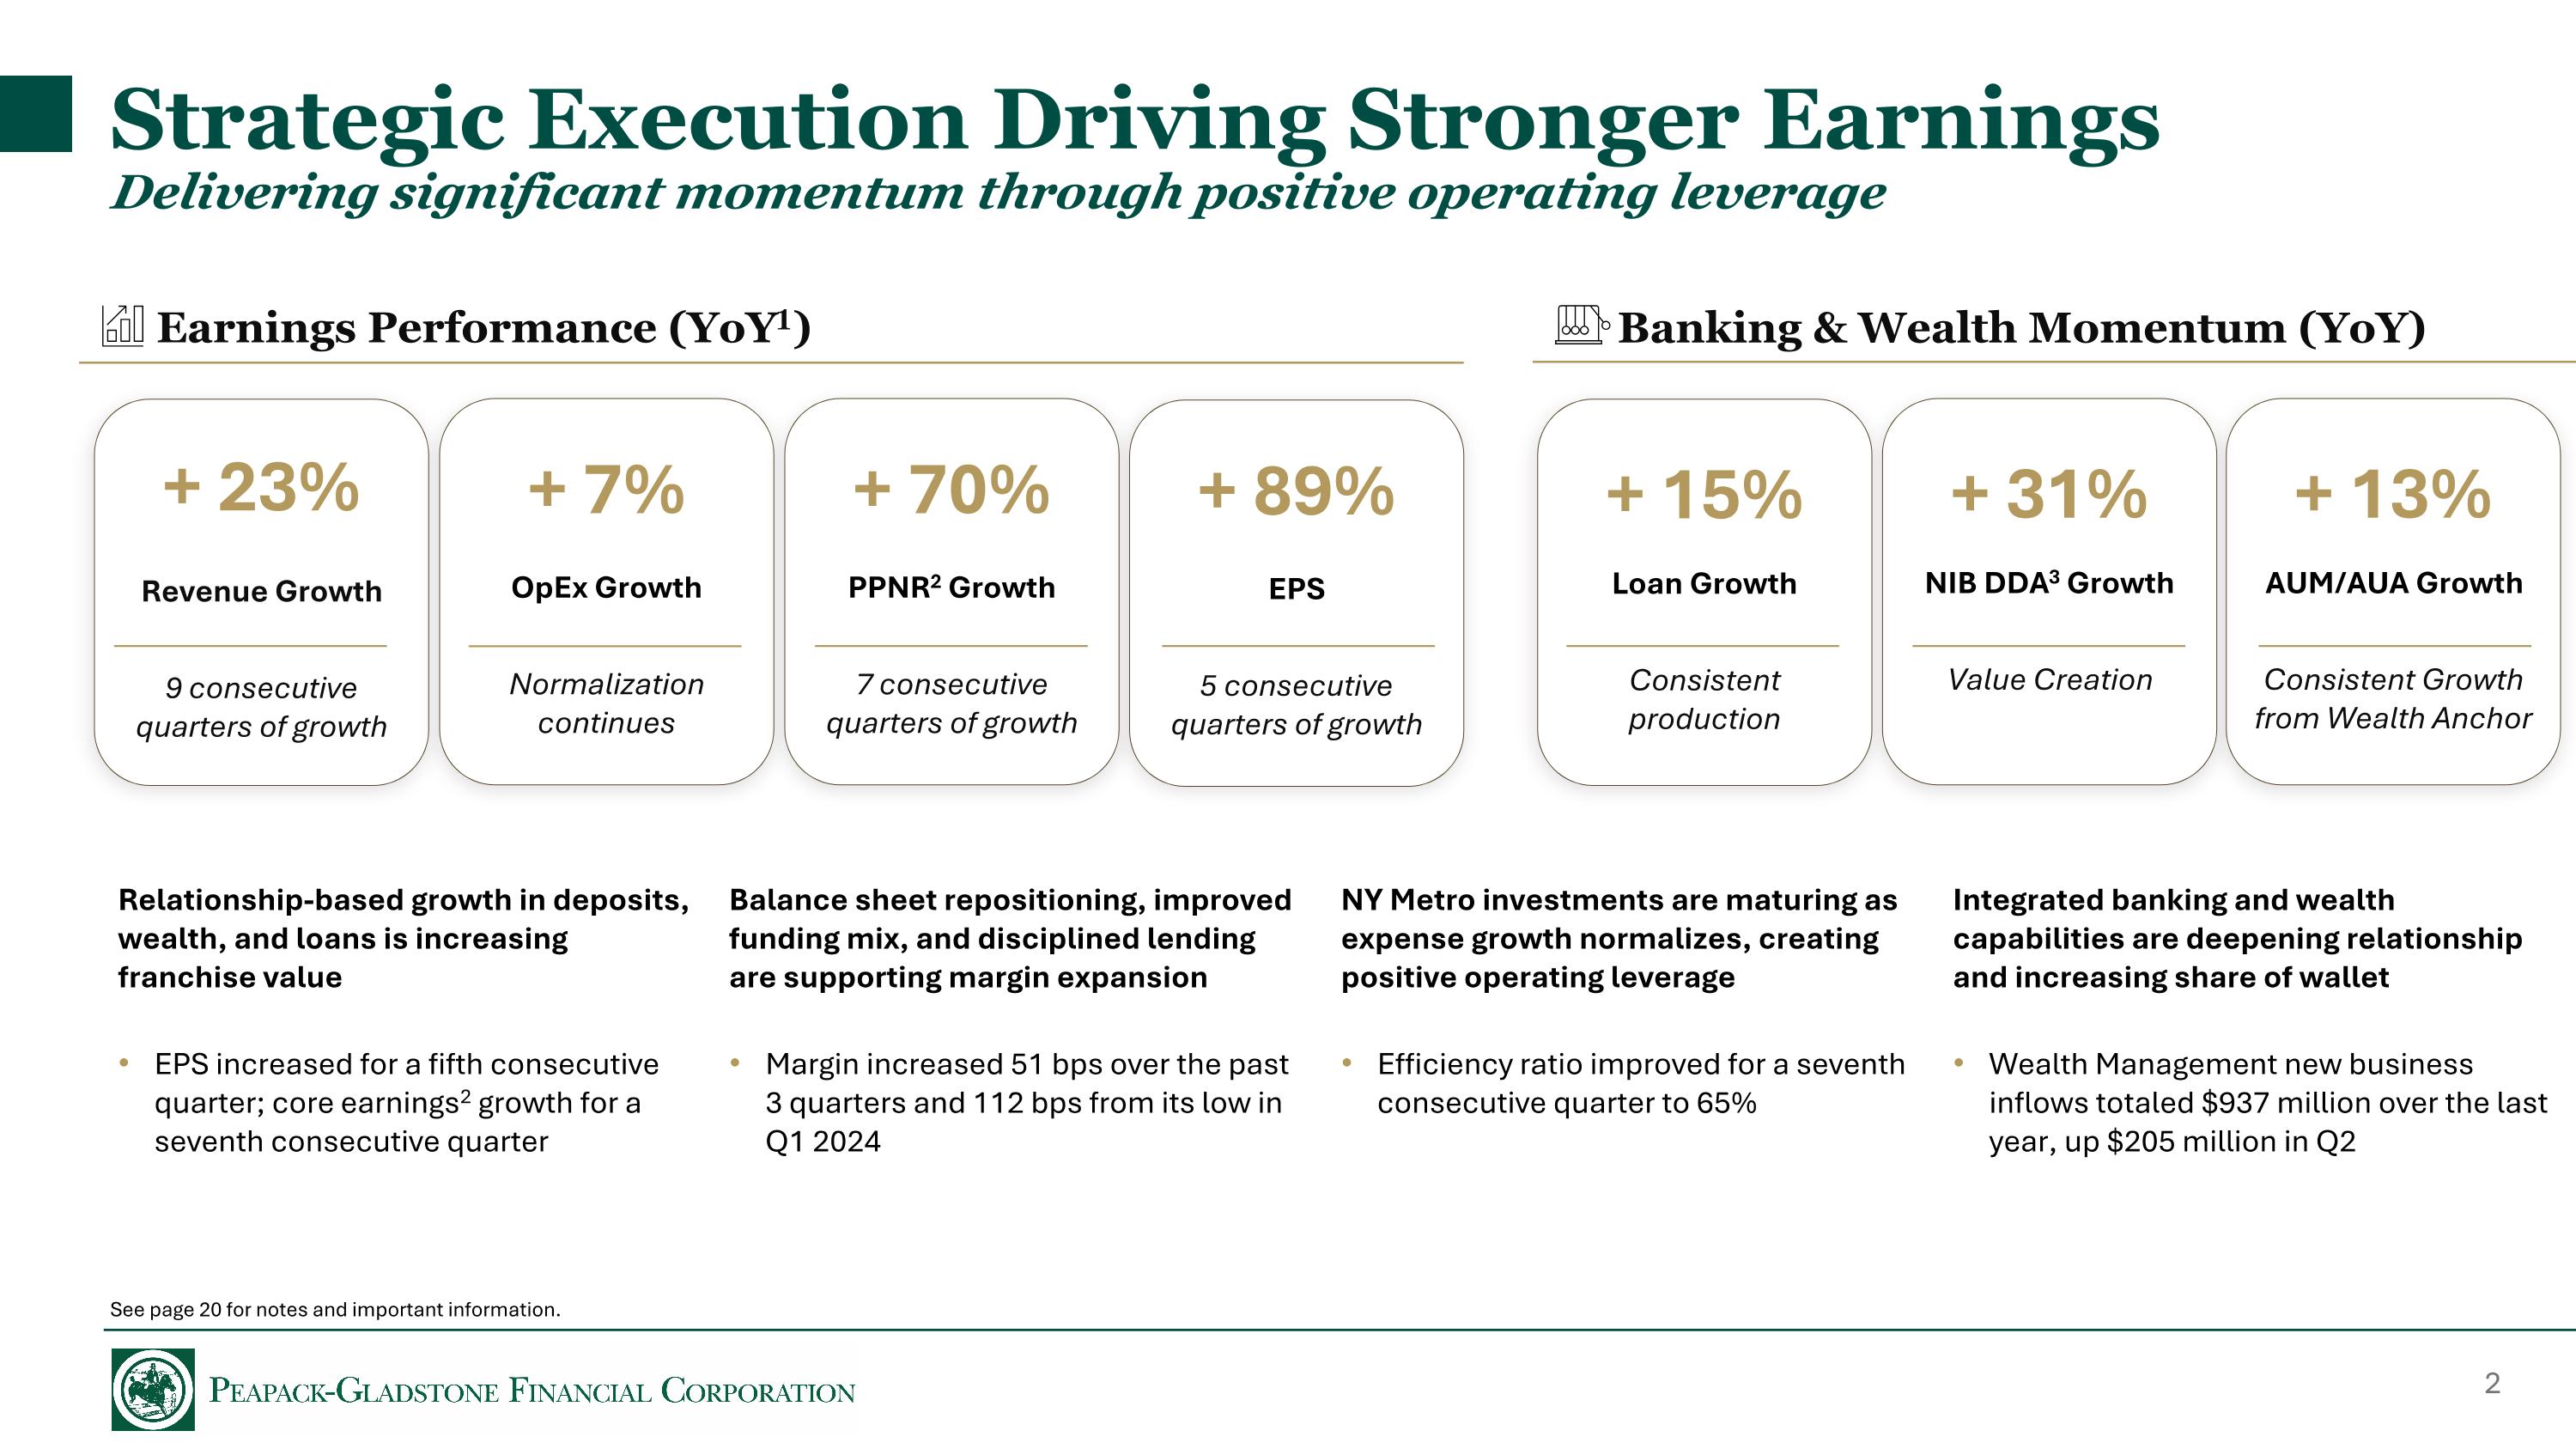
Strategic Execution Driving Stronger Earnings Delivering significant momentum through positive operating leverage See page 20 for notes and important information. Earnings Performance (YoY1) Banking & Wealth Momentum (YoY) Relationship-based growth in deposits, wealth, and loans is increasing franchise value EPS increased for a fifth consecutive quarter; core earnings2 growth for a seventh consecutive quarter + 23% Revenue Growth 9 consecutive quarters of growth + 7% OpEx Growth Normalization continues + 70% PPNR2 Growth 7 consecutive quarters of growth + 89% EPS 5 consecutive quarters of growth + 13% AUM/AUA Growth Consistent Growth from Wealth Anchor + 31% NIB DDA3 Growth Value Creation + 15% Loan Growth Consistent production NY Metro investments are maturing as expense growth normalizes, creating positive operating leverage Efficiency ratio improved for a seventh consecutive quarter to 65% Balance sheet repositioning, improved funding mix, and disciplined lending are supporting margin expansion Margin increased 51 bps over the past 3 quarters and 112 bps from its low in Q1 2024 Integrated banking and wealth capabilities are deepening relationship and increasing share of wallet Wealth Management new business inflows totaled $937 million over the last year, up $205 million in Q2
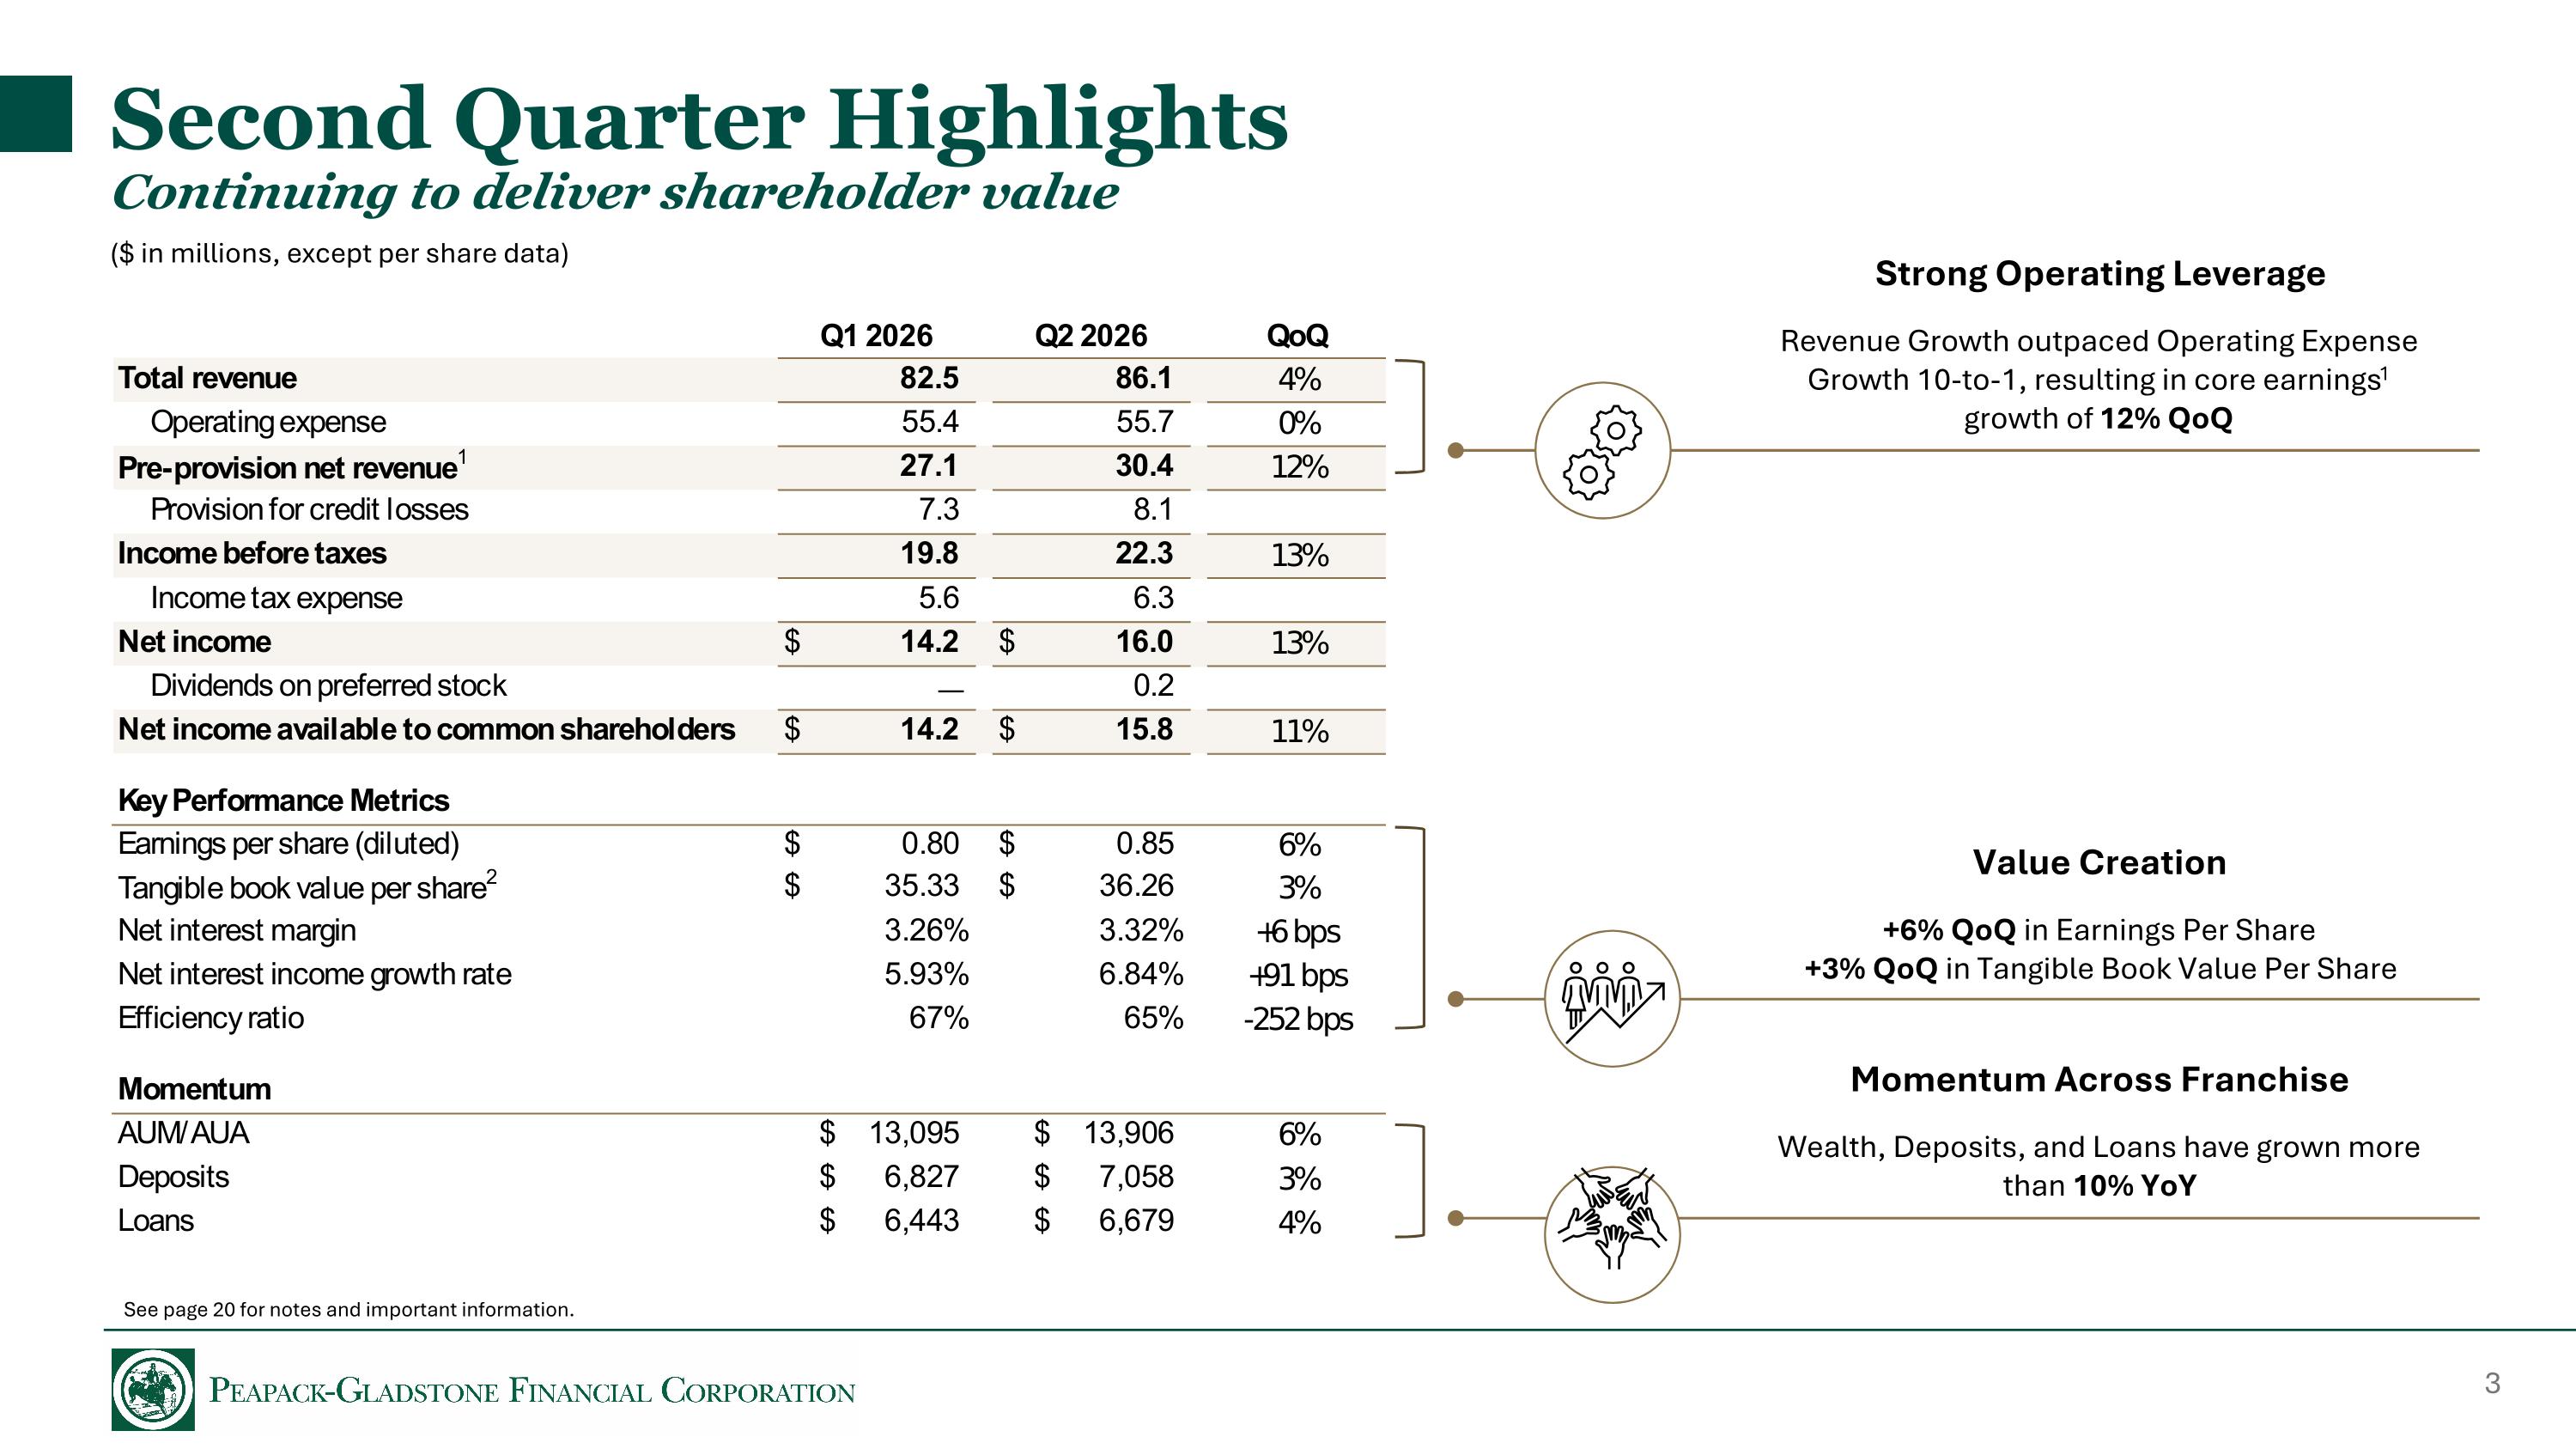
Second Quarter Highlights Continuing to deliver shareholder value ($ in millions, except per share data) See page 20 for notes and important information. Strong Operating Leverage Revenue Growth outpaced Operating Expense Growth 10-to-1, resulting in core earnings1 growth of 12% QoQ Value Creation +6% QoQ in Earnings Per Share +3% QoQ in Tangible Book Value Per Share Momentum Across Franchise Wealth, Deposits, and Loans have grown more than 10% YoY
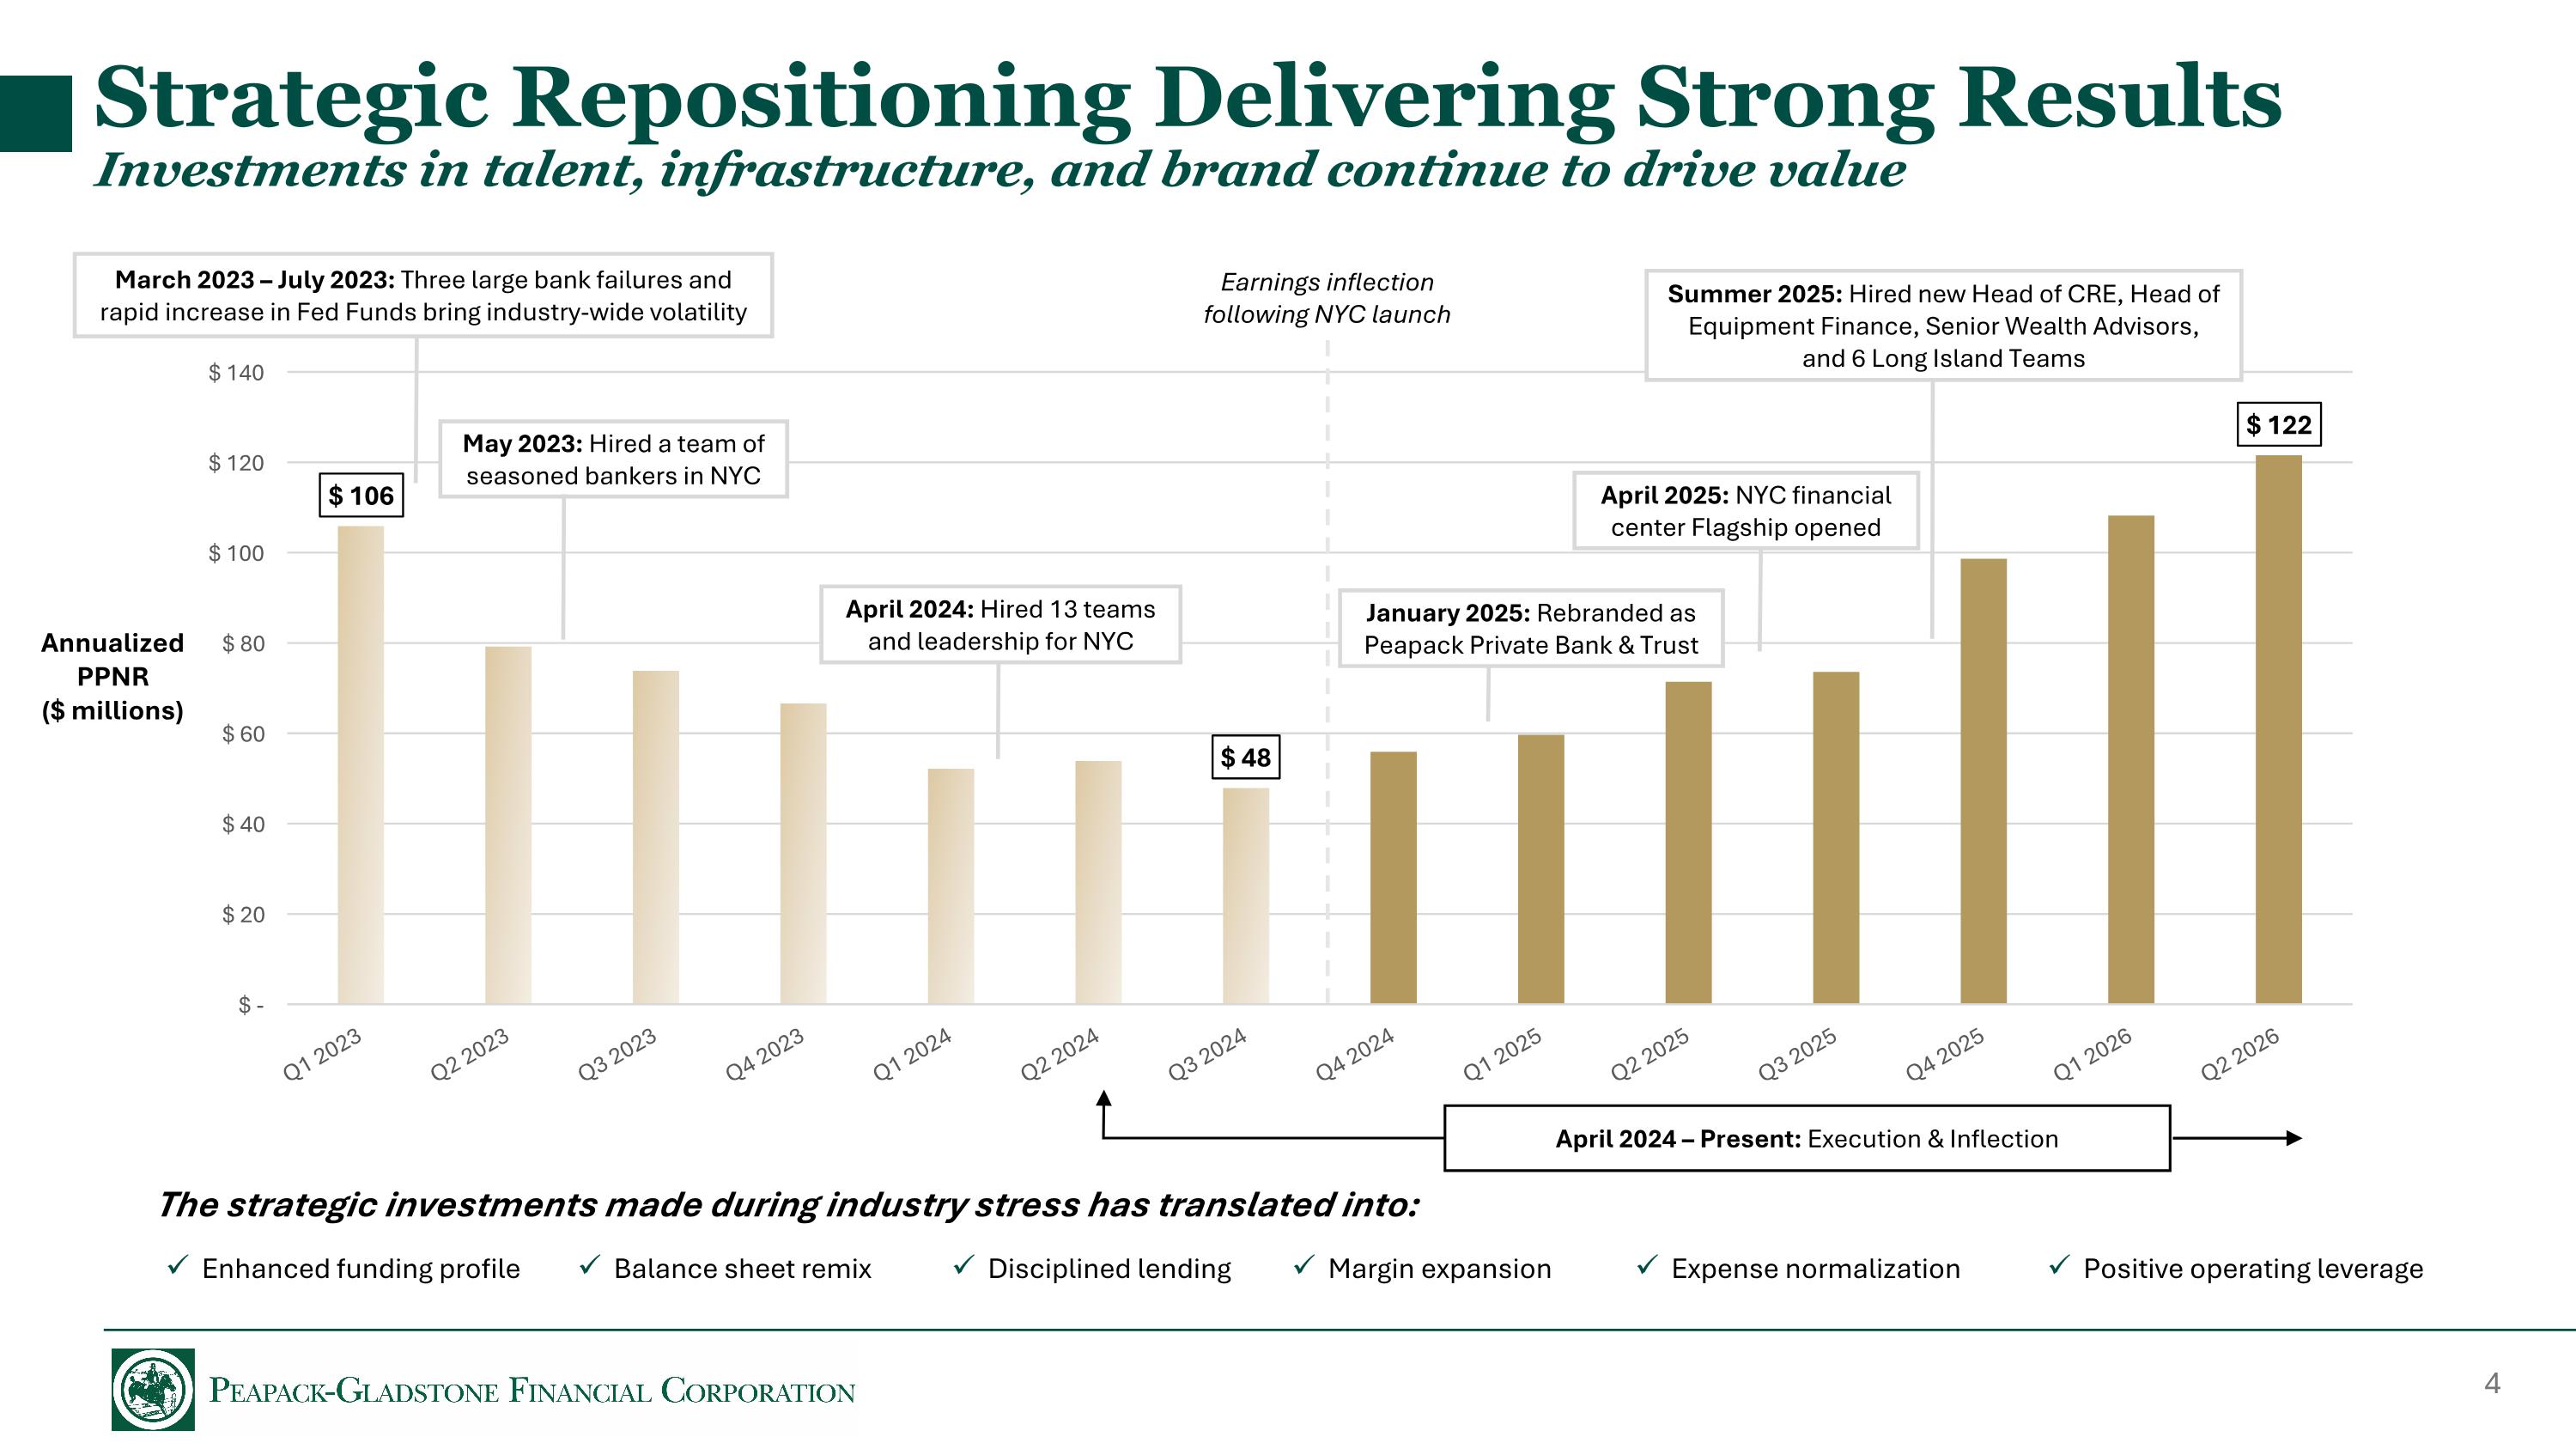
Strategic Repositioning Delivering Strong Results Investments in talent, infrastructure, and brand continue to drive value Annualized PPNR ($ millions) March 2023 – July 2023: Three large bank failures and rapid increase in Fed Funds bring industry-wide volatility April 2024: Hired 13 teams and leadership for NYC May 2023: Hired a team of seasoned bankers in NYC April 2024 – Present: Execution & Inflection April 2025: NYC financial center Flagship opened The strategic investments made during industry stress has translated into: Earnings inflection following NYC launch Summer 2025: Hired new Head of CRE, Head of Equipment Finance, Senior Wealth Advisors, and 6 Long Island Teams January 2025: Rebranded as Peapack Private Bank & Trust Enhanced funding profile Balance sheet remix Disciplined lending Margin expansion Expense normalization Positive operating leverage
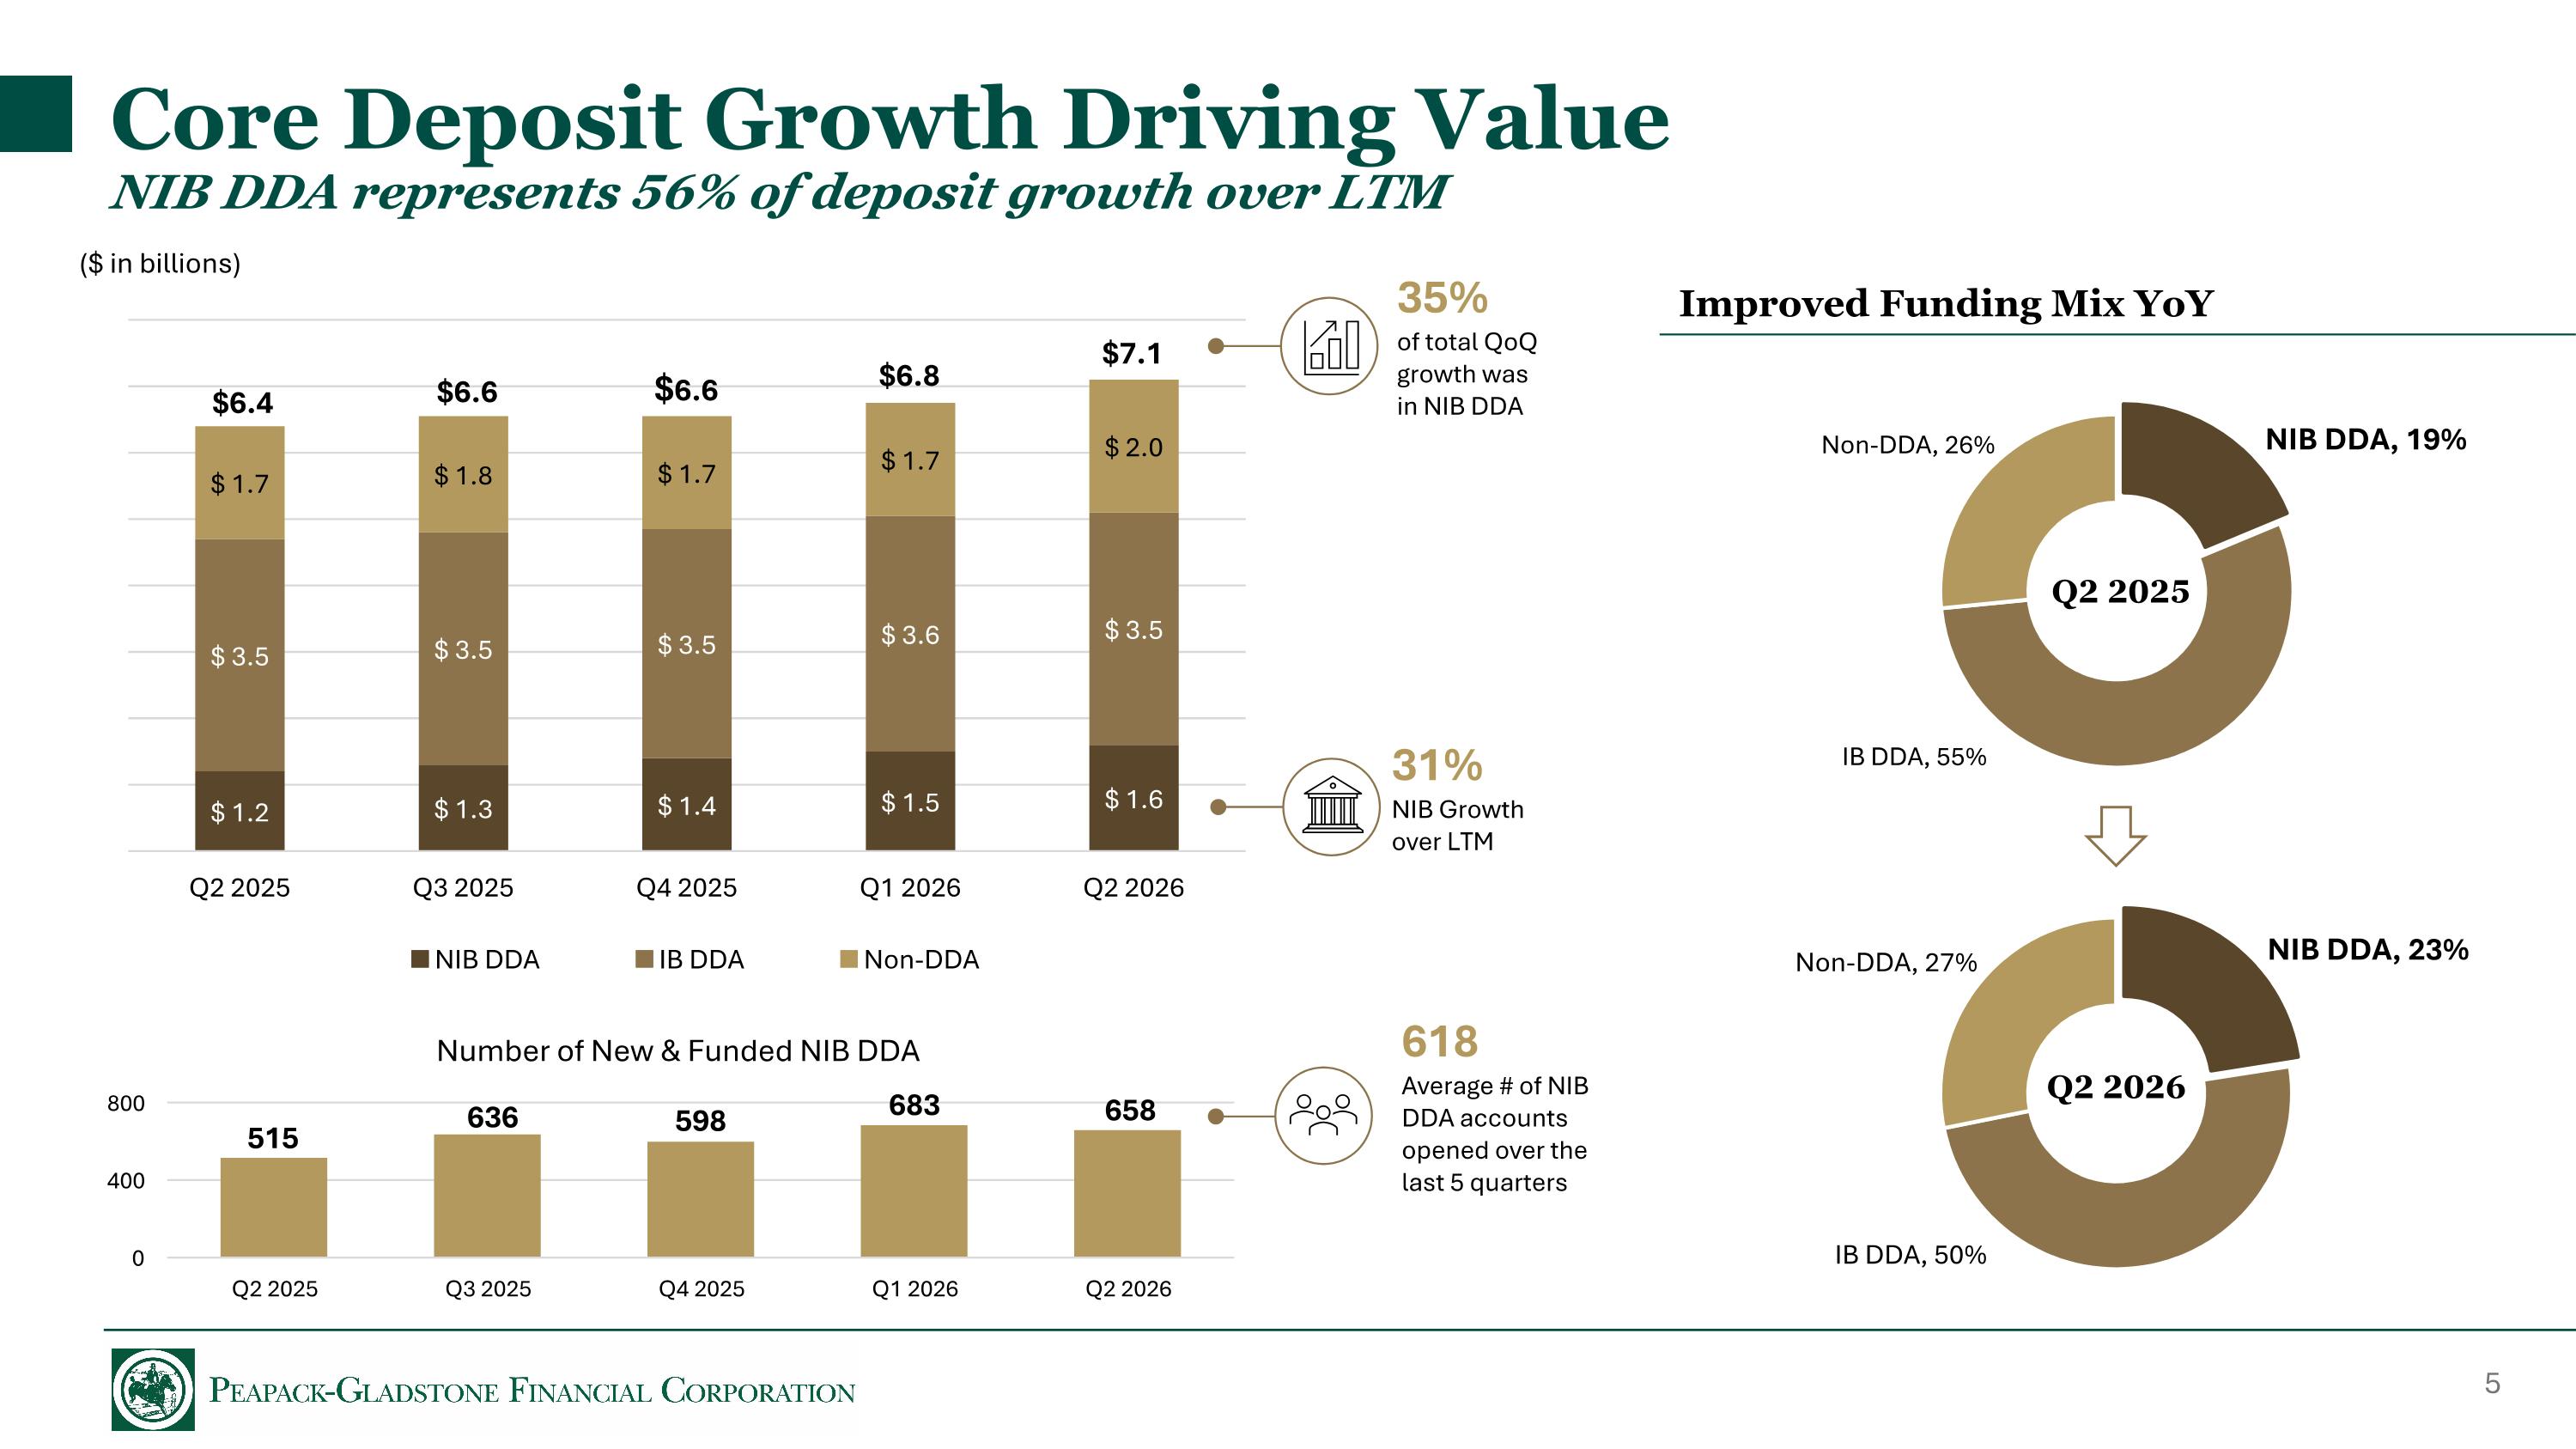
Core Deposit Growth Driving Value NIB DDA represents 56% of deposit growth over LTM $6.8 $7.1 $6.4 31% NIB Growth over LTM ($ in billions) $6.6 $6.6 618 Average # of NIB DDA accounts opened over the last 5 quarters 683 658 515 636 598 35% of total QoQ growth was in NIB DDA Q2 2026 Improved Funding Mix YoY Q2 2025
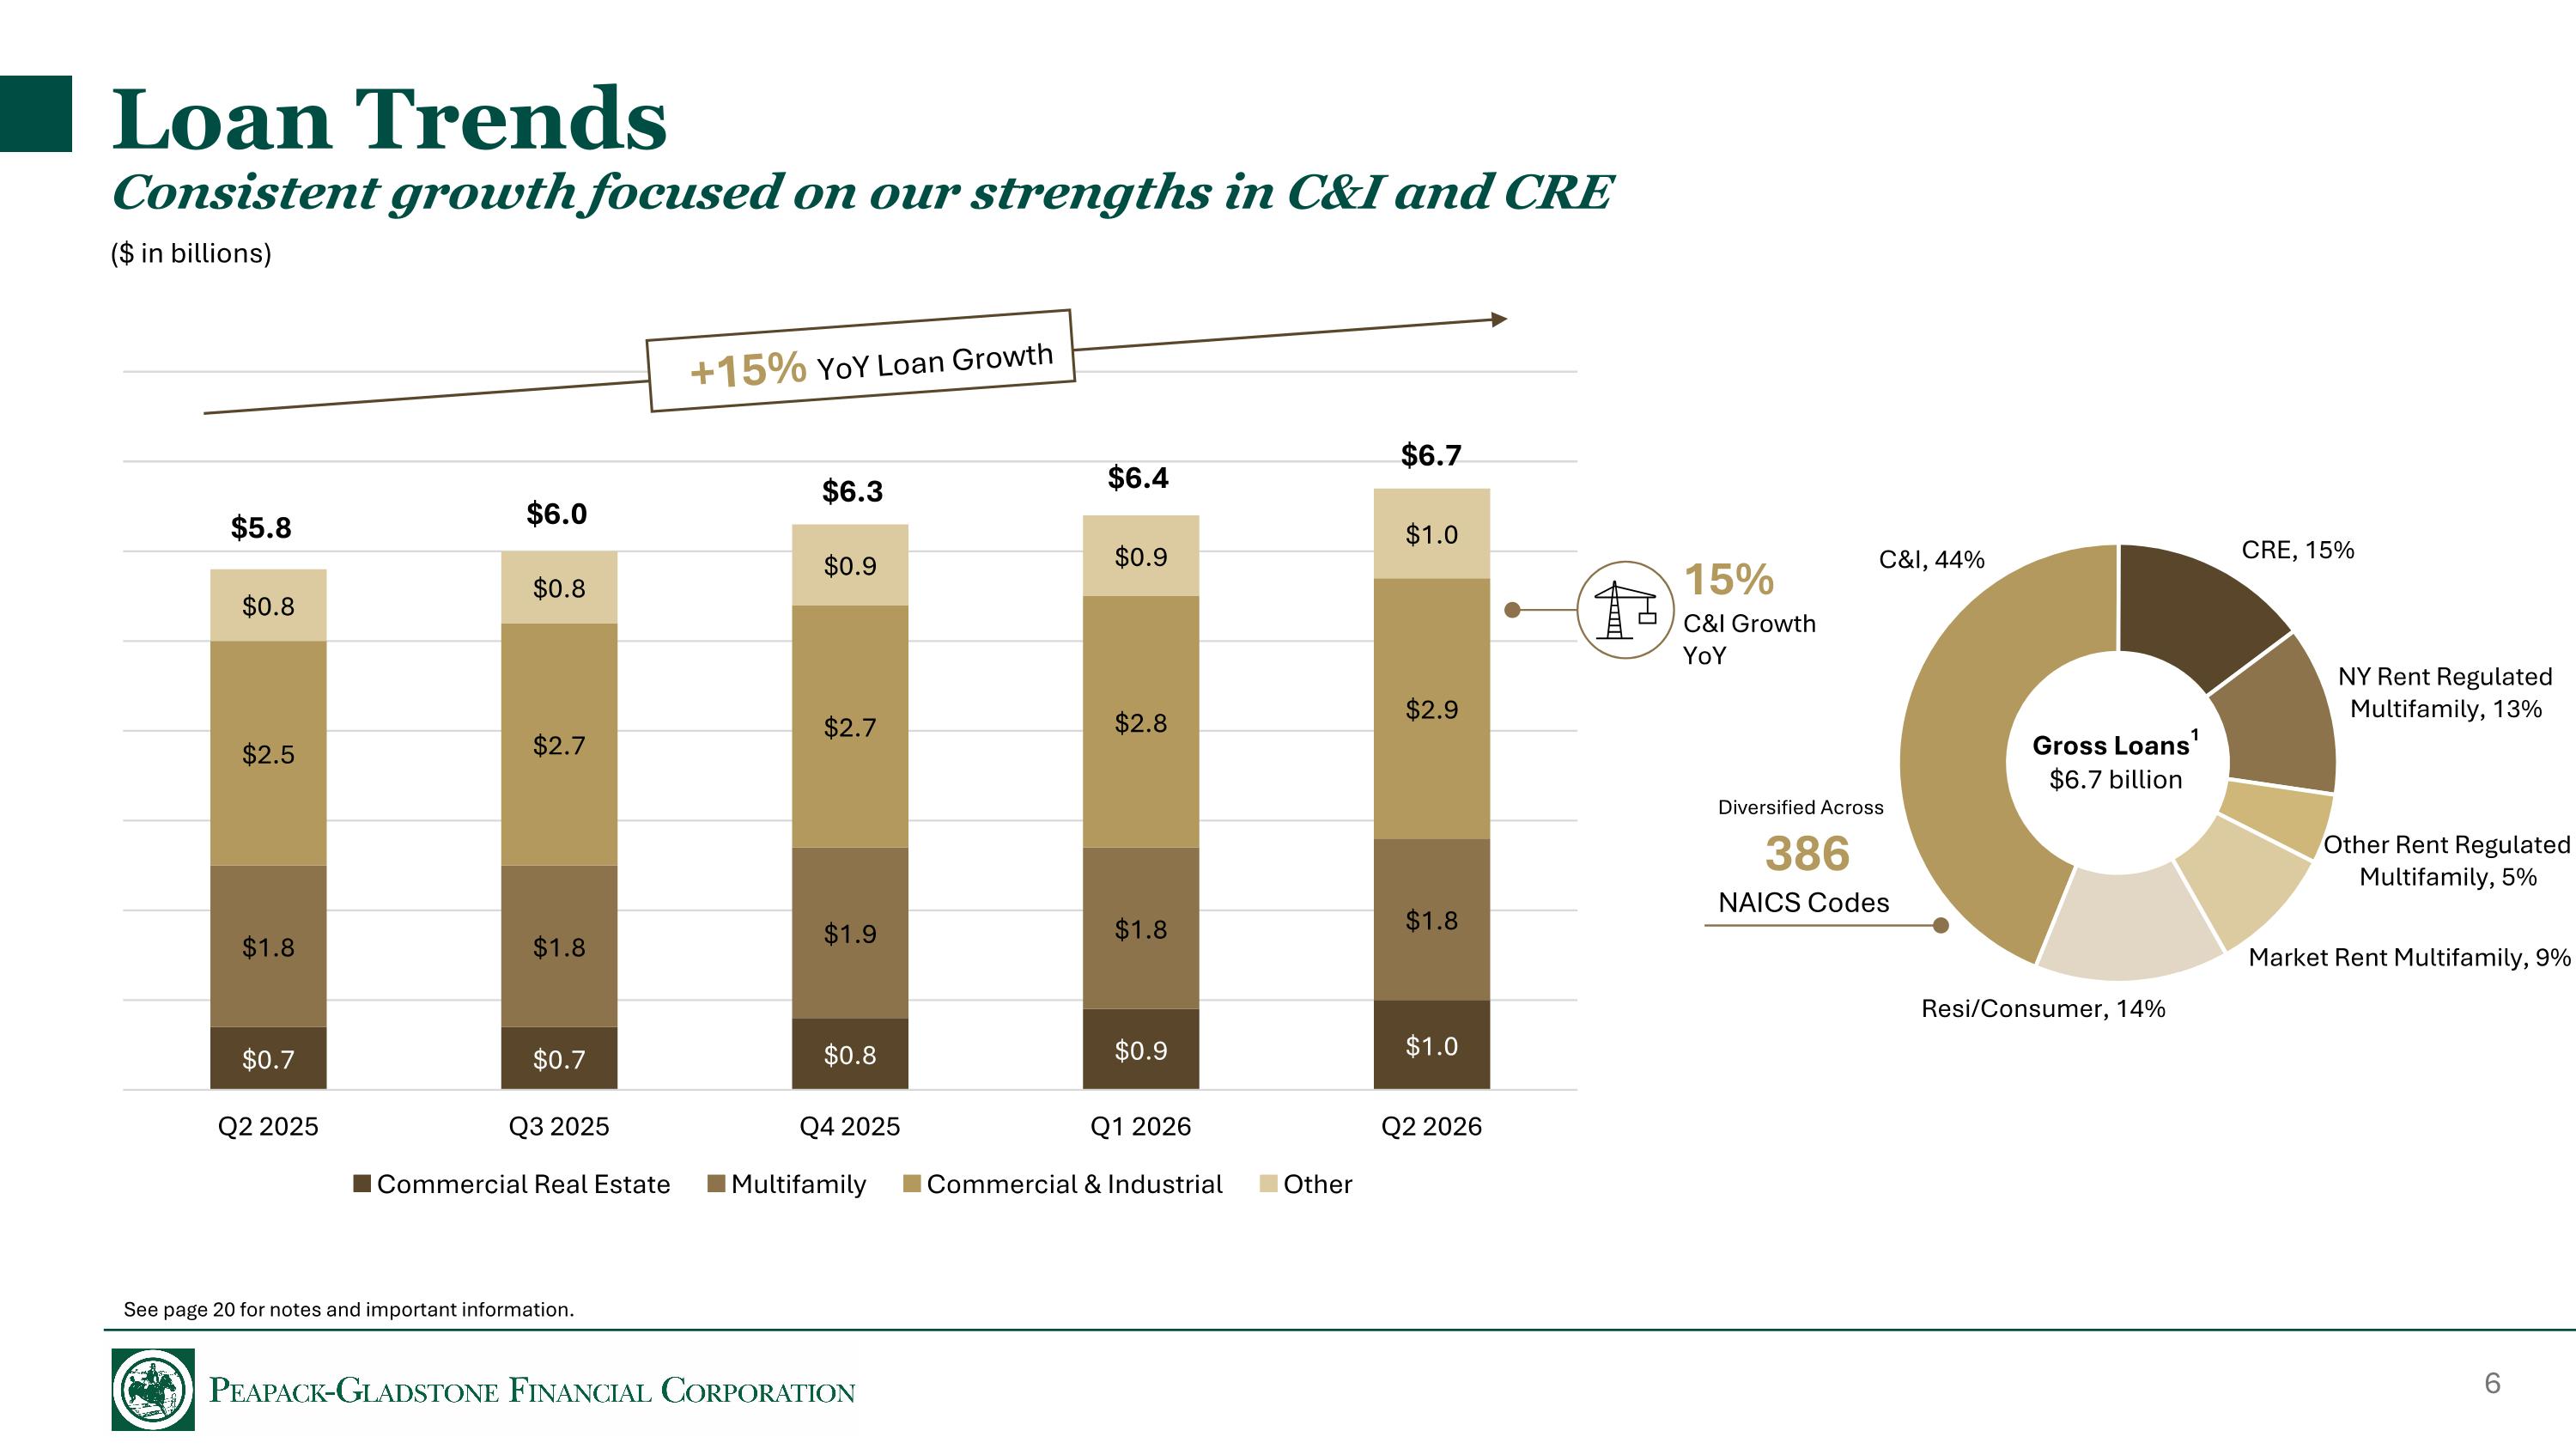
Loan Trends Consistent growth focused on our strengths in C&I and CRE Diversified Across 386 NAICS Codes Gross Loans1 $6.7 billion $6.3 $6.4 $6.7 $5.8 $6.0 ($ in billions) 15% C&I Growth YoY +15% YoY Loan Growth See page 20 for notes and important information.
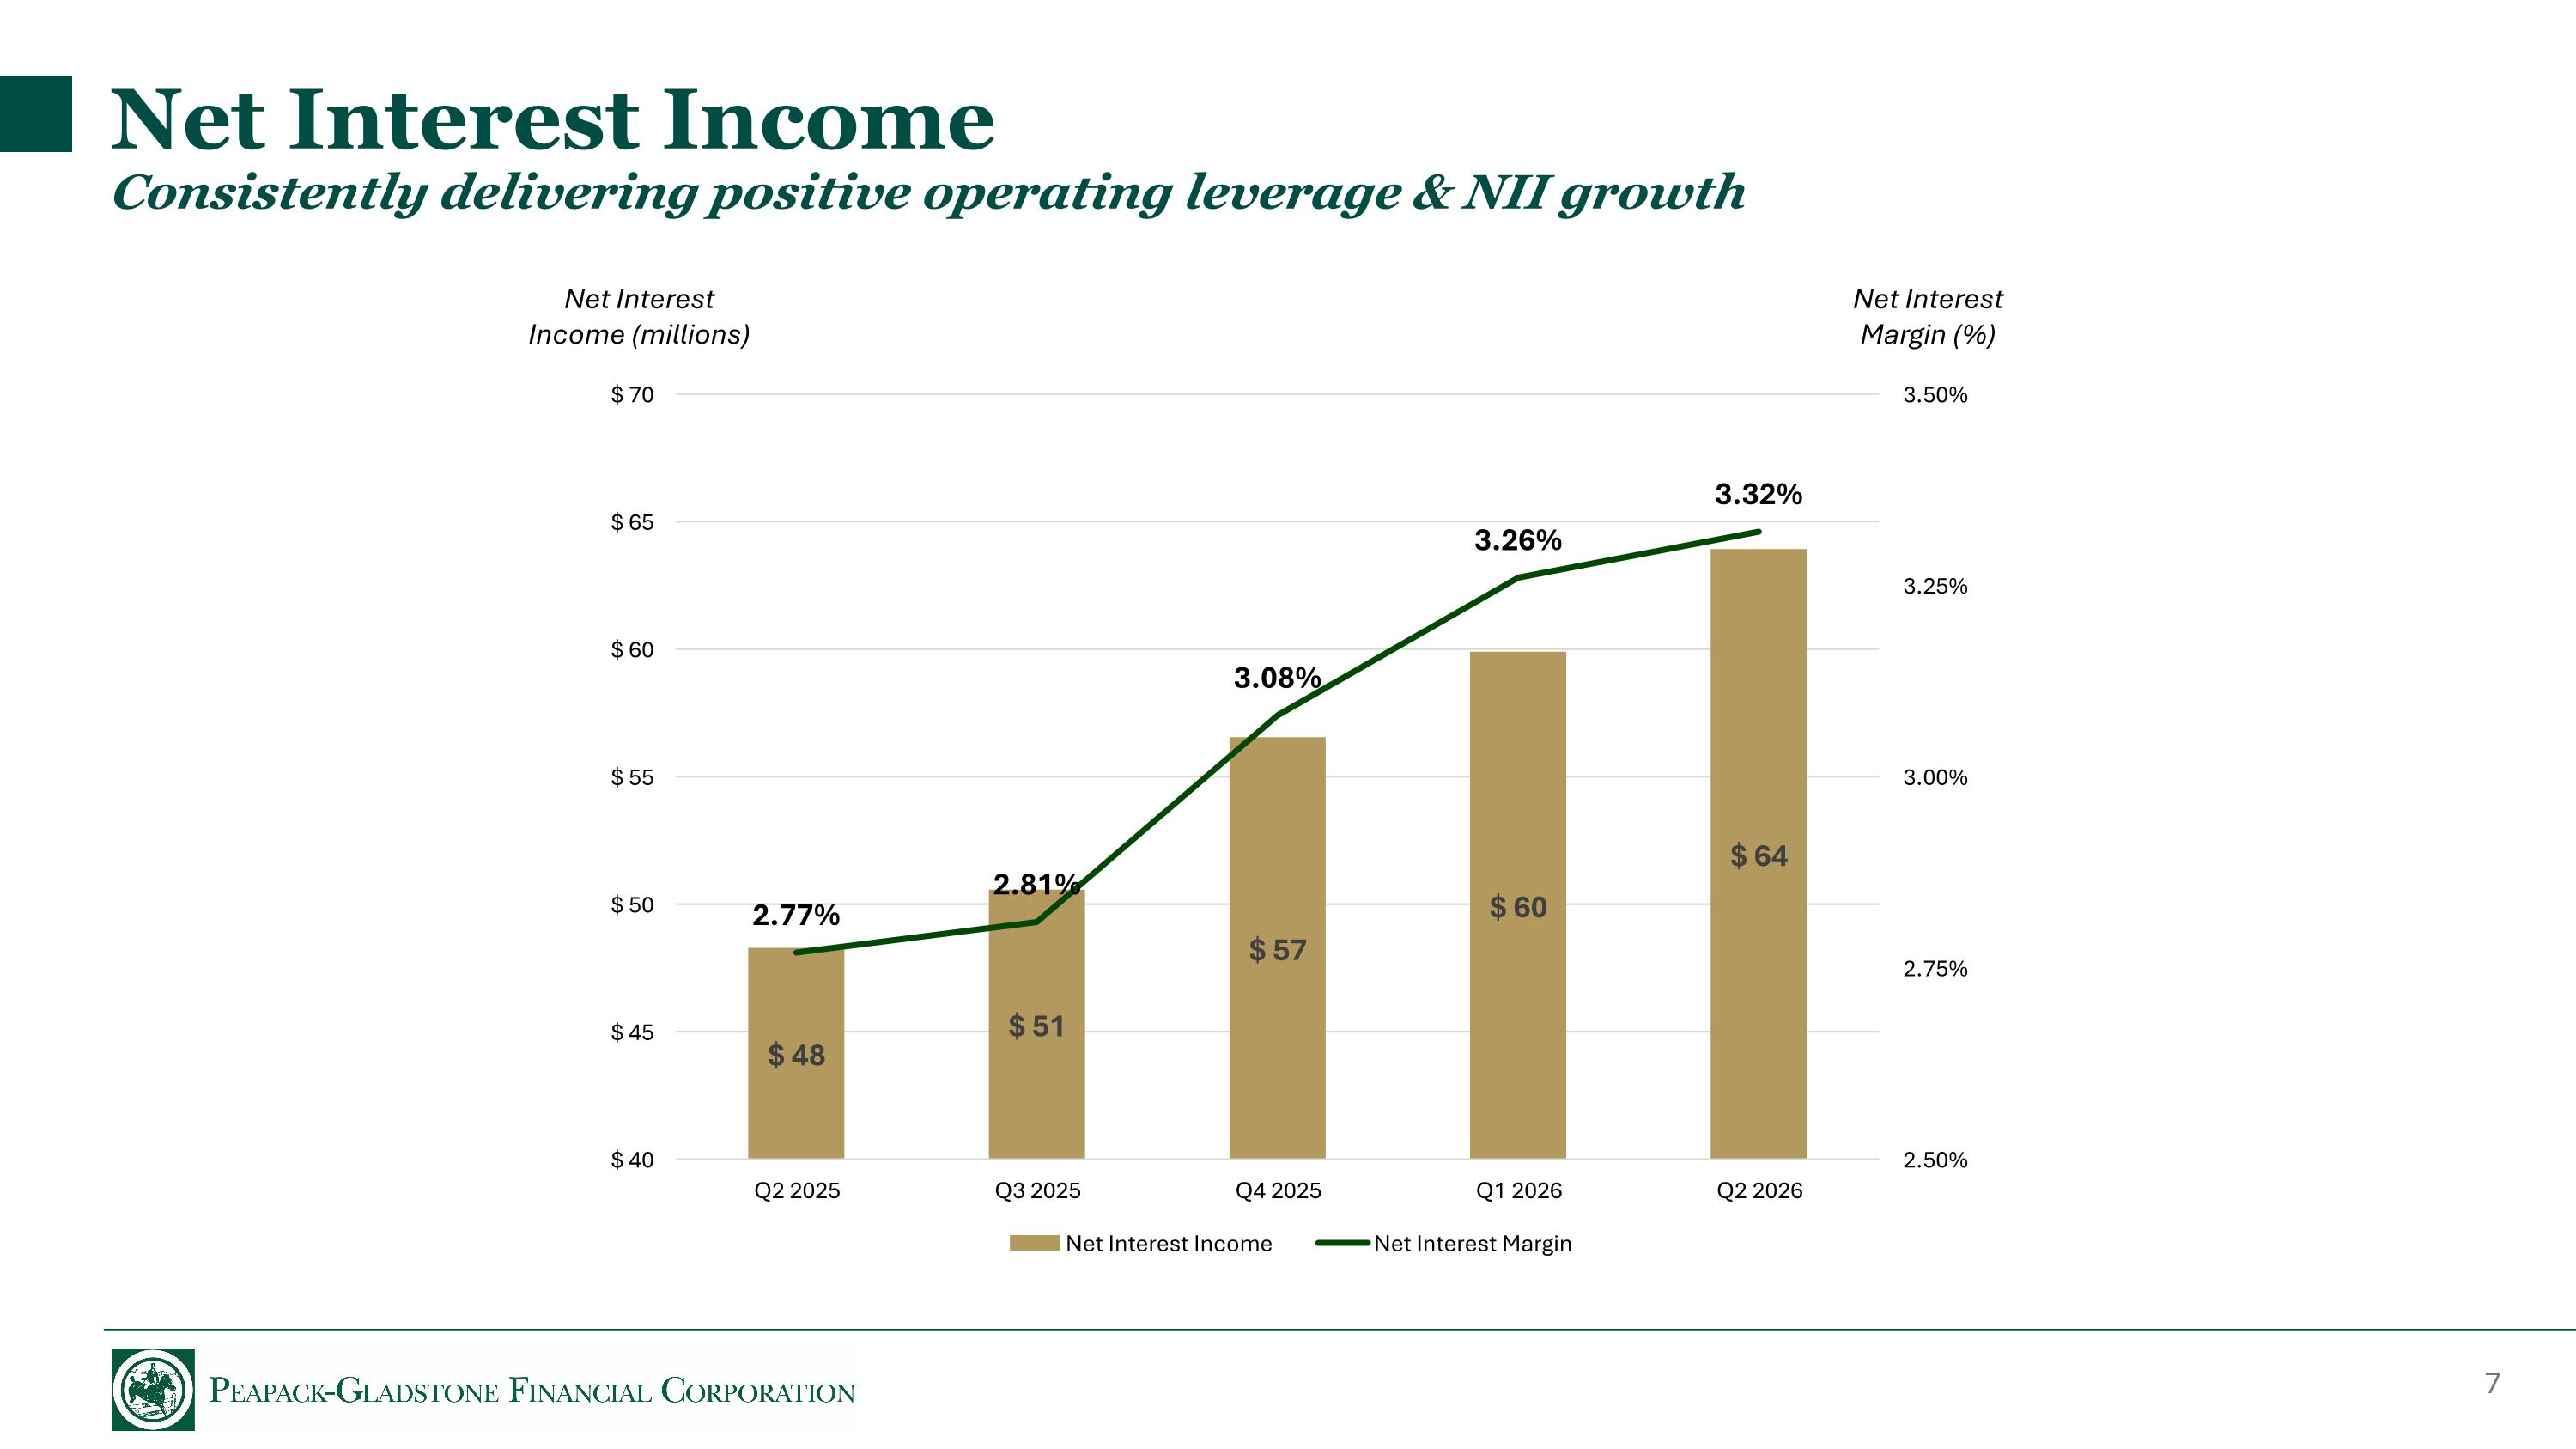
Net Interest Income Consistently delivering positive operating leverage & NII growth Net Interest Income (millions) Net Interest Margin (%)
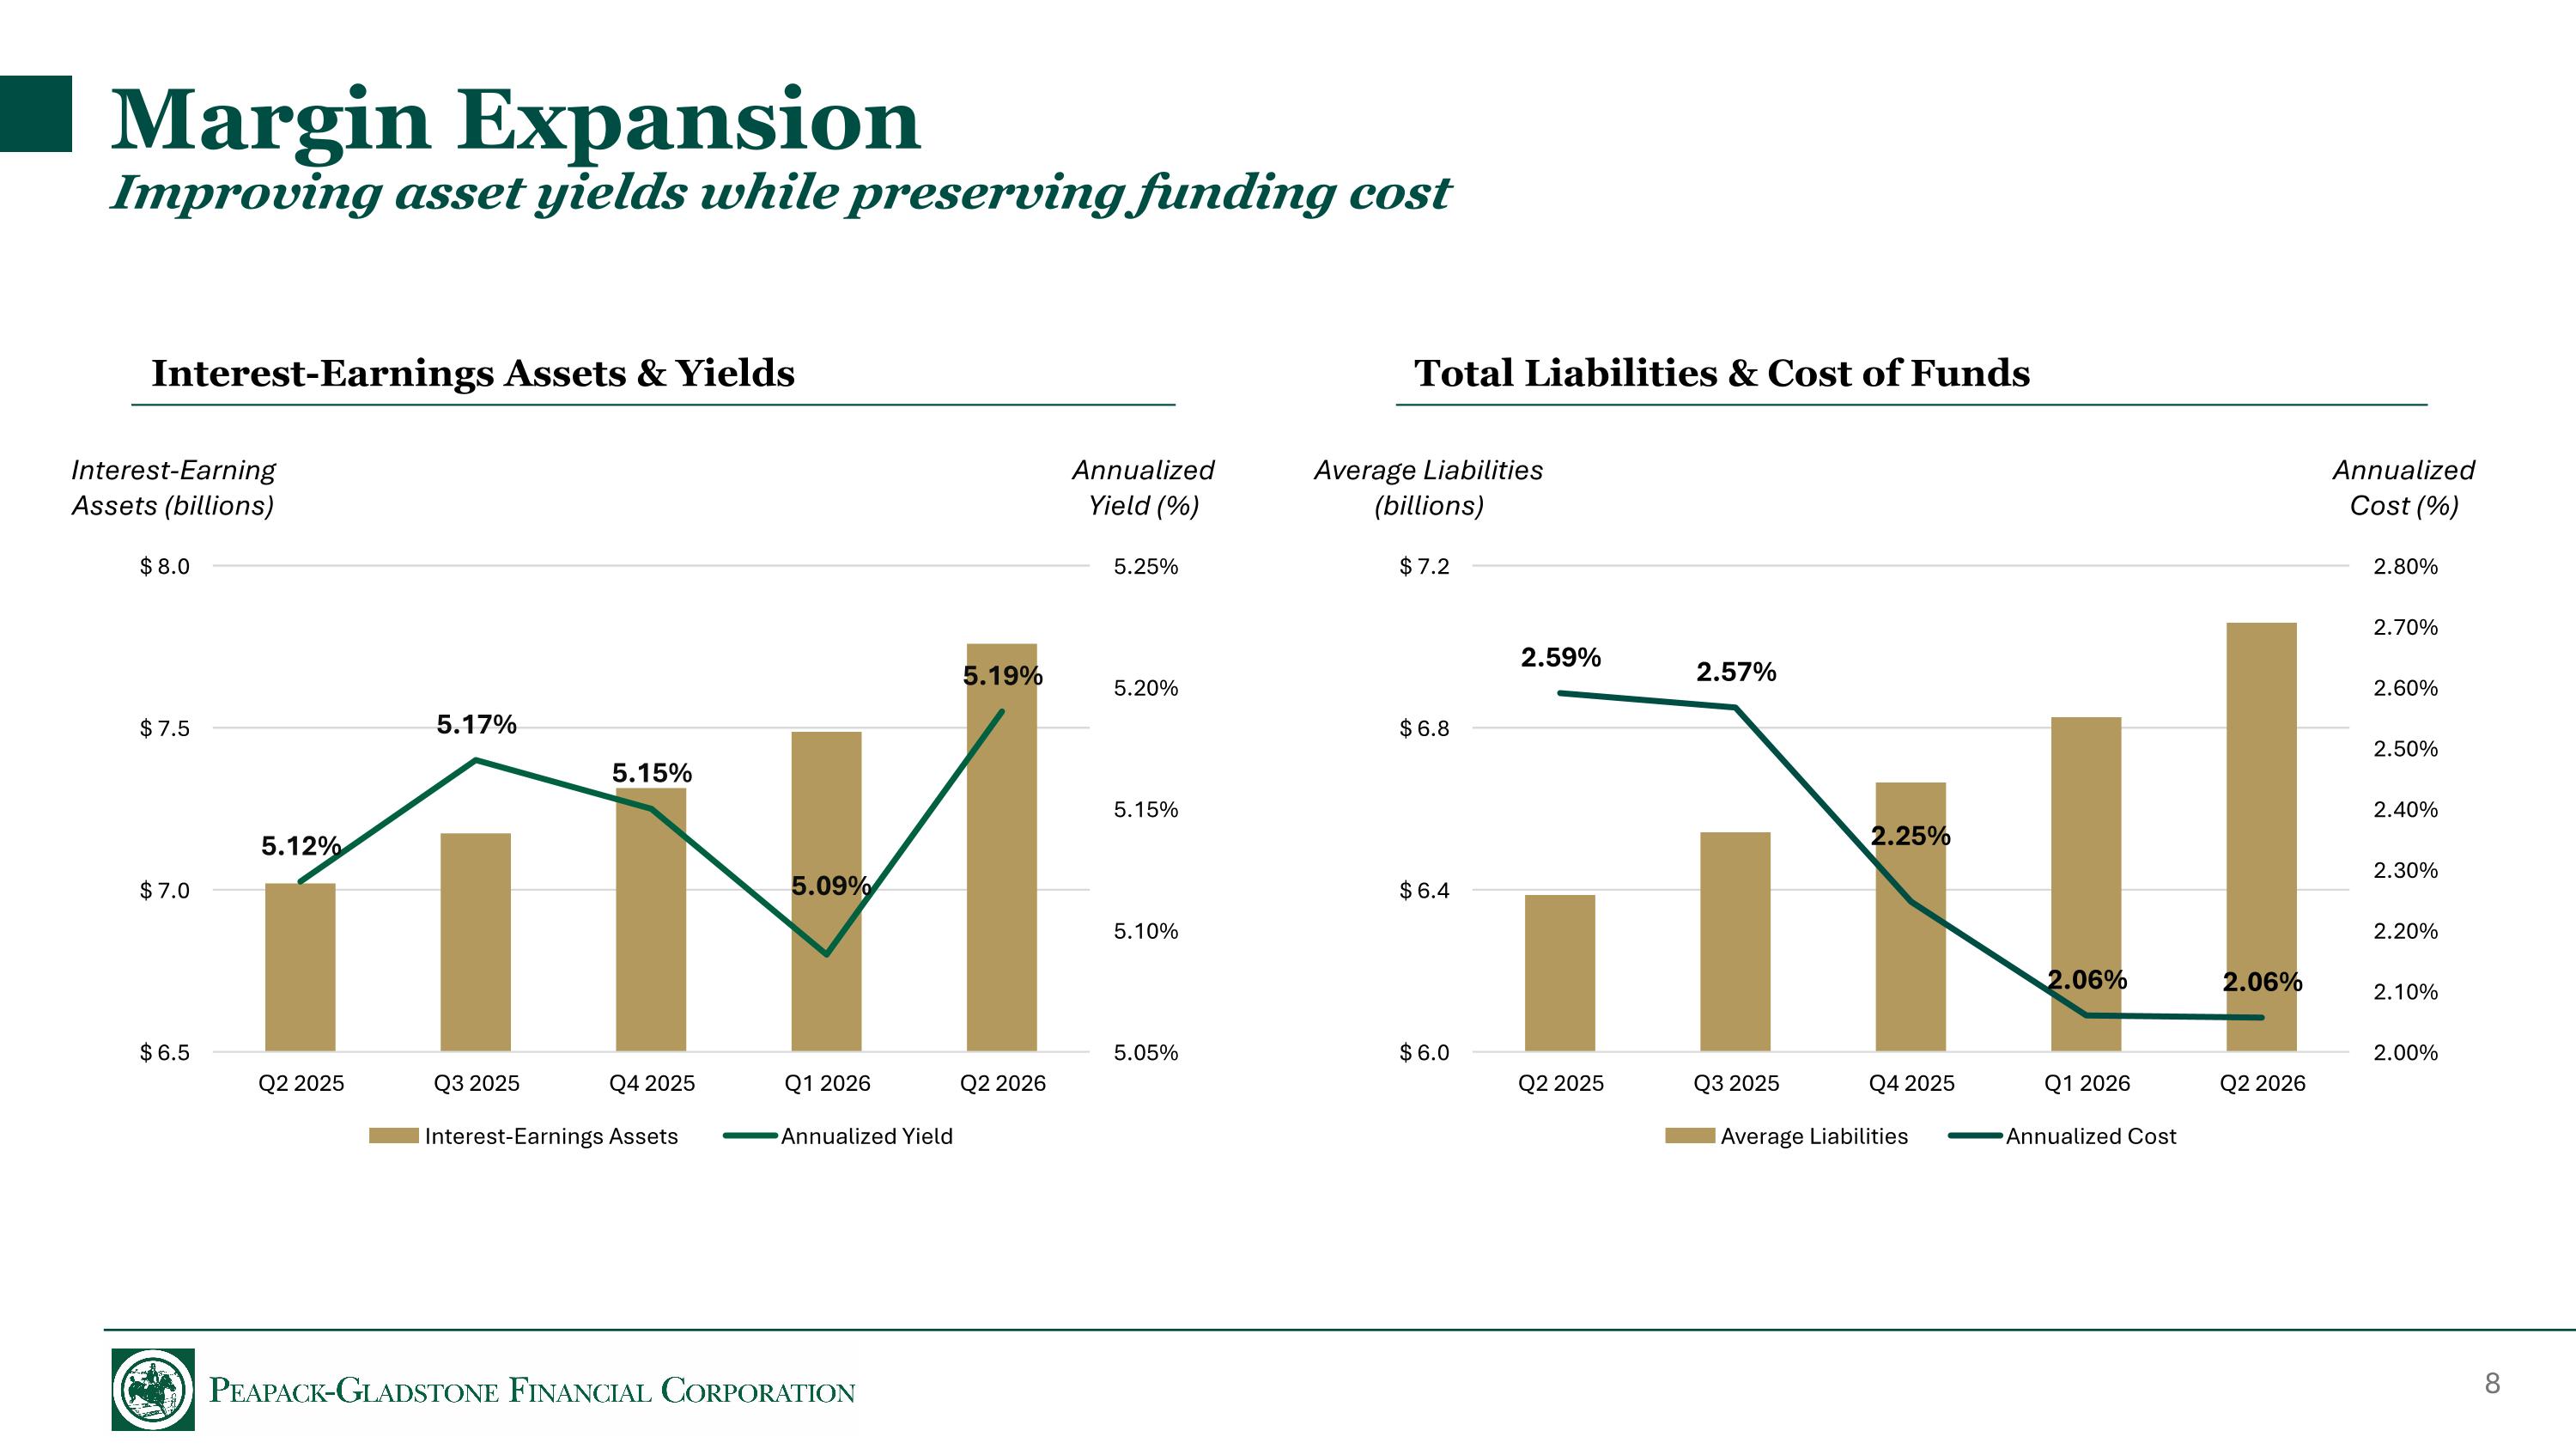
Margin Expansion Improving asset yields while preserving funding cost Total Liabilities & Cost of Funds Interest-Earnings Assets & Yields Interest-Earning Assets (billions) Annualized Yield (%) Average Liabilities (billions) Annualized Cost (%)
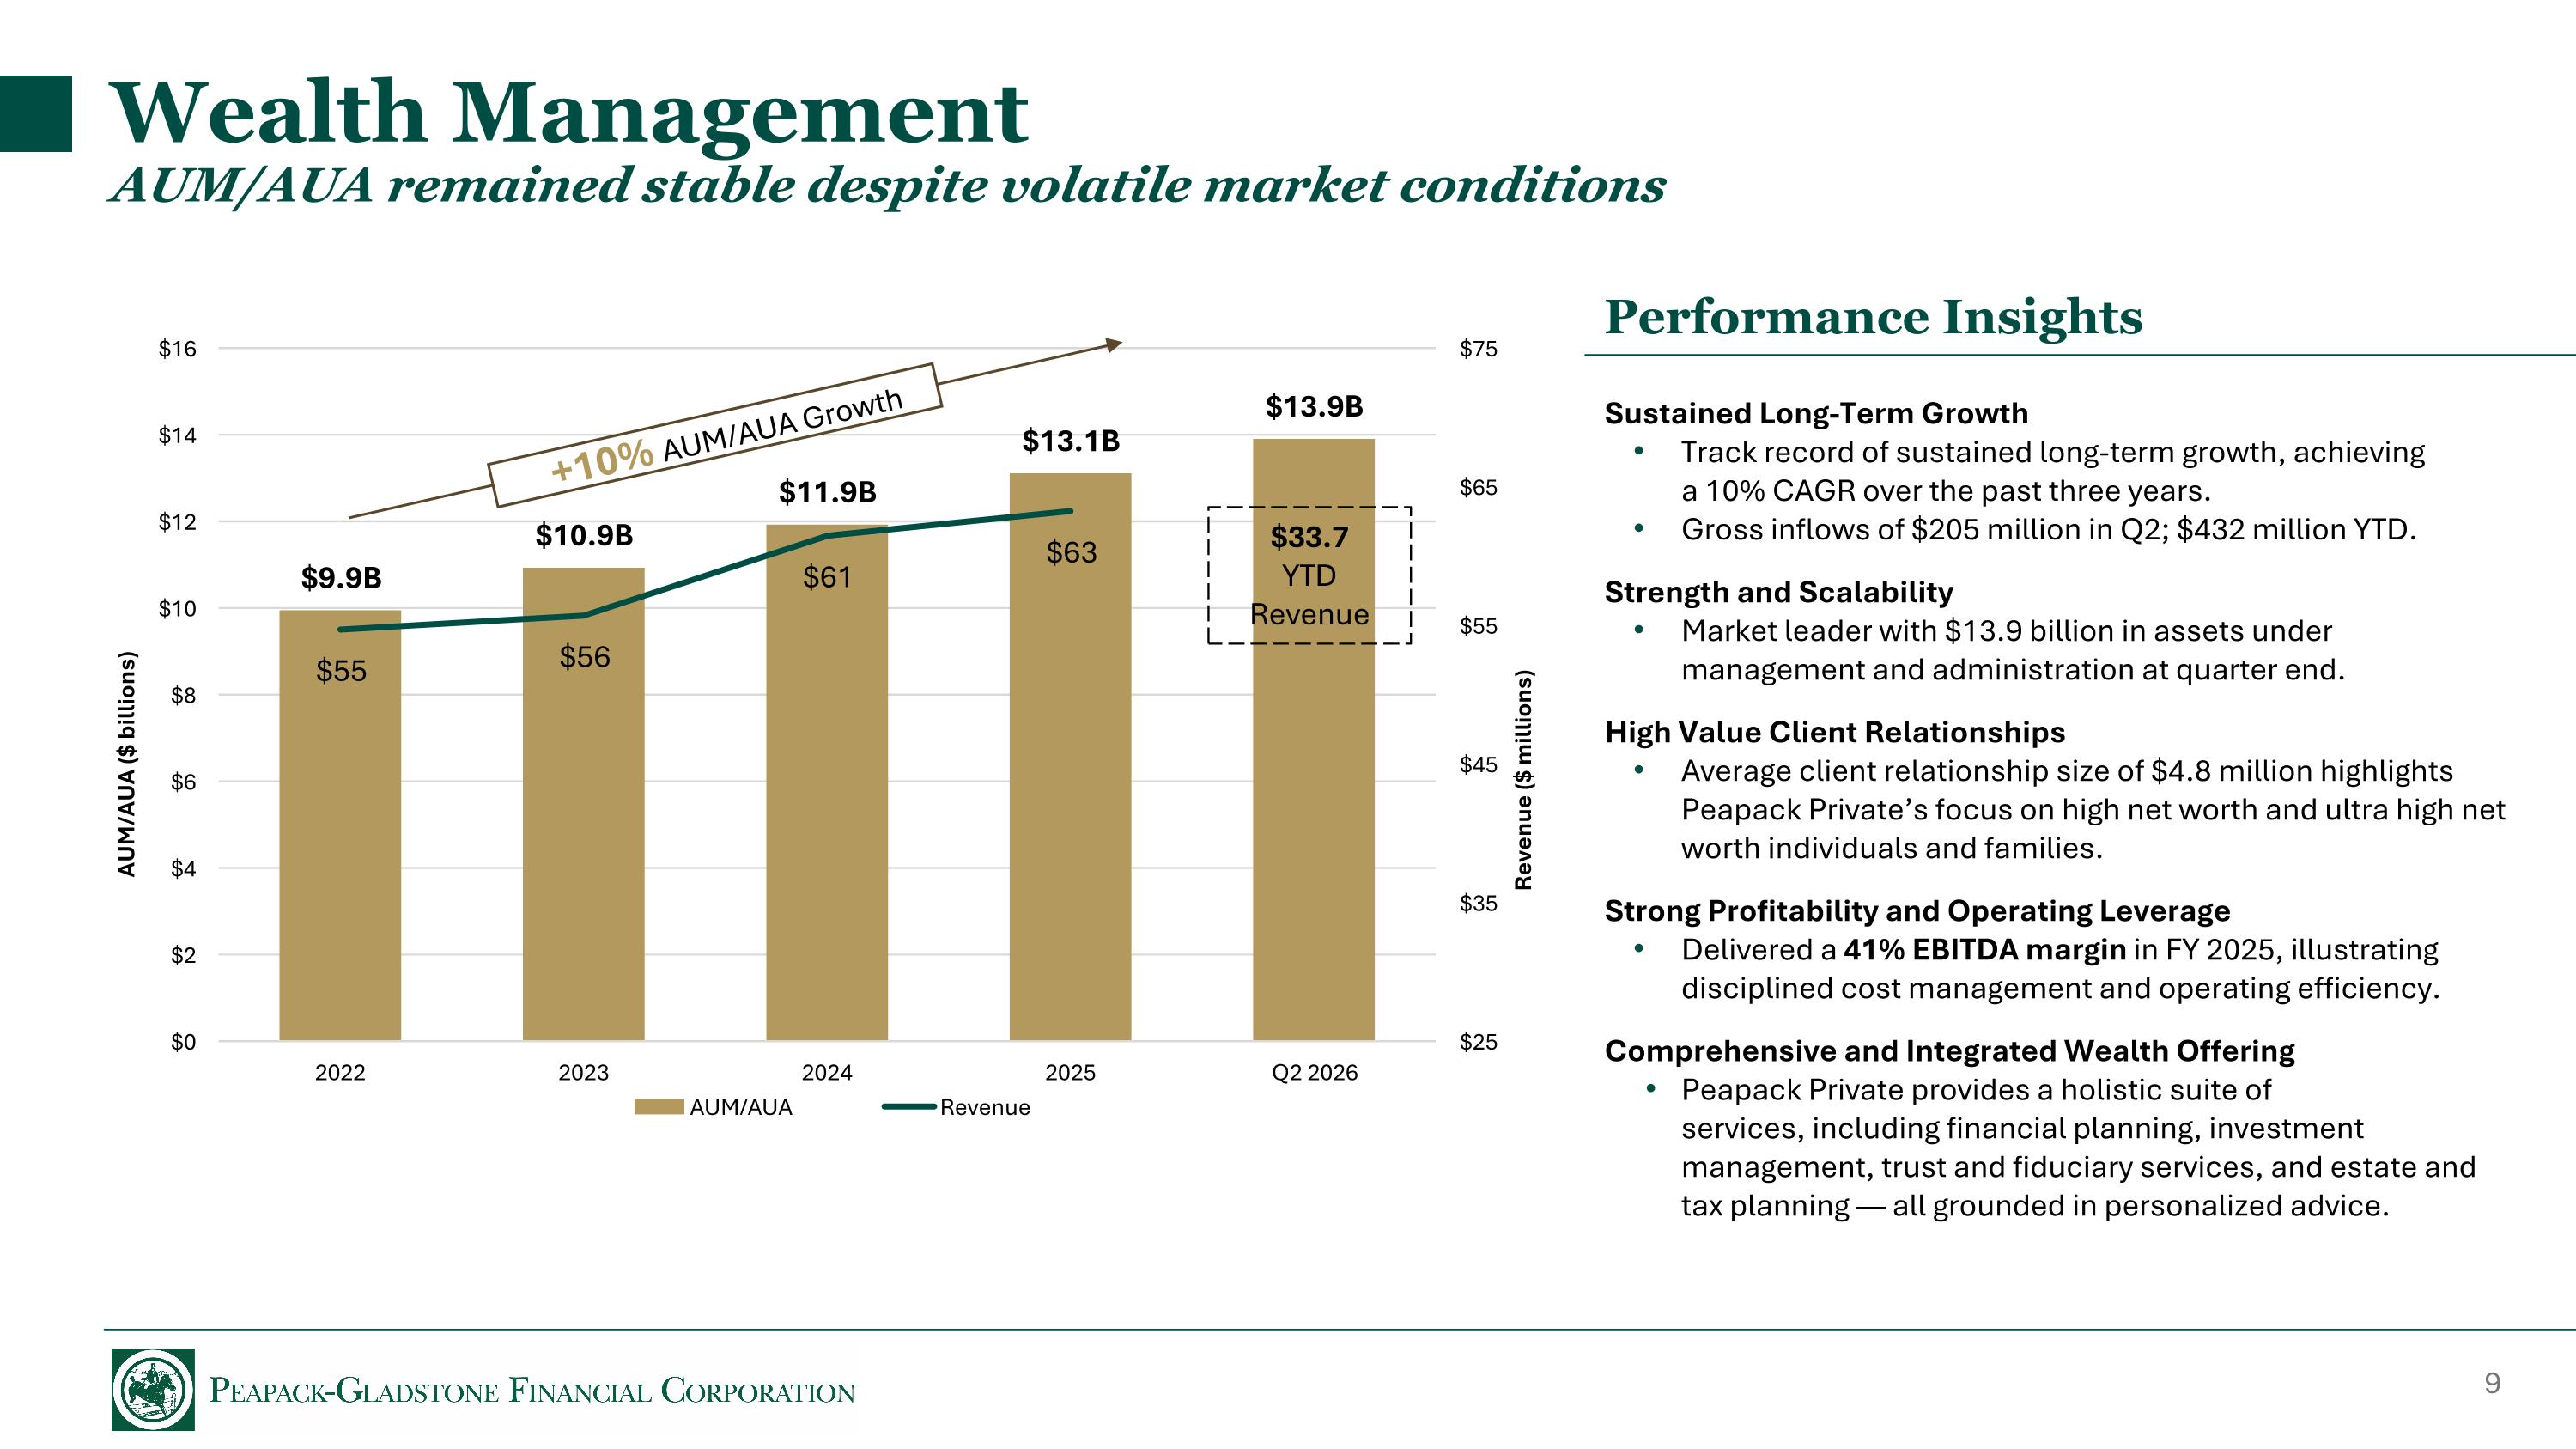
Wealth Management AUM/AUA remained stable despite volatile market conditions Sustained Long-Term Growth Track record of sustained long-term growth, achieving a 10% CAGR over the past three years. Gross inflows of $205 million in Q2; $432 million YTD. Strength and Scalability Market leader with $13.9 billion in assets under management and administration at quarter end. High Value Client Relationships Average client relationship size of $4.8 million highlights Peapack Private’s focus on high net worth and ultra high net worth individuals and families. Strong Profitability and Operating Leverage Delivered a 41% EBITDA margin in FY 2025, illustrating disciplined cost management and operating efficiency. Comprehensive and Integrated Wealth Offering Peapack Private provides a holistic suite of services, including financial planning, investment management, trust and fiduciary services, and estate and tax planning — all grounded in personalized advice. Performance Insights $33.7 YTD Revenue +10% AUM/AUA Growth
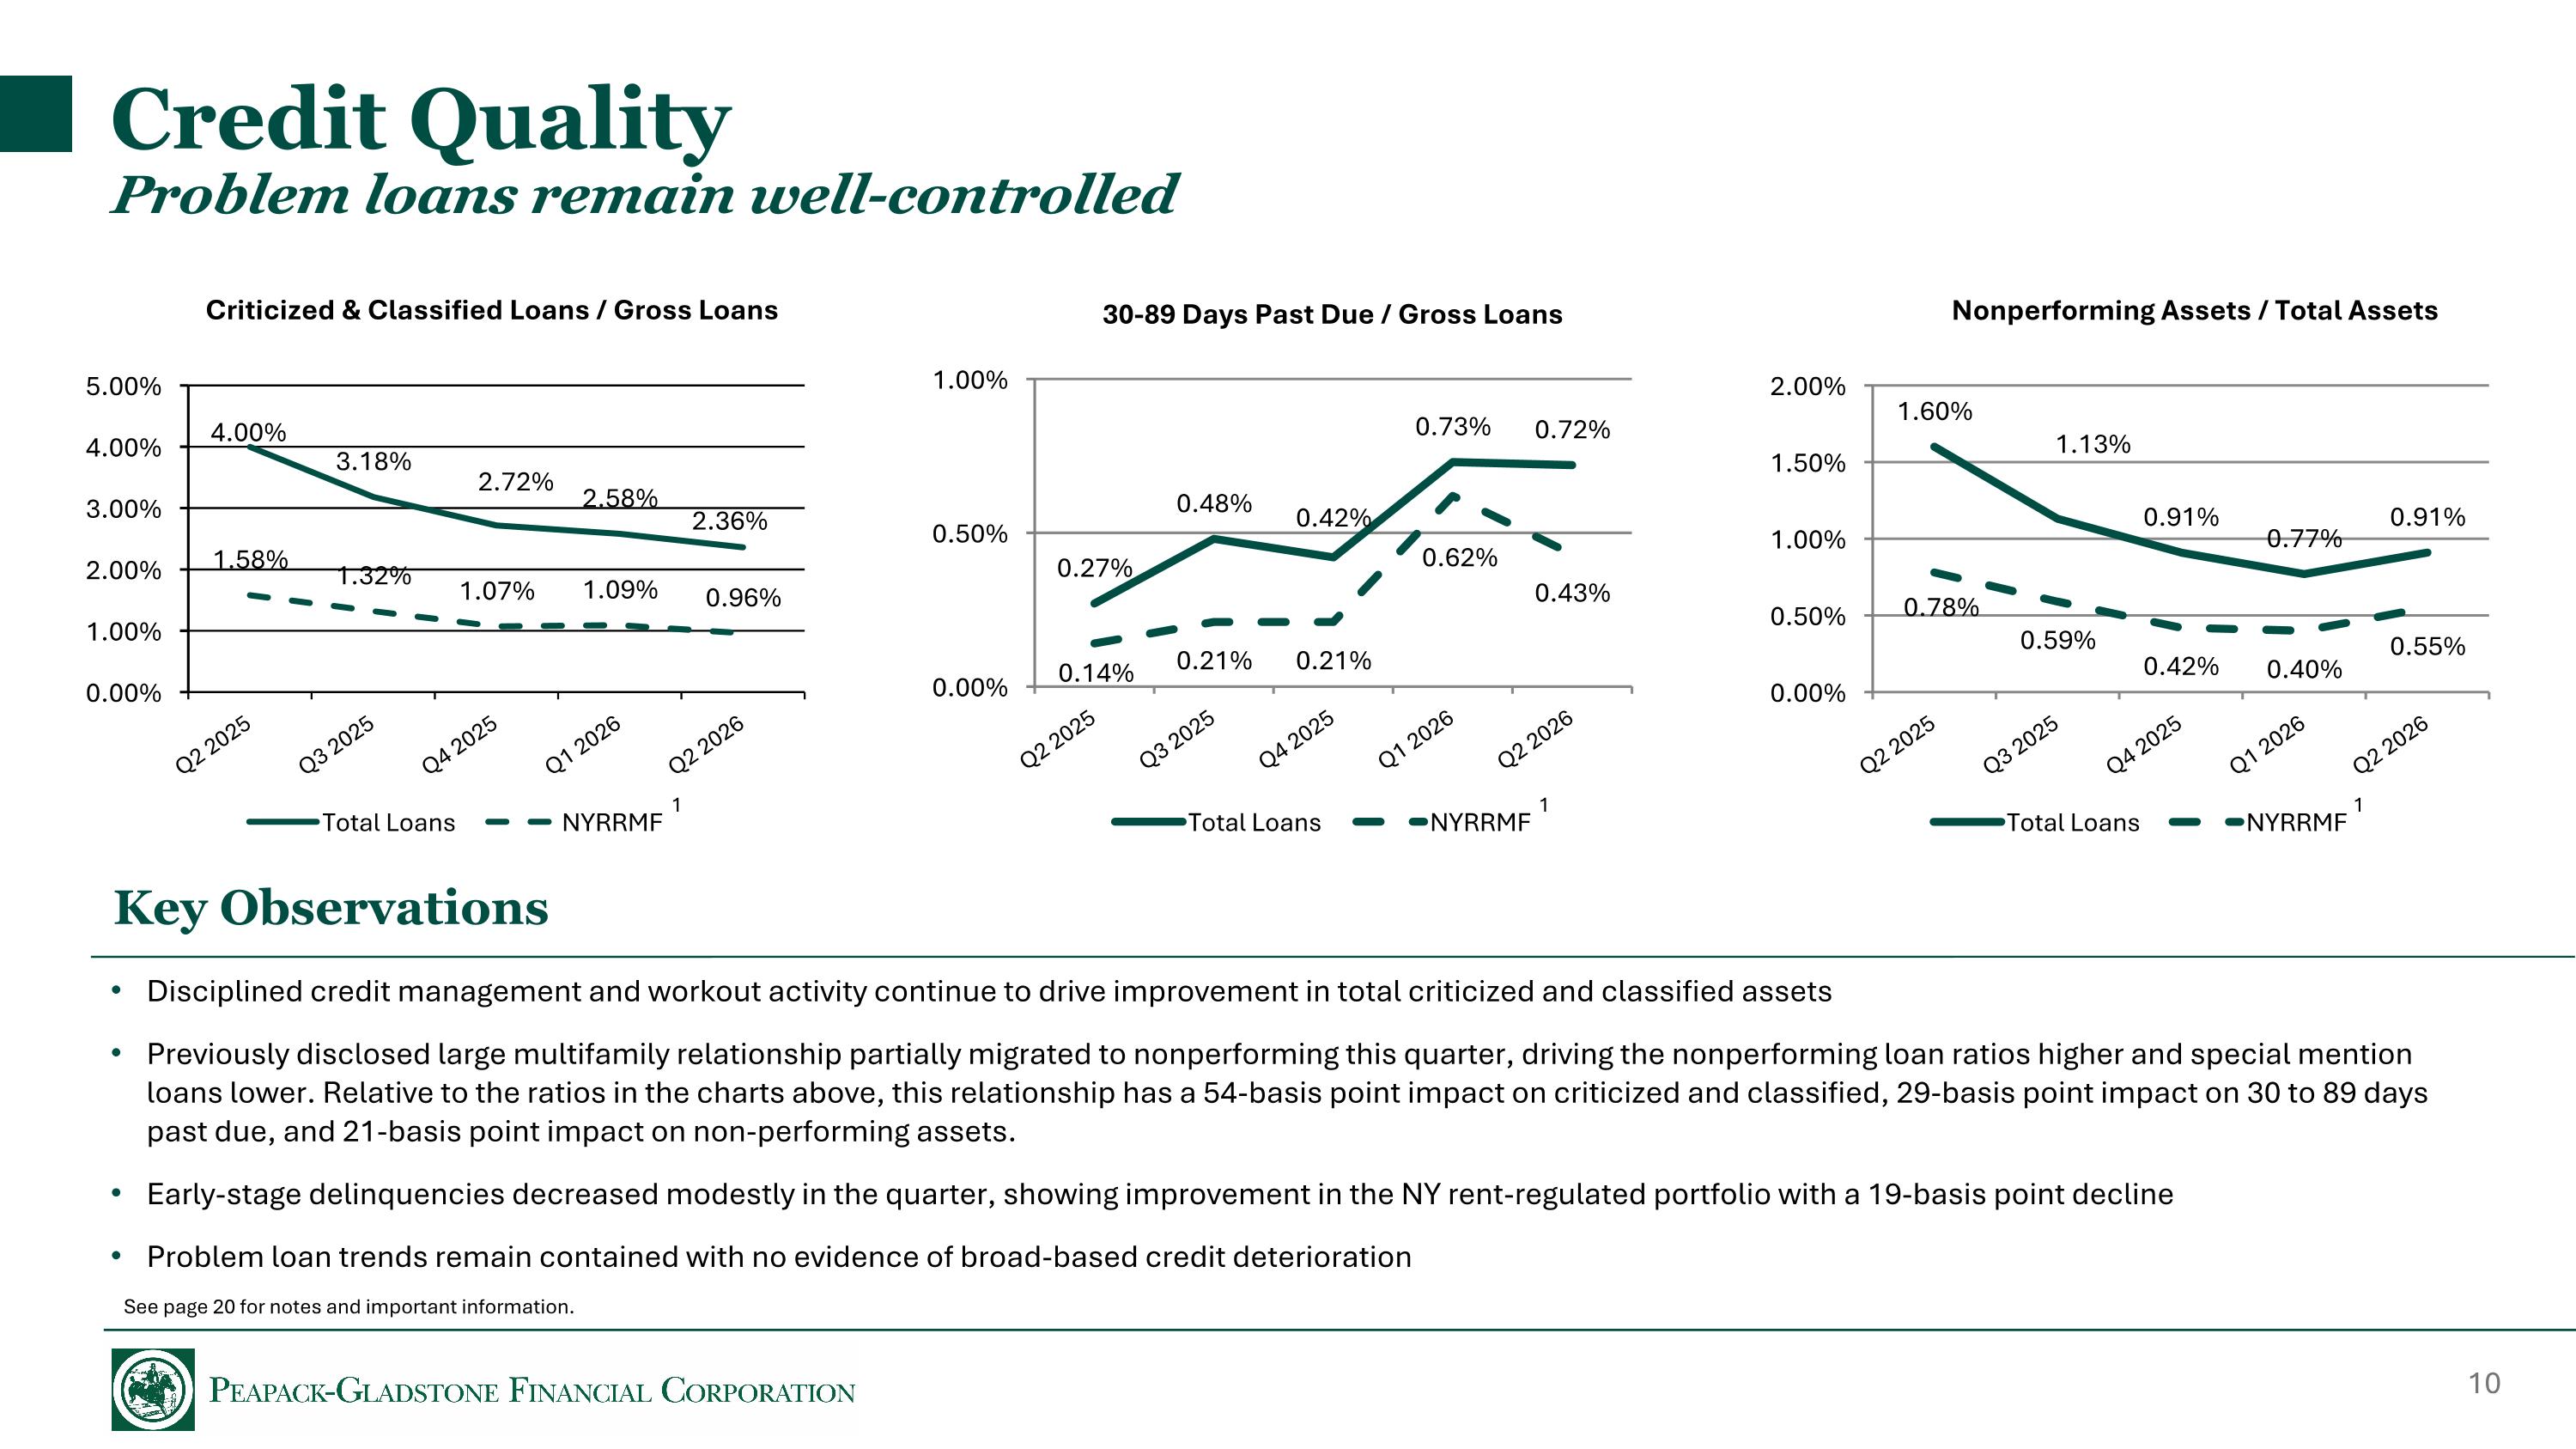
Credit Quality Problem loans remain well-controlled 30-89 Days Past Due / Gross Loans Nonperforming Assets / Total Assets Disciplined credit management and workout activity continue to drive improvement in total criticized and classified assets Previously disclosed large multifamily relationship partially migrated to nonperforming this quarter, driving the nonperforming loan ratios higher and special mention loans lower. Relative to the ratios in the charts above, this relationship has a 54-basis point impact on criticized and classified, 29-basis point impact on 30 to 89 days past due, and 21-basis point impact on non-performing assets. Early-stage delinquencies decreased modestly in the quarter, showing improvement in the NY rent-regulated portfolio with a 19-basis point decline Problem loan trends remain contained with no evidence of broad-based credit deterioration Criticized & Classified Loans / Gross Loans Key Observations 1 1 1 See page 20 for notes and important information.
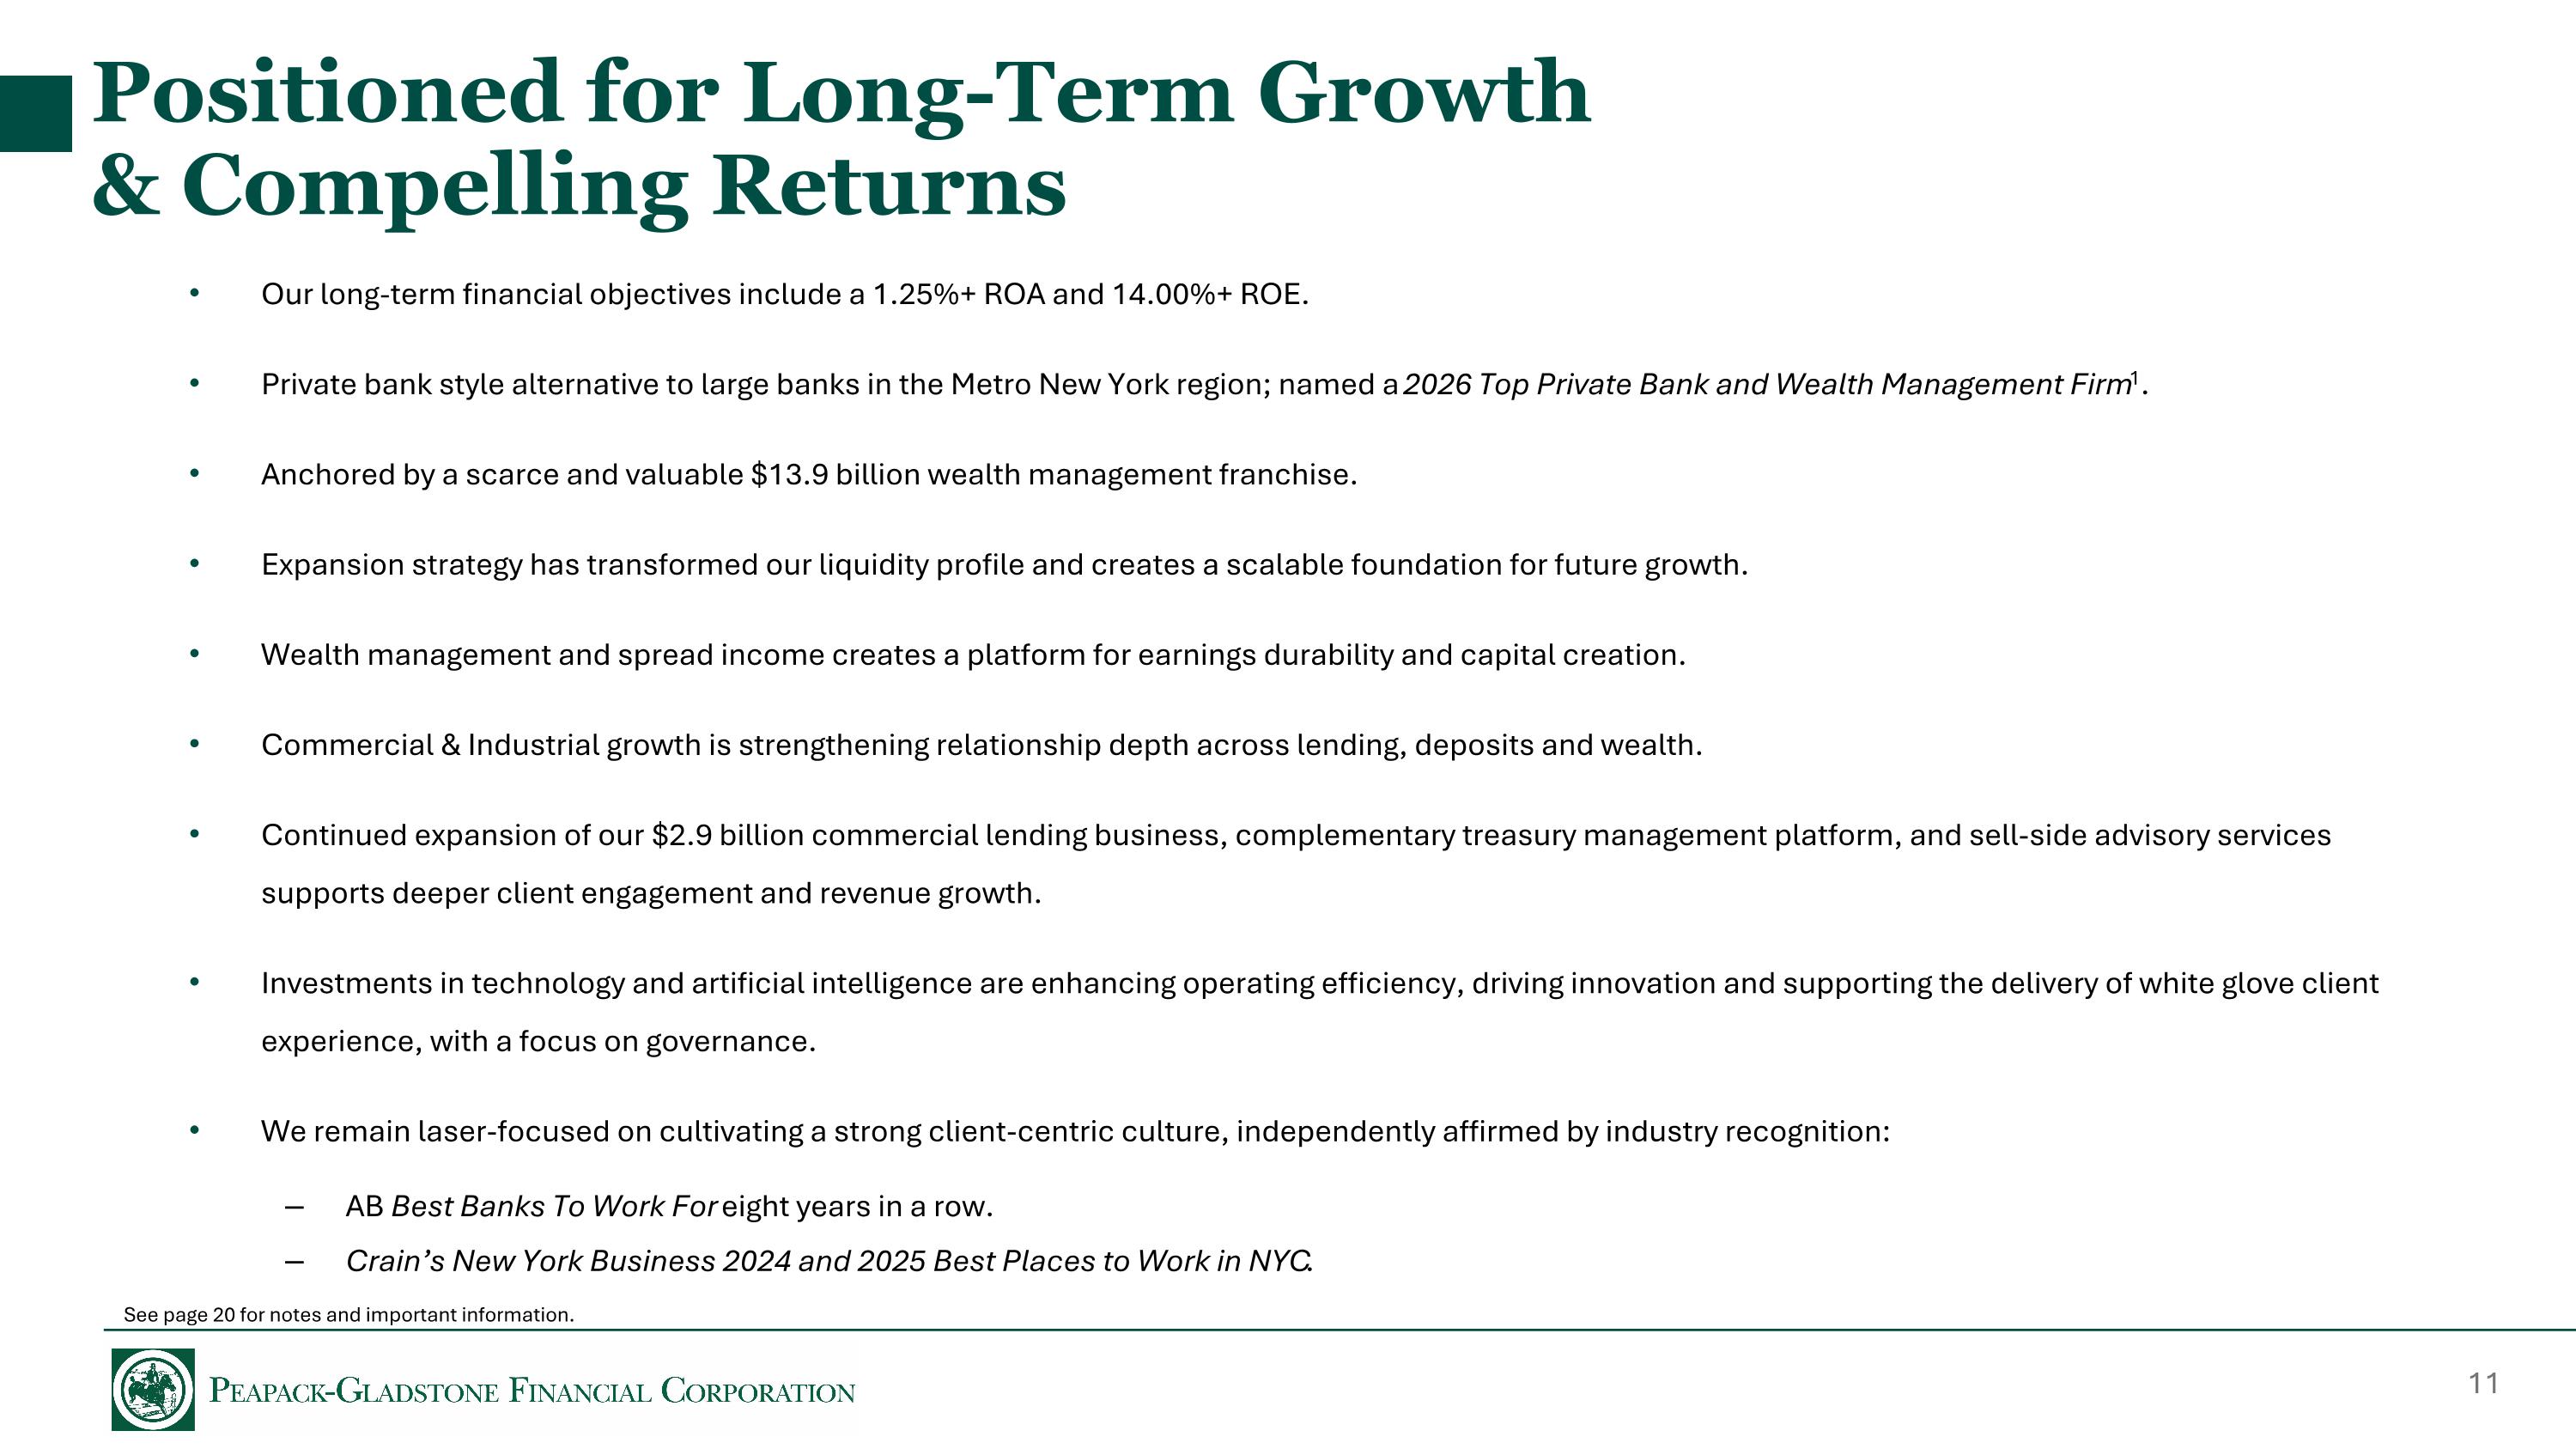
Positioned for Long-Term Growth & Compelling Returns Our long-term financial objectives include a 1.25%+ ROA and 14.00%+ ROE. Private bank style alternative to large banks in the Metro New York region; named a 2026 Top Private Bank and Wealth Management Firm1. Anchored by a scarce and valuable $13.9 billion wealth management franchise. Expansion strategy has transformed our liquidity profile and creates a scalable foundation for future growth. Wealth management and spread income creates a platform for earnings durability and capital creation. Commercial & Industrial growth is strengthening relationship depth across lending, deposits and wealth. Continued expansion of our $2.9 billion commercial lending business, complementary treasury management platform, and sell-side advisory services supports deeper client engagement and revenue growth. Investments in technology and artificial intelligence are enhancing operating efficiency, driving innovation and supporting the delivery of white glove client experience, with a focus on governance. We remain laser-focused on cultivating a strong client-centric culture, independently affirmed by industry recognition: AB Best Banks To Work For eight years in a row. Crain’s New York Business 2024 and 2025 Best Places to Work in NYC. See page 20 for notes and important information.
Statement Regarding Forward-Looking Information This presentation contains forward-looking statements within the meaning of the Private Securities Litigation Reform Act of 1995. Such statements are not historical facts and may include expressions about Management’s strategies and Management’s expectations about financial condition and operating results, new and existing programs and products, investments, relationships, opportunities and market conditions. These statements may be identified by such forward-looking terminology as “expect,” “look,” “believe,” “anticipate,” “may,” or similar statements or variations of such terms. Actual results may differ materially from such forward-looking statements. Factors that may cause actual results to differ materially from those contemplated by such forward-looking statements include, but are not limited to: 1) our ability to successfully grow our business and implement our strategic plan, including our ability to generate revenues to offset the increased personnel and other costs related to the strategic plan; 2) the impact of anticipated higher operating expenses in 2026 and beyond; 3) our ability to successfully integrate wealth management firm and team acquisitions; 4) our ability to successfully integrate our expanded employee base; 5) an unexpected decline in the economy, in particular in our New Jersey and New York market areas, including potential recessionary conditions; 6) declines in our net interest margin caused by the interest rate environment and/or our highly competitive market; 7) adverse changes in securities markets; 8) impact from a pandemic event on our business, operations, customers, allowance for credit losses and capital levels; 9) higher than expected increases in our allowance for credit losses; 10) changes in the methodology and assumptions used to calculate the allowance for credit losses; 11) higher than expected increases in credit losses or in the level of delinquent, nonperforming, classified and criticized loans or charge-offs; 12) inflation and changes in interest rates, which may adversely impact our margins and yields, reduce the fair value of our financial instruments, reduce our loan originations and lead to higher operating costs; 13) decline in real estate values within our market areas; 14) legislative and regulatory actions (including the impact of the Dodd-Frank Wall Street Reform and Consumer Protection Act, Basel III and related regulations) that may result in increased compliance costs; 15) the imposition of tariffs, trade policies and other measures impacting our borrowers and/or the broader economy; 16) the impact of any federal government shutdown, debt ceiling impasses or fiscal uncertainty; 17) risks associated with cybersecurity threats, data breaches, ransomware attacks, or other failures in our operational or security systems and infrastructure, including the risks arising from our dependence on third-party service providers and vendors; 18) higher than expected FDIC insurance premiums; 19) adverse weather conditions; 20) the current or anticipated impact of military conflict, terrorism or other geopolitical events; 21) our inability to successfully generate new business in new geographic markets, including our expansion into New York City and Long Island; 22) a reduction in our lower-cost funding sources; 23) changes in liquidity, including the size and composition of our deposit portfolio and the percentage of uninsured deposits in the portfolio; 24) our inability to adapt to technological changes; 25) claims and litigation pertaining to fiduciary responsibility, environmental laws and other matters; 26) our inability to retain key employees; 27) demand for loans and deposits in our market areas; 28) changes in New York City rent regulation law; 29) changes in governmental regulation, including, but not limited to, any increase in FDIC insurance premiums and changes in the monetary and fiscal policies of the U.S. Treasury and the Board of Governors of the Federal Reserve System; 30) changes in accounting policies and practices; and/or 31) other unexpected material adverse changes in our financial condition, operations or earnings. The Company undertakes no duty to update any forward-looking statement to conform the statement to actual results or changes in the Company’s expectations. Although we believe that the expectations reflected in the forward-looking statements are reasonable, the Company cannot guarantee future results, levels of activity, performance or achievements.

Appendix A: Supplemental Information & Franchise Overview
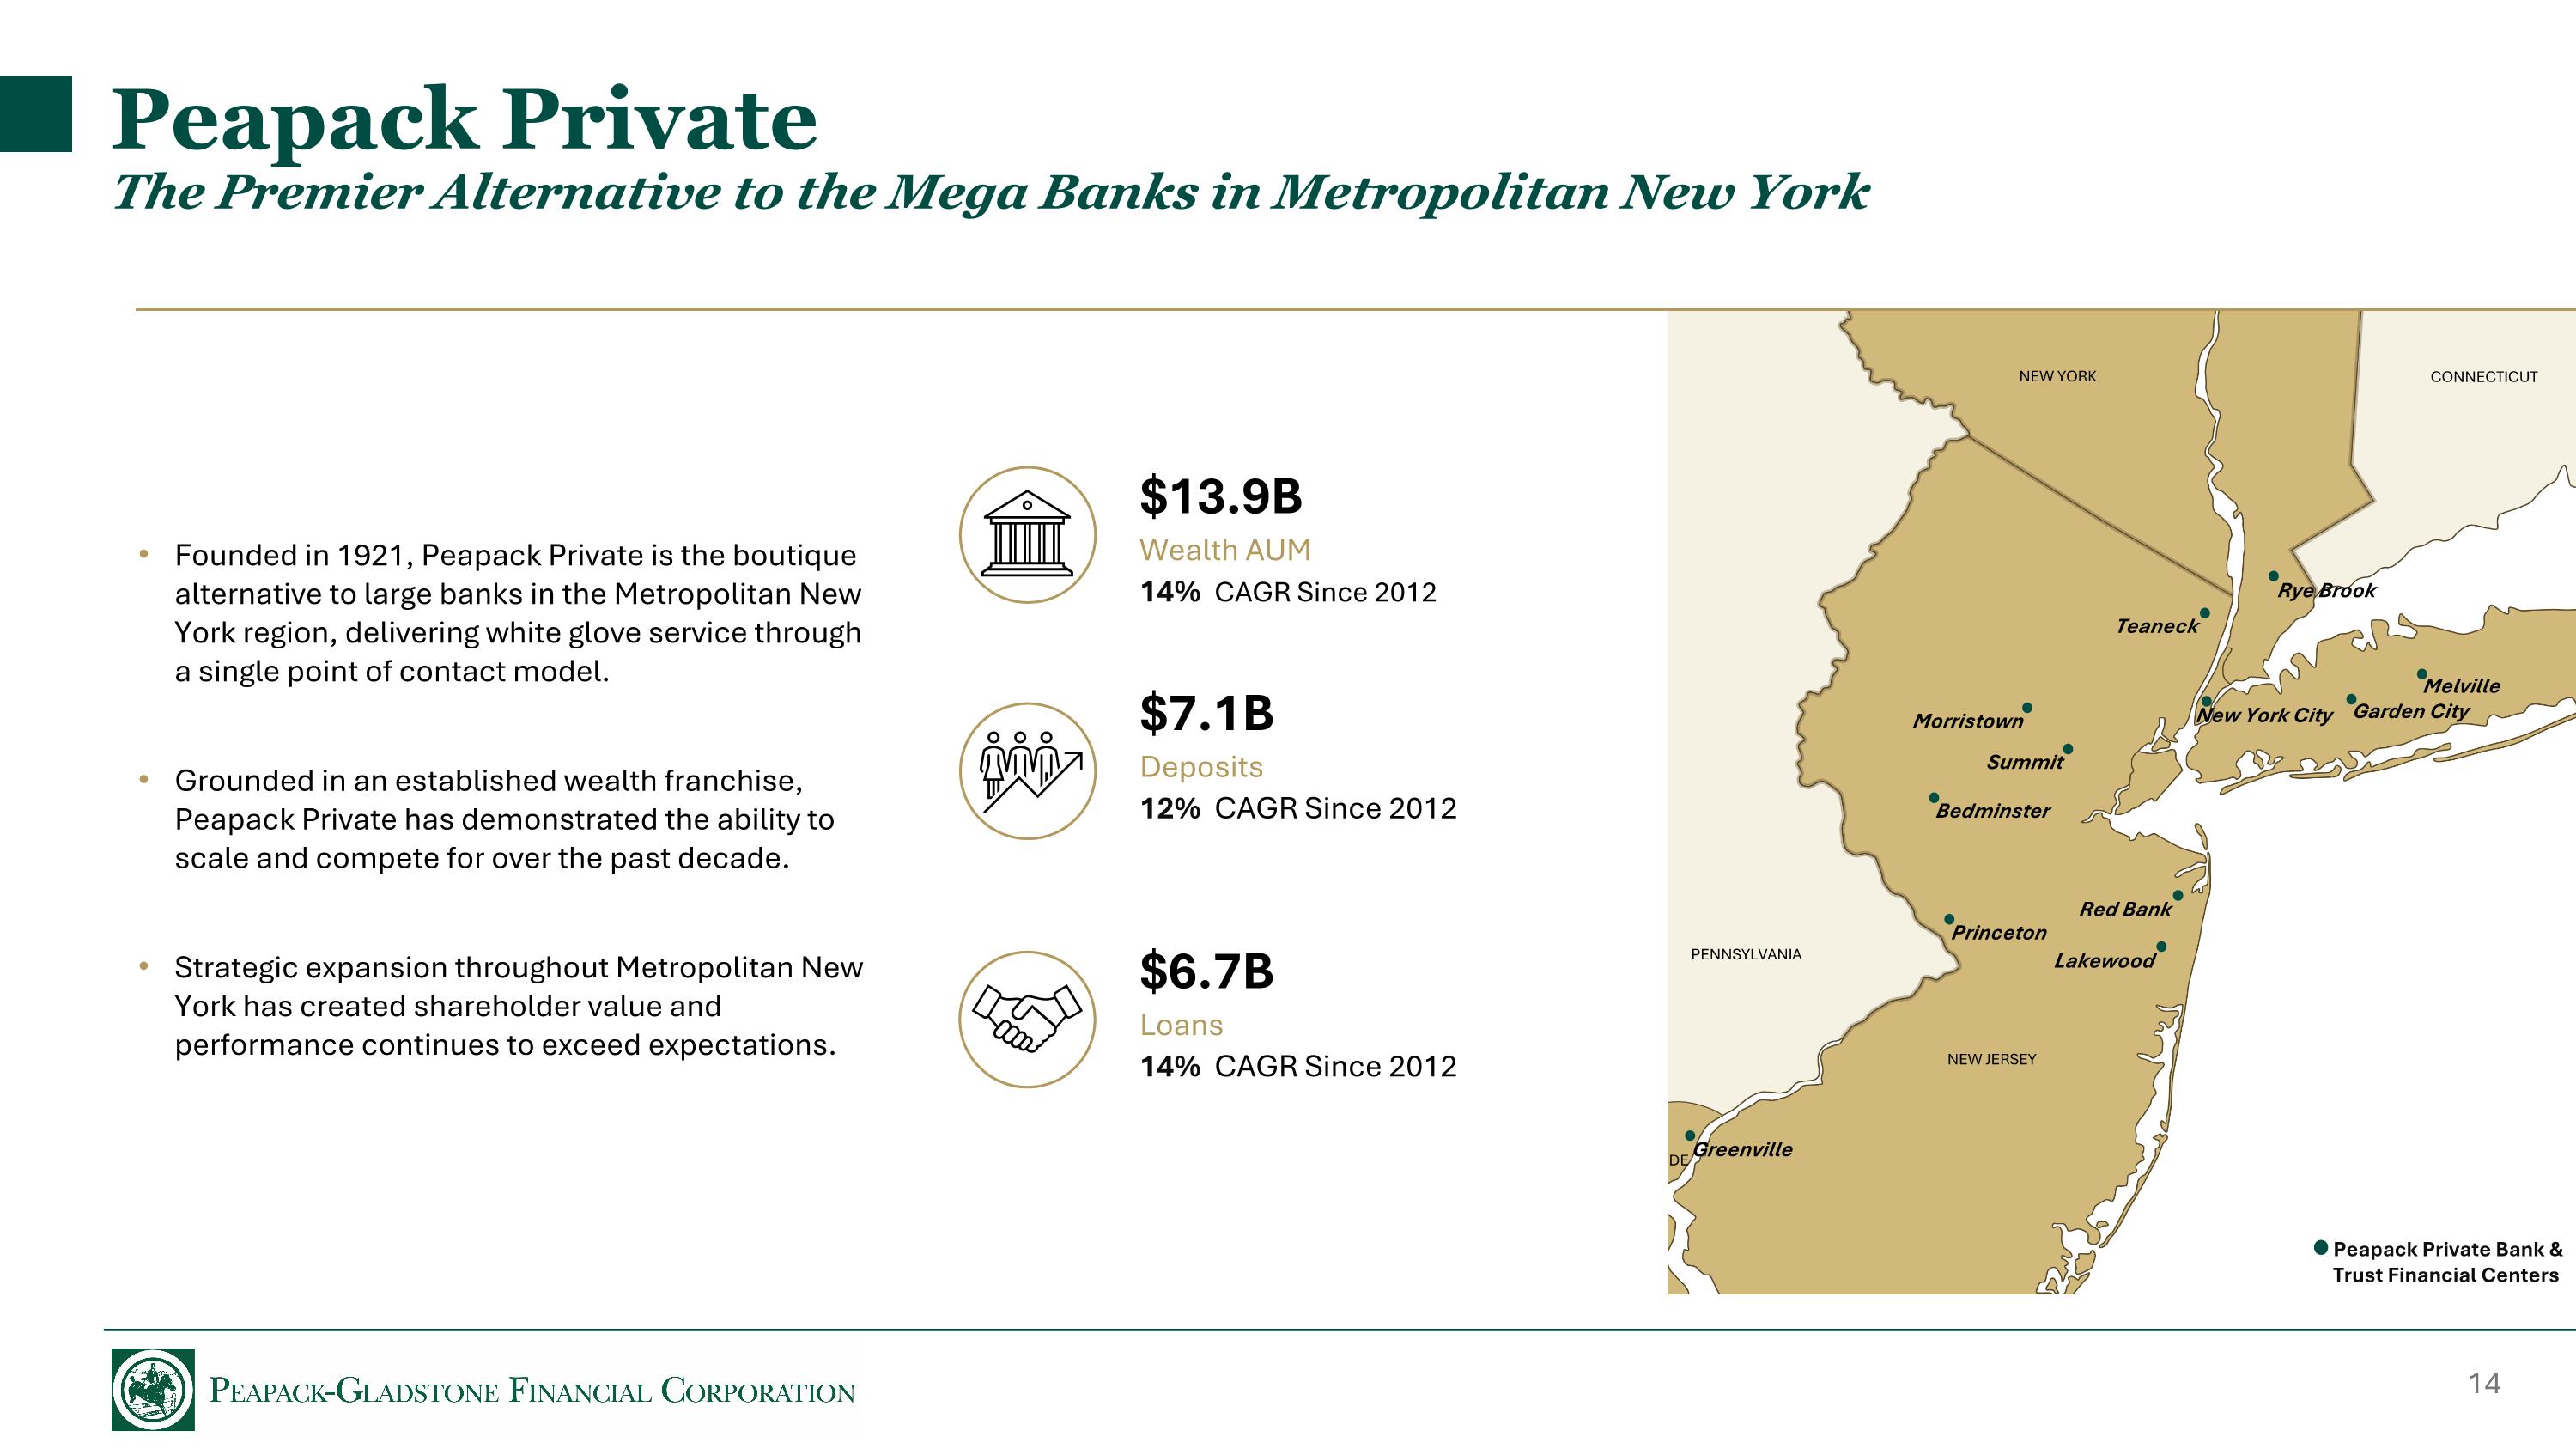
Bedminster New York City Melville NEW YORK NEW JERSEY CONNECTICUT PENNSYLVANIA Greenville Rye Brook Princeton Morristown Summit Red Bank Lakewood Teaneck DE Peapack Private Bank & Trust Financial Centers Garden City Peapack Private The Premier Alternative to the Mega Banks in Metropolitan New York $13.9B Wealth AUM 14% CAGR Since 2012 $7.1B Deposits 12% CAGR Since 2012 $6.7B Loans 14% CAGR Since 2012 Founded in 1921, Peapack Private is the boutique alternative to large banks in the Metropolitan New York region, delivering white glove service through a single point of contact model. Grounded in an established wealth franchise, Peapack Private has demonstrated the ability to scale and compete for over the past decade. Strategic expansion throughout Metropolitan New York has created shareholder value and performance continues to exceed expectations.
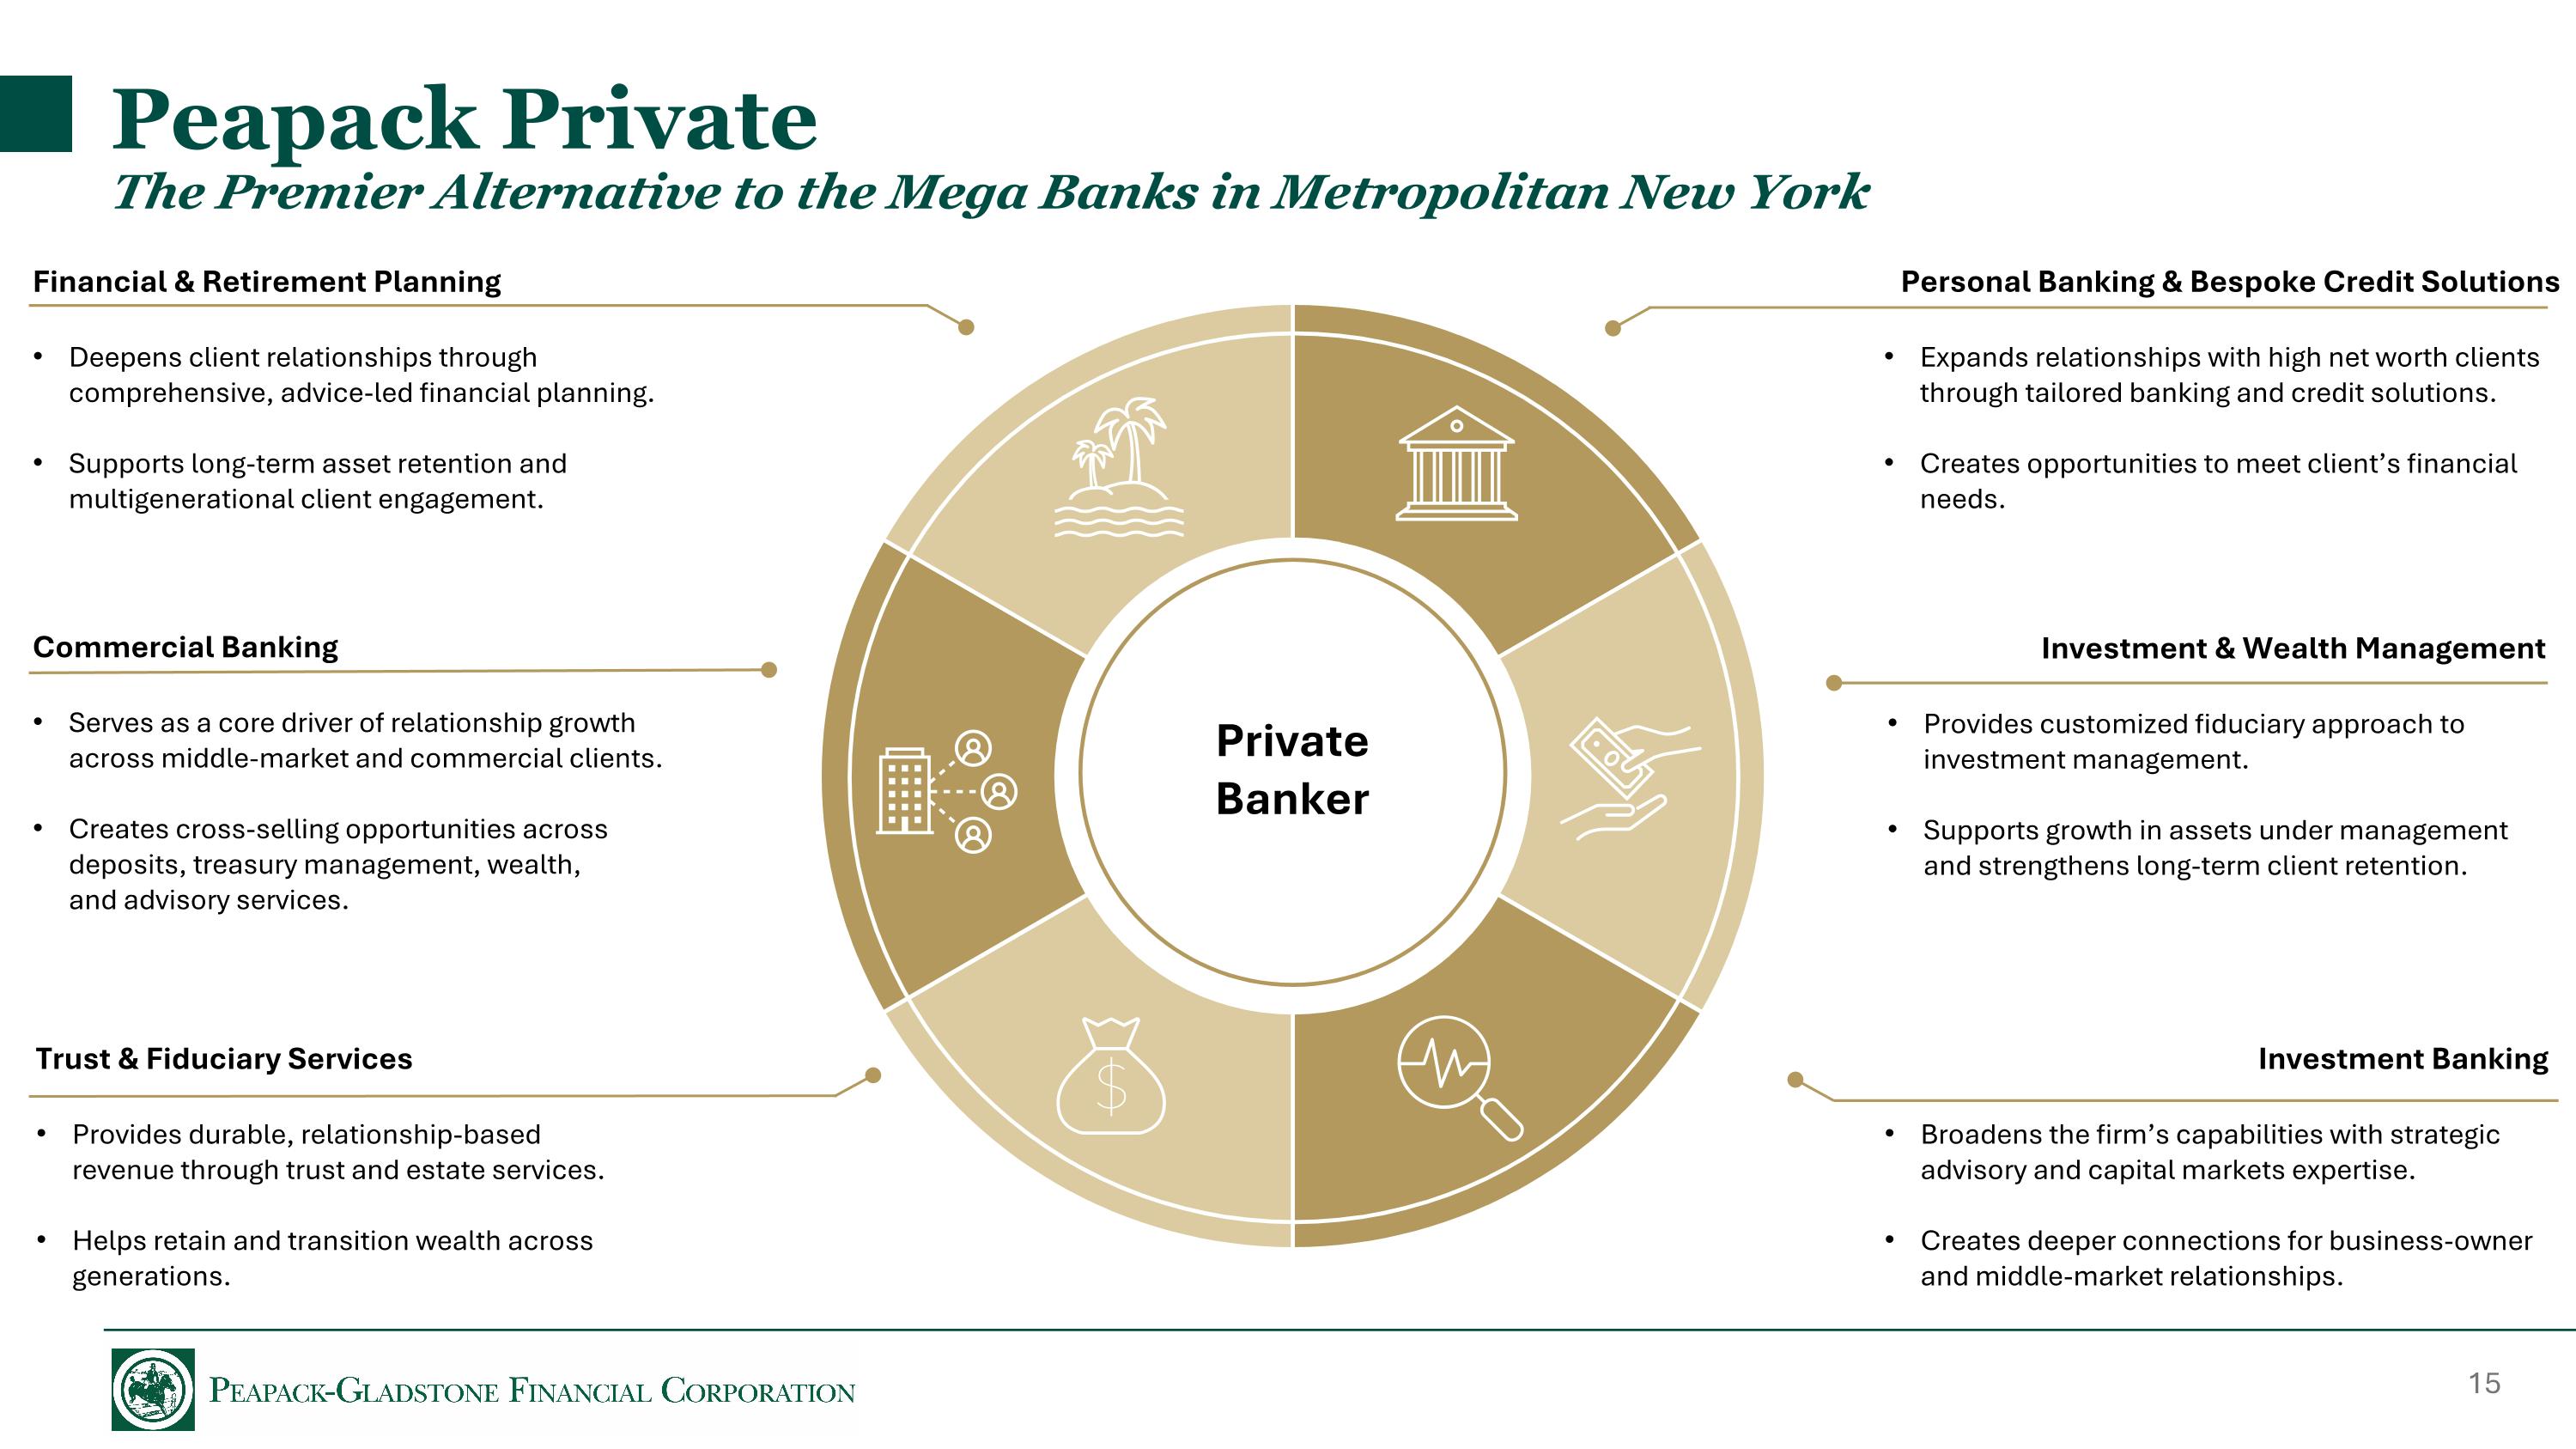
Investment Banking Broadens the firm’s capabilities with strategic advisory and capital markets expertise. Creates deeper connections for business-owner and middle-market relationships. Trust & Fiduciary Services Provides durable, relationship-based revenue through trust and estate services. Helps retain and transition wealth across generations. Financial & Retirement Planning Deepens client relationships through comprehensive, advice-led financial planning. Supports long-term asset retention and multigenerational client engagement. Personal Banking & Bespoke Credit Solutions Expands relationships with high net worth clients through tailored banking and credit solutions. Creates opportunities to meet client’s financial needs. Investment & Wealth Management Provides customized fiduciary approach to investment management. Supports growth in assets under management and strengthens long-term client retention. Peapack Private The Premier Alternative to the Mega Banks in Metropolitan New York Commercial Banking Serves as a core driver of relationship growth across middle-market and commercial clients. Creates cross-selling opportunities across deposits, treasury management, wealth, and advisory services. Private Banker
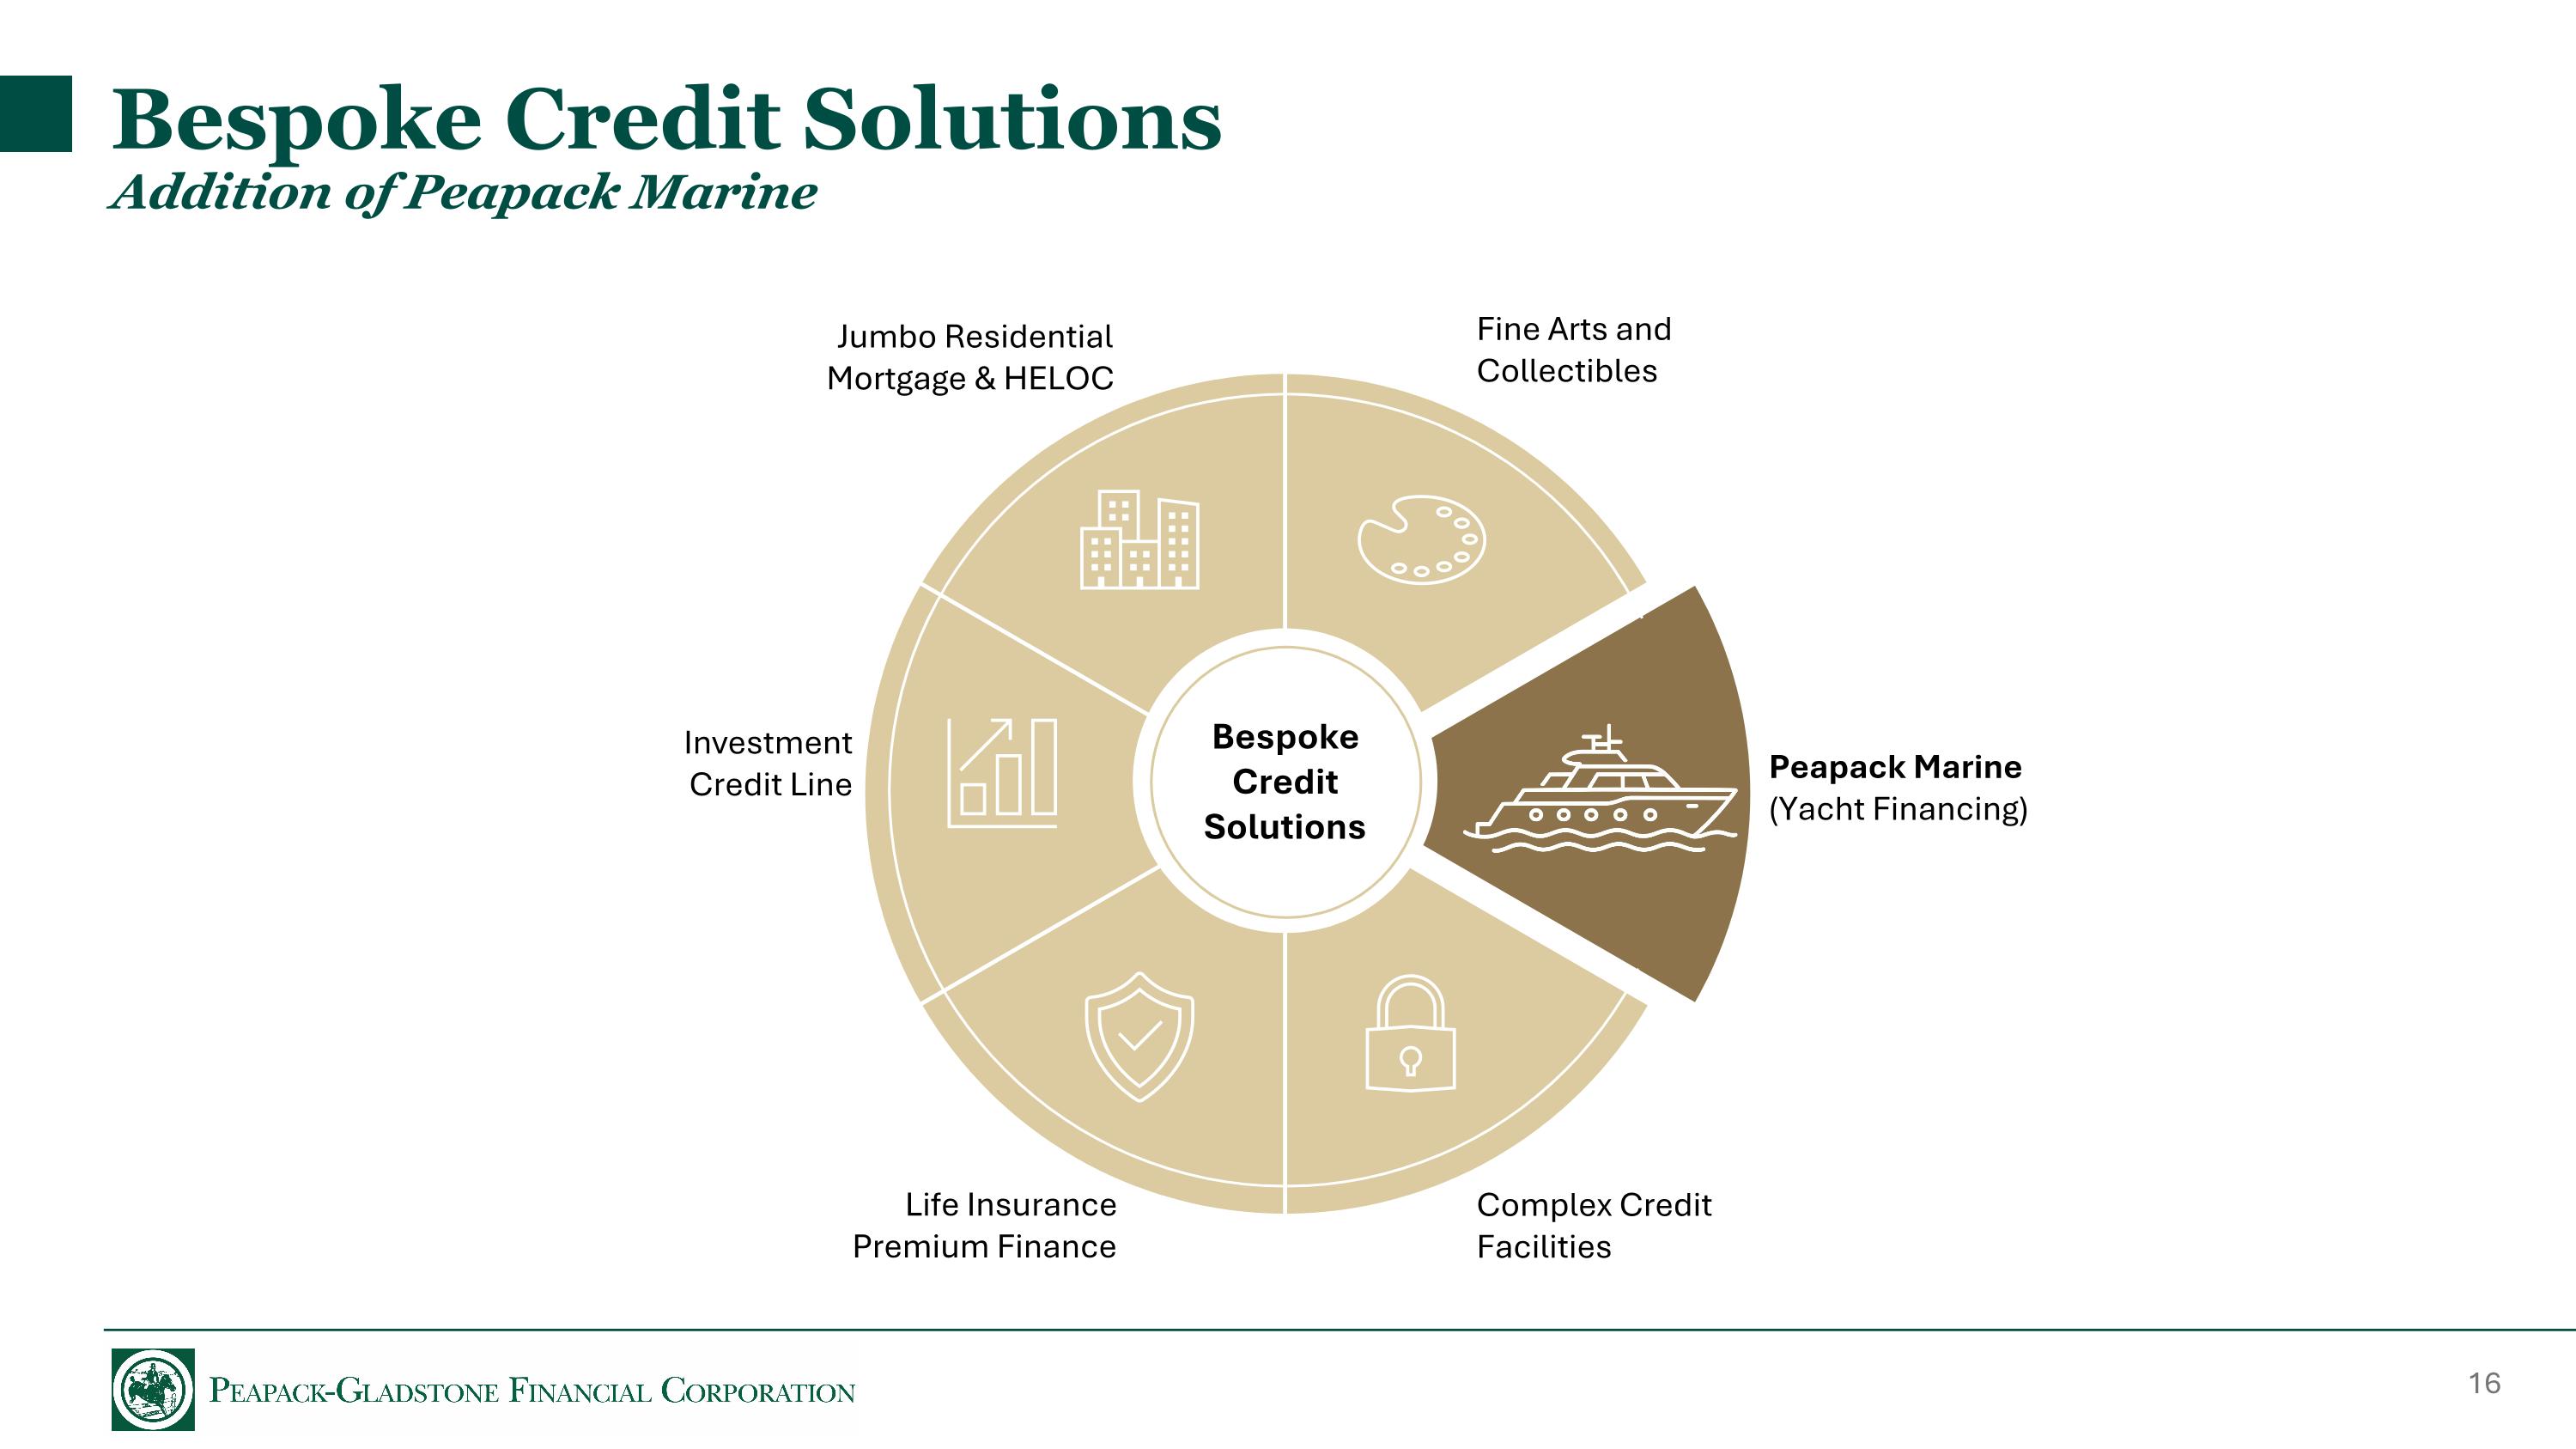
Bespoke Credit Solutions Addition of Peapack Marine Bespoke Credit Solutions Fine Arts and Collectibles Jumbo Residential Mortgage & HELOC Investment Credit Line Life Insurance Premium Finance Complex Credit Facilities Peapack Marine (Yacht Financing)
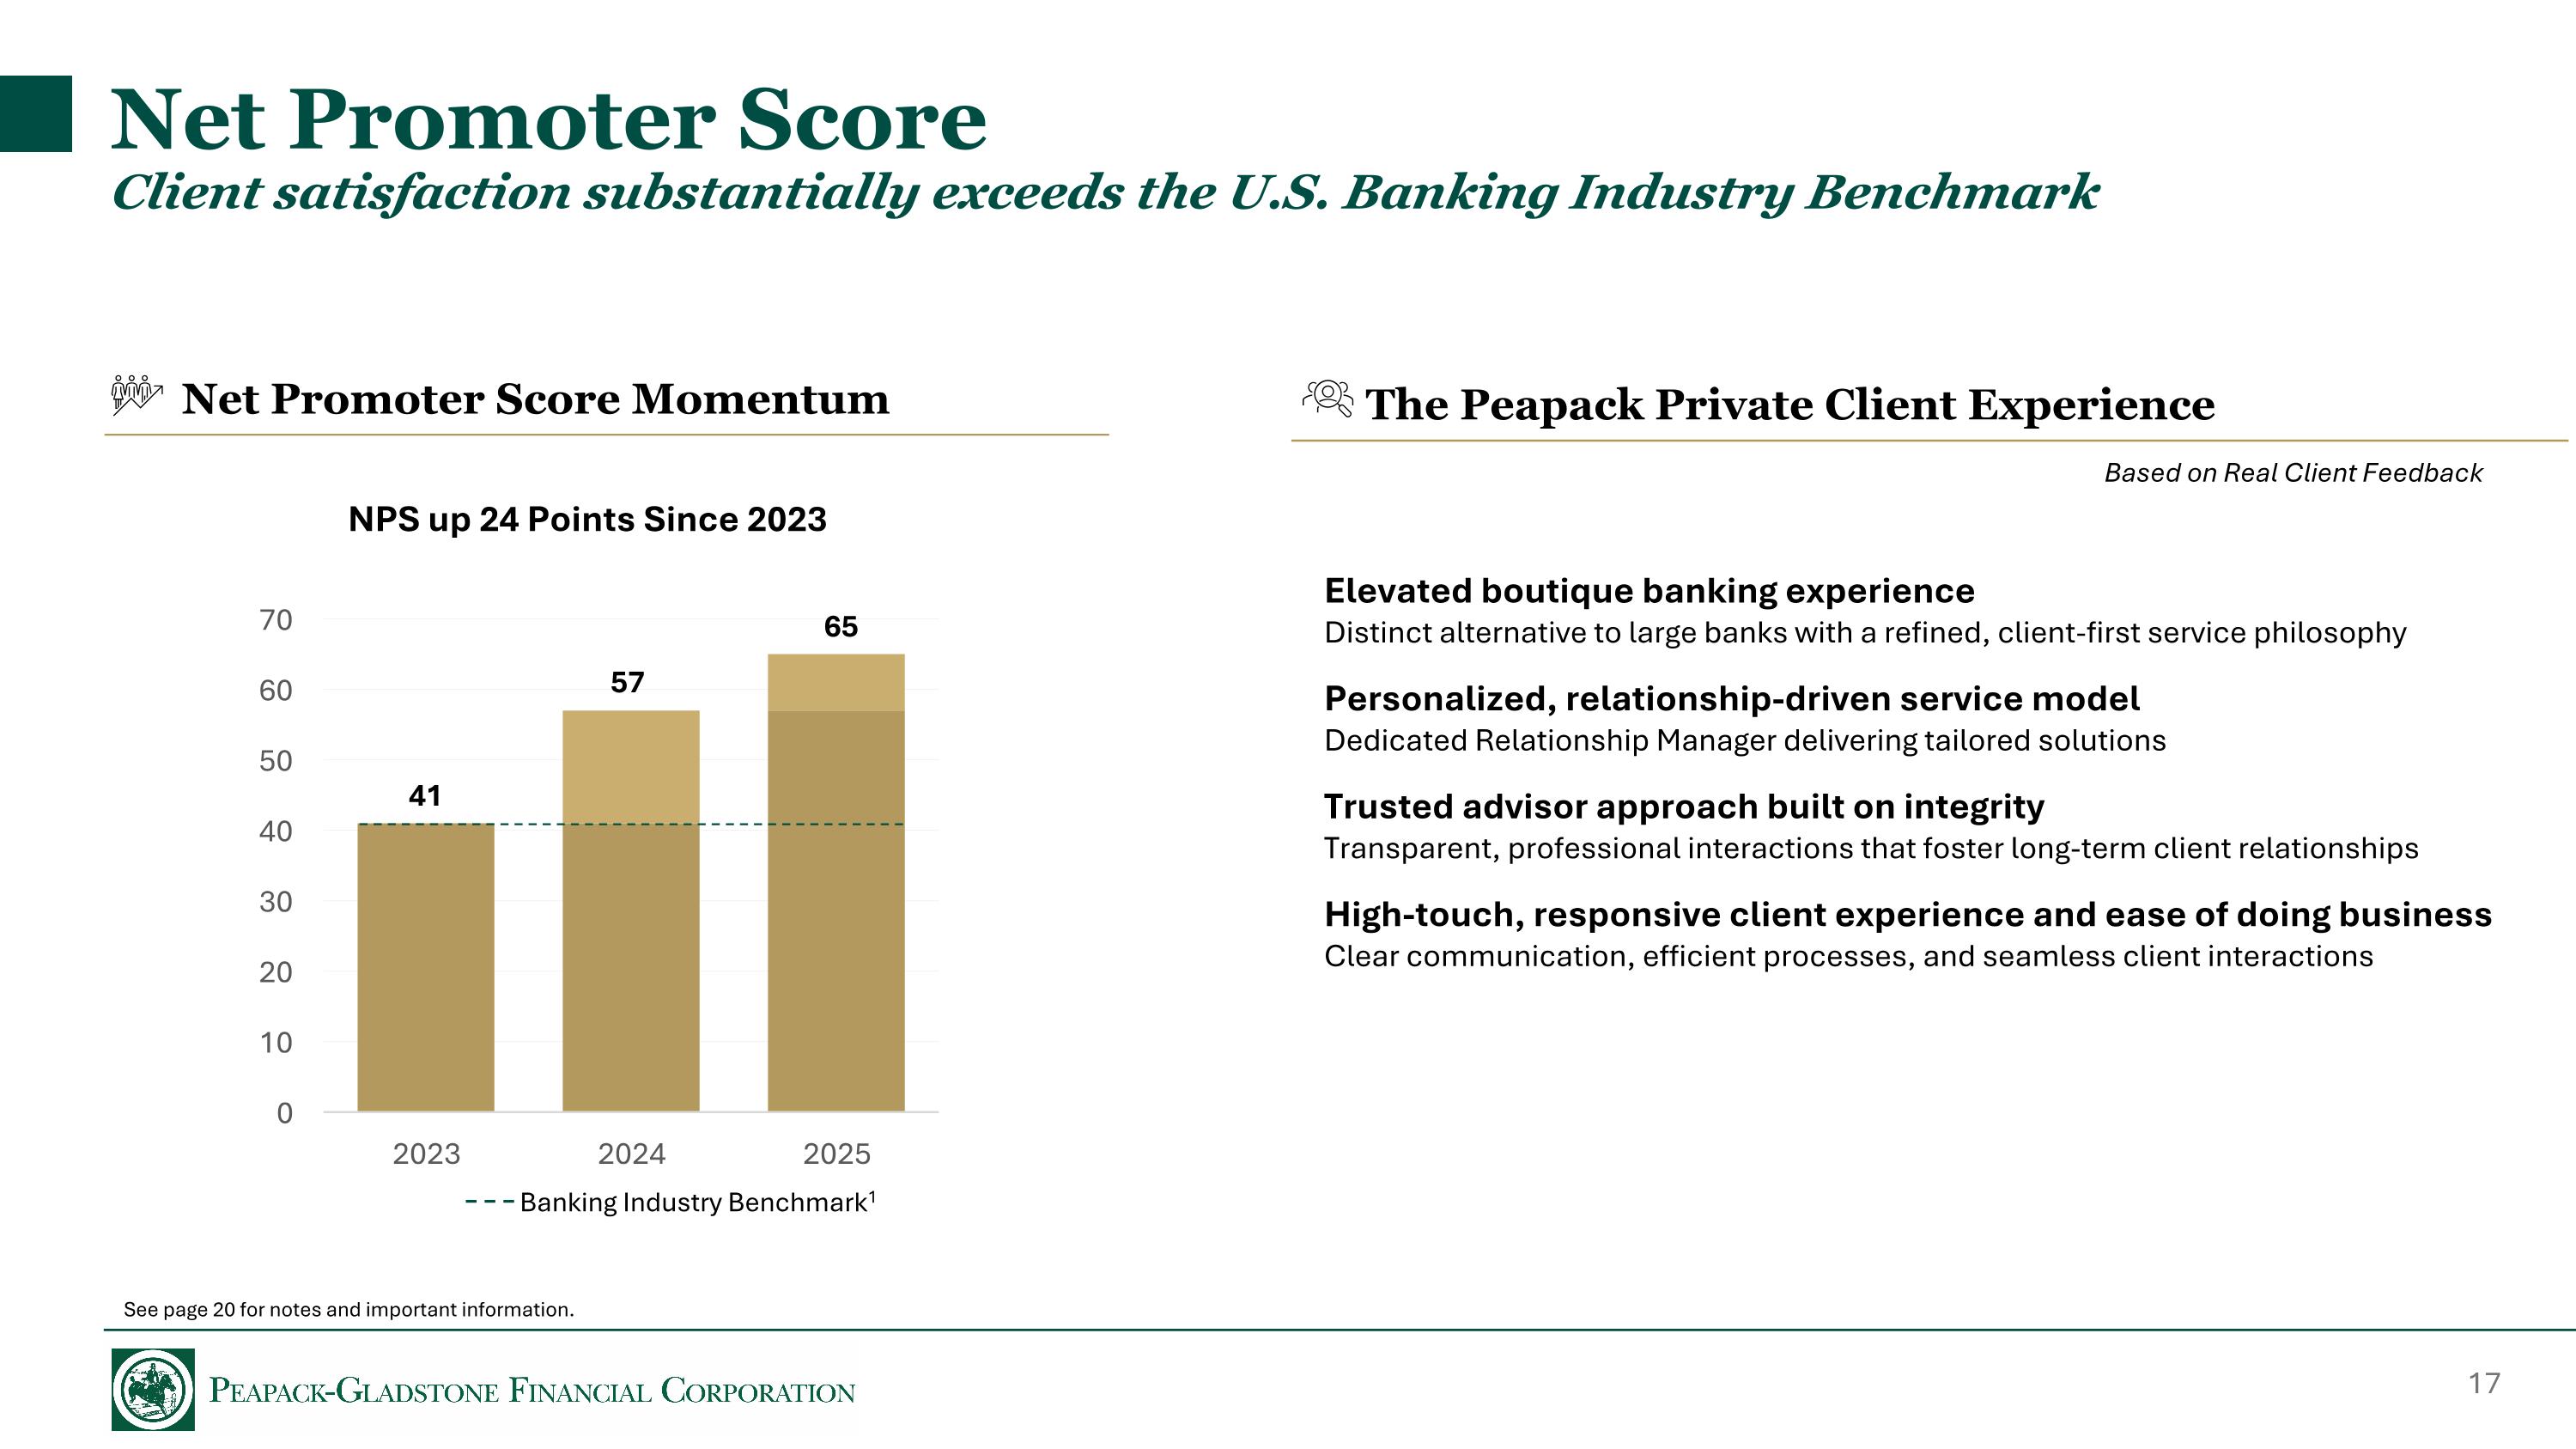
The Peapack Private Client Experience Net Promoter Score Client satisfaction substantially exceeds the U.S. Banking Industry Benchmark Elevated boutique banking experience Distinct alternative to large banks with a refined, client-first service philosophy Personalized, relationship-driven service model Dedicated Relationship Manager delivering tailored solutions Trusted advisor approach built on integrity Transparent, professional interactions that foster long-term client relationships High-touch, responsive client experience and ease of doing business Clear communication, efficient processes, and seamless client interactions Net Promoter Score Momentum 41 57 65 NPS up 24 Points Since 2023 Banking Industry Benchmark1 Based on Real Client Feedback See page 20 for notes and important information.
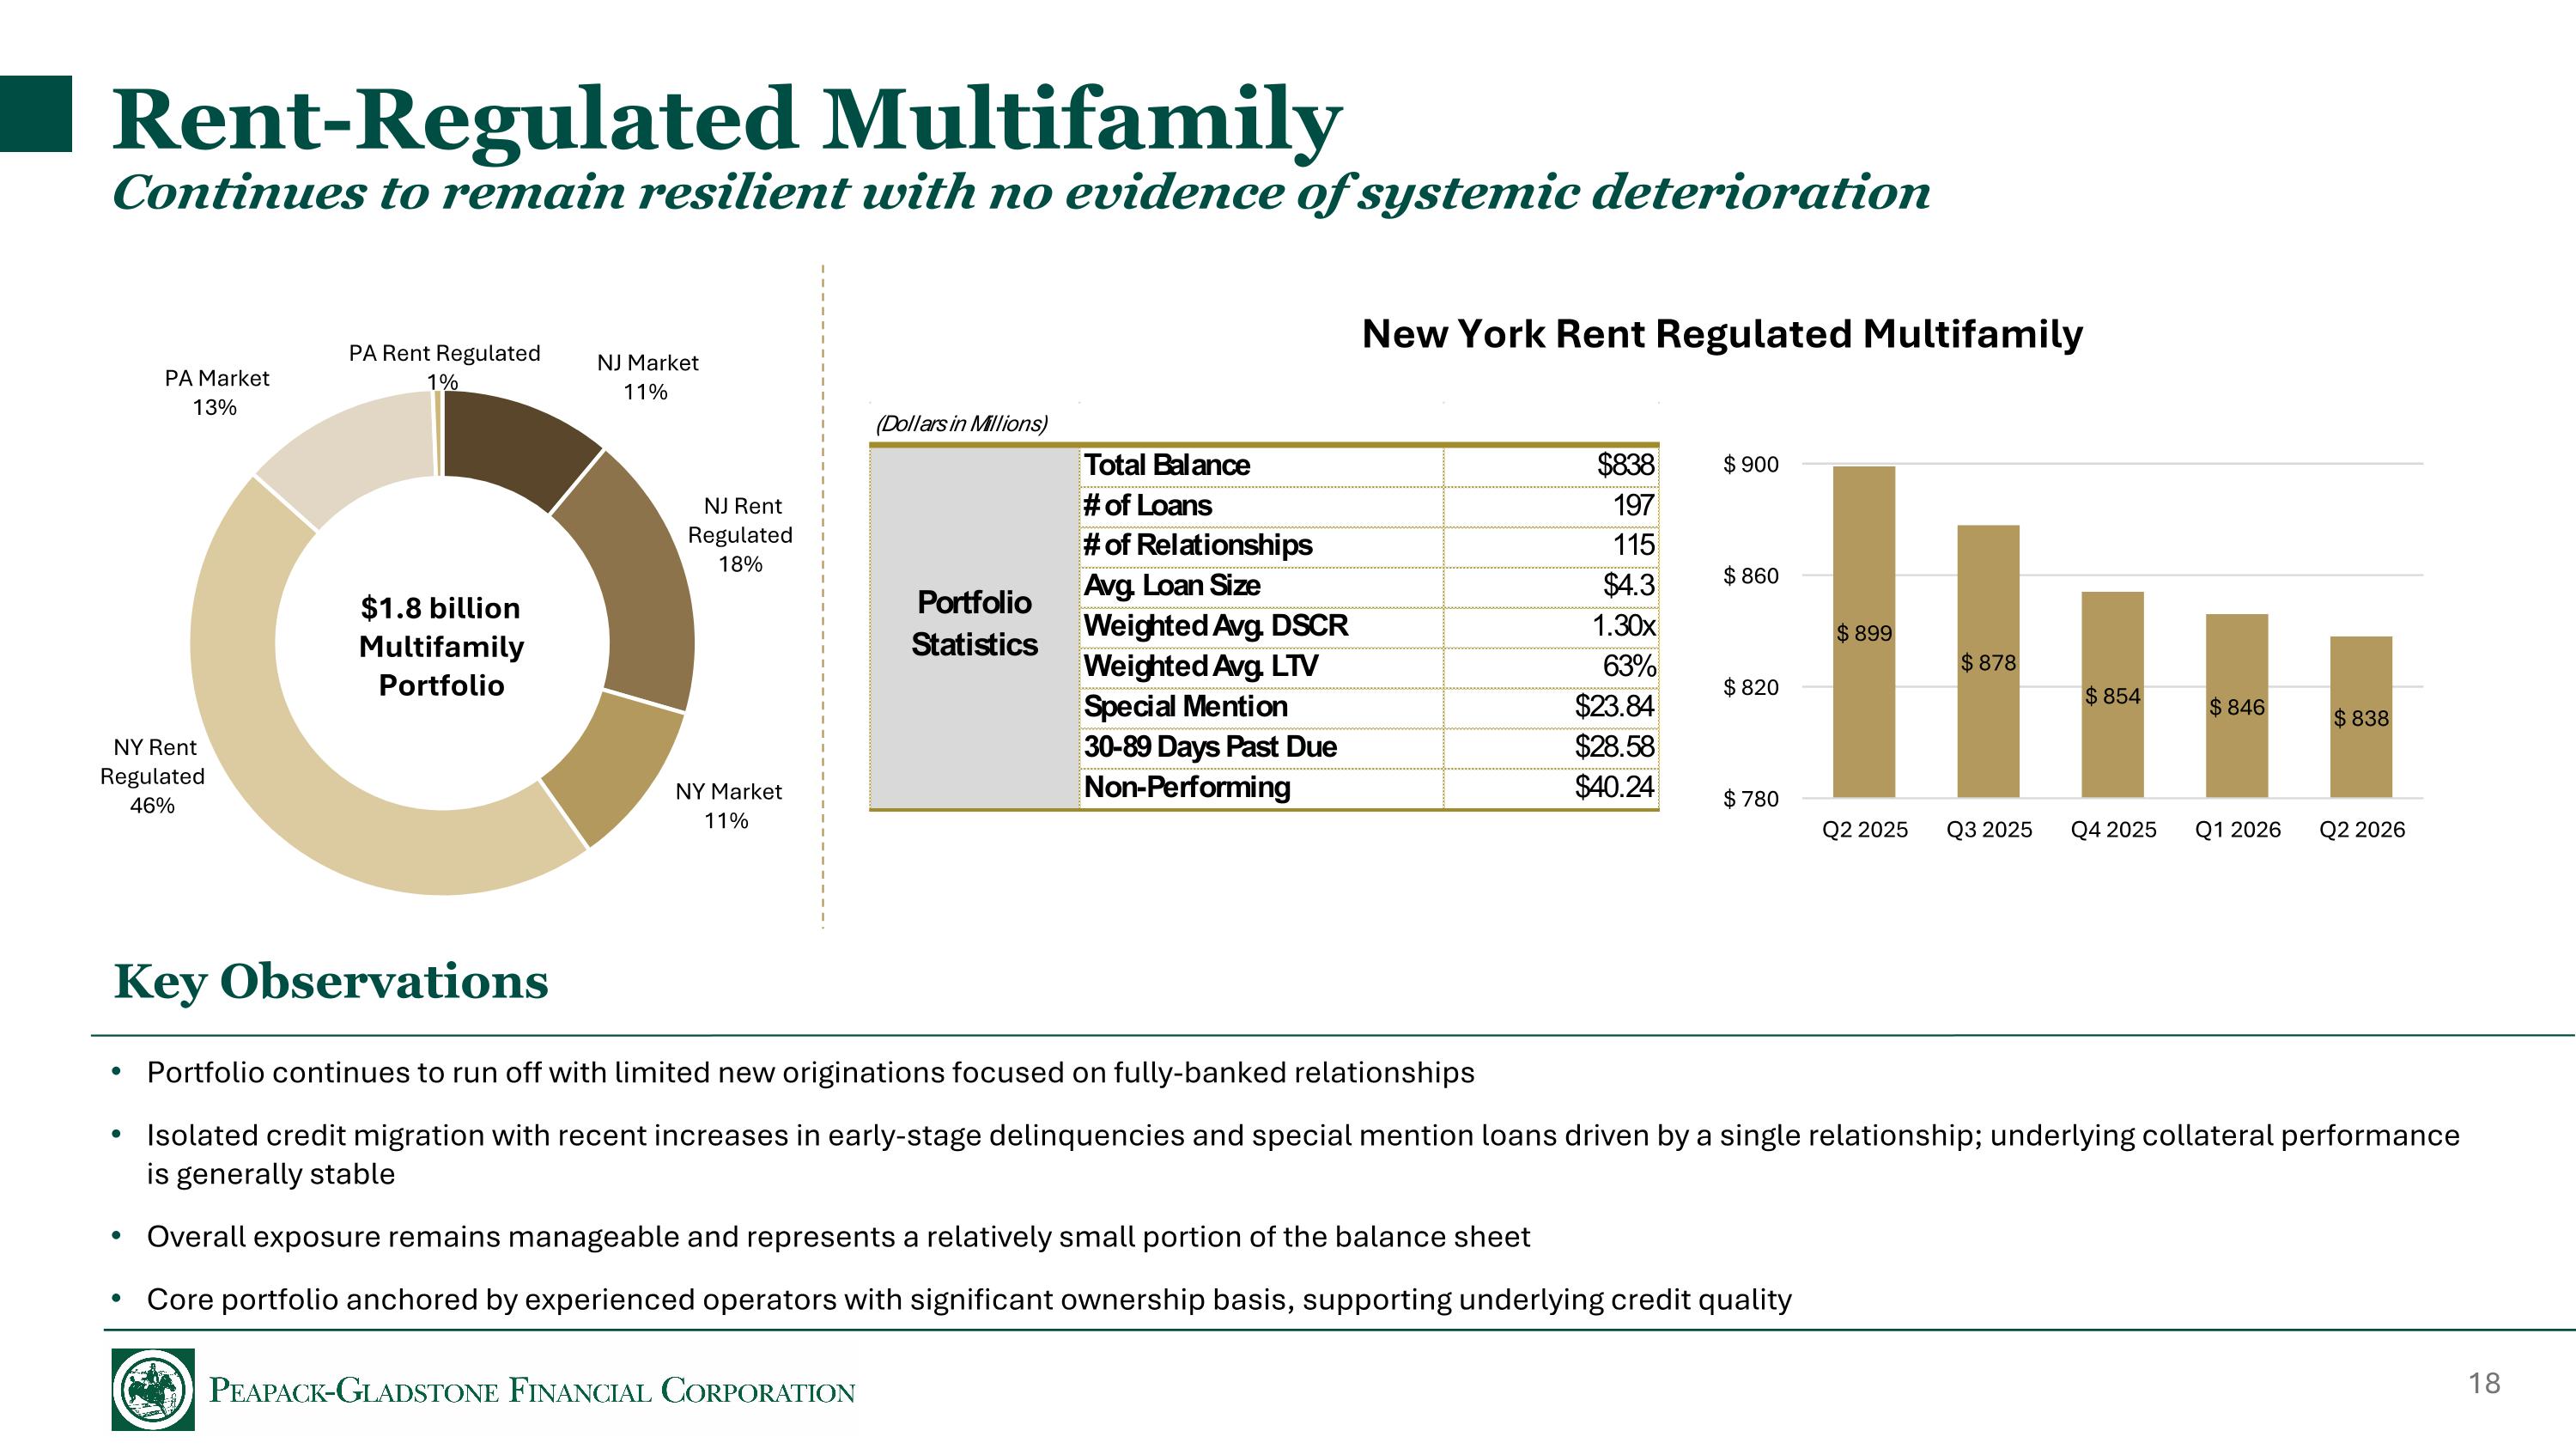
Rent-Regulated Multifamily Continues to remain resilient with no evidence of systemic deterioration $1.8 billion Multifamily Portfolio Portfolio continues to run off with limited new originations focused on fully-banked relationships Isolated credit migration with recent increases in early-stage delinquencies and special mention loans driven by a single relationship; underlying collateral performance is generally stable Overall exposure remains manageable and represents a relatively small portion of the balance sheet Core portfolio anchored by experienced operators with significant ownership basis, supporting underlying credit quality New York Rent Regulated Multifamily Key Observations

Appendix B: Notes & Financial Tables
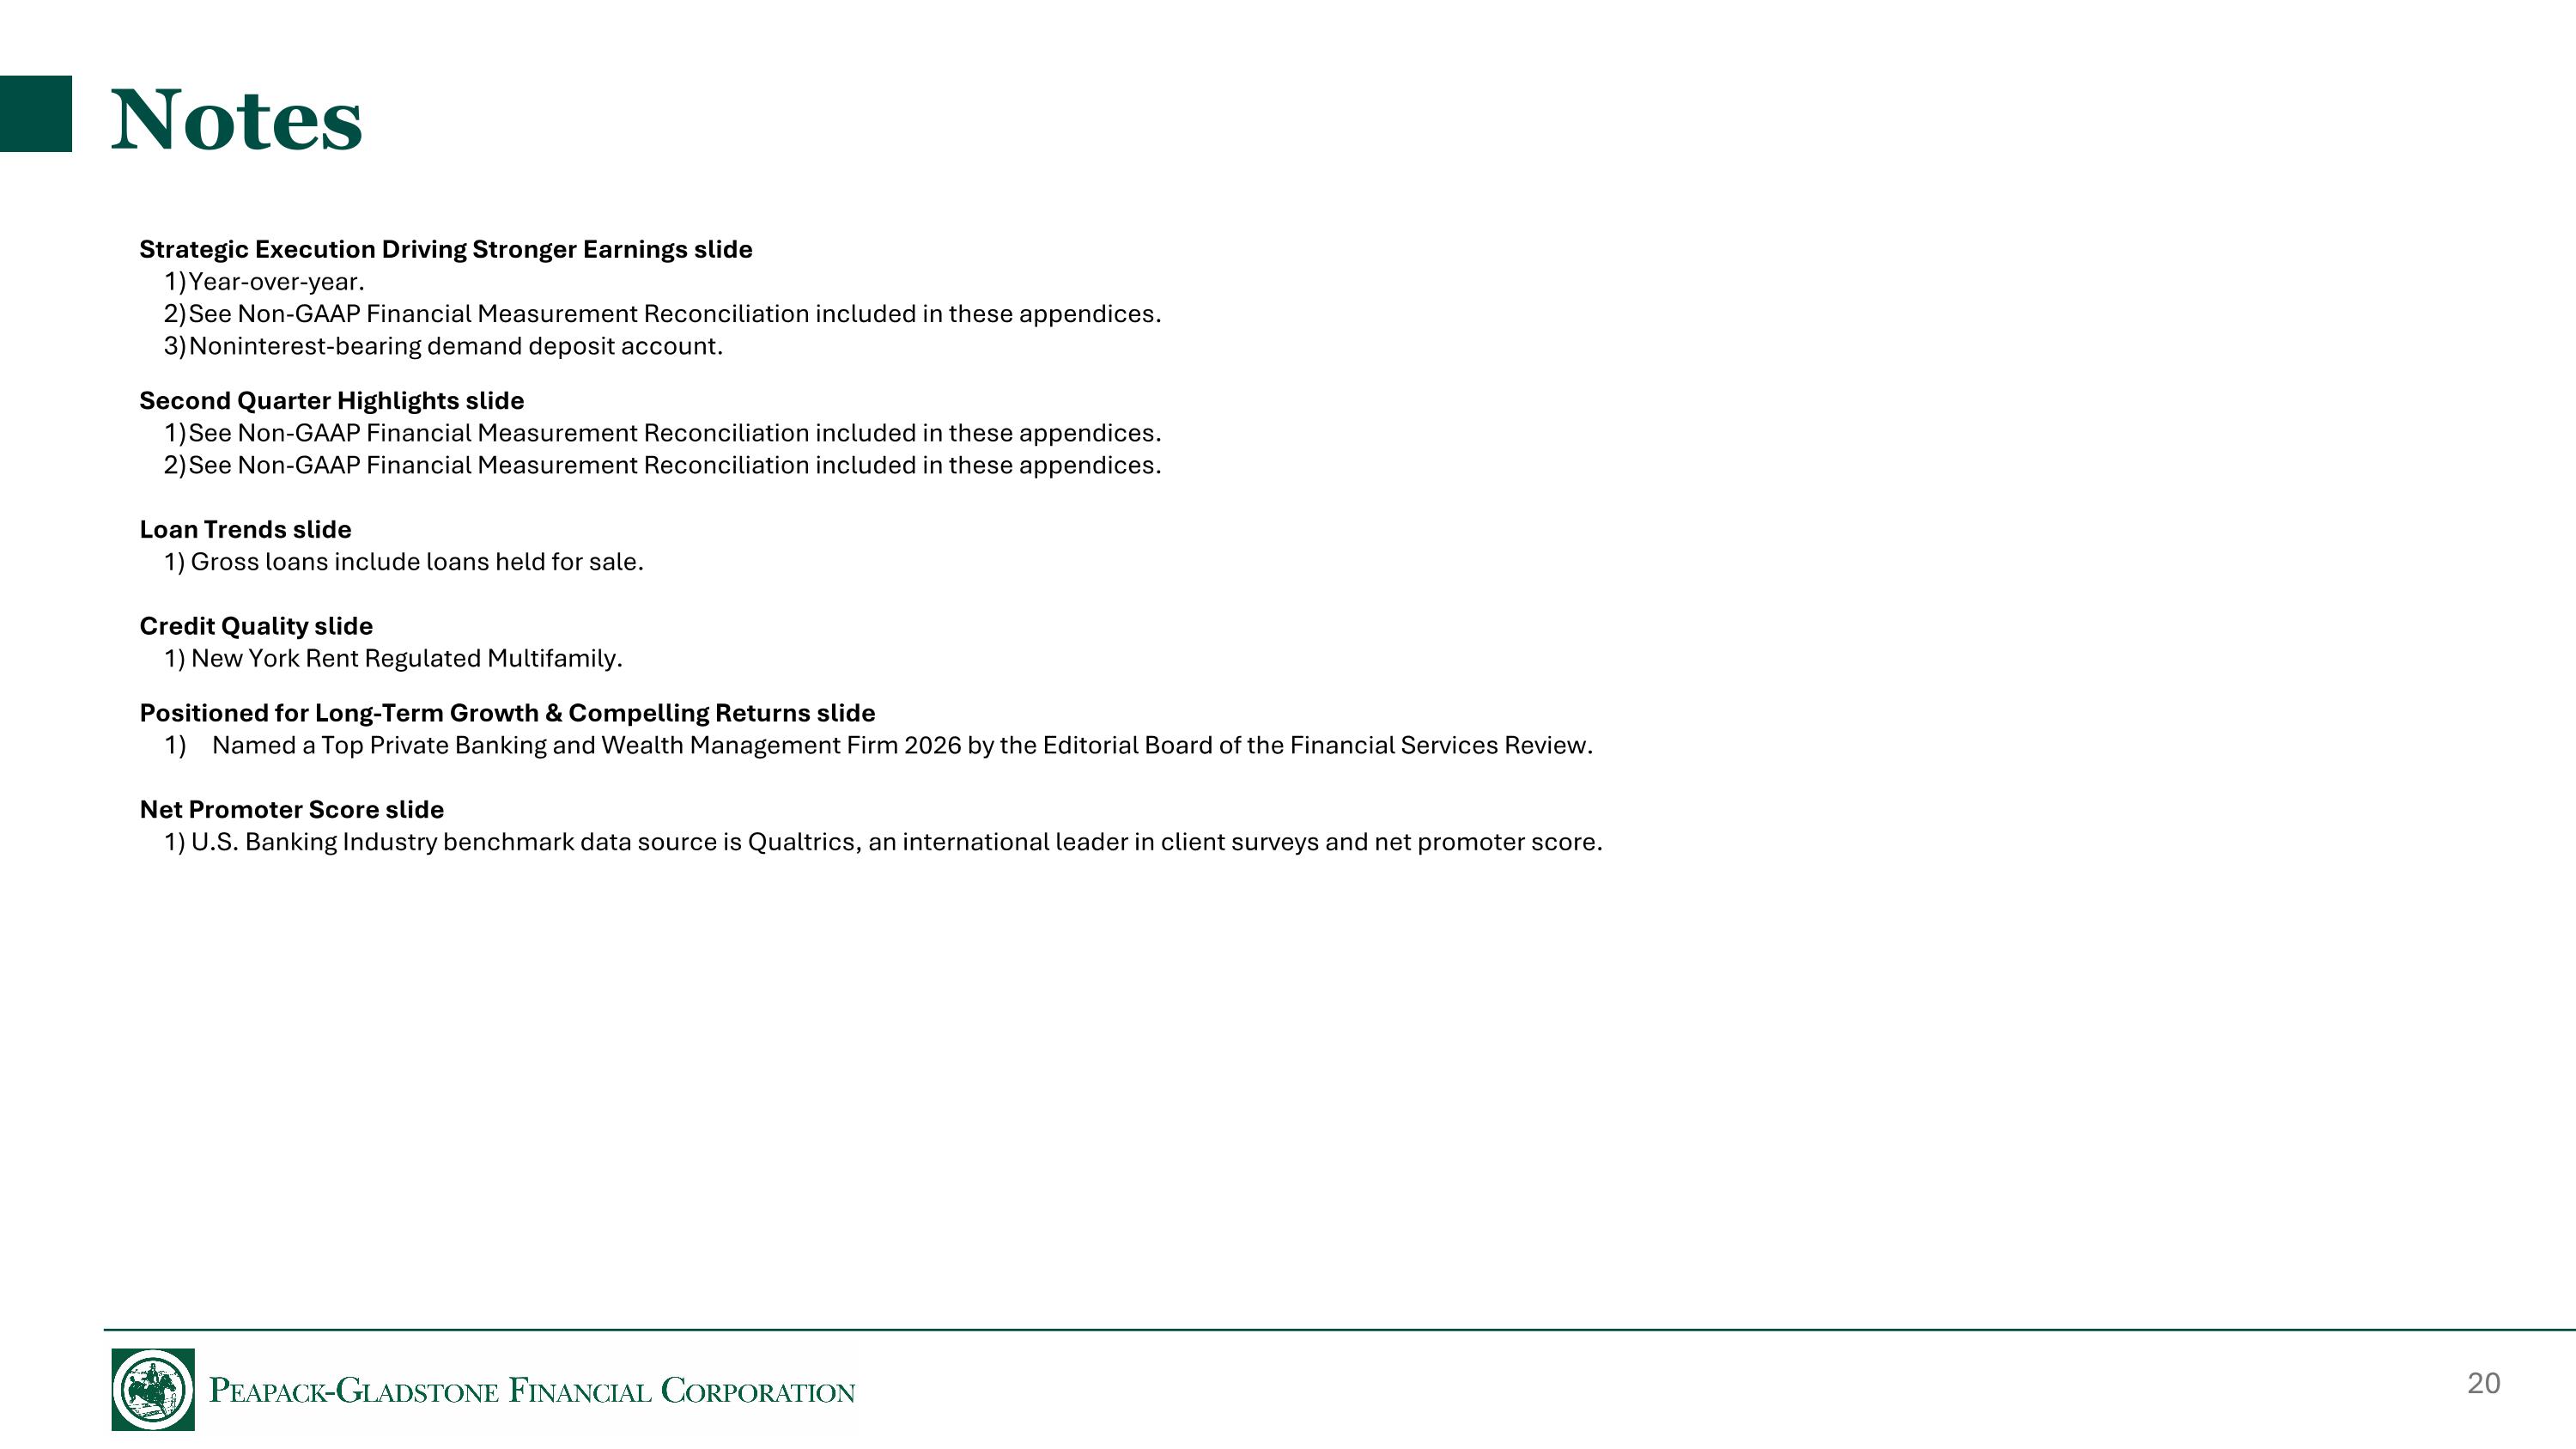
Notes Strategic Execution Driving Stronger Earnings slide Year-over-year. See Non-GAAP Financial Measurement Reconciliation included in these appendices. Noninterest-bearing demand deposit account. Second Quarter Highlights slide See Non-GAAP Financial Measurement Reconciliation included in these appendices. See Non-GAAP Financial Measurement Reconciliation included in these appendices. Loan Trends slide 1) Gross loans include loans held for sale. Credit Quality slide 1) New York Rent Regulated Multifamily. Positioned for Long-Term Growth & Compelling Returns slide Named a Top Private Banking and Wealth Management Firm 2026 by the Editorial Board of the Financial Services Review. Net Promoter Score slide 1) U.S. Banking Industry benchmark data source is Qualtrics, an international leader in client surveys and net promoter score.
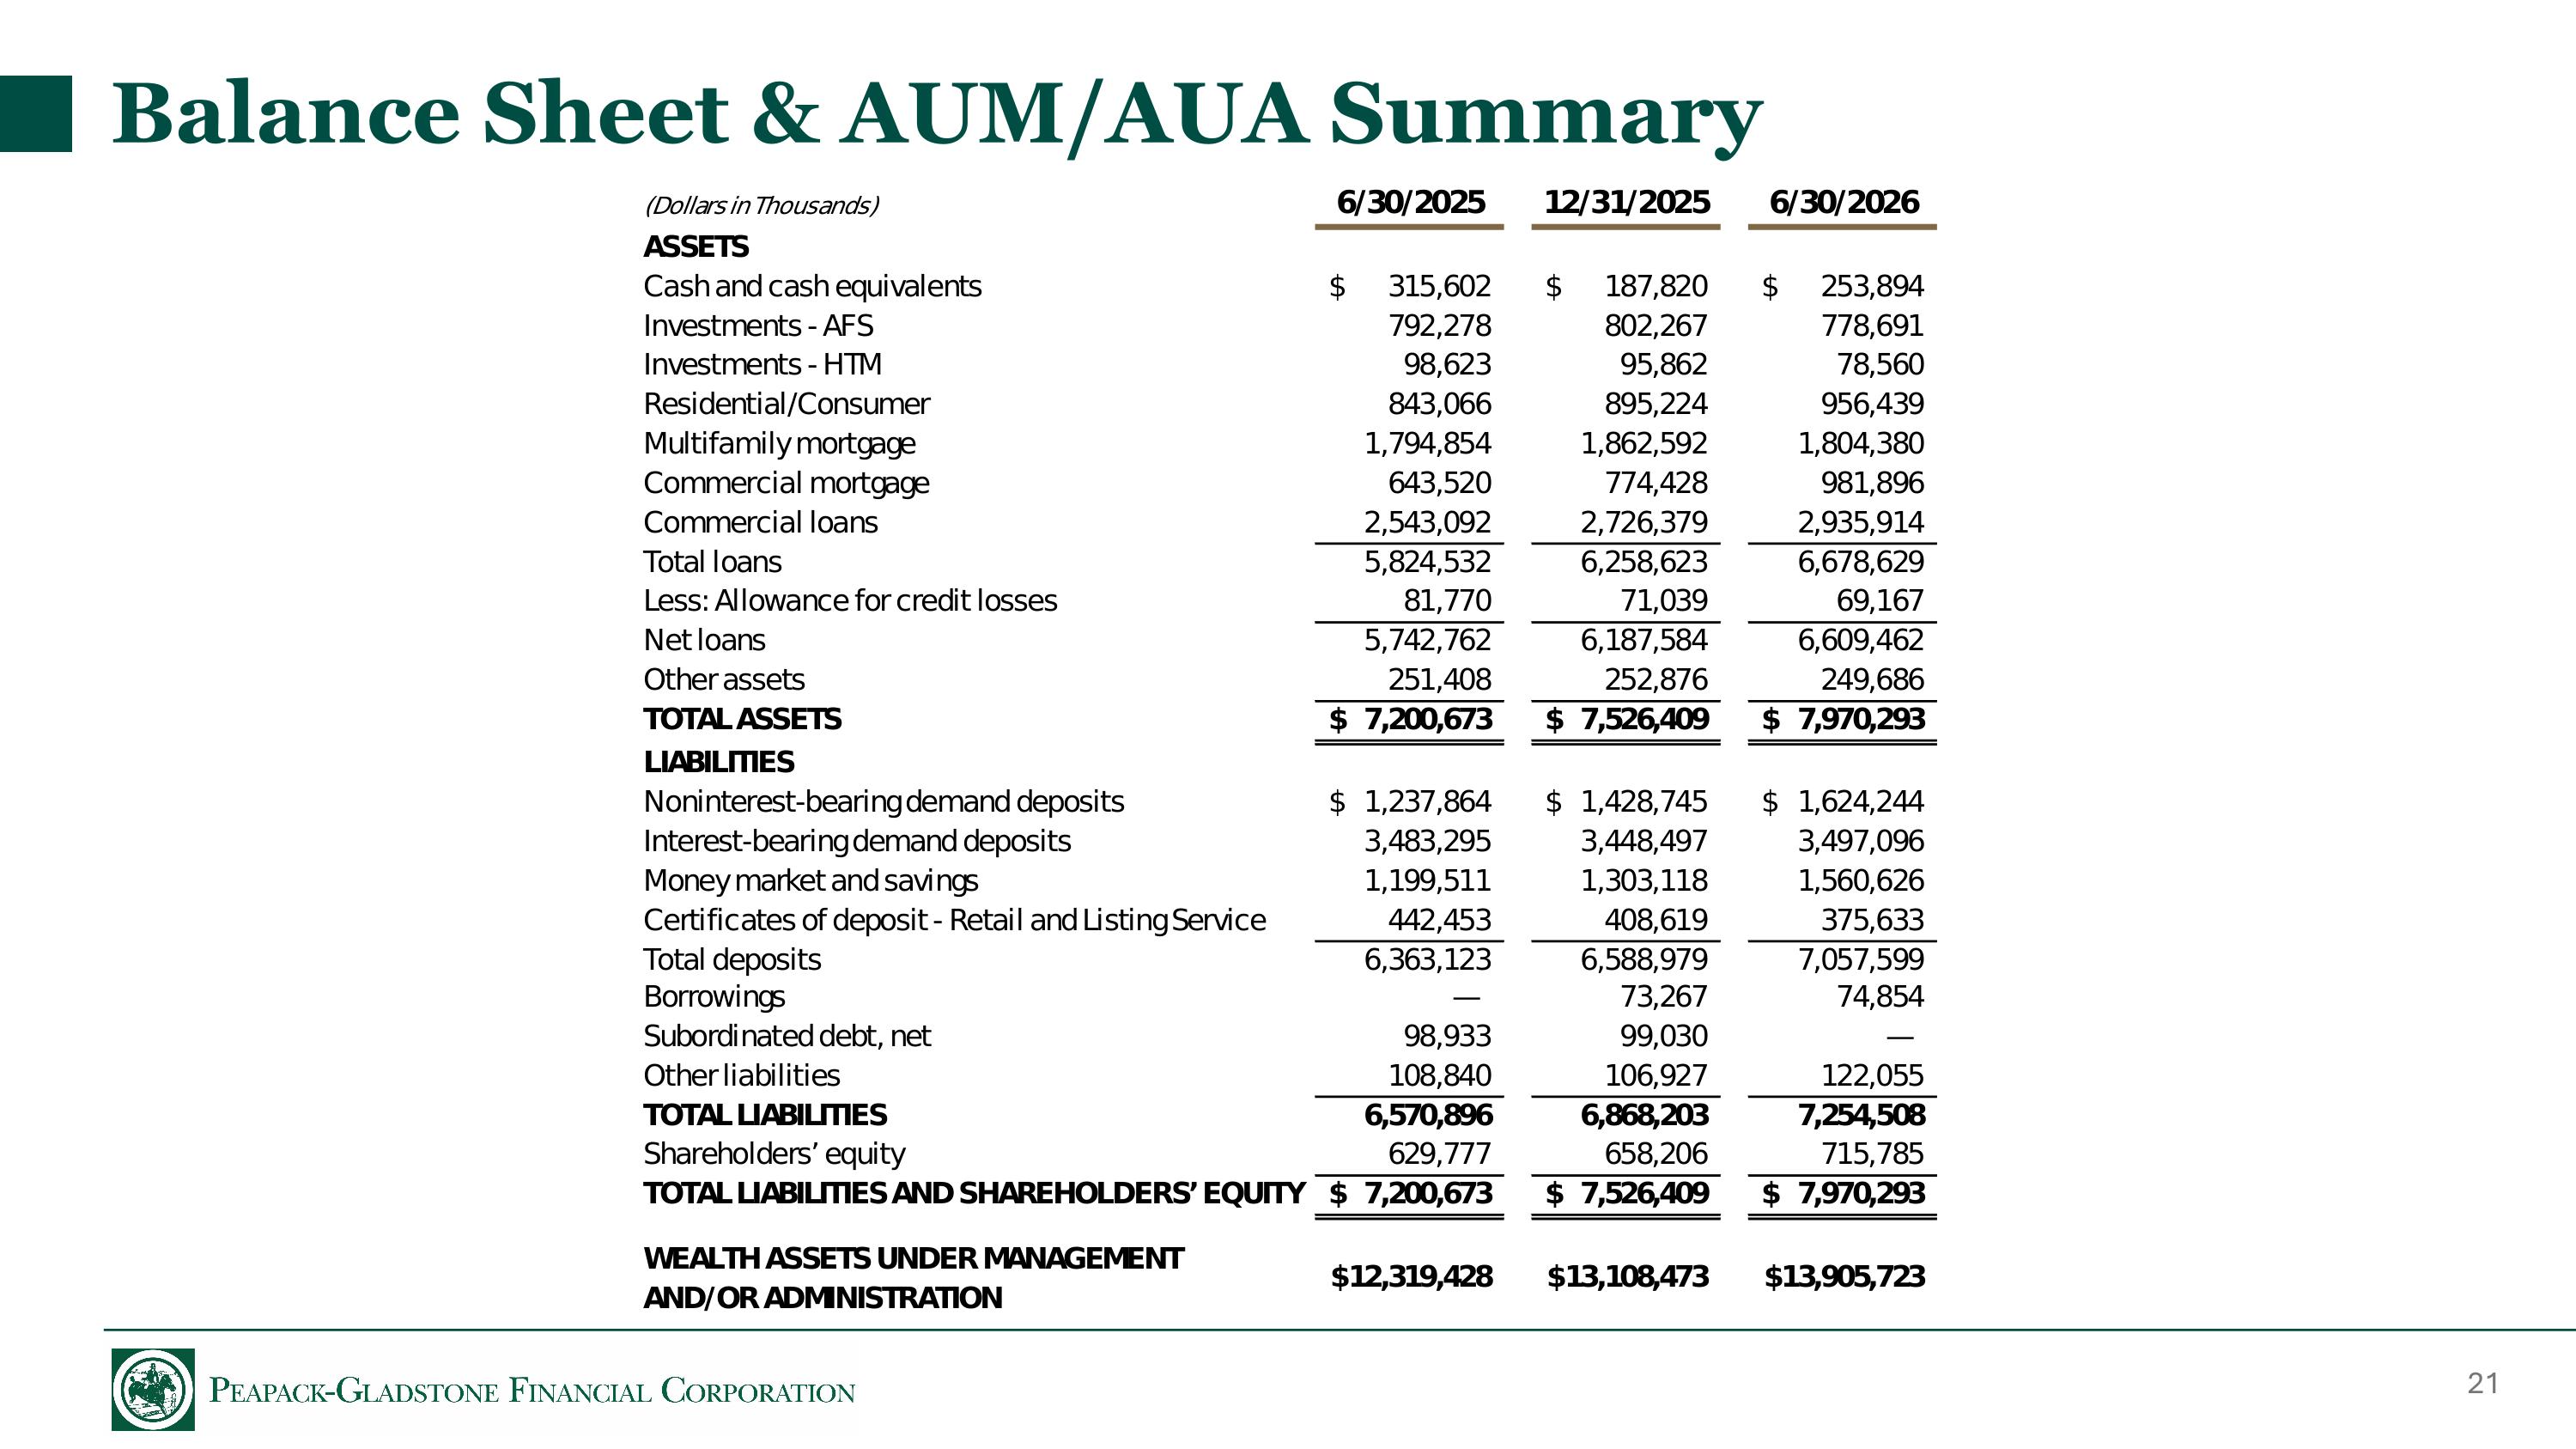
Balance Sheet & AUM/AUA Summary
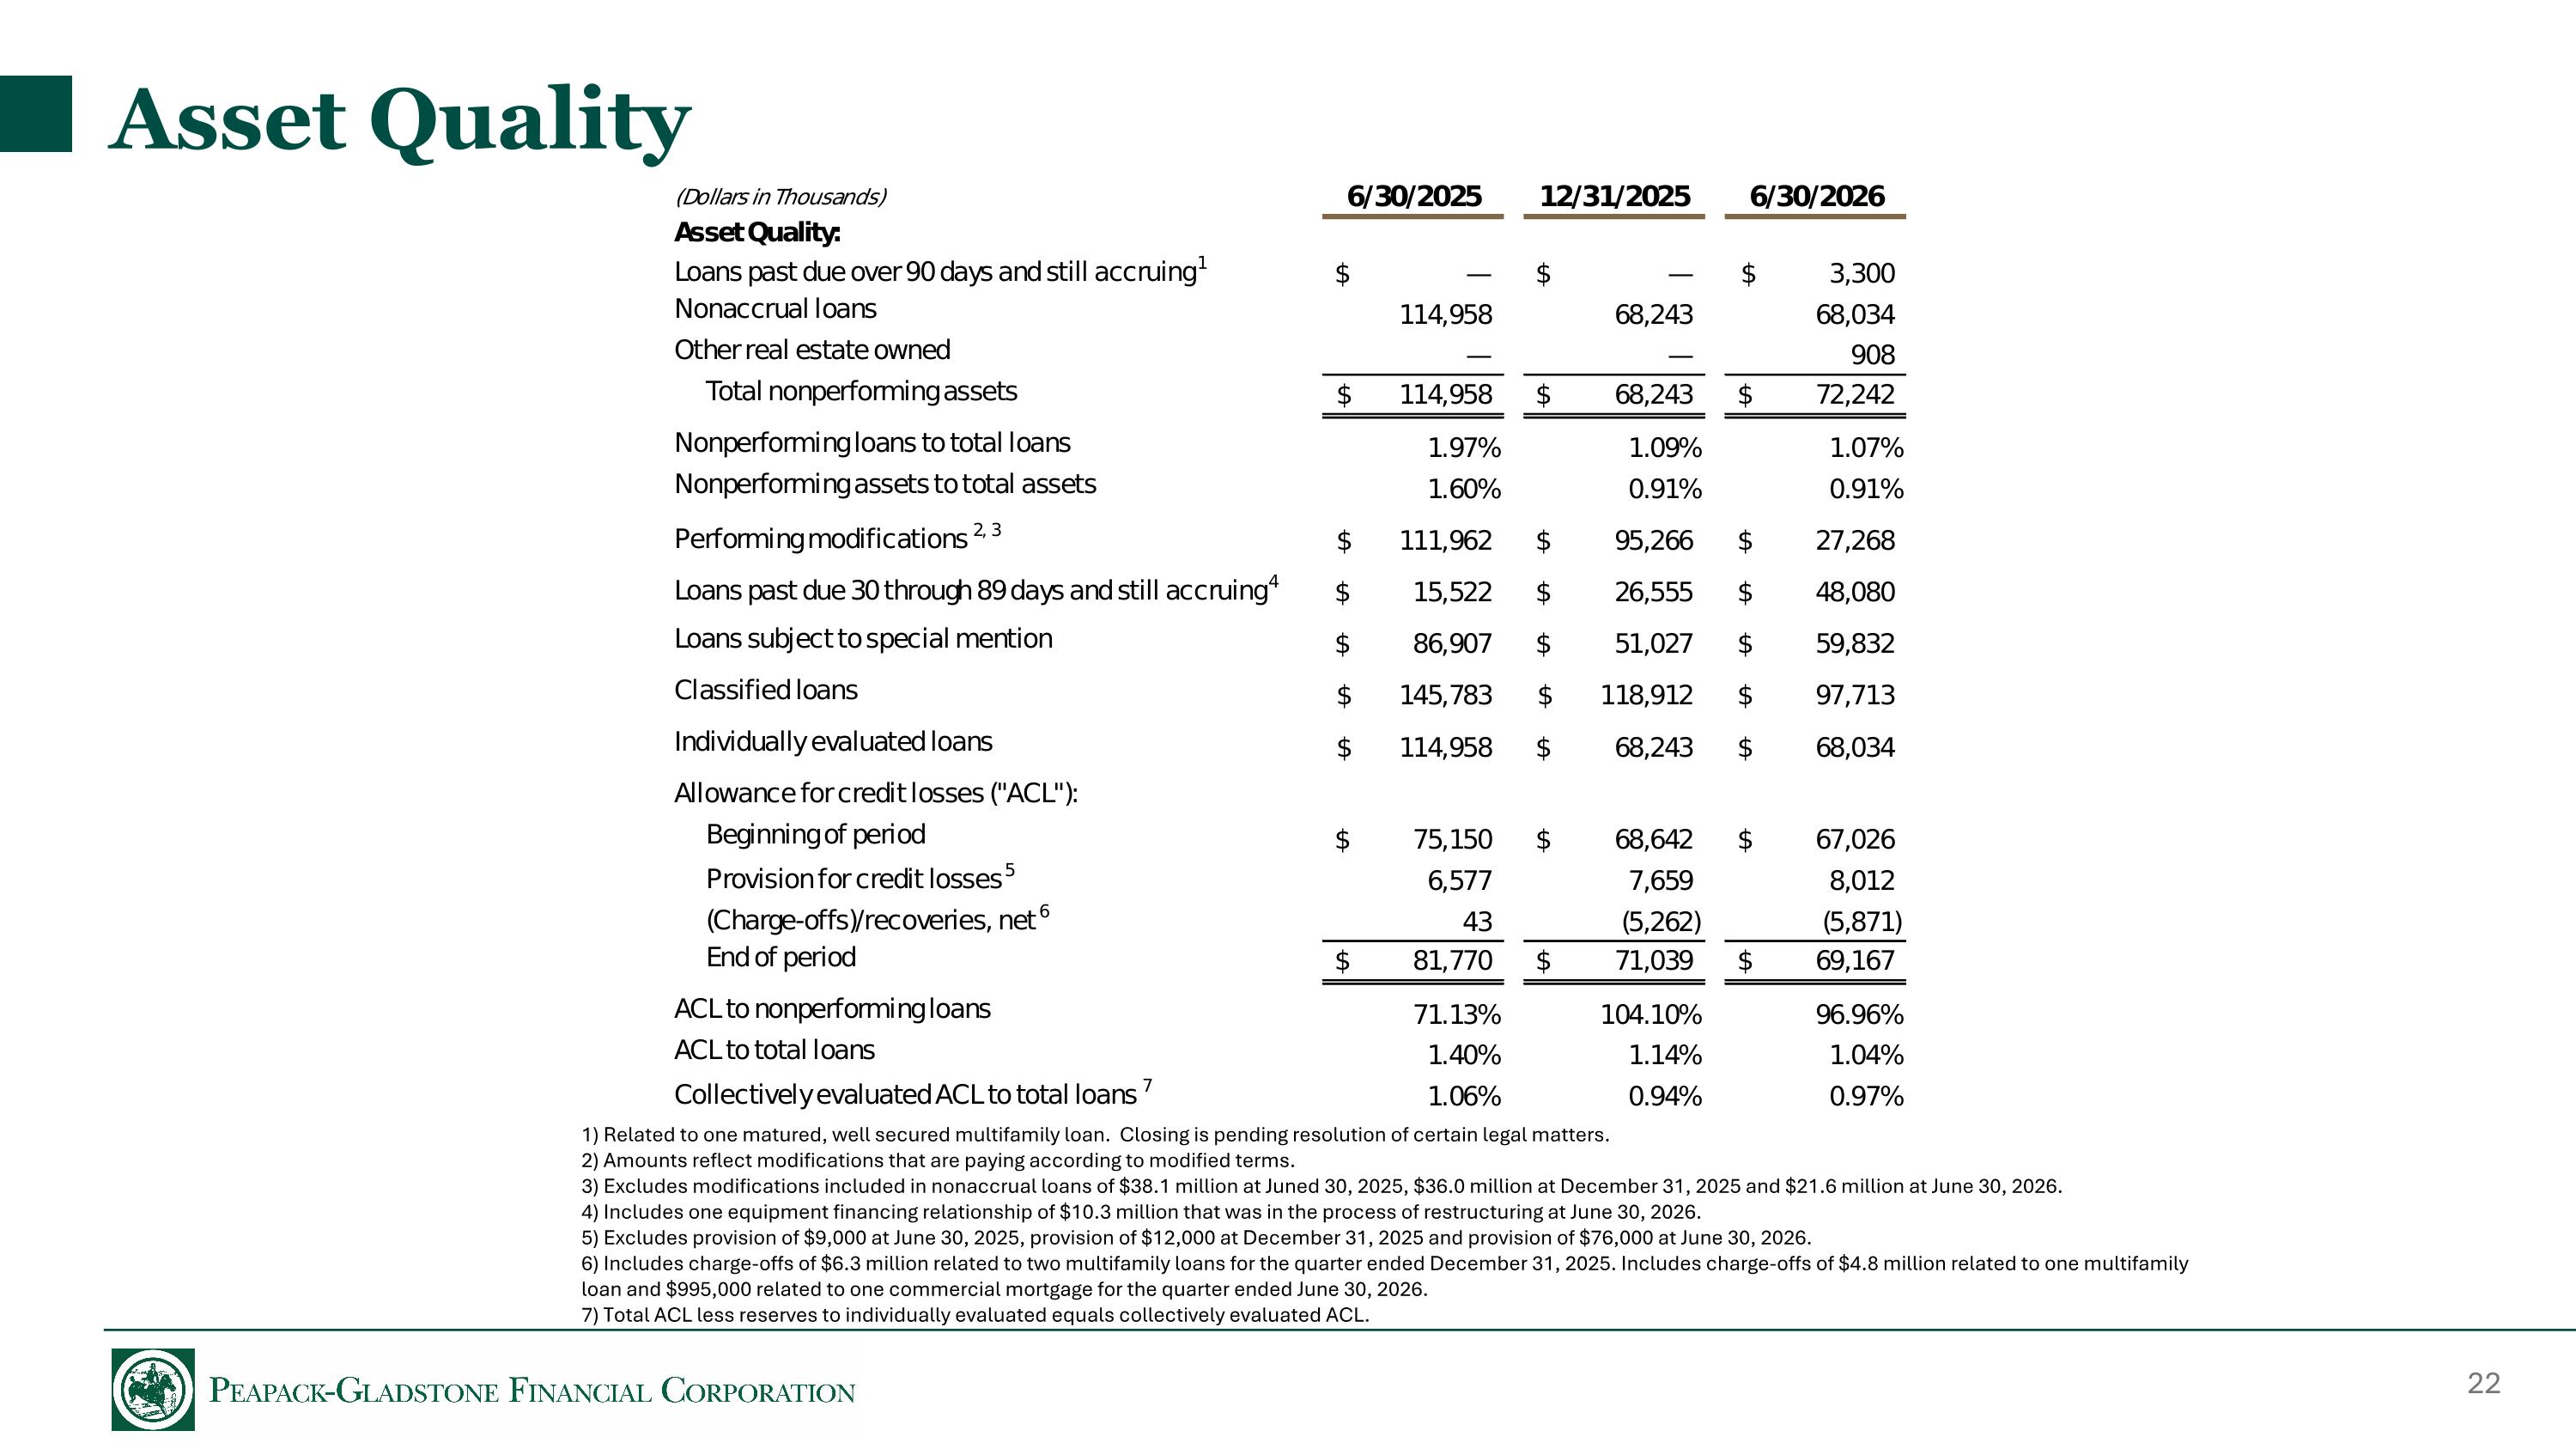
Asset Quality 1) Related to one matured, well secured multifamily loan. Closing is pending resolution of certain legal matters. 2) Amounts reflect modifications that are paying according to modified terms. 3) Excludes modifications included in nonaccrual loans of $38.1 million at Juned 30, 2025, $36.0 million at December 31, 2025 and $21.6 million at June 30, 2026. 4) Includes one equipment financing relationship of $10.3 million that was in the process of restructuring at June 30, 2026. 5) Excludes provision of $9,000 at June 30, 2025, provision of $12,000 at December 31, 2025 and provision of $76,000 at June 30, 2026. 6) Includes charge-offs of $6.3 million related to two multifamily loans for the quarter ended December 31, 2025. Includes charge-offs of $4.8 million related to one multifamily loan and $995,000 related to one commercial mortgage for the quarter ended June 30, 2026. 7) Total ACL less reserves to individually evaluated equals collectively evaluated ACL.
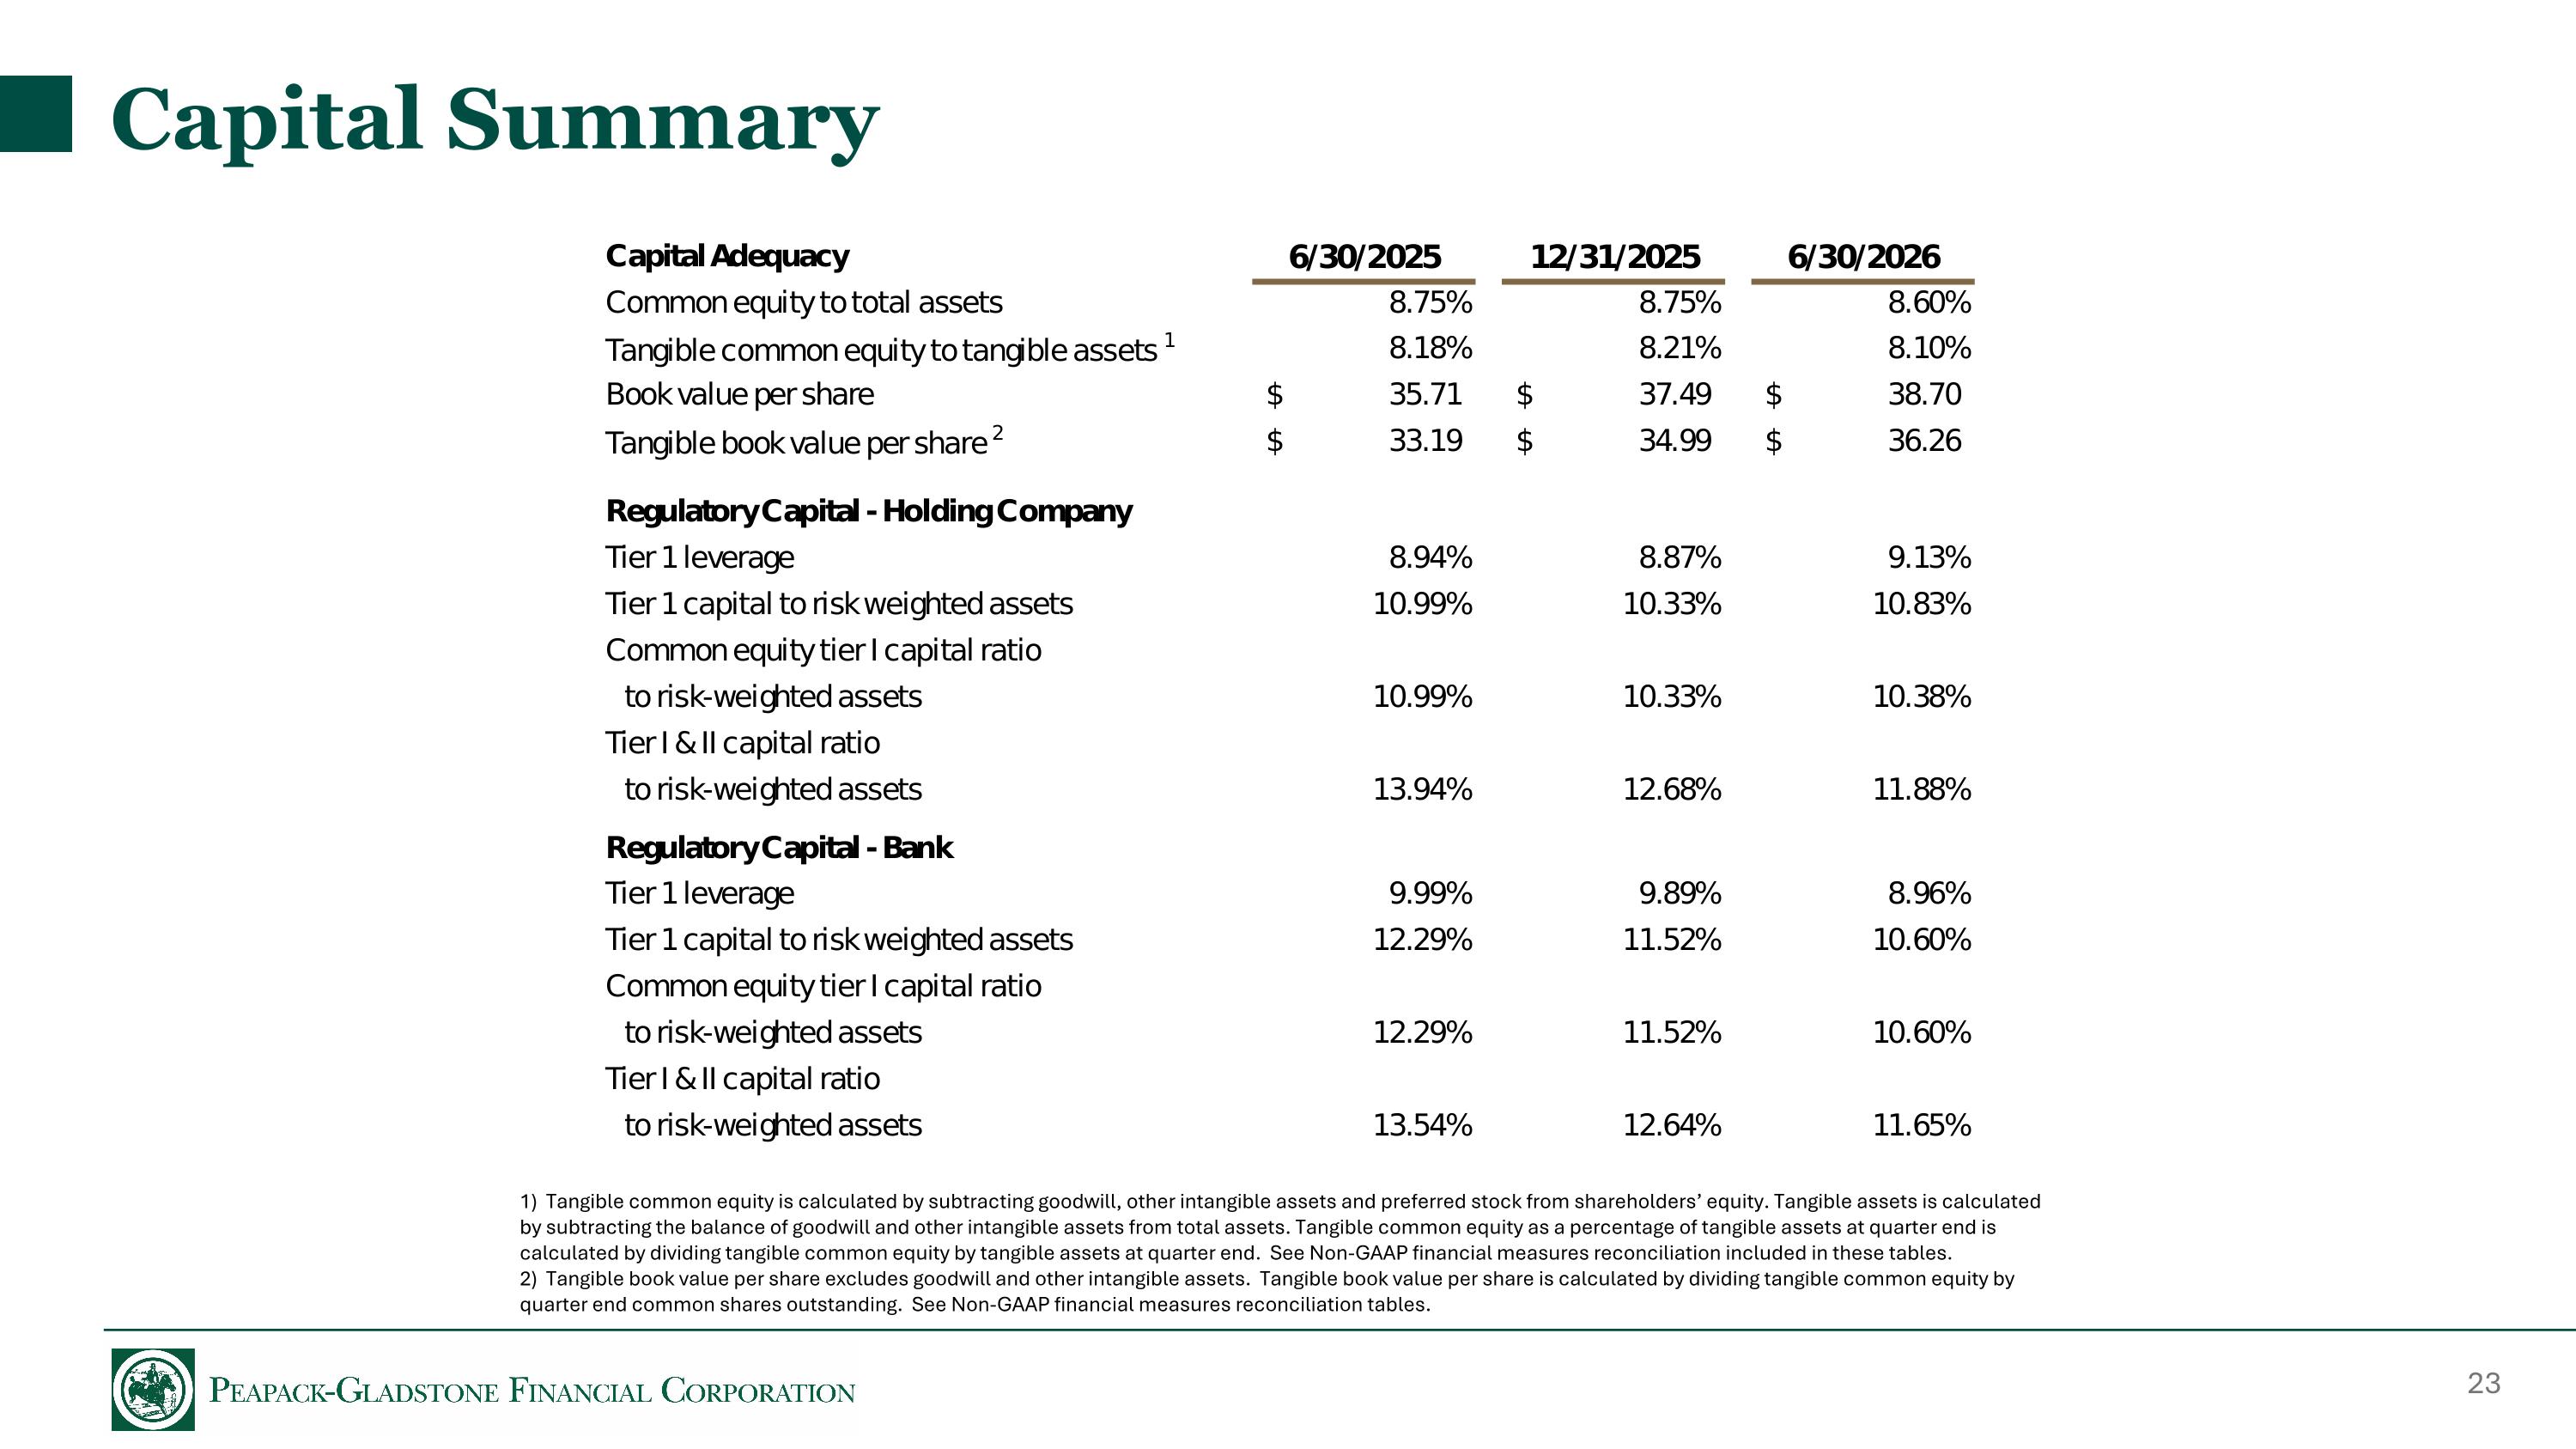
Capital Summary 1) Tangible common equity is calculated by subtracting goodwill, other intangible assets and preferred stock from shareholders’ equity. Tangible assets is calculated by subtracting the balance of goodwill and other intangible assets from total assets. Tangible common equity as a percentage of tangible assets at quarter end is calculated by dividing tangible common equity by tangible assets at quarter end. See Non-GAAP financial measures reconciliation included in these tables. 2) Tangible book value per share excludes goodwill and other intangible assets. Tangible book value per share is calculated by dividing tangible common equity by quarter end common shares outstanding. See Non-GAAP financial measures reconciliation tables.
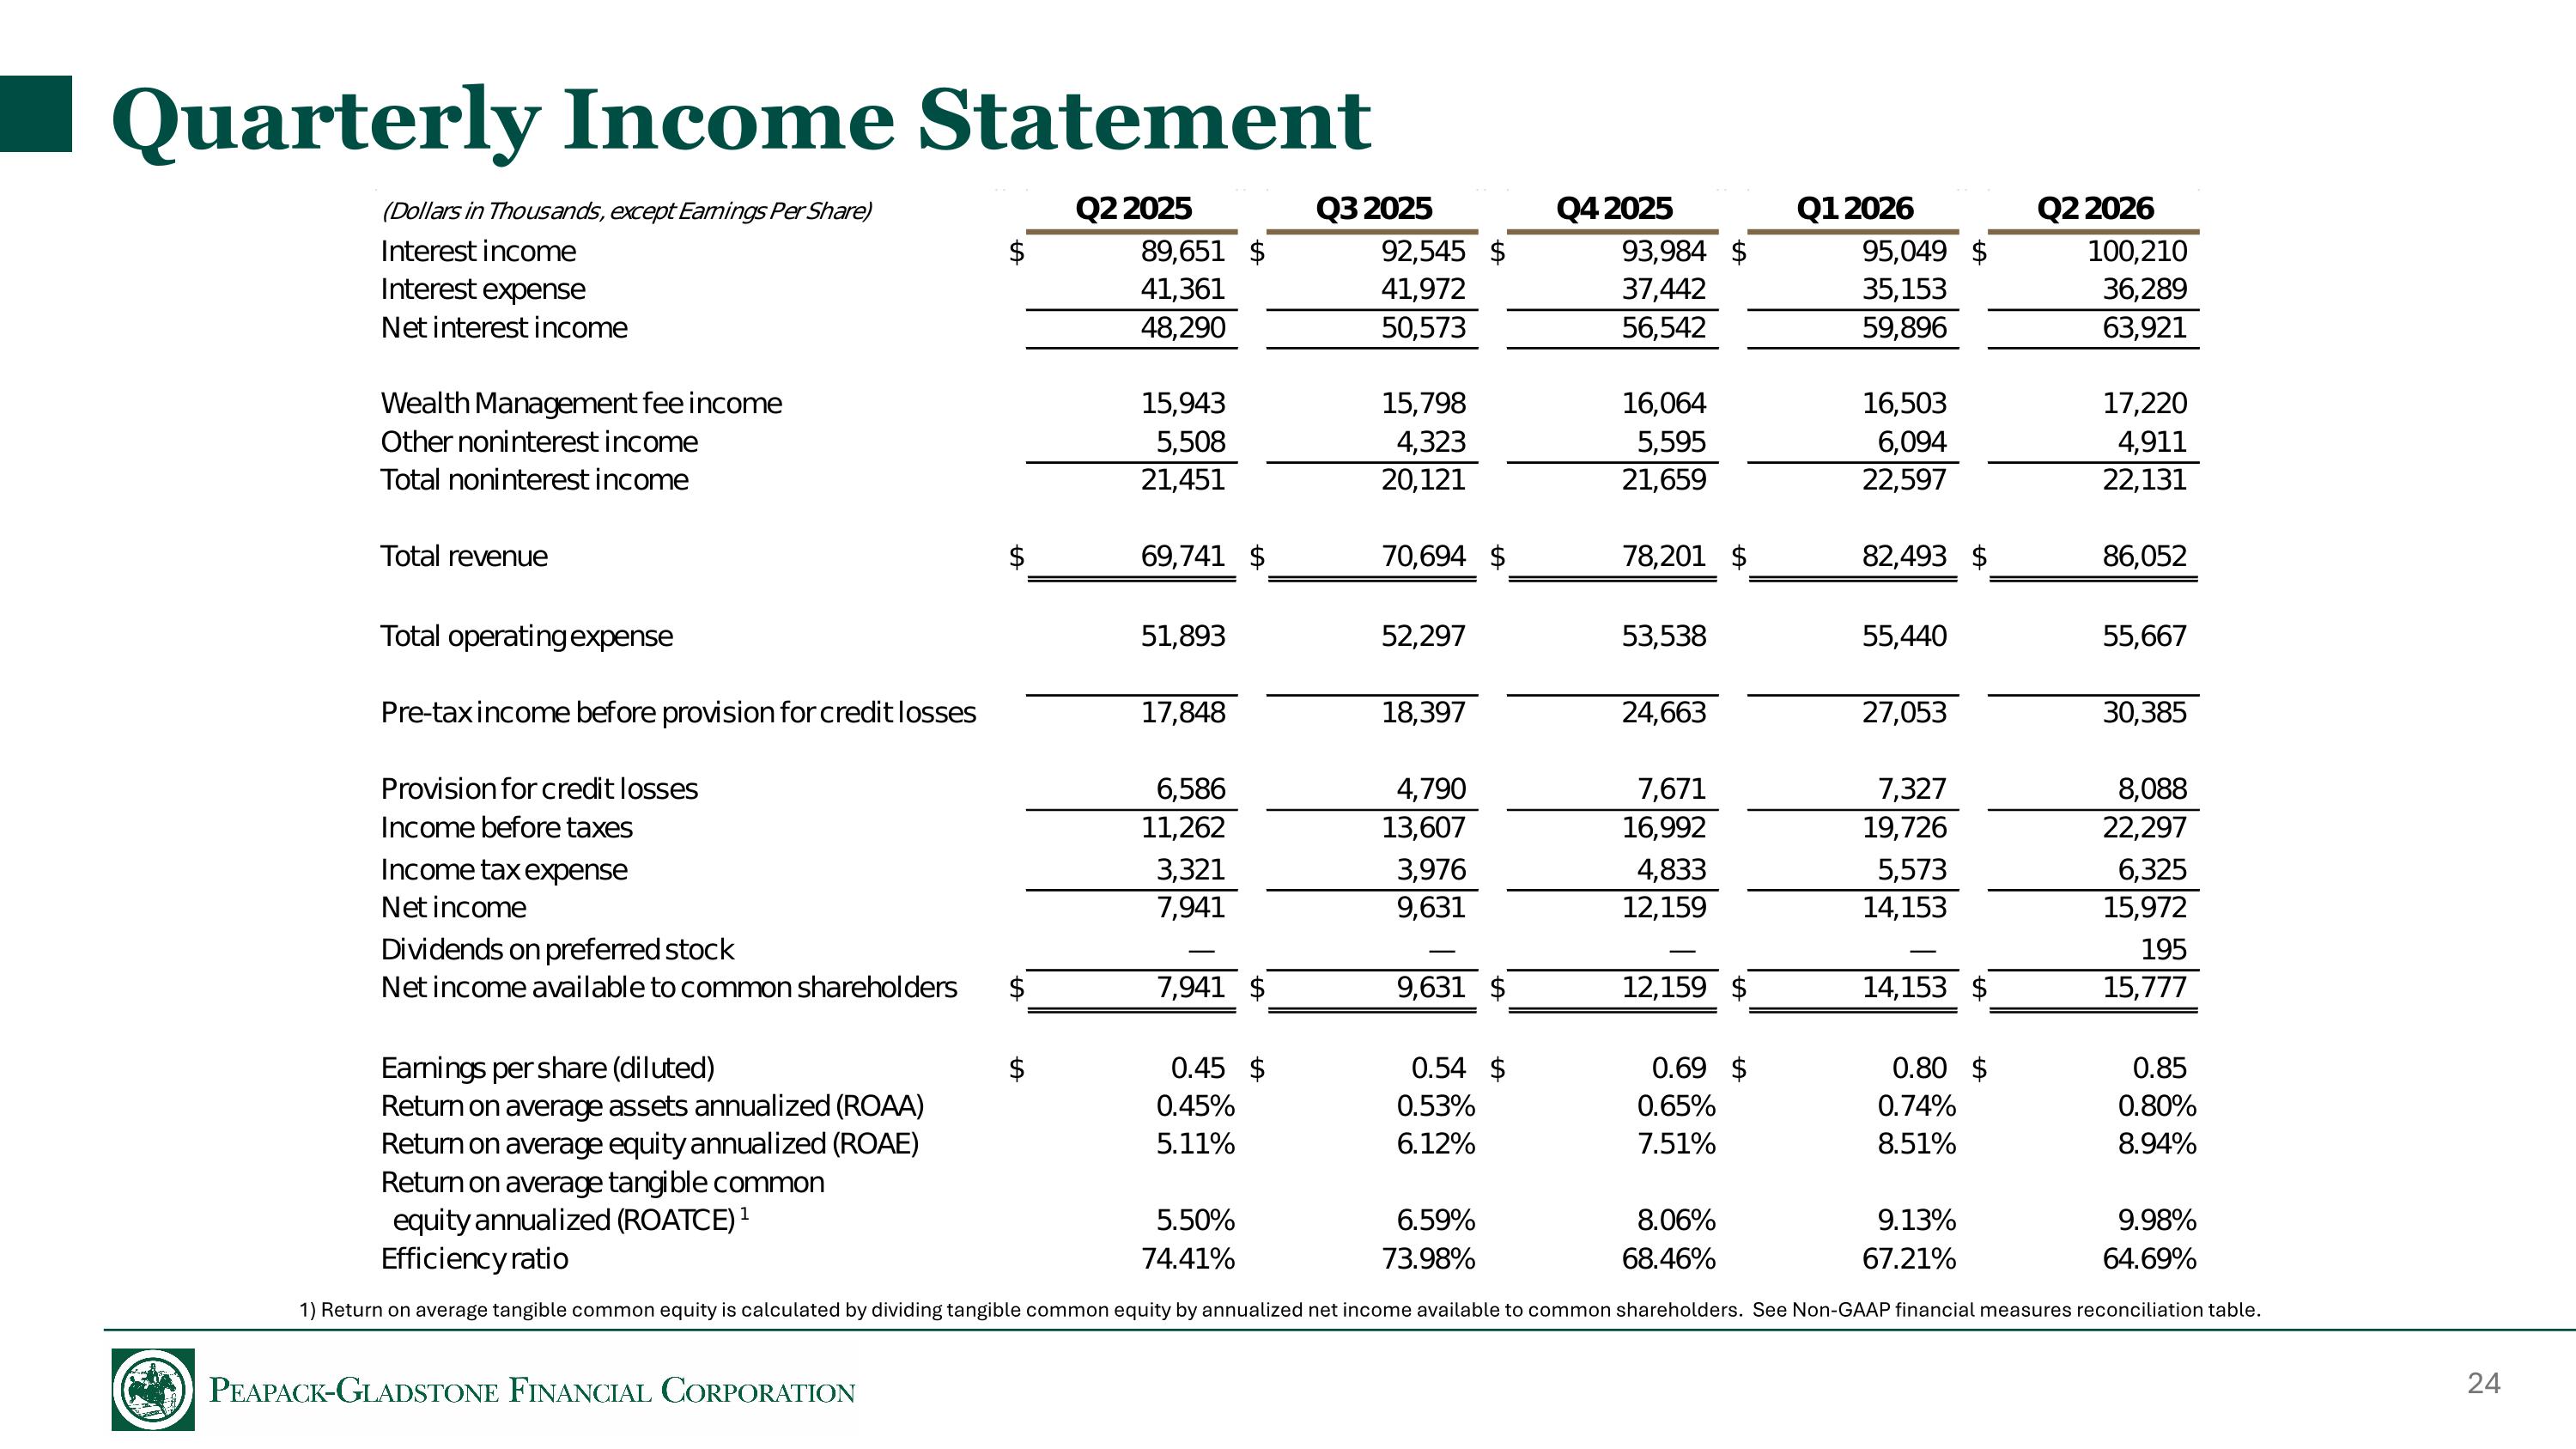
Quarterly Income Statement 1) Return on average tangible common equity is calculated by dividing tangible common equity by annualized net income available to common shareholders. See Non-GAAP financial measures reconciliation table.
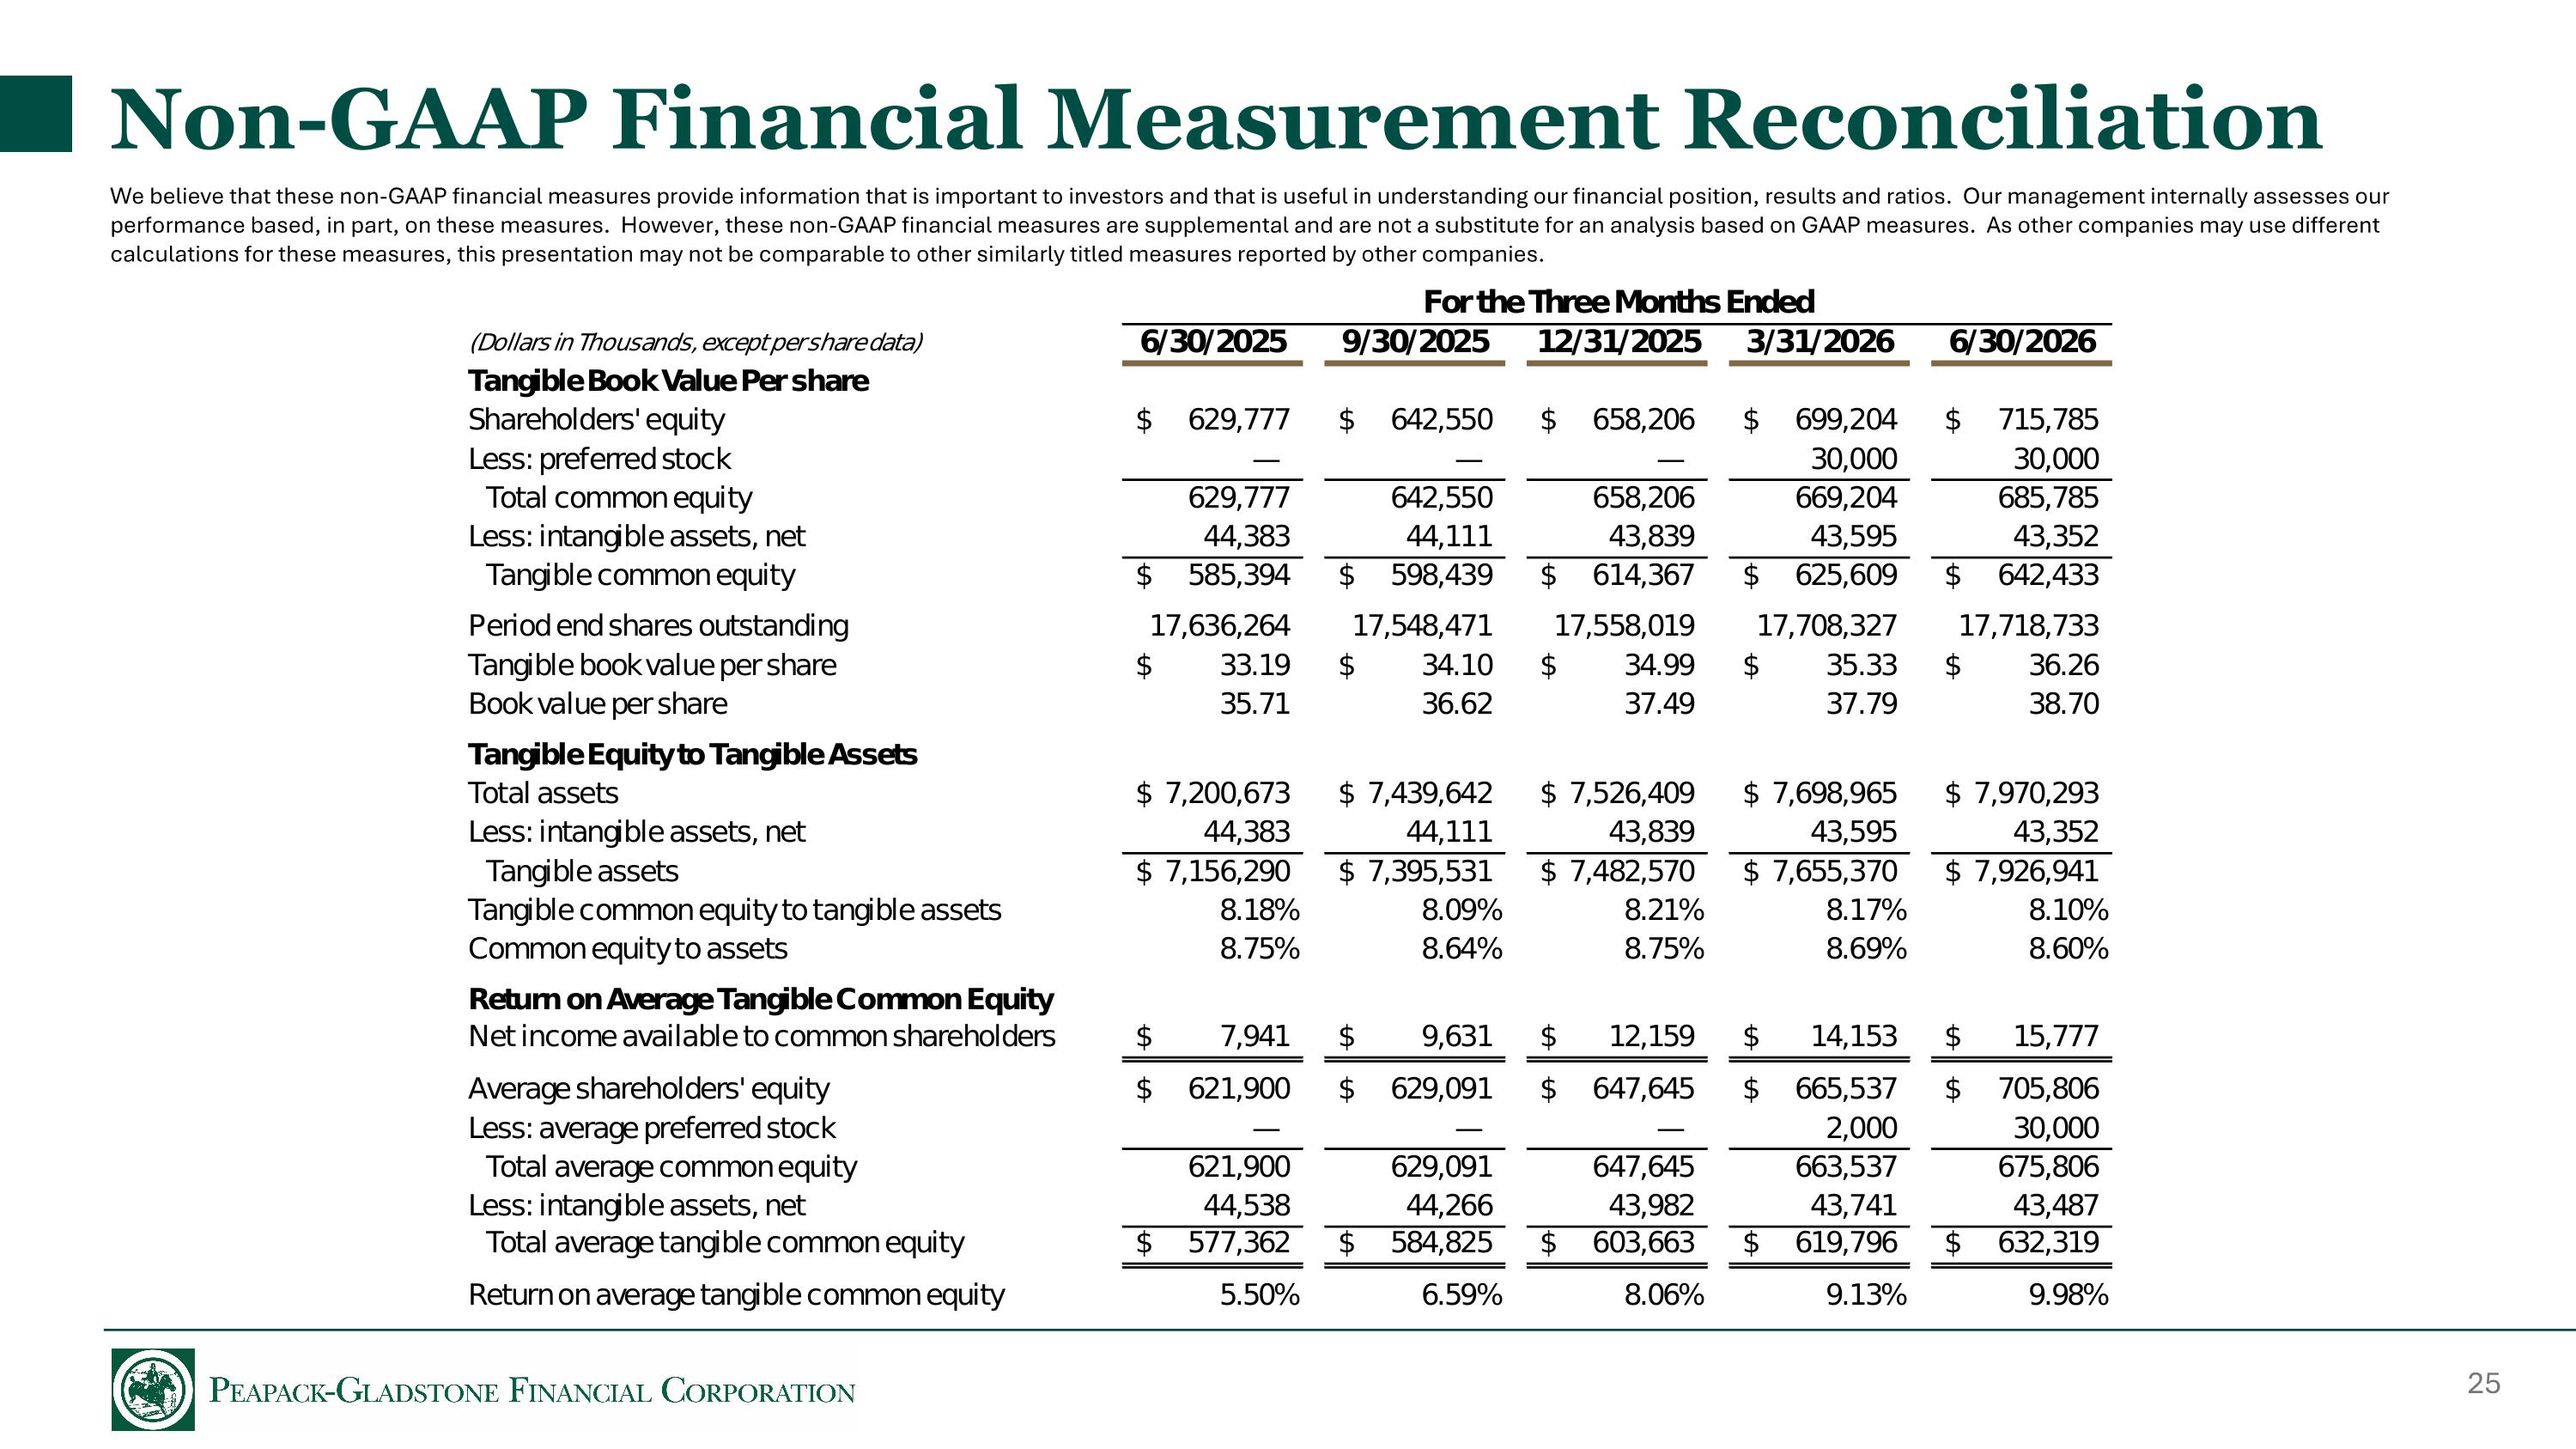
Non-GAAP Financial Measurement Reconciliation We believe that these non-GAAP financial measures provide information that is important to investors and that is useful in understanding our financial position, results and ratios. Our management internally assesses our performance based, in part, on these measures. However, these non-GAAP financial measures are supplemental and are not a substitute for an analysis based on GAAP measures. As other companies may use different calculations for these measures, this presentation may not be comparable to other similarly titled measures reported by other companies.
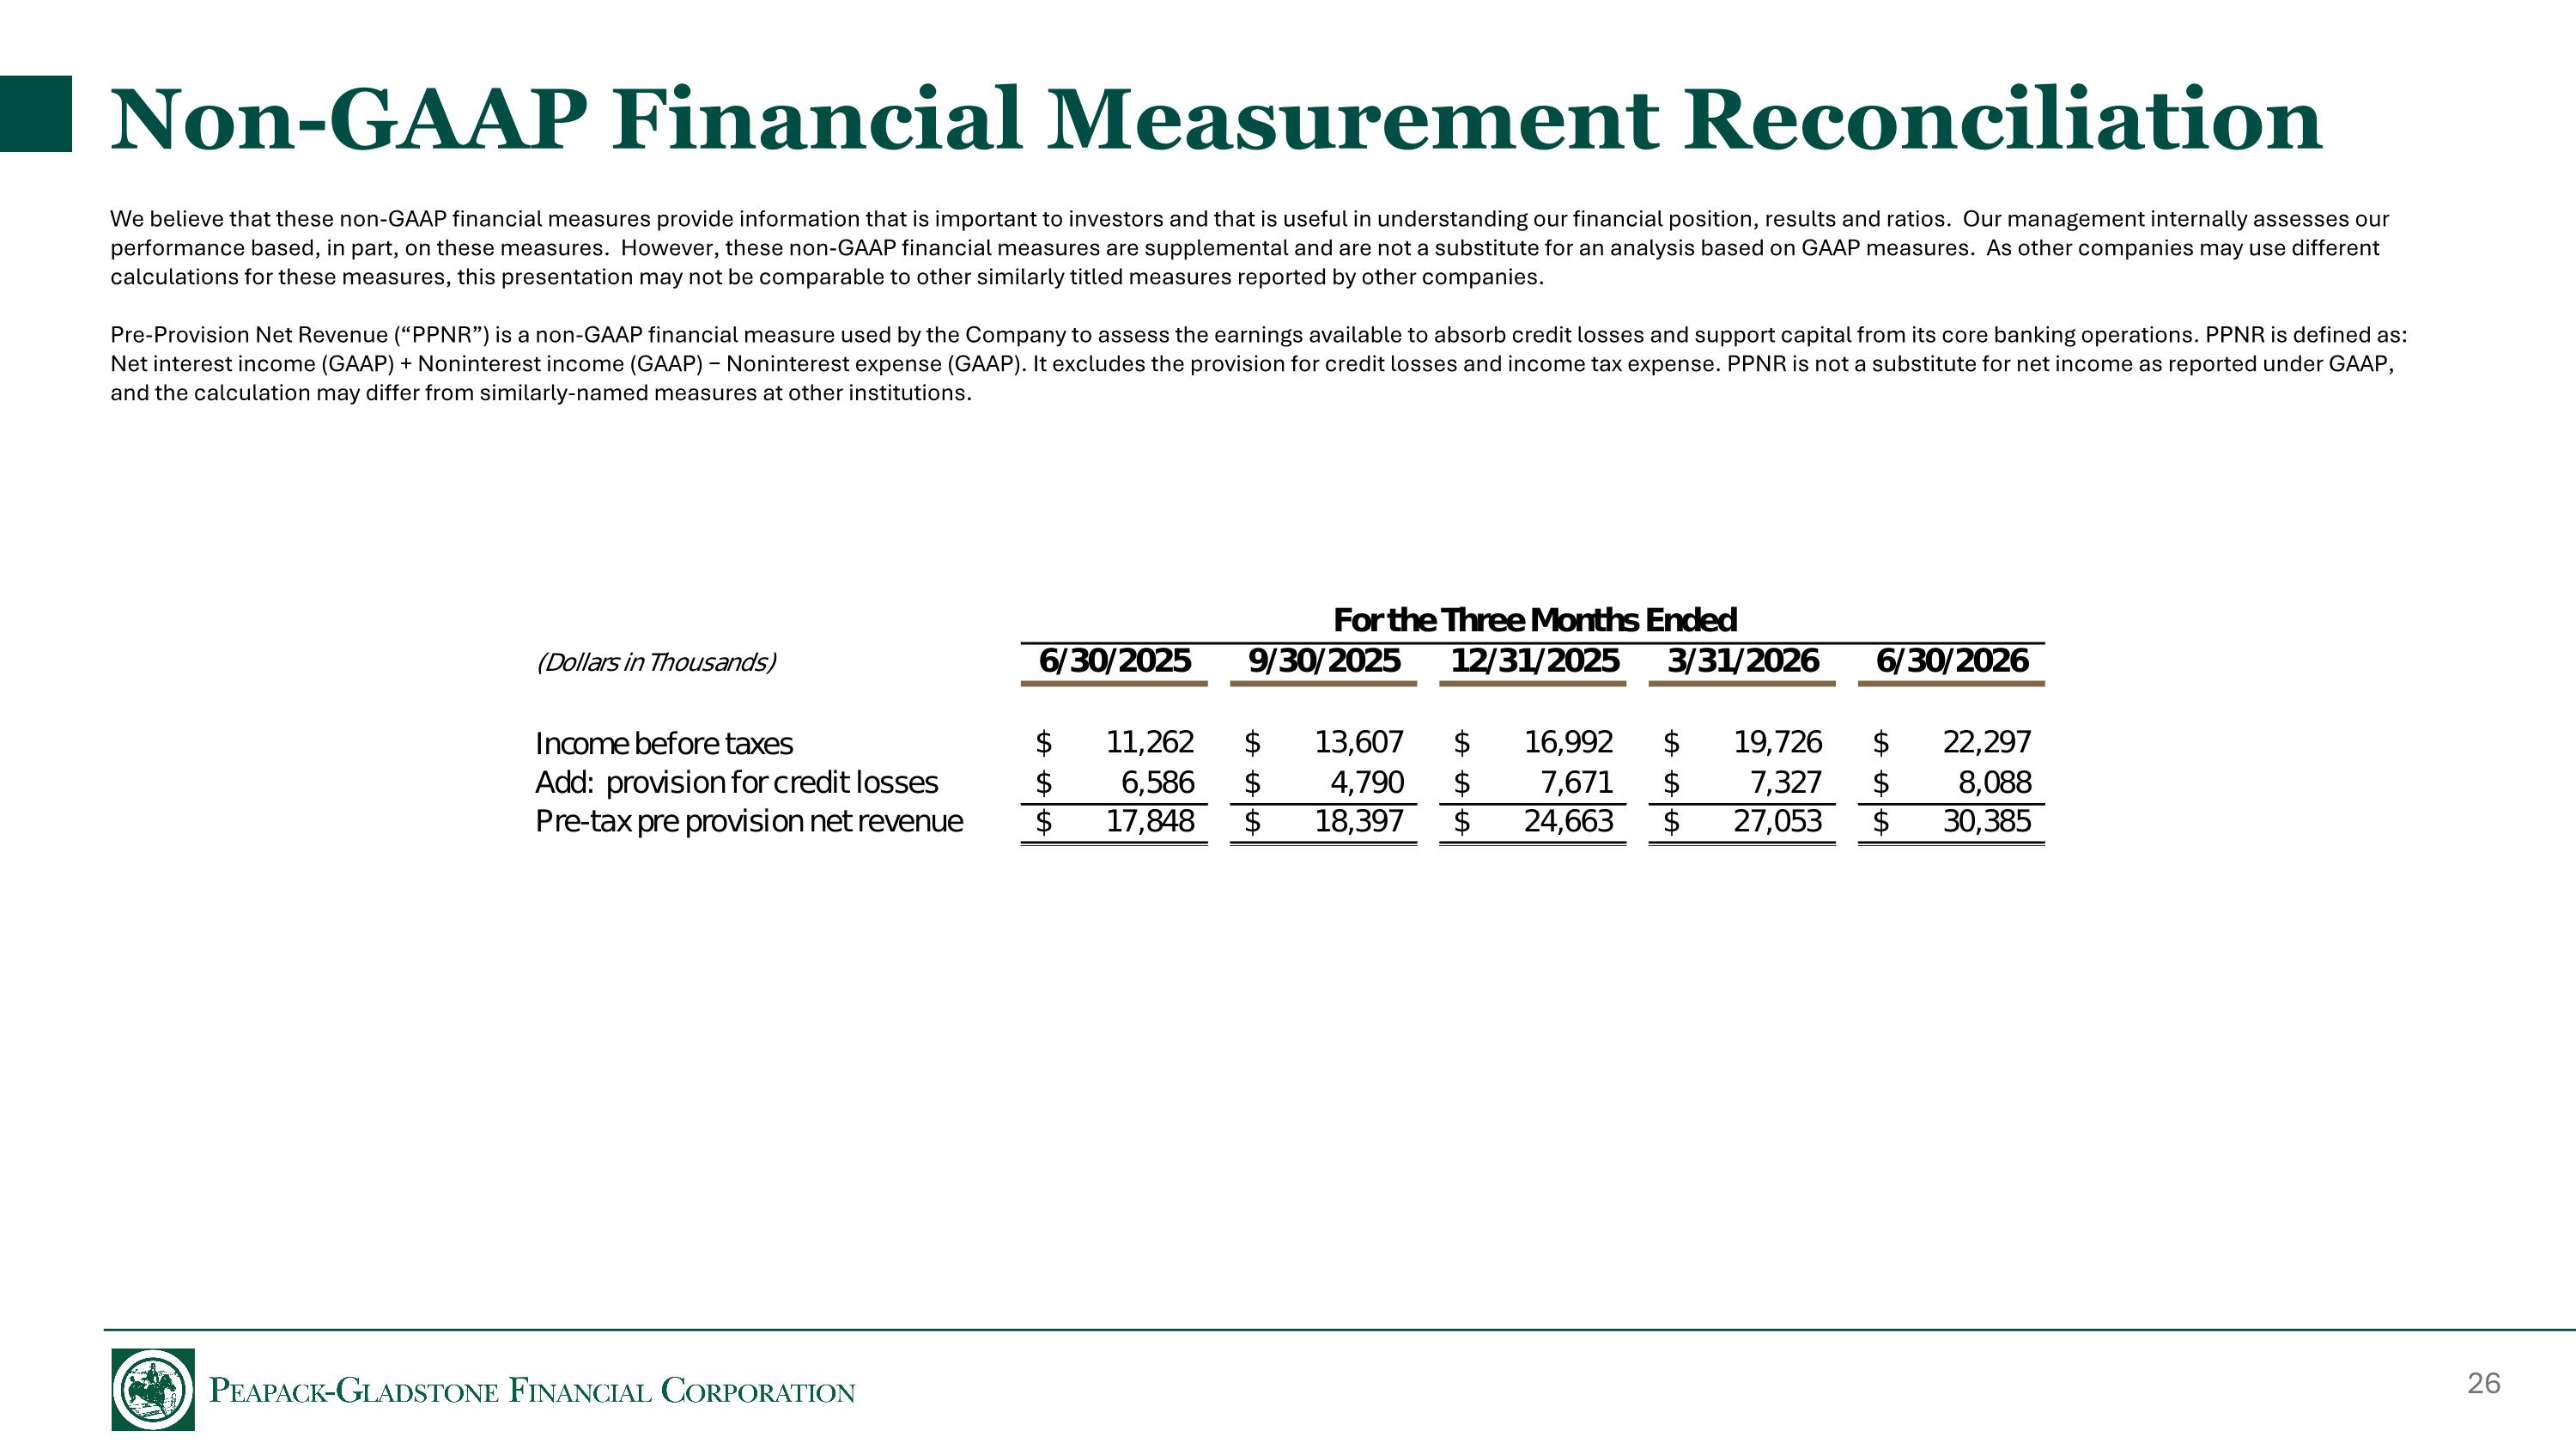
Non-GAAP Financial Measurement Reconciliation We believe that these non-GAAP financial measures provide information that is important to investors and that is useful in understanding our financial position, results and ratios. Our management internally assesses our performance based, in part, on these measures. However, these non-GAAP financial measures are supplemental and are not a substitute for an analysis based on GAAP measures. As other companies may use different calculations for these measures, this presentation may not be comparable to other similarly titled measures reported by other companies. Pre-Provision Net Revenue (“PPNR”) is a non-GAAP financial measure used by the Company to assess the earnings available to absorb credit losses and support capital from its core banking operations. PPNR is defined as: Net interest income (GAAP) + Noninterest income (GAAP) − Noninterest expense (GAAP). It excludes the provision for credit losses and income tax expense. PPNR is not a substitute for net income as reported under GAAP, and the calculation may differ from similarly-named measures at other institutions.

Douglas L. Kennedy President & Chief Executive Officer (908) 719-6554 dkennedy@peapackprivate.com Frank A. Cavallaro Senior EVP & Chief Financial Officer (908) 306-8933 fcavallaro@peapackprivate.com CONTACTS John P. Babcock Senior EVP & President of Peapack Private Wealth Management (908) 719-3301 jbabcock@peapackprivate.com Matthew P. Remo SVP | Managing Principal – Treasurer & Head of Corporate Finance (908) 872-9899 mremo@peapackprivate.com CORPORATE HEADQUARTERS 500 Hills Drive, Suite 300 P.O. Box 700 Bedminster, New Jersey 07921 (908) 234-0700 peapackprivate.com