The bar chart and performance table below show the variability of the Fund’s returns over time, which is some indication of the risks of investing in the Fund. The bar chart shows performance of the Fund’s shares for each full calendar year since the Fund’s inception. The performance table compares the performance of the Fund’s shares overtime to the performance of a broad-based market index and a supplemental index. You should be aware that the Fund’s past performance (before and after taxes) may not be an indication of how the Fund will perform in the future. Updated performance information is available at no cost by calling 1-877-694-3532 and may also be available at www.anydrusfunds.com.
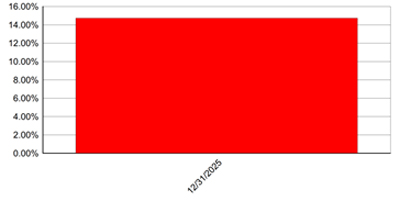
| Best Quarter: | 06/30/2025 | 5.48% |
| Worst Quarter: | 03/31/2025 | 1.19% |
The Fund’s year-to-date return as of the most recent fiscal quarter, which ended March 31, 2026, was (0.54)%.
| One Year | Since Inception (05/13/2024) | |
| Return Before Taxes | 14.73% | 7.82% |
| Return After Taxes on Distributions | 14.27% | 7.26% |
| Return After Taxes on Distributions and Sale of Fund Shares | 8.84% | 5.82% |
| Bloomberg U.S. Aggregate Bond Index(1) | 7.30% | 6.47% |
| S&P Target Risk Moderate Index(2) | 9.78% | 7.60% |
| (1) | The Bloomberg U.S. Aggregate Bond Index is an unmanaged broad-based index comprised of U.S. investment grade, fixed rate bond market securities, including government, government agency, corporate and mortgage-backed securities. Index returns, unlike the Fund’s returns, do not reflect any fees or expenses. Investors cannot invest directly in an index. |
| (2) | The S&P Target Risk Moderate Index is designed to measure the performance of moderate stock-bond allocations to fixed income while seeking to increase opportunities for higher returns through equities. Index returns, unlike the Fund’s returns, do not reflect any fees or expenses. Investors cannot invest directly in an index. |
After-tax returns are calculated using the historical highest individual federal marginal income tax rates and do not reflect the impact of state and local taxes. Actual after-tax returns depend on an investor’s tax situation and may differ from those shown, and after-tax returns shown are not relevant to investors who hold their shares through tax-deferred arrangements, such as 401(k) plans or individual retirement accounts.