The bar chart and performance table below show the variability of the Fund’s returns, which is some indication of the risks of investing in the Fund. The bar chart shows performance of the Fund’s Investor Class shares for each full calendar year for the past 10 years, which includes performance of the Predecessor Fund (as defined below). Although Institutional Class, Class A and Class C shares have similar annual returns to Investor Class shares because the classes are invested in the same portfolio of securities, the returns for Institutional Class, Class A and Class C shares are different than Investor Class shares because Institutional Class, Class A and Class C shares have different expenses than Investor Class shares. The performance table compares the performance of the Fund over time to the performance of a broad-based market index and a supplemental index. You should be aware that the Fund’s past performance (before and after taxes) may not be an indication of how the Fund will perform in the future. After-tax returns are calculated using the historical highest individual federal marginal income tax rates in effect and do not reflect the impact of state and local taxes. Actual after-tax returns depend on your tax situation and may differ from those shown, and after-tax returns shown are not relevant to investors who hold their shares through tax-deferred arrangements such as 401(k) plans or individual retirement accounts (“IRAs”). The Fund acquired all of the assets and liabilities of USA Mutuals Vitium Global Fund, a series of USA Mutuals, (the “Predecessor Fund”) in a tax-free reorganization on January 22, 2021. In connection with this acquisition, shares of the Predecessor Fund’s Investor Class, Institutional Class, Class A and Class C Shares were exchanged for Investor Class, Institutional Class, Class A and Class C Shares of the Fund, respectively. The Predecessor Fund had an investment objective and strategies that were, in all material respects, the same as those of the Fund, and was managed in a manner that, in all material respects, complied with the investment guidelines and restrictions of the Fund. The performance information set forth below reflects the historical performance of the Predecessor Fund shares. Updated performance information is available at no cost by calling 1-866-264-8783 and on the Fund’s website at www.usamutuals.com.
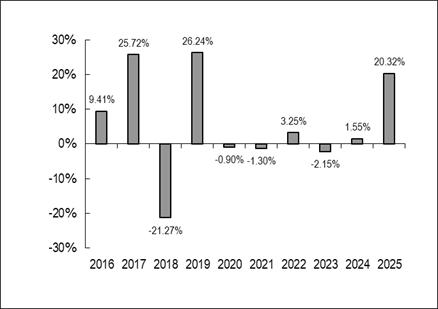
| Best Quarter: | 2nd Quarter 2020 | 16.79% |
| Worst Quarter: | 1st Quarter 2020 | (26.45)% |
The Fund’s Investor Class year-to-date return as of the most recent fiscal quarter, which ended June 30, 2026 was 4.63%.
| One Year |
Five Years |
Ten Years | |
| Investor Class | |||
| Return Before Taxes | 20.32% | 4.03% | 5.14% |
| Return After Taxes on Distributions | 16.66% | 1.71% | 3.17% |
| Return After Taxes on Distributions and Sale of Fund Shares | 14.15% | 2.84% | 3.75% |
| Institutional Class | |||
| Return Before Taxes | 20.63% | 4.29% | 5.42% |
| Class A | |||
| Return Before Taxes | 20.34% | 4.03% | 5.12% |
| Class C | |||
| Return Before Taxes | 19.40% | 3.25% | 4.36% |
|
S&P 500 Index(1)(2) (reflects no deductions for fees, expenses or taxes) |
17.88% | 14.42% | 14.63% |
| MSCI All Country World Index(3) (reflects no deductions for fees, expenses or taxes) |
22.87% | 11.70% | 12.28% |
| (1) | The S&P 500 Index is an unmanaged market capitalization-weighted index which is comprised of 500 of the largest U.S. domiciled companies and includes the reinvestment of all dividends. Investors cannot invest directly in an index. Unlike the Fund’s returns, the index does not reflect any fees or expenses. |
| (2) | The Fund’s benchmark has changed to the S&P 500 Index. The Adviser believes the S&P 500 Index provides a more appropriate broad-based benchmark for evaluating the Fund's performance because it is a widely recognized and commonly followed measure of U.S. equity market performance, which the Adviser believes is the benchmark most frequently referenced by the Fund's investors. In addition, the Fund's investment opportunity set and portfolio exposures have historically been predominantly invested in U.S. equities, making the S&P 500 Index a more relevant comparator for shareholders. The benchmark change is intended to provide investors with a performance comparison that the Adviser believes is more meaningful and consistent with how the Fund's performance is evaluated. The benchmark change does not reflect any change in the Fund's investment objective, principal investment strategies, or portfolio management process. |
| (3) | The MSCI All Country World Index is an index representing the equity returns in 23 developed and 24 emerging markets. Investors cannot invest directly in an index. Unlike the Fund’s returns, the index does not reflect any fees or expenses. |
The bar chart and performance table below show the variability of the Fund’s returns, which is some indication of the risks of investing in the Fund. The bar chart shows performance of the Fund’s Institutional Class shares for each full calendar year since the inception of the Predecessor Fund (as defined below). The performance table compares the performance of the Fund’s Institutional Class shares over time to the performance of a broad-based market index. You should be aware that the Fund’s past performance (before and after taxes) may not be an indication of how the Fund will perform in the future. After-tax returns are calculated using the historical highest individual federal marginal income tax rates in effect and do not reflect the impact of state and local taxes. Actual after-tax returns depend on your tax situation and may differ from those shown, and after-tax returns shown are not relevant to investors who hold their shares through tax-deferred arrangements such as 401(k) plans or individual retirement accounts (“IRAs”). The Fund acquired all of the assets and liabilities of USA Mutuals Navigator Fund, a series of USA Mutuals, (the “Predecessor Fund”) in a tax-free reorganization on January 22, 2021. In connection with this acquisition, shares of the Predecessor Fund’s Institutional Class Shares were exchanged for Institutional Class Shares of the Fund. The Predecessor Fund had an investment objective and strategies that were, in all material respects, the same as those of the Fund, and was managed in a manner that, in all material respects, complied with the investment guidelines and restrictions of the Fund.
The performance information set forth below reflects the historical performance of the Predecessor Fund shares. Updated performance information is available at no cost by calling 1-866-264-8783 and on the Fund’s website at www.usamutuals.com.
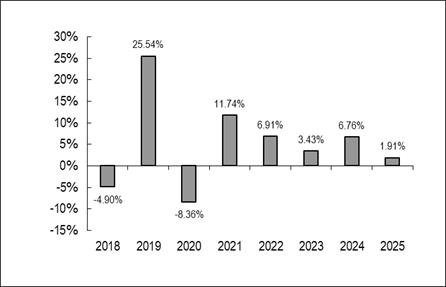
| Best Quarter: | 4th Quarter 2021 | 15.02% |
| Worst Quarter: | 1st Quarter 2020 | (18.52)% |
The Fund’s Institutional Class year-to-date return as of the most recent fiscal quarter, which ended June 30, 2026 was (3.77)%.
| One Year |
Five Years |
Since Inception(1) | |
| Institutional Class | |||
| Return Before Taxes | 1.91% | 6.09% | 5.41% |
| Return After Taxes on Distributions | 0.89% | 5.50% | 4.78% |
| Return After Taxes on Distributions and Sale of Fund Shares | 1.13% | 4.50% | 4.04% |
| S&P 500 Index(2) (reflects no deductions for fees, expenses or taxes) |
17.88% | 14.42% | 14.82% |
|
S&P 500 Target Risk Conservative Index(3) (reflects no deductions for fees, expenses or taxes |
11.74% | 3.60% | 4.77% |
| (1) | The Predecessor Fund commenced operations on October 13, 2017. |
| (2) | The S&P 500 Index is an unmanaged market capitalization-weighted index which is comprised of 500 of the largest U.S. domiciled companies and includes the reinvestment of all dividends. Investors cannot invest directly in an index. Unlike the Fund’s returns, the index does not reflect any fees or expenses. |
| (3) | The S&P 500 Target Risk Conservative Index is multi-asset benchmark designed to measure the performance of conservative stock-bond allocations to fixed income, seeking to produce a current income stream and avoid excessive volatility of returns. Investors cannot invest directly in an index. Unlike the Fund’s returns, the index does not reflect any fees or expenses. |