The following bar chart provides an indication of the risks of investing in the Guinness Atkinson Global Innovators Fund by showing how the performance of the Fund’s Institutional Class shares has varied from year to year. Because calendar-year performance information for the Fund’s ETF Class Shares is not yet available, the information presented in the bar chart and table reflects the performance of the Institutional Class shares of the Guinness Atkinson Global Innovators Fund. (Institutional Class shares are mutual fund shares that are offered through a separate prospectus.) Performance information for ETF Class Shares would be similar, since both share classes are invested in the same portfolio of securities; their returns generally should differ only to the extent that the expenses of the classes differ. Returns of the Fund’s ETF Class Shares may vary from the returns of the Fund’s Institutional Class mutual fund shares due to difference in expenses. Expenses that the Fund incurs as a whole are allocated among share classes pursuant to the Fund’s multiple class plan, which allocates fund expenses across share classes in a method designed to treat each share class separately. More information about expense allocation is available in the Fund’s Statement of Additional Information.
The table below also demonstrates the risks of investing in the Fund by showing how the Fund’s average annual returns compare with the broad-based securities market index. Unlike the Fund’s returns, the index returns do not reflect any deductions for fees, expenses or taxes. For additional information on these indices, please see Index Descriptions in the prospectus. Past performance, before or after taxes, is not indicative of future performance. Updated performance information is available on the Fund’s website: www.gafunds.com.
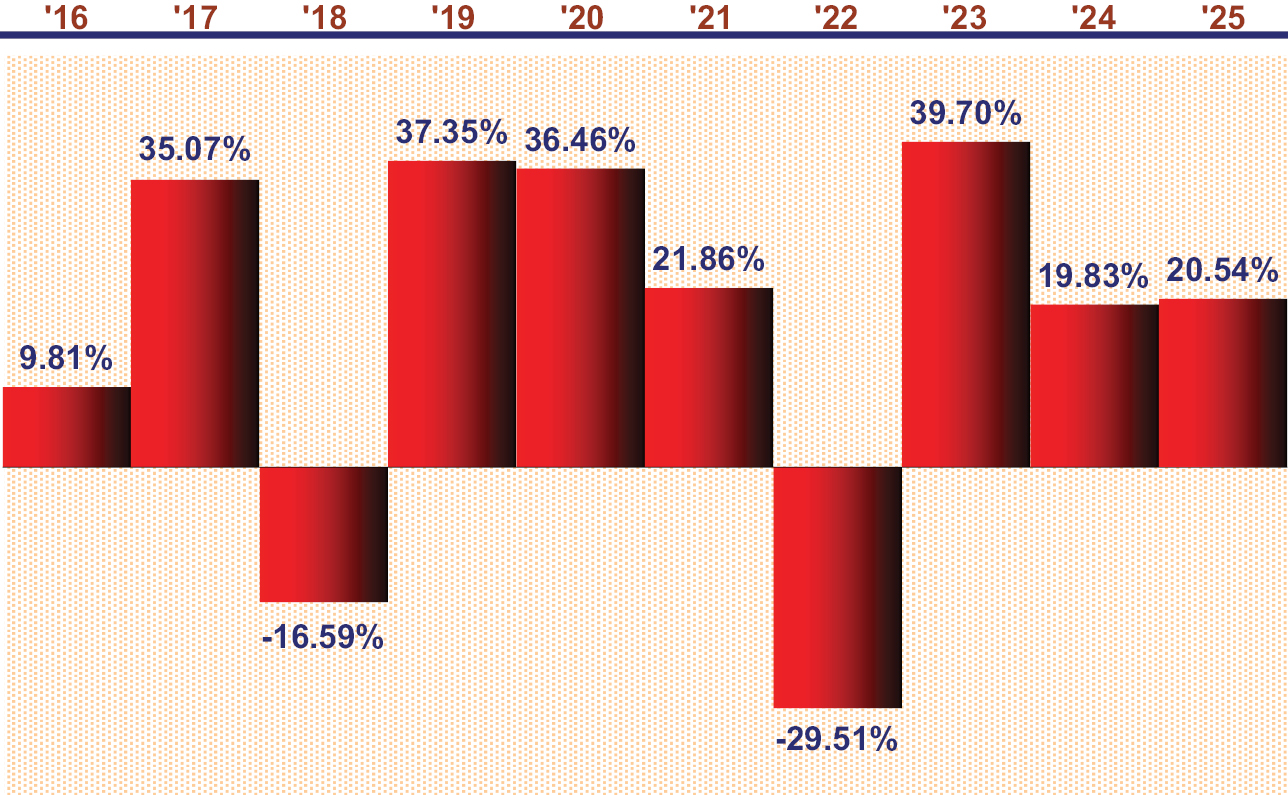
The year-to-date return for the Fund as of June 30, 2026, was 7.33%.
During the period shown in the bar chart, the best performance for a quarter was 27.48% (for the quarter ended June 30, 2020). The worst performance was (19.66)% (for the quarter ended June 30, 2022).
| Average Annual Total Returns as of 12/31/25 | One Year | Five Years | Ten Years |
| Global Innovators Fund: | |||
| Institutional Class Return Before Taxes* | 20.54% | 11.63% | 14.92% |
| Institutional Class Return After Taxes on Distributions(1) | 16.49% | 8.73% | 12.93% |
| Institutional Class Return After Taxes on Distributions and Sale of Fund Shares(1) | 15.01% | 8.72% | 12.08% |
| Investor Class Return Before Taxes | 20.24% | 11.35% | 14.64% |
| MSCI World Index (Net Return) (Reflects No Deductions for Fees and Expenses) | 21.09% | 12.14% | 12.16% |
* The Fund’s Institutional Class shares were issued on December 31, 2015. Performance information shown for the Institutional Class prior to December 31, 2015, is based on the performance of the Fund’s Investor Class shares. Institutional and Investor class shares are mutual fund shares and are not exchange-traded. As of December 31, 2025, the Fund’s ETF Class Shares had not yet incepted. Performance shown prior to the inception date of the ETF Class shares is from the Portfolio’s Institutional Class shares, a mutual fund class of shares of the Portfolio not offered in this Prospectus. Returns for the ETF Class shares and Institutional Class shares may vary due to differences in their expenses.
(1) After-tax returns are calculated using the historically highest individual federal marginal income tax rates and do not reflect the impact of state and local taxes. Actual after-tax returns depend on an investor’s tax situation and may differ from those shown, and after-tax returns shown are not relevant to investors who hold their Fund shares through tax-deferred arrangements, such as 401(k) plans or individual retirement accounts. In certain cases, the figure representing “Return After Taxes on Distributions and Sale of Fund Shares” may be higher than the other return figures for the same period. A higher after-tax return results when a capital loss occurs upon redemption and provides an assumed tax deduction that benefits the investor. After-tax returns are shown for Institutional Class Shares only and after-tax returns for classes other than Institutional Class will vary from returns shown in the table.