v3.26.1
Pay vs Performance Disclosure - USD ($)
12 Months Ended
Mar. 31, 2026
Mar. 31, 2025
Mar. 31, 2024
Mar. 31, 2023
Mar. 31, 2022
Pay vs Performance Disclosure          
Pay vs Performance Disclosure, Table

Pay Versus Performance

This section provides disclosure about the relationship between executive compensation actually paid to our principal executive officer (PEO) and non-PEO NEOs and certain financial performance measures of the Company for the fiscal years listed below. As required by Section 953(a) of the Dodd-Frank Wall Street Reform and Consumer Protection Act, and Item 402(v) of Regulation S-K, we are providing the following information about the relationship between executive compensation actually paid and certain financial performance of the Company. For further information concerning the Company’s variable pay-for-performance philosophy and how the Company aligns executive compensation with the Company’s performance, please refer to the section titled “Compensation Discussion and Analysis.”


Average
Summary

Average

Value of Initial Fixed $100
Investment Based On:


Year

Summary
Compensation
Table Total for
PEO
1

Compensation
Actually Paid
to PEO
2

Compensation
Table Total for
Non-PEO
NEOs
3

Compensation
Actually Paid
to Non-PEO
NEOs
4

Total
Shareholder
Return
5

Peer Group
Total
Shareholder
Return
6

Net
Income
(millions)
7

Non-
GAAP
EPS
8


(a)

(b)

(c)

(d)

(e)

(f)

(g)

(h)

(i)


2026

$3,206,287

$5,212,972

$1,000,816

$1,658,876

$112.82

$122.25

$95.5

$2.48


2025

$2,437,479

$2,250,215

$1,315,358

$1,218,885

$74.57

$119.88

$(366.9)

$2.22


2024

$2,852,966

$520,595

$1,557,480

$339,596

$77.53

$109.50

$(147.7)

$2.20


2023

$4,509,598

$3,588,493

$2,342,272

$1,866,383

$101.72

$86.59

$59.6

$2.18


2022

$3,908,422

$4,553,782

$2,077,840

$2,418,447

$113.91

$103.01

$35.9

$1.84


1.
The dollar amounts reported in column (b) are the amounts of total compensation reported for Mr. Singhal (our President, Chief Executive Officer, and Chairman of the Board) for each corresponding year in the “Total” column of the Summary Compensation Table. Refer to “Summary Compensation Table for Fiscal Year 2026.”
2.
The dollar amounts reported in column (c) represent the amount of “compensation actually paid” to Mr. Singhal, as defined and computed in accordance with Item 402(v) of Regulation S-K. The dollar amounts do not reflect the actual amount of compensation earned by or paid to Mr. Singhal during the applicable fiscal year. In accordance with the requirements of Item 402(v) of Regulation S-K, the following adjustments were made to Mr. Singhal’s total compensation as reported in the Summary Compensation Table for each fiscal year to determine the compensation actually paid:


Year

Reported
Summary Compensation
Table Total for PEO

Reported
Value of Equity Awards
(a)

Equity
Award Adjustments
(b)

Compensation Actually
Paid to PEO


2026

$3,206,287

$(1,346,256)

$3,352,941

$5,212,972


2025

$2,437,479

$(1,193,760)

$1,006,496

$2,250,215


2024

$2,852,966

$(1,830,096)

$(502,275)

$520,595


2023

$4,509,598

$(2,901,420)

$1,980,315

$3,588,493


2022

$3,908,422

$(2,504,520)

$3,149,880

$4,553,782


(a)
Represents the grant date fair value of equity awards granted in each fiscal year presented, as reported in the “Stock Awards” column of the Summary Compensation Table.
(b)
The equity award adjustments for each applicable fiscal year include the addition (or subtraction, as applicable) of the following:
(i)
the year-end fair value (computed consistent with the methodology used for share-based payments under U.S. GAAP) of any equity awards granted in the applicable year that are outstanding and unvested as of the end of the year;
(ii)
the amount of change as of the end of the applicable fiscal year (from the end of the prior fiscal year) in fair value of any awards granted in prior years that are outstanding and unvested as of the end of the applicable fiscal year;
(iii)
for awards that are granted and vest in the same applicable fiscal year, the fair value as of the vesting date;
(iv)
for awards granted in prior fiscal years that vest in the applicable fiscal year, the amount equal to the change as of the vesting date (from the end of the prior fiscal year) in fair value;
(v)
for awards granted in prior fiscal years that are determined to fail to meet the applicable vesting conditions during the applicable fiscal year, a deduction for the amount equal to the fair value at the end of the prior fiscal year; and
(vi)
the dollar value of any dividends or other earnings paid on stock or option awards in the applicable fiscal year prior to the vesting date that are not otherwise reflected in the fair value of such award or included in any other component of total compensation for the applicable fiscal year.

The valuation assumptions used to calculate fair values did not materially differ from those disclosed at the time of grant. The amounts deducted or added in calculating the equity award adjustments are as follows:


Year

(i)
Year End Fair
Value of
Outstanding
and Unvested
Equity Awards

(ii)
 Year over Year
Change in Fair
Value of
Outstanding
and Unvested
Equity Awards

(iii)
 Fair
Value as of
Vesting
Date of
Equity
Awards
Granted
and
Vested in
the Year

(iv)
Change in
Fair Value
from End
of the Prior
Year to the
Vesting
Date of
Equity
Awards
Granted in
Prior Years
that Vested
in the Year

(v)
 Fair Value at
the End of
the Prior
Year of
Equity
Awards that
Failed to
Meet Vesting
Conditions
in the Year

(vi)
Value of
Dividends or
other Earnings
Paid on Stock or
Option Awards
not Otherwise
Reflected in Fair 
Value or Total 
Compensation

Total
Equity
Award
Adjustments


2026

$2,130,192

$1,123,074

$

$157,275

$(57,600)

$

$3,352,941


2025

$1,370,448

$(192,411)

$

$(171,541)

$

$

$1,006,496


2024

$1,144,800

$(1,574,505)

$

$(72,570)

$

$

$(502,275)


2023

$2,160,900

$(351,225)

$

$170,640

$

$

$1,980,315


2022

$2,747,880

$352,800

$

$49,200

$

$

$3,149,880


3.
The dollar amounts reported in column (d) represent the average of the amounts reported for the NEOs as a group (excluding Mr. Singhal) in the “Total” column of the Summary Compensation Table in each applicable fiscal year. The names of each of the NEOs (excluding Mr. Singhal) included for purposes of calculating the average amounts in each applicable year are Michael Szabados, Jean Bua, John W. Downing, Anthony Piazza, and Sanjay Munshi for fiscal year 2026 and Michael Szabados, Jean Bua, and John W. Downing for fiscal years 2025, 2024, 2023, and 2022.
4.
The dollar amounts reported in column (e) represent the average amount of “compensation actually paid” to the NEOs as a group (excluding Mr. Singhal), as defined and computed in accordance with Item 402(v) of Regulation S-K. The dollar amounts do not reflect the actual average amount of compensation earned by or paid to the NEOs as a group (excluding Mr. Singhal) during the applicable year. In accordance with the requirements of Item 402(v) of Regulation S-K, the following adjustments were made to average total compensation as reported in the Summary Compensation Table for the NEOs as a group (excluding Mr. Singhal) for each fiscal year to determine the compensation actually paid, using the same methodology described above in Note 2:


Year

Average 
Reported 
Summary 
Compensation 
Table Total for 
Non-PEO NEOs

Average 
Reported 
Value of Equity 
Awards

Average 
Equity 
Award 
Adjustments(a)

Average 
Compensation 
Actually Paid 
to Non-PEO 
NEOs


2026

$1,000,816

$(340,304)

$998,364

$1,658,876


2025

$1,315,358

$(630,040)

$533,567

$1,218,885


2024

$1,557,480

$(965,884)

$(252,000)

$339,596


2023

$2,342,272

$(1,504,005)

$1,028,116

$1,866,383


2022

$2,077,840

$(1,321,830)

$1,662,437

$2,418,447


(a)
The amounts deducted or added in calculating the total average equity award adjustments are as follows:


Year

(i)
Average
Year End
Fair Value
of Equity
Awards

(ii)
Year over
Year
Average
Change in
Fair Value
of
Outstanding
and
Unvested
Equity
Awards

(iii)
Average
Fair Value
as of
Vesting
Date of
Equity
Awards
Granted
and
Vested in
the Year

(iv)
Average
Change in
Fair Value
from End
of the
Prior Year
to the
Vesting
Date of
Equity
Awards
Granted
in Prior
Years that
Vested in
the Year

(v)
Average
Fair Value
at the End
of the Prior
Year of
Equity
Awards that
Failed to
Meet
Vesting
Conditions
in the Year

(vi)
Average Value
of Dividends
or other
Earnings Paid
on Stock or
Option
Awards not
Otherwise
Reflected in
Fair Value or
Total
Compensation

Total
Average
Equity
Award
Adjustments


2026

$538,465

$420,622

$

$56,557

$(17,280)

$

$998,364


2025

$723,292

$(99,190)

$

$(90,535)

$

$

$533,567


2024

$604,200

$(817,899)

$

$(38,301)

$

$

$(252,000)


2023

$1,123,425

$(185,369)

$

$90,060

$

$

$1,028,116


2022

$1,450,270

$186,200

$

$25,967

$

$

$1,662,437


5.
Cumulative total shareholder return, or TSR, is calculated by dividing the sum of the cumulative amount of dividends for the measurement period, assuming dividend reinvestment, and the difference between the Company’s share price at the end and the beginning of the measurement period by the Company’s share price at the beginning of the measurement period.
6.
Represents the weighted peer group TSR, weighted according to the respective companies’ stock market capitalization at the beginning of each period for which a return is indicated. The peer group used for this purpose is the following published industry index: Nasdaq U.S. Benchmark Computer Services TR Index.
7.
The dollar amounts reported represent the amount of net income reflected in the Company’s audited financial statements for the applicable fiscal year.
8.
Non-GAAP EPS refers to the Company’s diluted EPS as adjusted to eliminate the GAAP effects of: removing the expenses related to the amortization of acquired intangible assets; share-based compensation expense; acquisition-related depreciation expense; restructuring charges; legal (benefit) expense related to civil judgements; goodwill impairment charges; gain on divestiture of a business; loss on extinguishment of debt; and change in fair value of derivative instrument, net of related income tax effects. The Company has determined that non-GAAP EPS is the financial performance measure that, in the Company’s assessment, represents the most important performance measure used by the Company to link compensation actually paid to the NEOs, for the most recently completed fiscal year, to the Company’s performance.
       
Company Selected Measure Name Non-GAAP EPS        
Named Executive Officers, Footnote The names of each of the NEOs (excluding Mr. Singhal) included for purposes of calculating the average amounts in each applicable year are Michael Szabados, Jean Bua, John W. Downing, Anthony Piazza, and Sanjay Munshi for fiscal year 2026 and Michael Szabados, Jean Bua, and John W. Downing for fiscal years 2025, 2024, 2023, and 2022.        
Peer Group Issuers, Footnote
6.
Represents the weighted peer group TSR, weighted according to the respective companies’ stock market capitalization at the beginning of each period for which a return is indicated. The peer group used for this purpose is the following published industry index: Nasdaq U.S. Benchmark Computer Services TR Index.
       
PEO Total Compensation Amount $ 3,206,287 $ 2,437,479 $ 2,852,966 $ 4,509,598 $ 3,908,422
PEO Actually Paid Compensation Amount $ 5,212,972 2,250,215 520,595 3,588,493 4,553,782
Adjustment To PEO Compensation, Footnote
2.
The dollar amounts reported in column (c) represent the amount of “compensation actually paid” to Mr. Singhal, as defined and computed in accordance with Item 402(v) of Regulation S-K. The dollar amounts do not reflect the actual amount of compensation earned by or paid to Mr. Singhal during the applicable fiscal year. In accordance with the requirements of Item 402(v) of Regulation S-K, the following adjustments were made to Mr. Singhal’s total compensation as reported in the Summary Compensation Table for each fiscal year to determine the compensation actually paid:


Year

Reported
Summary Compensation
Table Total for PEO

Reported
Value of Equity Awards
(a)

Equity
Award Adjustments
(b)

Compensation Actually
Paid to PEO


2026

$3,206,287

$(1,346,256)

$3,352,941

$5,212,972


2025

$2,437,479

$(1,193,760)

$1,006,496

$2,250,215


2024

$2,852,966

$(1,830,096)

$(502,275)

$520,595


2023

$4,509,598

$(2,901,420)

$1,980,315

$3,588,493


2022

$3,908,422

$(2,504,520)

$3,149,880

$4,553,782


(a)
Represents the grant date fair value of equity awards granted in each fiscal year presented, as reported in the “Stock Awards” column of the Summary Compensation Table.
(b)
The equity award adjustments for each applicable fiscal year include the addition (or subtraction, as applicable) of the following:
(i)
the year-end fair value (computed consistent with the methodology used for share-based payments under U.S. GAAP) of any equity awards granted in the applicable year that are outstanding and unvested as of the end of the year;
(ii)
the amount of change as of the end of the applicable fiscal year (from the end of the prior fiscal year) in fair value of any awards granted in prior years that are outstanding and unvested as of the end of the applicable fiscal year;
(iii)
for awards that are granted and vest in the same applicable fiscal year, the fair value as of the vesting date;
(iv)
for awards granted in prior fiscal years that vest in the applicable fiscal year, the amount equal to the change as of the vesting date (from the end of the prior fiscal year) in fair value;
(v)
for awards granted in prior fiscal years that are determined to fail to meet the applicable vesting conditions during the applicable fiscal year, a deduction for the amount equal to the fair value at the end of the prior fiscal year; and
(vi)
the dollar value of any dividends or other earnings paid on stock or option awards in the applicable fiscal year prior to the vesting date that are not otherwise reflected in the fair value of such award or included in any other component of total compensation for the applicable fiscal year.

The valuation assumptions used to calculate fair values did not materially differ from those disclosed at the time of grant. The amounts deducted or added in calculating the equity award adjustments are as follows:


Year

(i)
Year End Fair
Value of
Outstanding
and Unvested
Equity Awards

(ii)
 Year over Year
Change in Fair
Value of
Outstanding
and Unvested
Equity Awards

(iii)
 Fair
Value as of
Vesting
Date of
Equity
Awards
Granted
and
Vested in
the Year

(iv)
Change in
Fair Value
from End
of the Prior
Year to the
Vesting
Date of
Equity
Awards
Granted in
Prior Years
that Vested
in the Year

(v)
 Fair Value at
the End of
the Prior
Year of
Equity
Awards that
Failed to
Meet Vesting
Conditions
in the Year

(vi)
Value of
Dividends or
other Earnings
Paid on Stock or
Option Awards
not Otherwise
Reflected in Fair 
Value or Total 
Compensation

Total
Equity
Award
Adjustments


2026

$2,130,192

$1,123,074

$

$157,275

$(57,600)

$

$3,352,941


2025

$1,370,448

$(192,411)

$

$(171,541)

$

$

$1,006,496


2024

$1,144,800

$(1,574,505)

$

$(72,570)

$

$

$(502,275)


2023

$2,160,900

$(351,225)

$

$170,640

$

$

$1,980,315


2022

$2,747,880

$352,800

$

$49,200

$

$

$3,149,880


Non-PEO NEO Average Total Compensation Amount $ 1,000,816 1,315,358 1,557,480 2,342,272 2,077,840
Non-PEO NEO Average Compensation Actually Paid Amount $ 1,658,876 1,218,885 339,596 1,866,383 2,418,447
Adjustment to Non-PEO NEO Compensation Footnote
4.
The dollar amounts reported in column (e) represent the average amount of “compensation actually paid” to the NEOs as a group (excluding Mr. Singhal), as defined and computed in accordance with Item 402(v) of Regulation S-K. The dollar amounts do not reflect the actual average amount of compensation earned by or paid to the NEOs as a group (excluding Mr. Singhal) during the applicable year. In accordance with the requirements of Item 402(v) of Regulation S-K, the following adjustments were made to average total compensation as reported in the Summary Compensation Table for the NEOs as a group (excluding Mr. Singhal) for each fiscal year to determine the compensation actually paid, using the same methodology described above in Note 2:


Year

Average 
Reported 
Summary 
Compensation 
Table Total for 
Non-PEO NEOs

Average 
Reported 
Value of Equity 
Awards

Average 
Equity 
Award 
Adjustments(a)

Average 
Compensation 
Actually Paid 
to Non-PEO 
NEOs


2026

$1,000,816

$(340,304)

$998,364

$1,658,876


2025

$1,315,358

$(630,040)

$533,567

$1,218,885


2024

$1,557,480

$(965,884)

$(252,000)

$339,596


2023

$2,342,272

$(1,504,005)

$1,028,116

$1,866,383


2022

$2,077,840

$(1,321,830)

$1,662,437

$2,418,447


(a)
The amounts deducted or added in calculating the total average equity award adjustments are as follows:


Year

(i)
Average
Year End
Fair Value
of Equity
Awards

(ii)
Year over
Year
Average
Change in
Fair Value
of
Outstanding
and
Unvested
Equity
Awards

(iii)
Average
Fair Value
as of
Vesting
Date of
Equity
Awards
Granted
and
Vested in
the Year

(iv)
Average
Change in
Fair Value
from End
of the
Prior Year
to the
Vesting
Date of
Equity
Awards
Granted
in Prior
Years that
Vested in
the Year

(v)
Average
Fair Value
at the End
of the Prior
Year of
Equity
Awards that
Failed to
Meet
Vesting
Conditions
in the Year

(vi)
Average Value
of Dividends
or other
Earnings Paid
on Stock or
Option
Awards not
Otherwise
Reflected in
Fair Value or
Total
Compensation

Total
Average
Equity
Award
Adjustments


2026

$538,465

$420,622

$

$56,557

$(17,280)

$

$998,364


2025

$723,292

$(99,190)

$

$(90,535)

$

$

$533,567


2024

$604,200

$(817,899)

$

$(38,301)

$

$

$(252,000)


2023

$1,123,425

$(185,369)

$

$90,060

$

$

$1,028,116


2022

$1,450,270

$186,200

$

$25,967

$

$

$1,662,437


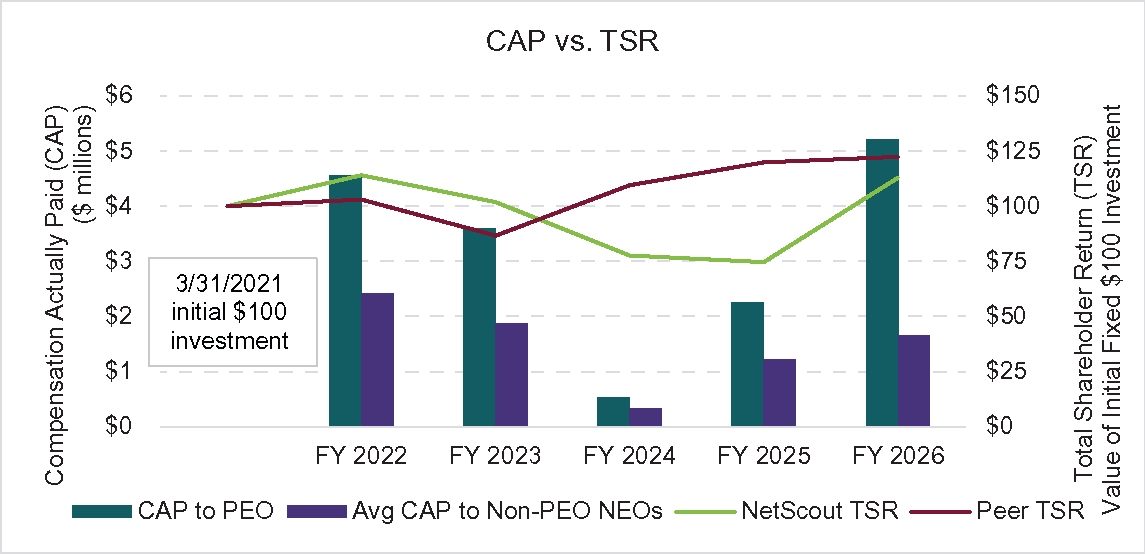
Compensation Actually Paid vs. Total Shareholder Return

img214405204_177.jpg

       
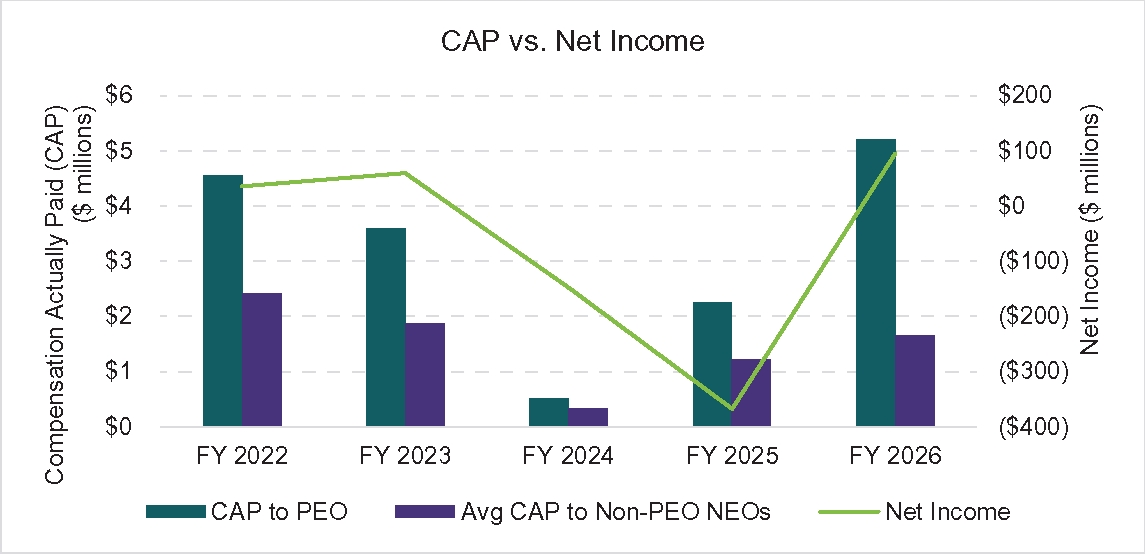
Compensation Actually Paid vs. Net Income

img214405204_178.jpg

       
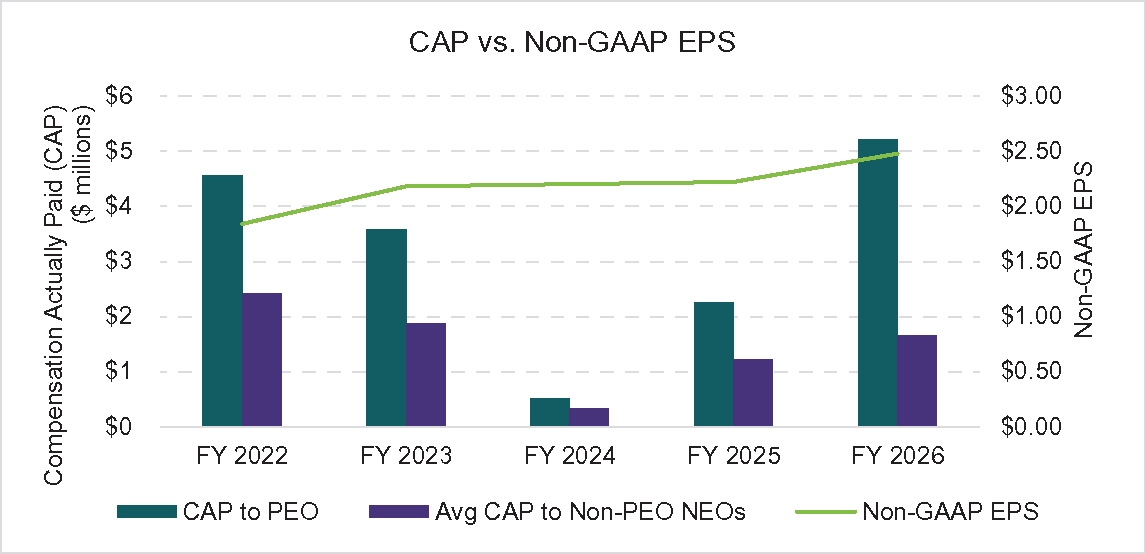
Compensation Actually Paid vs. Company Selected Measure

img214405204_179.jpg

       
Total Shareholder Return Vs Peer Group

img214405204_177.jpg

       
Tabular List, Table

Tabular List of Financial Performance Measures

As described in greater detail in the “Compensation Discussion and Analysis,” the Company’s executive compensation program reflects a variable pay-for-performance philosophy. The performance measures that the Company uses for both our long-term and short-term incentive awards are selected based on an objective of incentivizing our NEOs to increase the value of our enterprise for our stockholders. The most important financial performance measures used by the Company to link executive compensation actually paid to the NEOs, for the most recently completed fiscal year, to the Company’s performance are as follows:

Non-GAAP EPS
Total Revenue
Year-Over-Year Cybersecurity Revenue Growth
Relative TSR Compared to the Russell 2000 Index
       
Total Shareholder Return Amount $ 112.82 74.57 77.53 101.72 113.91
Peer Group Total Shareholder Return Amount 122.25 119.88 109.5 86.59 103.01
Net Income (Loss) $ 95,500,000 $ (366,900,000) $ (147,700,000) $ 59,600,000 $ 35,900,000
Company Selected Measure Amount 2.48 2.22 2.2 2.18 1.84
PEO Name Mr. Singhal Mr. Singhal Mr. Singhal Mr. Singhal Mr. Singhal
Measure:: 1          
Pay vs Performance Disclosure          
Name Non-GAAP EPS        
Non-GAAP Measure Description
8.
Non-GAAP EPS refers to the Company’s diluted EPS as adjusted to eliminate the GAAP effects of: removing the expenses related to the amortization of acquired intangible assets; share-based compensation expense; acquisition-related depreciation expense; restructuring charges; legal (benefit) expense related to civil judgements; goodwill impairment charges; gain on divestiture of a business; loss on extinguishment of debt; and change in fair value of derivative instrument, net of related income tax effects. The Company has determined that non-GAAP EPS is the financial performance measure that, in the Company’s assessment, represents the most important performance measure used by the Company to link compensation actually paid to the NEOs, for the most recently completed fiscal year, to the Company’s performance.
       
Measure:: 2          
Pay vs Performance Disclosure          
Name Total Revenue        
Measure:: 3          
Pay vs Performance Disclosure          
Name Year-Over-Year Cybersecurity Revenue Growth        
Measure:: 4          
Pay vs Performance Disclosure          
Name Relative TSR Compared to the Russell 2000 Index        
PEO | Aggregate Grant Date Fair Value of Equity Award Amounts Reported in Summary Compensation Table          
Pay vs Performance Disclosure          
Adjustment to Compensation, Amount $ (1,346,256) $ (1,193,760) $ (1,830,096) $ (2,901,420) $ (2,504,520)
PEO | Equity Awards Adjustments, Excluding Value Reported in Compensation Table          
Pay vs Performance Disclosure          
Adjustment to Compensation, Amount 3,352,941 1,006,496 (502,275) 1,980,315 3,149,880
PEO | Year-end Fair Value of Equity Awards Granted in Covered Year that are Outstanding and Unvested          
Pay vs Performance Disclosure          
Adjustment to Compensation, Amount 2,130,192 1,370,448 1,144,800 2,160,900 2,747,880
PEO | Year-over-Year Change in Fair Value of Equity Awards Granted in Prior Years That are Outstanding and Unvested          
Pay vs Performance Disclosure          
Adjustment to Compensation, Amount 1,123,074 (192,411) (1,574,505) (351,225) 352,800
PEO | Vesting Date Fair Value of Equity Awards Granted and Vested in Covered Year          
Pay vs Performance Disclosure          
Adjustment to Compensation, Amount 0 0 0 0 0
PEO | Change in Fair Value as of Vesting Date of Prior Year Equity Awards Vested in Covered Year          
Pay vs Performance Disclosure          
Adjustment to Compensation, Amount 157,275 (171,541) (72,570) 170,640 49,200
PEO | Prior Year End Fair Value of Equity Awards Granted in Any Prior Year that Fail to Meet Applicable Vesting Conditions During Covered Year          
Pay vs Performance Disclosure          
Adjustment to Compensation, Amount (57,600) 0 0 0 0
PEO | Dividends or Other Earnings Paid on Equity Awards not Otherwise Reflected in Total Compensation for Covered Year          
Pay vs Performance Disclosure          
Adjustment to Compensation, Amount 0 0 0 0 0
Non-PEO NEO | Aggregate Grant Date Fair Value of Equity Award Amounts Reported in Summary Compensation Table          
Pay vs Performance Disclosure          
Adjustment to Compensation, Amount (340,304) (630,040) (965,884) (1,504,005) (1,321,830)
Non-PEO NEO | Equity Awards Adjustments, Excluding Value Reported in Compensation Table          
Pay vs Performance Disclosure          
Adjustment to Compensation, Amount 998,364 533,567 (252,000) 1,028,116 1,662,437
Non-PEO NEO | Year-end Fair Value of Equity Awards Granted in Covered Year that are Outstanding and Unvested          
Pay vs Performance Disclosure          
Adjustment to Compensation, Amount 538,465 723,292 604,200 1,123,425 1,450,270
Non-PEO NEO | Year-over-Year Change in Fair Value of Equity Awards Granted in Prior Years That are Outstanding and Unvested          
Pay vs Performance Disclosure          
Adjustment to Compensation, Amount 420,622 (99,190) (817,899) (185,369) 186,200
Non-PEO NEO | Vesting Date Fair Value of Equity Awards Granted and Vested in Covered Year          
Pay vs Performance Disclosure          
Adjustment to Compensation, Amount 0 0 0 0 0
Non-PEO NEO | Change in Fair Value as of Vesting Date of Prior Year Equity Awards Vested in Covered Year          
Pay vs Performance Disclosure          
Adjustment to Compensation, Amount 56,557 (90,535) (38,301) 90,060 25,967
Non-PEO NEO | Prior Year End Fair Value of Equity Awards Granted in Any Prior Year that Fail to Meet Applicable Vesting Conditions During Covered Year          
Pay vs Performance Disclosure          
Adjustment to Compensation, Amount (17,280) 0 0 0 0
Non-PEO NEO | Dividends or Other Earnings Paid on Equity Awards not Otherwise Reflected in Total Compensation for Covered Year          
Pay vs Performance Disclosure          
Adjustment to Compensation, Amount $ 0 $ 0 $ 0 $ 0 $ 0