v3.26.1
Performance Management
Mar. 31, 2026
First Prospectus | Tradr 2X Short SPY Monthly ETF  
Prospectus [Line Items]  
Bar Chart and Performance Table [Heading] Performance
Performance Narrative [Text Block]

The Fund is new and does not have a full calendar year performance record to compare against other funds or broad measures of securities market performance such as indices. Performance information will be available after the Fund has been in operation for one calendar year.

Performance One Year or Less [Text] The Fund is new and does not have a full calendar year performance record to compare against other funds or broad measures of securities market performance such as indices.
First Prospectus | Tradr 2X Long SPY Quarterly ETF  
Prospectus [Line Items]  
Bar Chart and Performance Table [Heading] Performance
Performance Narrative [Text Block]

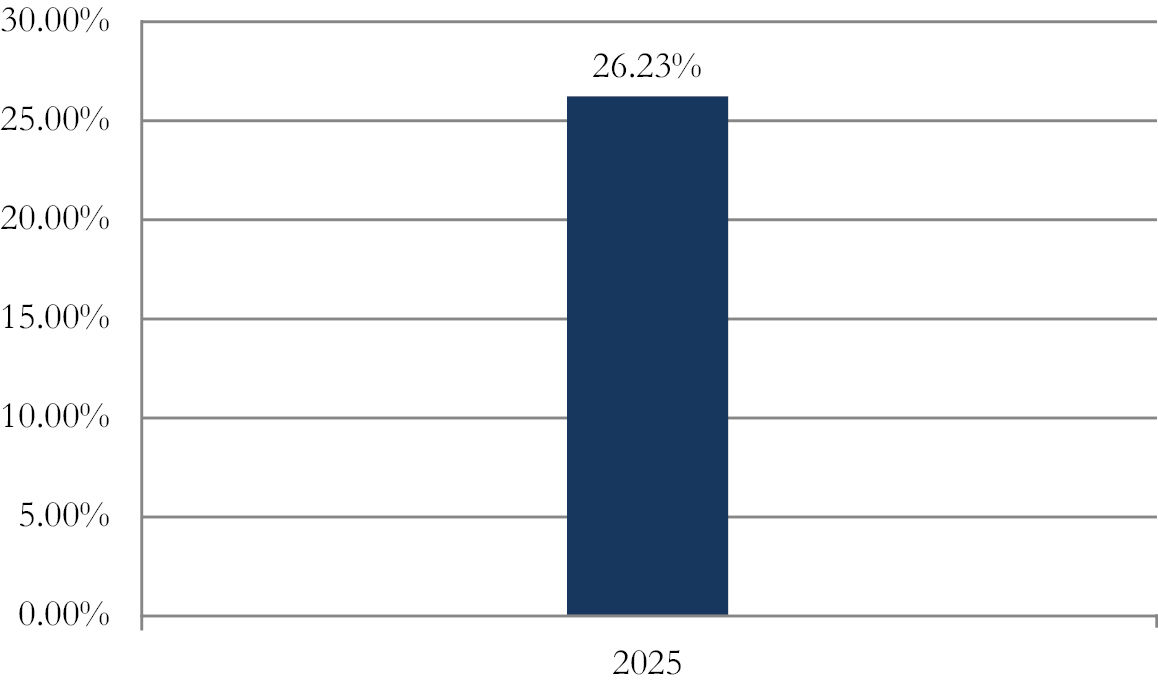
The bar chart and table below provide some indication of the risks of investing in the Fund by showing changes in the Fund’s performance from year to year and by showing how the average annual total returns of the Fund compare with the average annual total returns of the S&P 500 Index, a broad-based securities market index. The S&P 500 Index has been included as the primary broad-based securities market index in order to satisfy regulatory requirements. Updated performance information is available at the Fund’s website, www.tradretfs.com, or by calling the Fund at 1-888-528-7237. The Fund’s past performance, before and after taxes, is not necessarily an indication of how the Fund will perform in the future.
Performance Past Does Not Indicate Future [Text] The Fund’s past performance, before and after taxes, is not necessarily an indication of how the Fund will perform in the future.
Performance Information Illustrates Variability of Returns [Text] The bar chart and table below provide some indication of the risks of investing in the Fund by showing changes in the Fund’s performance from year to year and by showing how the average annual total returns of the Fund compare with the average annual total returns of the S&P 500 Index, a broad-based securities market index.
Bar Chart [Heading] Calendar-Year Total Return (before taxes) For each calendar year at net asset value per share (“NAV”)
Bar Chart [Table]

Bar Chart Closing [Text Block]

The year-to-date total return for the Fund as of June 30, 2026, was 15.13%.

Highest Calendar Quarter Return at NAV

19.49%

Quarter ended 6/30/2025

Lowest Calendar Quarter Return at NAV

(10.55)%

Quarter ended 3/31/2025

Year to Date Return, Label [Optional Text] year-to-date total return
Bar Chart, Year to Date Return 15.13%
Bar Chart, Year to Date Return, Date Jun. 30, 2026
Highest Quarterly Return, Label [Optional Text] Highest Calendar Quarter Return at NAV
Highest Quarterly Return 19.49%
Highest Quarterly Return, Date Jun. 30, 2025
Lowest Quarterly Return, Label [Optional Text] Lowest Calendar Quarter Return at NAV
Lowest Quarterly Return (10.55%)
Lowest Quarterly Return, Date Mar. 31, 2025
Performance Table Heading Average Annual Total Returns (for period ended December 31, 2025)
Performance Table Uses Highest Federal Rate After-tax returns are calculated using the historical highest individual federal marginal income tax rates and do not reflect the impact of state and local taxes.
Performance Table Not Relevant to Tax Deferred After-tax returns shown are not relevant to investors who hold their Fund shares through tax-deferred arrangements, such as 401(k) plans or individual retirement accounts.
Performance [Table]

Average Annual Total Returns
(for period ended December 31, 2025)


One Year

Since Inception
(9/30/2024)


Return Before Taxes

26.23%

23.13%


Return After Taxes on Distributions1

26.15%

23.07%


Return After Taxes on Distributions and Sale of Fund Shares1

15.53%

17.71%


S&P 500 Index (reflects no deduction for fees, expenses or taxes)

17.88%

16.23%


1       After-tax returns are calculated using the historical highest individual federal marginal income tax rates and do not reflect the impact of state and local taxes. Actual after-tax returns depend on an investor’s tax situation and may differ from those shown. After-tax returns shown are not relevant to investors who hold their Fund shares through tax-deferred arrangements, such as 401(k) plans or individual retirement accounts.

Performance Table One Class of after Tax Shown [Text] Actual after-tax returns depend on an investor’s tax situation and may differ from those shown.
Index No Deduction for Fees, Expenses, or Taxes [Text] reflects no deduction for fees, expenses or taxes
Performance Availability Website Address [Text] www.tradretfs.com
Performance Availability Phone [Text] 1-888-528-7237
First Prospectus | Tradr 2X Long Innovation 100 Monthly ETF  
Prospectus [Line Items]  
Bar Chart and Performance Table [Heading] Performance
Performance Narrative [Text Block]

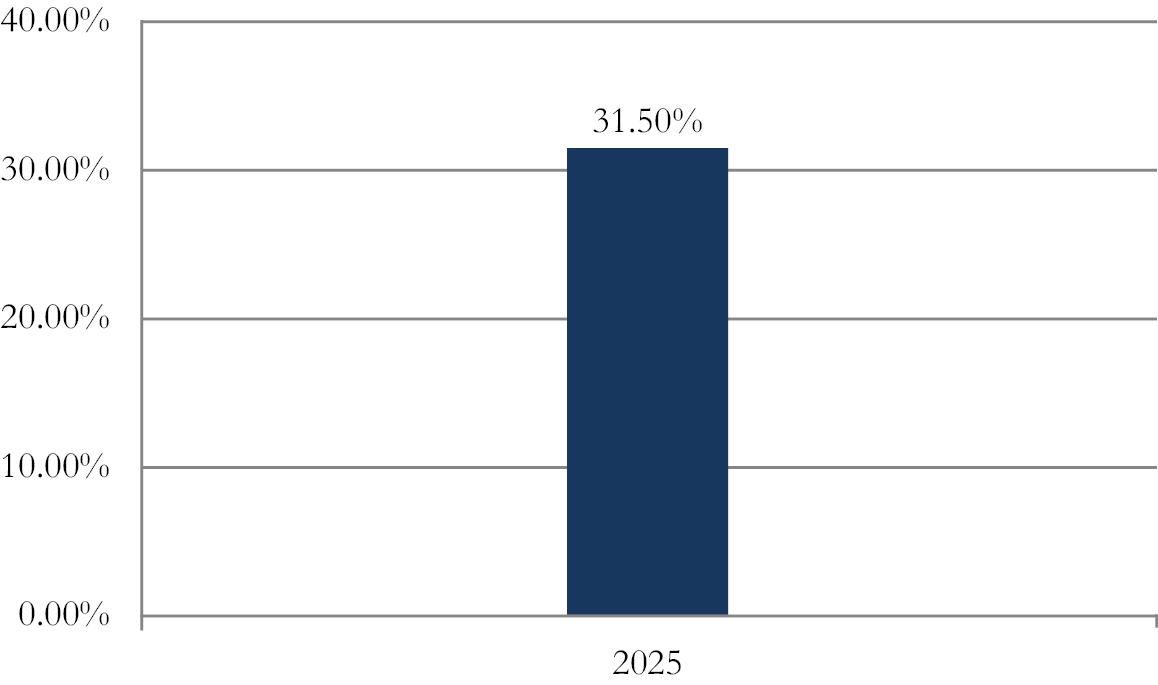
The bar chart and table below provide some indication of the risks of investing in the Fund by showing changes in the Fund’s performance from year to year and by showing how the average annual total returns of the Fund compare with the average annual total returns of the S&P 500 Index, a broad-based securities market index, and the Nasdaq 100 TR Index. The S&P 500 Index has been included as the primary broad-based securities market index in order to satisfy regulatory requirements. The Fund also compares its performance with the returns of the Nasdaq 100 TR Index, which the Advisor believes is a better performance benchmark for comparison to the Fund’s performance in light of the Fund’s investment strategy. Updated performance information is available at the Fund’s website, www.tradretfs.com, or by calling the Fund toll free at 1-888-528-7237. The Fund’s past performance, before and after taxes, is not necessarily an indication of how the Fund will perform in the future.
Performance Past Does Not Indicate Future [Text] The Fund’s past performance, before and after taxes, is not necessarily an indication of how the Fund will perform in the future.
Performance Information Illustrates Variability of Returns [Text] The bar chart and table below provide some indication of the risks of investing in the Fund by showing changes in the Fund’s performance from year to year and by showing how the average annual total returns of the Fund compare with the average annual total returns of the S&P 500 Index, a broad-based securities market index, and the Nasdaq 100 TR Index.
Bar Chart [Heading] Calendar-Year Total Return (before taxes) For each calendar year at net asset value per share (“NAV”)
Bar Chart [Table]

Bar Chart Closing [Text Block]

The year-to-date return as of June 30, 2026, was 35.27%.

Highest Calendar Quarter Return at NAV

34.64%

Quarter Ended 6/30/2025

Lowest Calendar Quarter Return at NAV

(18.07)%

Quarter Ended 3/31/2025

Year to Date Return, Label [Optional Text] year-to-date return
Bar Chart, Year to Date Return 35.27%
Bar Chart, Year to Date Return, Date Jun. 30, 2026
Highest Quarterly Return, Label [Optional Text] Highest Calendar Quarter Return at NAV
Highest Quarterly Return 34.64%
Highest Quarterly Return, Date Jun. 30, 2025
Lowest Quarterly Return, Label [Optional Text] Lowest Calendar Quarter Return at NAV
Lowest Quarterly Return (18.07%)
Lowest Quarterly Return, Date Mar. 31, 2025
Performance Table Heading Average Annual Total Returns (for periods ended December 31, 2025)
Performance Table Uses Highest Federal Rate After-tax returns are calculated using the historical highest individual federal marginal income tax rates and do not reflect the impact of state and local taxes.
Performance Table Not Relevant to Tax Deferred After-tax returns shown are not relevant to investors who hold their Fund shares through tax-deferred arrangements, such as 401(k) plans or individual retirement accounts.
Performance [Table]

Average Annual Total Returns
(for periods ended December 31, 2025)

One Year

Since
Inception
(8/30/2024)

Return Before Taxes

31.50%

34.01%

Return After Taxes on Distributions1

30.47%

33.21%

Return After Taxes on Distributions and Sale of Fund Shares1

18.67%

25.87%

S&P 500 Index (reflects no deduction for fees, expenses, or taxes)

17.88%

16.96%

Nasdaq 100 TR Index (reflects no deduction for fees, expenses, or taxes)

21.02%

21.86%

1       After-tax returns are calculated using the historical highest individual federal marginal income tax rates and do not reflect the impact of state and local taxes. Actual after-tax returns depend on an investor’s tax situation and may differ from those shown. After-tax returns shown are not relevant to investors who hold their Fund shares through tax-deferred arrangements, such as 401(k) plans or individual retirement accounts.

Performance Table One Class of after Tax Shown [Text] Actual after-tax returns depend on an investor’s tax situation and may differ from those shown.
Index No Deduction for Fees, Expenses, or Taxes [Text] reflects no deduction for fees, expenses, or taxes
Performance Availability Website Address [Text] www.tradretfs.com
Performance Availability Phone [Text] 1-888-528-7237
First Prospectus | Tradr 2X Short Innovation 100 Monthly ETF  
Prospectus [Line Items]  
Bar Chart and Performance Table [Heading] Performance
Performance Narrative [Text Block]

The Fund is new and does not have a full calendar year performance record to compare against other funds or broad measures of securities market performance such as indices. Performance information will be available after the Fund has been in operation for one calendar year.

Performance One Year or Less [Text] The Fund is new and does not have a full calendar year performance record to compare against other funds or broad measures of securities market performance such as indices.
First Prospectus | Tradr 2X Long Innovation 100 Quarterly ETF  
Prospectus [Line Items]  
Bar Chart and Performance Table [Heading] Performance
Performance Narrative [Text Block]

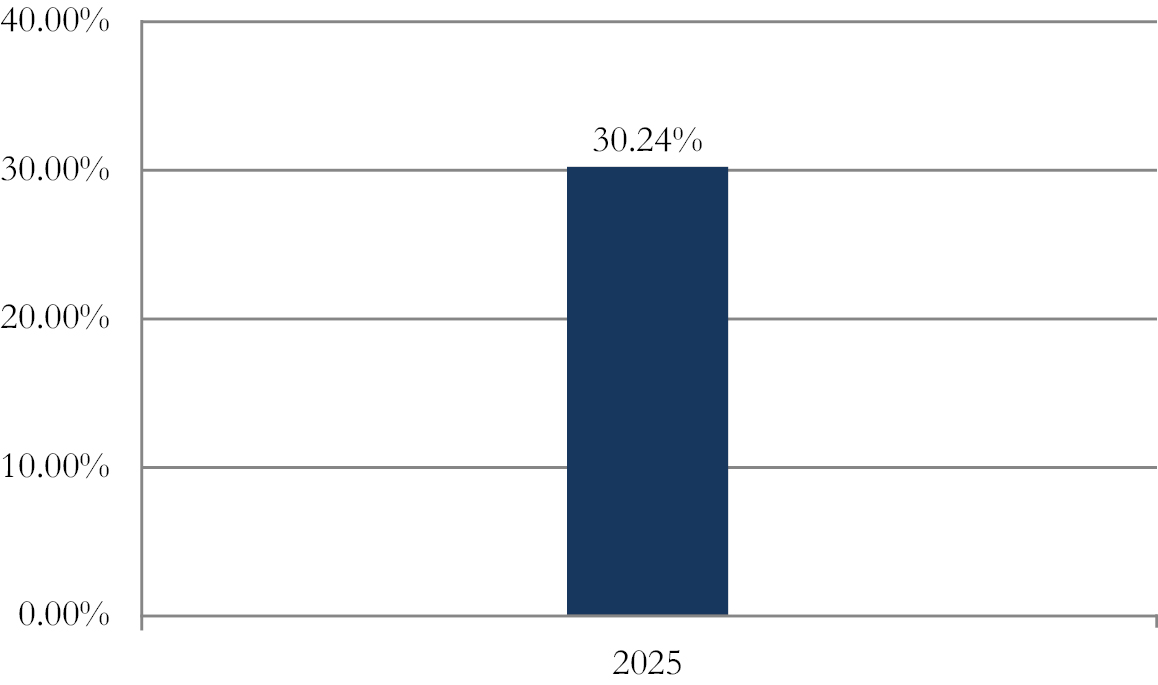
The bar chart and table below provide some indication of the risks of investing in the Fund by showing changes in the Fund’s performance from year to year and by showing how the average annual total returns of the Fund compare with the average annual total returns of the S&P 500 Index, a broad-based securities market index. The S&P 500 Index has been included as the primary broad-based securities market index in order to satisfy regulatory requirements. Updated performance information is available at the Fund’s website, www.tradretfs.com, or by calling the Fund at 1-888-528-7237. The Fund’s past performance, before and after taxes, is not necessarily an indication of how the Fund will perform in the future.

Performance Past Does Not Indicate Future [Text] The Fund’s past performance, before and after taxes, is not necessarily an indication of how the Fund will perform in the future.
Performance Information Illustrates Variability of Returns [Text] The bar chart and table below provide some indication of the risks of investing in the Fund by showing changes in the Fund’s performance from year to year and by showing how the average annual total returns of the Fund compare with the average annual total returns of the S&P 500 Index, a broad-based securities market index.
Bar Chart [Heading] Calendar-Year Total Return (before taxes) For each calendar year at net asset value per share (“NAV”)
Bar Chart [Table]

Bar Chart Closing [Text Block]

The year-to-date return as of June 30, 2026, was 32.99%

Highest Calendar Quarter Return at NAV

33.44%

Quarter Ended 6/30/2025

Lowest Calendar Quarter Return at NAV

(18.28)%

Quarter Ended 3/31/2025

Year to Date Return, Label [Optional Text] year-to-date return
Bar Chart, Year to Date Return 32.99%
Bar Chart, Year to Date Return, Date Jun. 30, 2026
Highest Quarterly Return, Label [Optional Text] Highest Calendar Quarter Return at NAV
Highest Quarterly Return 33.44%
Highest Quarterly Return, Date Jun. 30, 2025
Lowest Quarterly Return, Label [Optional Text] Lowest Calendar Quarter Return at NAV
Lowest Quarterly Return (18.28%)
Lowest Quarterly Return, Date Mar. 31, 2025
Performance Table Heading Average Annual Total Returns (for period ended December 31, 2025)
Performance Table Uses Highest Federal Rate After-tax returns are calculated using the historical highest individual federal marginal income tax rates and do not reflect the impact of state and local taxes.
Performance Table Not Relevant to Tax Deferred After-tax returns shown are not relevant to investors who hold their Fund shares through tax-deferred arrangements, such as 401(k) plans or individual retirement accounts.
Performance [Table]

Average Annual Total Returns
(for period ended December 31, 2025)

One Year

Since
Inception
(9/30/2024)

Return Before Taxes

30.24%

31.01%

Return After Taxes on Distributions1

30.24%

31.01%

Return After Taxes on Distributions and Sale of Fund Shares1

17.90%

23.81%

S&P 500 Index (reflects no deduction for fees, expenses or taxes)

17.88%

16.23%

1            After-tax returns are calculated using the historical highest individual federal marginal income tax rates and do not reflect the impact of state and local taxes. Actual after-tax returns depend on an investor’s tax situation and may differ from those shown. After-tax returns shown are not relevant to investors who hold their Fund shares through tax-deferred arrangements, such as 401(k) plans or individual retirement accounts.

Performance Table One Class of after Tax Shown [Text] Actual after-tax returns depend on an investor’s tax situation and may differ from those shown.
Index No Deduction for Fees, Expenses, or Taxes [Text] reflects no deduction for fees, expenses or taxes
Performance Availability Website Address [Text] www.tradretfs.com
Performance Availability Phone [Text] 1-888-528-7237
Second Prospectus | Astoria Real Assets ETF  
Prospectus [Line Items]  
Bar Chart and Performance Table [Heading] Performance
Performance Narrative [Text Block]

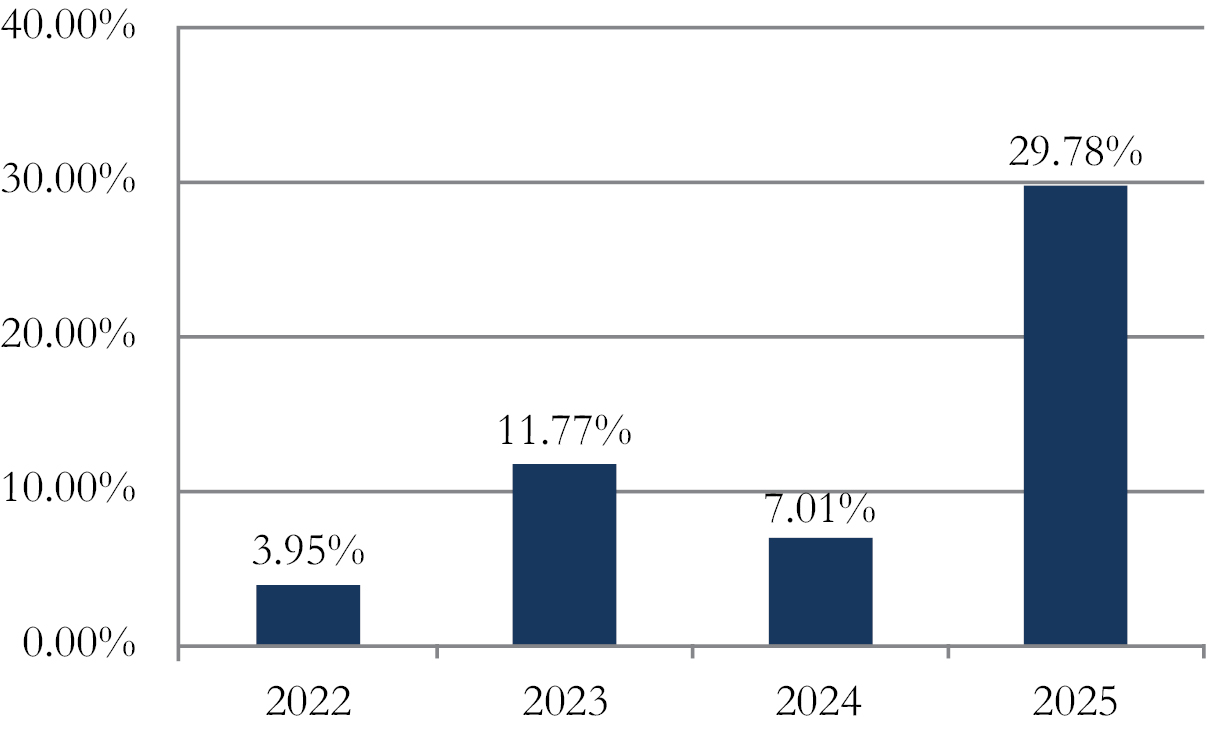
The bar chart and table below provide some indication of the risks of investing in the Fund by showing changes in the Fund’s performance from year to year and by showing how the average annual total returns of the Fund compare with the average annual total returns of the MSCI ACWI (Net) Index, a broad-based securities market index as well as the Bloomberg Commodity Total Return Index, the Bloomberg U.S. TIPS 1-3 Year (USD) Index and the AXS Astoria Blended Benchmark Index. The MSCI ACWI (Net) Index has been included as the primary broad-based securities market index in order to satisfy regulatory requirements. The Fund also compares its performance with the returns of Bloomberg Commodity Total Return Index, the Bloomberg U.S. TIPS 1-3 Year (USD) Index and the AXS Astoria Blended Benchmark Index, which the Advisor believes are better performance benchmarks for comparison to the Fund’s performance in light of the Fund’s investment strategies. Updated performance information is available at the Fund’s website, www.axsinvestments.com or by calling the Fund at 1-833-297-2587. The Fund’s past performance, before and after taxes, is not necessarily an indication of how the Fund will perform in the future.

Performance Past Does Not Indicate Future [Text] The Fund’s past performance, before and after taxes, is not necessarily an indication of how the Fund will perform in the future.
Performance Information Illustrates Variability of Returns [Text] The bar chart and table below provide some indication of the risks of investing in the Fund by showing changes in the Fund’s performance from year to year and by showing how the average annual total returns of the Fund compare with the average annual total returns of the MSCI ACWI (Net) Index, a broad-based securities market index as well as the Bloomberg Commodity Total Return Index, the Bloomberg U.S. TIPS 1-3 Year (USD) Index and the AXS Astoria Blended Benchmark Index.
Bar Chart [Heading] Calendar-Year Total Return (before taxes) For each calendar year at net asset value per share (“NAV”)
Bar Chart [Table]

Bar Chart Closing [Text Block]

The year-to-date return as of June 30, 2026, was 15.36%.

Highest Calendar Quarter Return at NAV

15.81%

Quarter ended 3/31/2024

Lowest Calendar Quarter Return at NAV

(17.42)%

Quarter ended 6/30/2022

Year to Date Return, Label [Optional Text] year-to-date return
Bar Chart, Year to Date Return 15.36%
Bar Chart, Year to Date Return, Date Jun. 30, 2026
Highest Quarterly Return, Label [Optional Text] Highest Calendar Quarter Return at NAV
Highest Quarterly Return 15.81%
Highest Quarterly Return, Date Mar. 31, 2024
Lowest Quarterly Return, Label [Optional Text] Lowest Calendar Quarter Return at NAV
Lowest Quarterly Return (17.42%)
Lowest Quarterly Return, Date Jun. 30, 2022
Performance Table Heading Average Annual Total Returns (for Period Ended December 31, 2025)
Performance Table Uses Highest Federal Rate After-tax returns are calculated using the historical highest individual federal marginal income tax rates and do not reflect the impact of state and local taxes.
Performance Table Not Relevant to Tax Deferred After-tax returns shown are not relevant to investors who hold their Fund shares through tax-deferred arrangements, such as 401(k) plans or individual retirement accounts.
Performance [Table]

Average Annual Total Returns
(for Period Ended December 31, 2025)

One Year

Since
Inception
(12/29/2021)

Return Before Taxes

29.78%

12.72%

Return After Taxes on Distributions*

29.41%

12.11%

Return After Taxes on Distributions and Sale of Fund Shares*

17.83%

9.87%

MSCI ACWI (Net) Index
(reflects no deduction for fees, expenses or taxes)

22.34%

9.36%

AXS Astoria Blended Benchmark Index
(reflects no deduction for fees, expenses or taxes)

19.42%

8.50%

Bloomberg Commodity Total Return Index
(reflects no deduction for fees, expenses or taxes)

15.77%

6.59%

Bloomberg U.S. TIPS 1-3 Year (USD) Index
(reflects no deduction for fees, expenses or taxes)

5.68%

3.38%

*       After-tax returns are calculated using the historical highest individual federal marginal income tax rates and do not reflect the impact of state and local taxes. Actual after-tax returns depend on an investor’s tax situation and may differ from those shown. After-tax returns shown are not relevant to investors who hold their Fund shares through tax-deferred arrangements, such as 401(k) plans or individual retirement accounts.

Performance Table One Class of after Tax Shown [Text] Actual after-tax returns depend on an investor’s tax situation and may differ from those shown.
Index No Deduction for Fees, Expenses, or Taxes [Text] reflects no deduction for fees, expenses or taxes
Performance Availability Website Address [Text] www.axsinvestments.com
Performance Availability Phone [Text] 1-833-297-2587
Second Prospectus | AXS Esoterica NextG Economy ETF  
Prospectus [Line Items]  
Bar Chart and Performance Table [Heading] Performance
Performance Narrative [Text Block]

The Fund commenced operations and acquired the assets and liabilities of the Esoterica NextG Economy ETF (the “Predecessor Fund”), following the reorganization of the Predecessor Fund on December 16, 2022. As a result of the reorganization, the Fund is the accounting successor of the Predecessor Fund. For the relevant periods, the bar chart and the performance table below reflect the performance of the Predecessor Fund prior to the commencement of the Fund’s operations on December 16, 2022.

The bar chart and table provide an indication of the risks of investing in the Fund by showing changes in the Fund’s performance from year-to-year and by showing how the Fund’s average annual total returns based on net asset value compare with the average annual total returns of the S&P 500 Index, a broad-based securities index. The S&P 500 Index has been included as the primary broad-based securities market index in order to satisfy regulatory requirements. The Fund also compares its performance with the returns of the MSCI All Country World Index, which the Advisor believes is a better performance benchmark for comparison to the Fund’s performance in light of the Fund’s investment strategies. The Fund’s performance information is accessible on the Fund’s website at www.axsinvestments.com.
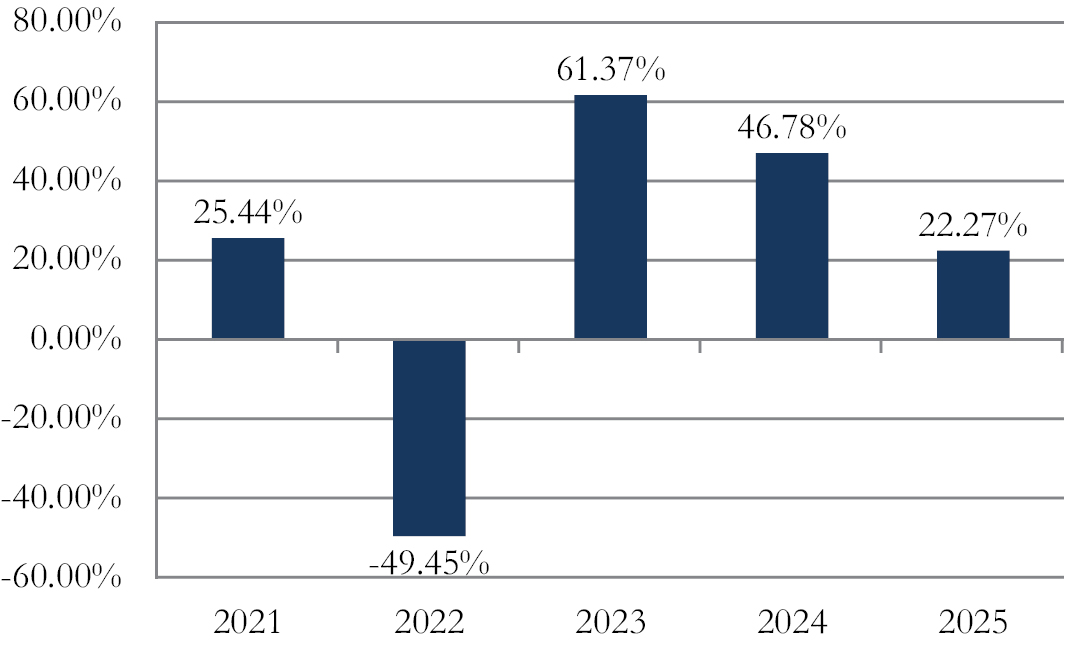
Performance Past Does Not Indicate Future [Text] The Fund’s past performance (before and after taxes) is not necessarily an indication of how the Fund will perform in the future.
Performance Information Illustrates Variability of Returns [Text] The bar chart and table provide an indication of the risks of investing in the Fund by showing changes in the Fund’s performance from year-to-year and by showing how the Fund’s average annual total returns based on net asset value compare with the average annual total returns of the S&P 500 Index, a broad-based securities index.
Bar Chart [Heading] Calendar-Year Total Return (before taxes) for the Fund For each calendar year at net asset value per share (“NAV”)
Bar Chart [Table]

Bar Chart Closing [Text Block]

The year-to-date return as of June 30, 2026, was 32.83%.

Highest Calendar Quarter Return at NAV

24.22%

Quarter ended 03/31/2023

Lowest Calendar Quarter Return at NAV

(26.91)%

Quarter ended 06/30/2022

Year to Date Return, Label [Optional Text] year-to-date return
Bar Chart, Year to Date Return 32.83%
Bar Chart, Year to Date Return, Date Jun. 30, 2026
Highest Quarterly Return, Label [Optional Text] Highest Calendar Quarter Return at NAV
Highest Quarterly Return 24.22%
Highest Quarterly Return, Date Mar. 31, 2023
Lowest Quarterly Return, Label [Optional Text] Lowest Calendar Quarter Return at NAV
Lowest Quarterly Return (26.91%)
Lowest Quarterly Return, Date Jun. 30, 2022
Performance Table Heading Average Annual Total Returns (for Period Ended December 31, 2025)
Performance Table Uses Highest Federal Rate After-tax returns are calculated using the historical highest individual federal marginal income tax rates and do not reflect the impact of state and local taxes.
Performance Table Not Relevant to Tax Deferred After-tax returns shown are not relevant to investors who hold their Fund shares through tax-deferred arrangements, such as 401(k) plans or individual retirement accounts.
Performance [Table]

Average Annual Total Returns
(for Period Ended December 31, 2025)

One Year

Five Years

Since
Inception
(03/30/2020)

Return Before Taxes

22.27%

12.93%

24.96%

Return After Taxes on Distributions1

15.70%

11.44%

23.53%

Return After Taxes on Distributions and Sale of Fund Shares1

15.87%

10.06%

20.61%

S&P 500® Index
(reflects no deduction for fees, expenses or taxes)2

17.88%

14.42%

19.90%

MSCI All Country World IndexSM (Net) Index
(reflects no deduction for fees, expenses or taxes)3

22.34%

11.19%

17.24%

1    After-tax returns are calculated using the historical highest individual federal marginal income tax rates and do not reflect the impact of state and local taxes. Actual after-tax returns depend on an investor’s tax situation and may differ from those shown. After-tax returns shown are not relevant to investors who hold their Fund shares through tax-deferred arrangements, such as 401(k) plans or individual retirement accounts.

2    The Fund’s primary benchmark is the S&P 500 Index®. The Standard & Poor’s (“S&P”) 500 Index® is an unmanaged index consisting of 500 stocks chosen for market size, liquidity, and industry group representation. It is a market-weighted index (stock price times number of shares outstanding) with each stock’s weight in the Index proportionate to its market value. Unlike the Fund, the benchmark is unmanaged and does not include any fees or expenses. An investor cannot invest directly in an index.

3    The Fund also compares its performance with the MSCI All Country World IndexSM, which the Advisor believes is a better performance benchmark to the Fund’s performance in light of the Fund’s investment strategies. The MSCI All Country World IndexSM is a market-cap-weighted global equity index that tracks emerging and developed markets. It currently monitors nearly 3,000 large-and mid-cap stocks in 49 countries. Unlike the Fund, the benchmark is unmanaged and does not include any fees or expenses. An investor cannot invest directly in an index.

Performance Table One Class of after Tax Shown [Text] Actual after-tax returns depend on an investor’s tax situation and may differ from those shown.
Index No Deduction for Fees, Expenses, or Taxes [Text] reflects no deduction for fees, expenses or taxes
Performance Table Closing [Text Block]

The Fund’s past performance (before and after taxes) is not necessarily an indication of how the Fund will perform in the future. Returns before taxes do not reflect the effects of any income or capital gains taxes. Returns after taxes on distributions reflect the taxed return on the payment of dividends and capital gains.

Performance Availability Website Address [Text] www.axsinvestments.com
Second Prospectus | AXS Green Alpha ETF  
Prospectus [Line Items]  
Bar Chart and Performance Table [Heading] Performance
Performance Narrative [Text Block]

The bar chart and table below provide an indication of the risks of investing in the Fund by showing changes in the Fund’s performance from year to year and by showing how the average annual total returns of the Fund compare with the average annual total returns of the MSCI All Country World IndexSM Investable Market Index, a broad-based market index. The MSCI All Country World IndexSM Investable Market Index has been included as the primary broad-based securities market index in order to satisfy regulatory requirements. The Fund’s past performance, before and after taxes, is not necessarily an indication of how the Fund will perform in the future.
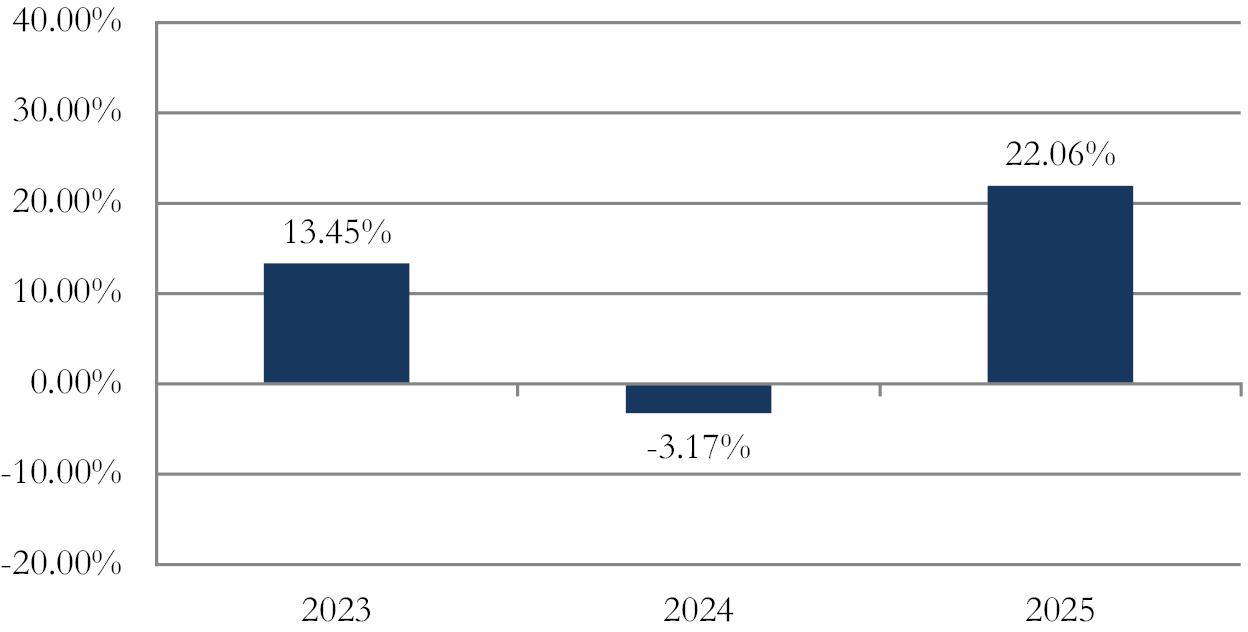
Performance Past Does Not Indicate Future [Text] The Fund’s past performance, before and after taxes, is not necessarily an indication of how the Fund will perform in the future.
Performance Information Illustrates Variability of Returns [Text] The bar chart and table below provide an indication of the risks of investing in the Fund by showing changes in the Fund’s performance from year to year and by showing how the average annual total returns of the Fund compare with the average annual total returns of the MSCI All Country World IndexSM Investable Market Index, a broad-based market index.
Bar Chart Does Not Reflect Sales Loads [Text] The index does not reflect expenses, fees, or sales charge, which would lower performance.
Bar Chart [Heading] Calendar-Year Total Return (before taxes) for Fund For each calendar year at net asset value per share (“NAV”)
Bar Chart [Table]

Bar Chart Closing [Text Block]

The year-to-date return as of June 30, 2026, was 40.97%.

Highest Calendar Quarter Return at NAV

17.18%

Quarter Ended 12/31/2023

Lowest Calendar Quarter Return at NAV

(12.34)%

Quarter Ended 09/30/2023

Year to Date Return, Label [Optional Text] year-to-date return
Bar Chart, Year to Date Return 40.97%
Bar Chart, Year to Date Return, Date Jun. 30, 2026
Highest Quarterly Return, Label [Optional Text] Highest Calendar Quarter Return at NAV
Highest Quarterly Return 17.18%
Highest Quarterly Return, Date Dec. 31, 2023
Lowest Quarterly Return, Label [Optional Text] Lowest Calendar Quarter Return at NAV
Lowest Quarterly Return (12.34%)
Lowest Quarterly Return, Date Sep. 30, 2023
Performance Table Heading Average Annual Total Returns (for Period Ended December 31, 2025)
Performance Table Uses Highest Federal Rate     After-tax returns are calculated using the historical highest individual federal marginal income tax rates and do not reflect the impact of state and local taxes.
Performance Table Not Relevant to Tax Deferred After-tax returns shown are not relevant to investors who hold their Fund shares through tax-deferred arrangements, such as 401(k) plans or individual retirement accounts.
Performance [Table]

Average Annual Total Returns
(for Period Ended December 31, 2025)


One Year

Since
Inception
(9/27/2022)

Return Before Taxes

22.06%

8.61%

Return After Taxes on Distributions1

21.95%

8.45%

Return After Taxes on Distributions and Sale of Fund Shares1

13.13%

6.66%

MSCI All Country World IndexSM Investable Market Index (reflects no deduction for fees, expenses or taxes)2

22.06%

21.36%

1    After-tax returns are calculated using the historical highest individual federal marginal income tax rates and do not reflect the impact of state and local taxes. Actual after-tax returns depend on an investor’s tax situation and may differ from those shown. After-tax returns shown are not relevant to investors who hold their Fund shares through tax-deferred arrangements, such as 401(k) plans or individual retirement accounts.

2    The MSCI All Country World Investable Market Index is a free float-adjusted market capitalization-weighted index that is designed to measure the equity market performance of the large-, mid-, and small-cap segments of developed and emerging markets. The index does not reflect expenses, fees, or sales charge, which would lower performance. The index is unmanaged and is not available for investment.

Performance Table One Class of after Tax Shown [Text] Actual after-tax returns depend on an investor’s tax situation and may differ from those shown.
Index No Deduction for Fees, Expenses, or Taxes [Text] reflects no deduction for fees, expenses or taxes
Second Prospectus | AXS Knowledge Leaders ETF  
Prospectus [Line Items]  
Bar Chart and Performance Table [Heading] Performance
Performance Narrative [Text Block]

The Fund acquired the assets and liabilities of the Knowledge Leaders Developed World ETF, a series of the Investment Managers Series Trust (the “Predecessor Fund”), on July 19, 2024. As a result of the acquisition, the Fund is the accounting successor of the Predecessor Fund. Performance results shown in the bar chart and the performance table below for periods prior to July 19, 2024, reflect the performance of the Predecessor Fund.

The bar chart and table provide an indication of the risks of investing in the Fund by showing changes in the Fund’s performance from year to year and by showing how the Fund’s average annual total returns compare with those of the MSCI World Equal Weighted Net Total Return Index (the “MSCI World Equal Weighted NR Index”), a broad-based securities market index. The Fund also compares its performance with the returns of the MSCI World ex USA Weighted Net Total Return Index (the “MSCI World ex USA Equal Weighted NR Index”) and MSCI ACWI (Net) Index. The Fund’s past performance (before and after taxes) does not necessarily indicate how it will perform in the future.

The Fund’s performance information is accessible on the Fund’s website at www.axsinvestments.com.
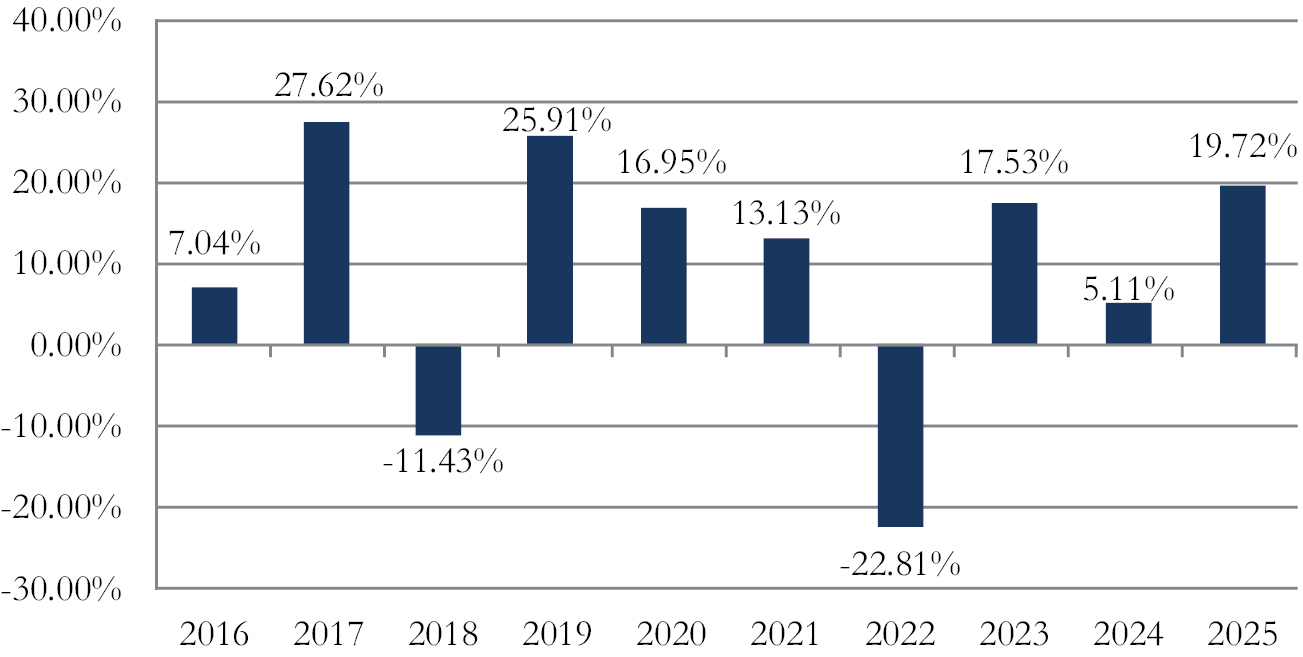
Performance Past Does Not Indicate Future [Text] The Fund’s past performance (before and after taxes) does not necessarily indicate how it will perform in the future.
Performance Information Illustrates Variability of Returns [Text] The bar chart and table provide an indication of the risks of investing in the Fund by showing changes in the Fund’s performance from year to year and by showing how the Fund’s average annual total returns compare with those of the MSCI World Equal Weighted Net Total Return Index (the “MSCI World Equal Weighted NR Index”), a broad-based securities market index.
Bar Chart [Heading] Calendar-Year Total Return (before taxes) for Fund
Bar Chart [Table]

Bar Chart Closing [Text Block]

The year-to-date total return for the Fund as of June 30, 2026, was 25.99%.

Highest Calendar Quarter Return at NAV

19.50%

Quarter Ended 06/30/2020

Lowest Calendar Quarter Return at NAV

(15.88)%

Quarter Ended 06/30/2022

Year to Date Return, Label [Optional Text] year-to-date total return
Bar Chart, Year to Date Return 25.99%
Bar Chart, Year to Date Return, Date Jun. 30, 2026
Highest Quarterly Return, Label [Optional Text] Highest Calendar Quarter Return at NAV
Highest Quarterly Return 19.50%
Highest Quarterly Return, Date Jun. 30, 2020
Lowest Quarterly Return, Label [Optional Text] Lowest Calendar Quarter Return at NAV
Lowest Quarterly Return (15.88%)
Lowest Quarterly Return, Date Jun. 30, 2022
Performance Table Heading Average Annual Total Returns (for Period Ended December 31, 2025)
Performance Table Uses Highest Federal Rate After-tax returns are calculated using the historical highest individual federal marginal income tax rates and do not reflect the impact of state and local taxes.
Performance Table Not Relevant to Tax Deferred After-tax returns shown are not relevant to investors who hold their shares through tax-deferred arrangements, such as 401(k) plans or individual retirement accounts.
Performance Table Explanation after Tax Higher In some cases, the return after taxes may exceed the return before taxes due to an assumed tax benefit from any losses on a sale of shares of the Fund at the end of the measurement period.
Performance [Table]

Average Annual Total Returns
(for Period Ended December 31, 2025)

One Year

Five Years

Ten Years

Return Before Taxes

19.72%

5.25%

8.69%

Return After Taxes on Distributions*

19.42%

4.94%

8.43%

Return After Taxes on Distributions and Sale of Fund Shares*

11.89%

4.05%

7.07%

MSCI World Equal Weighted NR Index
(reflects no deduction for fees, expenses or taxes)

21.41%

7.83%

8.84%

MSCI World Ex USA Equal Weighted NR Index
(reflects no deduction for fees, expenses or taxes)

30.32%

7.13%

7.55%

MSCI ACWI (Net) Index
(reflects no deduction for fees, expenses or taxes)

22.34%

11.19%

11.72%

*       After-tax returns are calculated using the historical highest individual federal marginal income tax rates and do not reflect the impact of state and local taxes. Your actual after-tax returns will depend on your tax situation and may differ from those shown. After-tax returns shown are not relevant to investors who hold their shares through tax-deferred arrangements, such as 401(k) plans or individual retirement accounts. In some cases, the return after taxes may exceed the return before taxes due to an assumed tax benefit from any losses on a sale of shares of the Fund at the end of the measurement period.

Performance Table One Class of after Tax Shown [Text] Your actual after-tax returns will depend on your tax situation and may differ from those shown.
Index No Deduction for Fees, Expenses, or Taxes [Text] reflects no deduction for fees, expenses or taxes
Performance Table Closing [Text Block]

The Fund’s past performance (before and after taxes) is not necessarily an indication of how the Fund will perform in the future. Returns before taxes do not reflect the effects of any income or capital gains taxes. All after-tax returns are calculated using the historical highest individual federal marginal income taxes and do not reflect the impact of any state or local tax. Returns after taxes on distributions reflect the taxed return on the payment of dividends and capital gains.

Your own actual after-tax returns will depend on your specific tax situation and may differ from what is shown here. After-tax returns are not relevant to investors who hold Shares in tax-deferred accounts such as individual retirement accounts (IRAs) or employee-sponsored retirement plans.

Performance Availability Website Address [Text] www.axsinvestments.com
Third Prospectus | Tradr 2X Long Innovation ETF  
Prospectus [Line Items]  
Bar Chart and Performance Table [Heading] Performance
Performance Narrative [Text Block]

The bar chart and table below provide some indication of the risks of investing in the Fund by showing changes in the Fund’s performance from year to year and by showing how the average annual total returns of the Fund compare with the average annual total returns of the S&P 500 Index, a broad-based securities market index, and the ARK Innovation ETF Index. The S&P 500 Index has been included as the primary broad-based securities market index in order to satisfy regulatory requirements. The Fund also compares its performance with the returns of the ARK Innovation ETF Index, which the Advisor believes is a better performance benchmark for comparison to the Fund’s performance in light of the Fund’s investment strategy. Updated performance information is available at the Fund’s website, www.tradretfs.com, or by calling the Fund at 1-888-528-7237. The Fund’s past performance, before and after taxes, is not necessarily an indication of how the Fund will perform in the future.
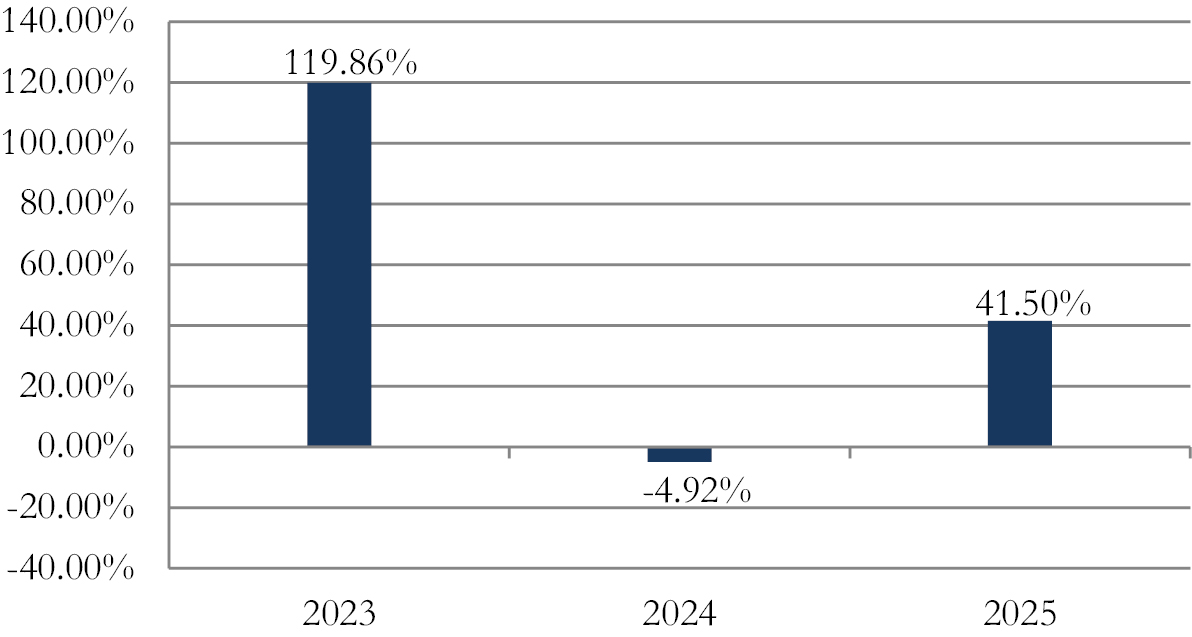
Performance Past Does Not Indicate Future [Text] The Fund’s past performance, before and after taxes, is not necessarily an indication of how the Fund will perform in the future.
Performance Information Illustrates Variability of Returns [Text] The bar chart and table below provide some indication of the risks of investing in the Fund by showing changes in the Fund’s performance from year to year and by showing how the average annual total returns of the Fund compare with the average annual total returns of the S&P 500 Index, a broad-based securities market index, and the ARK Innovation ETF Index.
Bar Chart [Heading] Calendar-Year Total Return (before taxes) For each calendar year at net asset value per share (“NAV”)
Bar Chart [Table]

Bar Chart Closing [Text Block]

The year-to-date return as of June 30, 2026, was (0.62)%.

Highest Calendar Quarter Return at NAV

98.49%

Quarter Ended 6/30/2025

Lowest Calendar Quarter Return at NAV

(34.79)%

Quarter Ended 3/31/2025

Year to Date Return, Label [Optional Text] year-to-date return
Bar Chart, Year to Date Return (0.62%)
Bar Chart, Year to Date Return, Date Jun. 30, 2026
Highest Quarterly Return, Label [Optional Text] Highest Calendar Quarter Return at NAV
Highest Quarterly Return 98.49%
Highest Quarterly Return, Date Jun. 30, 2025
Lowest Quarterly Return, Label [Optional Text] Lowest Calendar Quarter Return at NAV
Lowest Quarterly Return (34.79%)
Lowest Quarterly Return, Date Mar. 31, 2025
Performance Table Heading Average Annual Total Returns (for periods ended December 31, 2025)
Performance Table Uses Highest Federal Rate After-tax returns are calculated using the historical highest individual federal marginal income tax rates and do not reflect the impact of state and local taxes.
Performance Table Not Relevant to Tax Deferred After-tax returns shown are not relevant to investors who hold their Fund shares through tax-deferred arrangements, such as 401(k) plans or individual retirement accounts.
Performance [Table]

Average Annual Total Returns
(for periods ended December 31, 2025)


One Year

Since
Inception
(4/28/2022)


Return Before Taxes

41.50%

  (5.06)%


Return After Taxes on Distributions1

33.21%

  (6.64)%


Return After Taxes on Distributions and Sale of Fund Shares1

29.71%

  (3.81)%


S&P 500 Index (reflects no deduction for fees, expenses, or taxes)

17.88%

15.28%


ARK Innovation ETF Index (reflects no deduction for fees, expenses, or taxes)

35.49%

13.13%


1       After-tax returns are calculated using the historical highest individual federal marginal income tax rates and do not reflect the impact of state and local taxes. Actual after-tax returns depend on an investor’s tax situation and may differ from those shown. After-tax returns shown are not relevant to investors who hold their Fund shares through tax-deferred arrangements, such as 401(k) plans or individual retirement accounts.

Performance Table One Class of after Tax Shown [Text] Actual after-tax returns depend on an investor’s tax situation and may differ from those shown.
Index No Deduction for Fees, Expenses, or Taxes [Text] reflects no deduction for fees, expenses, or taxes
Performance Availability Website Address [Text] www.tradretfs.com
Performance Availability Phone [Text] 1-888-528-7237
Third Prospectus | Tradr 2X Short TSLA Daily ETF  
Prospectus [Line Items]  
Bar Chart and Performance Table [Heading] Performance
Performance Narrative [Text Block]

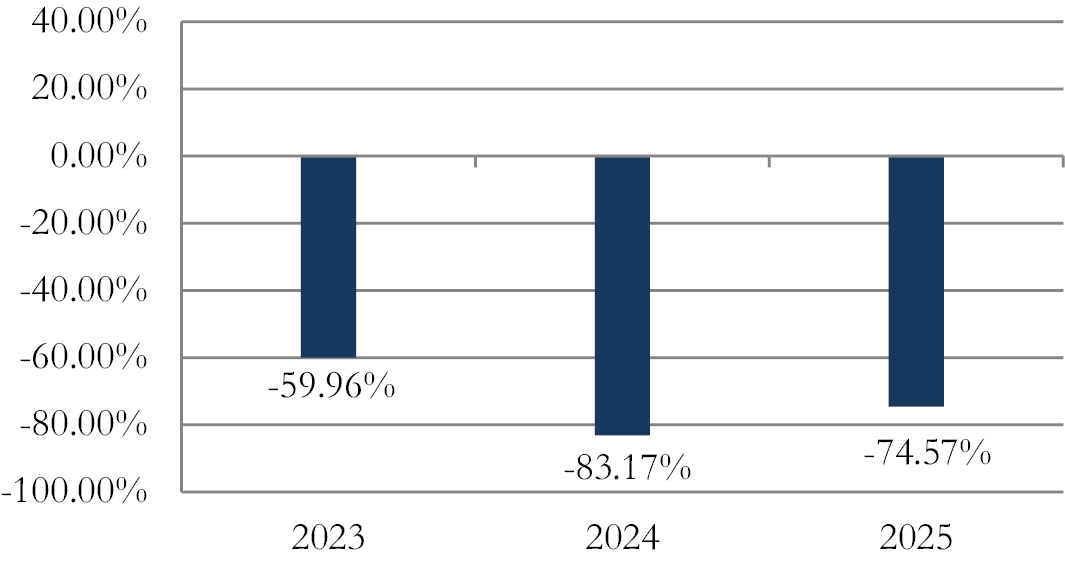
The bar chart and table below provide some indication of the risks of investing in the Fund by showing changes in the Fund’s performance from year to year and by showing how the average annual total returns of the Fund compare with the average annual total returns of the S&P 500 Index, a broad-based securities market index. The S&P 500 Index has been included as the primary broad-based securities market index in order to satisfy regulatory requirements. Updated performance information is available at the Fund’s website, www.tradretfs.com, or by calling the Fund at 1-888-528-7237. The Fund’s past performance, before and after taxes, is not necessarily an indication of how the Fund will perform in the future.
Performance Past Does Not Indicate Future [Text] The Fund’s past performance, before and after taxes, is not necessarily an indication of how the Fund will perform in the future.
Performance Information Illustrates Variability of Returns [Text] The bar chart and table below provide some indication of the risks of investing in the Fund by showing changes in the Fund’s performance from year to year and by showing how the average annual total returns of the Fund compare with the average annual total returns of the S&P 500 Index, a broad-based securities market index.
Bar Chart [Heading] Calendar-Year Total Return (before taxes) For each calendar year at net asset value per share (“NAV”)
Bar Chart [Table]

Bar Chart Closing [Text Block]

The year-to-date return as of June 30, 2026, was (8.70)%.

Highest Calendar Quarter Return at NAV

70.87%

Quarter Ended 03/31/2025

Lowest Calendar Quarter Return at NAV

(74.43)%

Quarter Ended 12/31/2024

Year to Date Return, Label [Optional Text] year-to-date return
Bar Chart, Year to Date Return (8.70%)
Bar Chart, Year to Date Return, Date Jun. 30, 2026
Highest Quarterly Return, Label [Optional Text] Highest Calendar Quarter Return at NAV
Highest Quarterly Return 70.87%
Highest Quarterly Return, Date Mar. 31, 2025
Lowest Quarterly Return, Label [Optional Text] Lowest Calendar Quarter Return at NAV
Lowest Quarterly Return (74.43%)
Lowest Quarterly Return, Date Dec. 31, 2024
Performance Table Heading Average Annual Total Returns (for periods ended December 31, 2025)
Performance Table Uses Highest Federal Rate After-tax returns are calculated using the historical highest individual federal marginal income tax rates and do not reflect the impact of state and local taxes.
Performance Table Not Relevant to Tax Deferred After-tax returns shown are not relevant to investors who hold their Fund shares through tax-deferred arrangements, such as 401(k) plans or individual retirement accounts.
Performance [Table]

Average Annual Total Returns
(for periods ended December 31, 2025)


One Year

Since
Inception
(7/13/2022)


Return Before Taxes

(74.57)%

(64.39)%


Return After Taxes on Distributions1

(75.72)%

(65.67)%


Return After Taxes on Distributions and Sale of Fund Shares1

(44.25)%

(31.15)%


S&P 500 Index (reflects no deduction for fees, expenses, or taxes)

17.88%

20.24%


1       After-tax returns are calculated using the historical highest individual federal marginal income tax rates and do not reflect the impact of state and local taxes. Actual after-tax returns depend on an investor’s tax situation and may differ from those shown. After-tax returns shown are not relevant to investors who hold their Fund shares through tax-deferred arrangements, such as 401(k) plans or individual retirement accounts.

Performance Table One Class of after Tax Shown [Text] Actual after-tax returns depend on an investor’s tax situation and may differ from those shown.
Index No Deduction for Fees, Expenses, or Taxes [Text] reflects no deduction for fees, expenses, or taxes
Performance Availability Website Address [Text] www.tradretfs.com
Performance Availability Phone [Text] 1-888-528-7237
Third Prospectus | Tradr 1.5X Short NVDA Daily ETF  
Prospectus [Line Items]  
Bar Chart and Performance Table [Heading] Performance
Performance Narrative [Text Block]

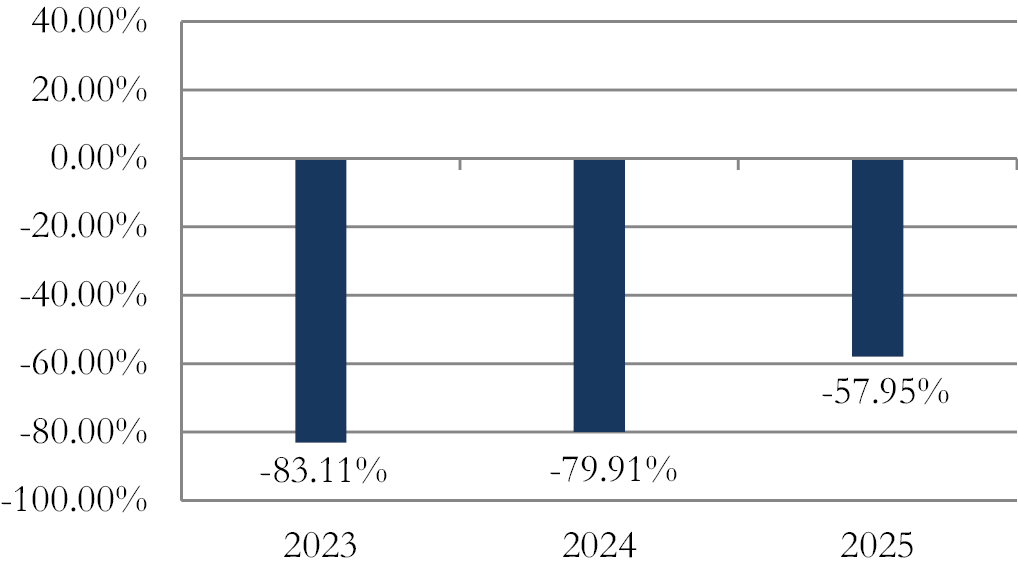
The bar chart and table below provide some indication of the risks of investing in the Fund by showing changes in the Fund’s performance from year to year and by showing how the average annual total returns of the Fund compare with the average annual total returns of the S&P 500 Index, a broad-based securities market index. The S&P 500 Index has been included as the primary broad-based securities market index in order to satisfy regulatory requirements. Updated performance information is available at the Fund’s website, www.tradretfs.com, or by calling the Fund collect at 1-888-528-7237. The Fund’s past performance, before and after taxes, is not necessarily an indication of how the Fund will perform in the future.

Performance Past Does Not Indicate Future [Text] The Fund’s past performance, before and after taxes, is not necessarily an indication of how the Fund will perform in the future.
Performance Information Illustrates Variability of Returns [Text] The bar chart and table below provide some indication of the risks of investing in the Fund by showing changes in the Fund’s performance from year to year and by showing how the average annual total returns of the Fund compare with the average annual total returns of the S&P 500 Index, a broad-based securities market index.
Bar Chart [Heading] Calendar-Year Total Return (before taxes) For each calendar year at net asset value per share (“NAV”)
Bar Chart [Table]

Bar Chart Closing [Text Block]

The year-to-date return as of June 30, 2026, was (18.69)%.

Highest Calendar Quarter Return at NAV

15.86%

Quarter Ended 03/31/2025

Lowest Calendar Quarter Return at NAV

(59.37)%

Quarter Ended 03/31/2023

Year to Date Return, Label [Optional Text] year-to-date return
Bar Chart, Year to Date Return (18.69%)
Bar Chart, Year to Date Return, Date Jun. 30, 2026
Highest Quarterly Return, Label [Optional Text] Highest Calendar Quarter Return at NAV
Highest Quarterly Return 15.86%
Highest Quarterly Return, Date Mar. 31, 2025
Lowest Quarterly Return, Label [Optional Text] Lowest Calendar Quarter Return at NAV
Lowest Quarterly Return (59.37%)
Lowest Quarterly Return, Date Mar. 31, 2023
Performance Table Heading Average Annual Total Returns (for periods ended December 31, 2025)
Performance Table Uses Highest Federal Rate After-tax returns are calculated using the historical highest individual federal marginal income tax rates and do not reflect the impact of state and local taxes.
Performance Table Not Relevant to Tax Deferred After-tax returns shown are not relevant to investors who hold their Fund shares through tax-deferred arrangements, such as 401(k) plans or individual retirement accounts.
Performance [Table]

Average Annual Total Returns
(for periods ended December 31, 2025)


One Year

Since
Inception
(7/13/2022)


Return Before Taxes

(57.95)%

(72.14)%


Return After Taxes on Distributions1

(60.12)%

(73.57)%


Return After Taxes on Distributions and Sale of Fund Shares1

(34.33)%

(32.56)%


S&P 500 Index (reflects no deduction for fees, expenses, or taxes)

17.88%

20.24%


1       After-tax returns are calculated using the historical highest individual federal marginal income tax rates and do not reflect the impact of state and local taxes. Actual after-tax returns depend on an investor’s tax situation and may differ from those shown. After-tax returns shown are not relevant to investors who hold their Fund shares through tax-deferred arrangements, such as 401(k) plans or individual retirement accounts.

Performance Table One Class of after Tax Shown [Text] Actual after-tax returns depend on an investor’s tax situation and may differ from those shown.
Index No Deduction for Fees, Expenses, or Taxes [Text] reflects no deduction for fees, expenses, or taxes
Performance Availability Website Address [Text] www.tradretfs.com
Performance Availability Phone [Text] 1-888-528-7237
Third Prospectus | Tradr 1X Short Innovation Daily ETF  
Prospectus [Line Items]  
Bar Chart and Performance Table [Heading] Performance
Performance Narrative [Text Block]

The Fund adopted the performance of the Tuttle Capital Innovation ETF, a series of Collaborative Investment Series Trust (the “Predecessor Fund”), following the reorganization of the Predecessor Fund into the Fund, which occurred on August 5, 2022. The Predecessor Fund had substantially similar investment objective, strategies and policies, portfolio management team and contractual arrangements, including the same contractual fees and expenses, as the Fund as of the date of the reorganization. The Fund is the accounting successor of the Predecessor Fund. Performance results shown in the bar chart and the performance table below for the periods prior to the reorganization reflect the performance of the Predecessor Fund prior to commencement of the Fund’s operations. Also, prior to April 7, 2025, the Fund was known as the Tradr 2X Short Innovation Daily ETF, and it sought investment results corresponding to -2X the results of the ARK Innovation ETF for a single trading day (and not for any other time period).

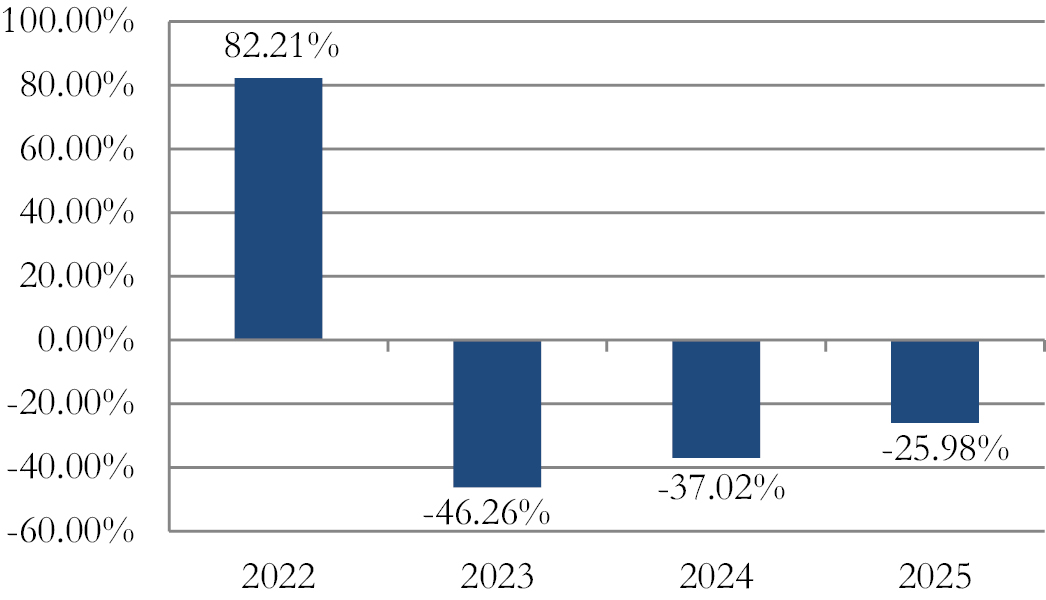
The bar chart and table below provide some indication of the risks of investing in the Fund by showing changes in the Fund’s performance from year to year and by showing how the average annual total returns of the Fund compare with the average annual total returns of the S&P 500 Index, a broad-based securities market index, and the ARK Innovation ETF Index. The S&P 500 Index is a widely recognized capitalization-weighted index that measures the performance of the large-capitalization sector of the U.S. stock market. The Fund also compares its performance with the returns of the ARK Innovation ETF Index, which the Advisor believes is a better performance benchmark for comparison to the Fund’s performance in light of the Fund’s investment strategy. The bar chart shows the performance of the Fund’s shares. The Fund’s past performance, before and after taxes, is not necessarily an indication of how the Fund will perform in the future. Updated performance information is available at the Fund’s website, www.tradretfs.com or by calling the Fund collect at 1-888-528-7237.
Performance Past Does Not Indicate Future [Text] The Fund’s past performance, before and after taxes, is not necessarily an indication of how the Fund will perform in the future.
Performance Information Illustrates Variability of Returns [Text] The bar chart and table below provide some indication of the risks of investing in the Fund by showing changes in the Fund’s performance from year to year and by showing how the average annual total returns of the Fund compare with the average annual total returns of the S&P 500 Index, a broad-based securities market index, and the ARK Innovation ETF Index.
Bar Chart [Heading] Calendar-Year Total Return (before taxes) For each calendar year at net asset value per share (“NAV”)
Bar Chart [Table]

Bar Chart Closing [Text Block]

The year-to-date total return for the Fund as of June 30, 2026, was (10.79)%.

Highest Calendar Quarter Return at NAV

39.35%

Quarter ended 06/30/2022

Lowest Calendar Quarter Return at NAV

(37.12)%

Quarter ended 12/31/2024

Year to Date Return, Label [Optional Text] year-to-date total return
Bar Chart, Year to Date Return (10.79%)
Bar Chart, Year to Date Return, Date Jun. 30, 2026
Highest Quarterly Return, Label [Optional Text] Highest Calendar Quarter Return at NAV
Highest Quarterly Return 39.35%
Highest Quarterly Return, Date Jun. 30, 2022
Lowest Quarterly Return, Label [Optional Text] Lowest Calendar Quarter Return at NAV
Lowest Quarterly Return (37.12%)
Lowest Quarterly Return, Date Dec. 31, 2024
Performance Table Heading Average Annual Total Returns (for period ended December 31, 2025)
Performance Table Uses Highest Federal Rate After-tax returns are calculated using the historical highest individual federal marginal income tax rates and do not reflect the impact of state and local taxes.
Performance Table Not Relevant to Tax Deferred After-tax returns shown are not relevant to investors who hold their Fund shares through tax-deferred arrangements, such as 401(k) plans or individual retirement accounts.
Performance [Table]

Average Annual Total Returns
(for period ended December 31, 2025)


One Year

Since
Inception
(11/5/2021)


Return Before Taxes

(25.98)%

(12.85)%


Return After Taxes on Distributions1

(26.85)%

(16.99)%


Return After Taxes on Distributions and Sale of Fund Shares1

(15.40)%

(8.67)%


S&P 500 Index (reflects no deduction for fees, expenses or taxes)

17.88%

11.13%


ARK Innovation ETF Index (reflects no deduction for fees, expenses or taxes)

35.49%

(10.56)%


1            After-tax returns are calculated using the historical highest individual federal marginal income tax rates and do not reflect the impact of state and local taxes. Actual after-tax returns depend on an investor’s tax situation and may differ from those shown. After-tax returns shown are not relevant to investors who hold their Fund shares through tax-deferred arrangements, such as 401(k) plans or individual retirement accounts.

Performance Table One Class of after Tax Shown [Text] Actual after-tax returns depend on an investor’s tax situation and may differ from those shown.
Index No Deduction for Fees, Expenses, or Taxes [Text] reflects no deduction for fees, expenses or taxes
Performance Availability Website Address [Text] www.tradretfs.com
Performance Availability Phone [Text] 1-888-528-7237