All Operating Sites fcx.com FCX Conference Call 2nd Quarter 2026 Results July 23, 2026
Cautionary Statement 2 This presentation contains forward-looking statements in which FCX discusses its potential future performance, operations and projects. Forward-looking statements are all statements other than statements of historical facts, such as plans, projections or expectations relating to business outlook, strategy, goals or targets; restoration and remediation efforts, and phased restart and ramp-up of production and downstream processing following the September 2025 external mud rush incident at PT Freeport Indonesia’s (PTFI) Grasberg Block Cave (GBC) underground mine and the anticipated impact on FCX’s bus iness, production, sales, results of operations and operating plans; global market conditions, including trade policies; ore grades and milling rates; production and sales volumes; higher variability between PTFI production and sales; unit net cash costs (credits) and operating costs; capital expenditures; operating plans, including mine sequencing; cash flows; liquidity; the life of resource extension of operating rights in the Grasberg minerals district, including the extension of PTFI’s special mining business license (IUPK) beyond 2041; timing of shipments of inventoried production; FCX’s sustainability- related commitments, aspirations and targets; FCX’s overarching commitment to deliver responsibly produced copper and molybdenum, including plans to implement, validate and maintain validation of its operating sites under specific frameworks; achievement of FCX’s 2030 climate targets and its 2050 net zero aspiration; improvements in operating procedures and technology innovations and applications; exploration efforts and results; development and production activities, rates and costs; future organic growth opportunities and investment decisions; tax rates; the impact of copper, gold and molybdenum price changes; the impact of deferred intercompany profits on earnings; mineral reserve and mineral resource estimates; final resolution of settlements associated with ongoing legal and environmental proceedings; debt repurchases; and the ongoing implementation of FCX’s financial policy and future returns to common stockholders, including dividend payments (base or variable) and share repurchases. The words “anticipates,” “may,” “can,” “plans,” “believes,” “estimates,” “expects,” “projects,” “targets,” “intends,” “likely,” “will,” “should,” “could,” “to be,” “potential,” “assumptions,” “guidance,” “aspirations,” “future,” “commitments,” “pursues,” “initiatives,” “objectives,” “opportunities,” “strategy” and any similar expressions are intended to identify those assertions as forward-looking statements. The declaration and payment of dividends (base or variable), and timing and amount of any share repurchases are at the discretion of the Board of Directors (Board) and management, respectively, and are subject to a number of factors, including not exceeding FCX’s net debt target, capital availability, FCX’s financial results, cash requirements, global economic conditions, changes in laws, contractual restrictions and other factors deemed relevant by the Board or management, as applicable. The share repurchase program may be modified, increased, suspended or terminated at any time at the Board’s discretion. FCX cautions readers that forward-looking statements are not guarantees of future performance and actual results may differ materially from those anticipated, expected, projected or assumed in the forward-looking statements. Important factors that can cause FCX’s actual results to differ materially from those anticipated in the forward-looking statements include, but are not limited to, supply of and demand for, and prices of the commodities FCX produces, primarily copper and gold; changes in export duties and tariff rates; production rates; timing of shipments and sales; reduced customer demand or capacity; changes in the terms of arrangements or contracts; PTFI’s ability to repair mud rush incident-related damage, implement enhanced operating procedures, safely restart with a phased ramp-up and achieve full operating rates of production and downstream processing on the expected timeline and optimize production plans; resolve force majeure declarations and maintain relationships with commercial counterparties; price and availability of consumables and components FCX purchases as well as constraints on supply and logistics, and transportation services; changes in cash requirements, financial position, financing or investment plans; changes in general market, economic, geopolitical, regulatory or industry conditions, including market volatility regarding trade policies and tariff uncertainty; reductions in liquidity and access to capital; changes in tax laws and regulations; political and social risks, including the potential effects of violence in Indonesia, civil unrest in Peru, and relations with local communities and Indigenous Peoples; operational risks inherent in mining, with higher inherent risks in underground mining; mine sequencing; changes in mine plans or operational modifications, delays, deferrals or cancellations, including the ability to smelt and refine or inventory; results of technical, economic or feasibility studies; potential inventory adjustments; potential impairment of long-lived mining assets; satisfaction of requirements in accordance with PTFI’s IUPK to extend mining rights from 2031 through 2041; delays in Indonesia government approvals or failure to obtain Indonesia government approval, including on the agreed upon terms of the Memorandum of Understanding (MOU) that FCX and PTFI entered into with the Indonesia government and relating to the amendment to the IUPK to extend PTFI’s operating rights beyond 2041; delays in consummating the terms of the MOU, including entering into any definitive agreements; cybersecurity risks; any major public health crisis; labor relations, including labor-related work stoppages and increased costs; compliance with applicable environmental, health and safety laws and regulations; weather- and climate-related risks; environmental risks, including availability of secure water supplies; impacts, expenses or results from litigation or investigations; tailings management; FCX’s ability to comply with its responsible production commitments under specific frameworks and any changes to such frameworks and other factors described in more detail under the heading “Risk Factors” in FCX’s Annual Report on Form 10-K for the year ended December 31, 2025, filed with the U.S. Securities and Exchange Commission. Investors are cautioned that many of the assumptions upon which FCX’s forward-looking statements are based are likely to change after the date the forward-looking statements are made, including for example commodity prices, which FCX cannot control, and production volumes and costs or technological solutions and innovations, some aspects of which FCX may not be able to control. Further, FCX may make changes to its business plans that could affect its results. FCX undertakes no obligation to update any forward-looking statements, which are as of the date made, notwithstanding any changes in its assumptions, changes in business plans, actual experience or other changes. Estimates of mineral reserves and mineral resources are subject to considerable uncertainty. Such estimates are, to a large extent, based on metal prices for the commodities we produce and interpretations of geologic data, which may not necessarily be indicative of future results or quantities ultimately recovered. This presentation also includes forward-looking statements regarding mineral resources not included in proven and probable mineral reserves. A mineral resource, which includes measured, indicated and inferred mineral resources, is a concentration or occurrence of material of economic interest in or on the Earth’s crust in such form, grade or quality, and quantity that there are reasonable prospects for economic extraction. Such a deposit cannot qualify as recoverable proven and probable mineral reserves until legal and economic feasibility are confirmed based upon a comprehensive evaluation of development and operating costs, grades, recoveries and other material modifying factors. This presentation also includes forward-looking statements regarding mineral potential, which includes exploration targets and mineral resources but will not qualify as mineral reserves until comprehensive engineering studies establish legal and economic feasibility. Significant additional evaluation is required and no assurance can be given that the potential quantities of metal will be produced. Accordingly, no assurance can be given that estimated mineral resources or mineral potential will become proven and probable mineral reserves. This presentation also contains measures such as unit net cash costs (credits) per pound of copper and molybdenum, net debt and Adjusted EBITDA (earnings before interest, taxes, depreciation, amortization and accretion), which are not recognized under U.S. generally accepted accounting principles (GAAP). FCX’s calculation and reconciliation of unit net cash costs (credits) per pound of copper and molybdenum and net debt to amounts reported in FCX’s consolidated financial statements are in the supplemental schedules of FCX’s 2Q26 press release, which is available on FCX’s website, fcx.com. A reconciliation of amounts reported in FCX’s consolidated financial statements to Adjusted EBITDA is included on slide 28. For forward-looking unit net cash costs (credits) per pound of copper and molybdenum measures, FCX is unable to provide a reconciliation to the most comparable GAAP measure without unreasonable effort because estimating such GAAP measures and providing a meaningful reconciliation is extremely difficult and requires a level of precision that is unavailable for these future periods, and the information needed to reconcile these measures is dependent upon future events, many of which are outside of FCX’s control as described above. Forward-looking non-GAAP measures are estimated consistent with the relevant definitions and assumptions.
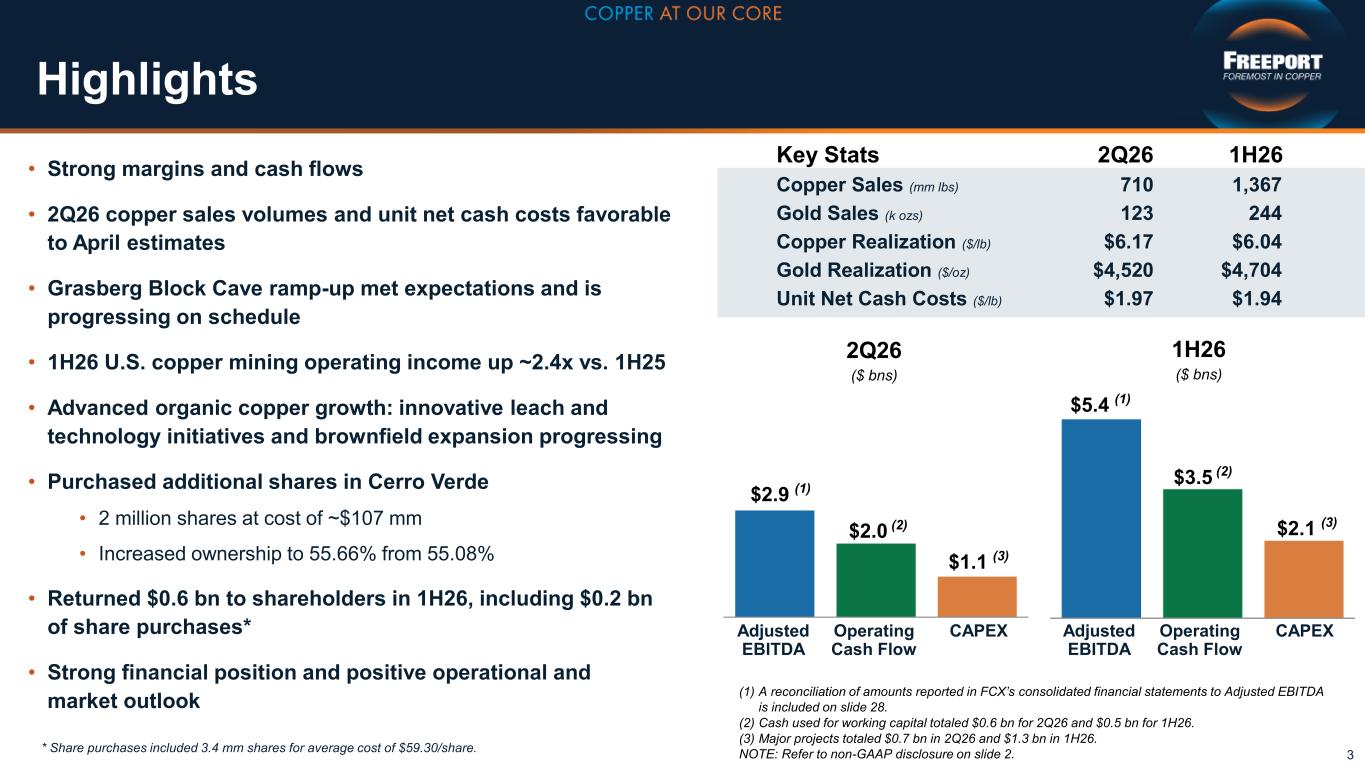
Highlights 3 • Strong margins and cash flows • 2Q26 copper sales volumes and unit net cash costs favorable to April estimates • Grasberg Block Cave ramp-up met expectations and is progressing on schedule • 1H26 U.S. copper mining operating income up ~2.4x vs. 1H25 • Advanced organic copper growth: innovative leach and technology initiatives and brownfield expansion progressing • Purchased additional shares in Cerro Verde • 2 million shares at cost of ~$107 mm • Increased ownership to 55.66% from 55.08% • Returned $0.6 bn to shareholders in 1H26, including $0.2 bn of share purchases* • Strong financial position and positive operational and market outlook Key Stats 2Q26 1H26 Copper Sales (mm lbs) 710 1,367 Gold Sales (k ozs) 123 244 Copper Realization ($/lb) $6.17 $6.04 Gold Realization ($/oz) $4,520 $4,704 Unit Net Cash Costs ($/lb) $1.97 $1.94 Operating Cash Flow CAPEX $2.1 (3) $3.5 (2) 1H26 ($ bns) (1) A reconciliation of amounts reported in FCX’s consolidated financial statements to Adjusted EBITDA is included on slide 28. (2) Cash used for working capital totaled $0.6 bn for 2Q26 and $0.5 bn for 1H26. (3) Major projects totaled $0.7 bn in 2Q26 and $1.3 bn in 1H26. NOTE: Refer to non-GAAP disclosure on slide 2. $5.4 (1) Adjusted EBITDA $1.1 (3) $2.0 (2) 2Q26 ($ bns) $2.9 (1) Operating Cash Flow CAPEXAdjusted EBITDA * Share purchases included 3.4 mm shares for average cost of $59.30/share.
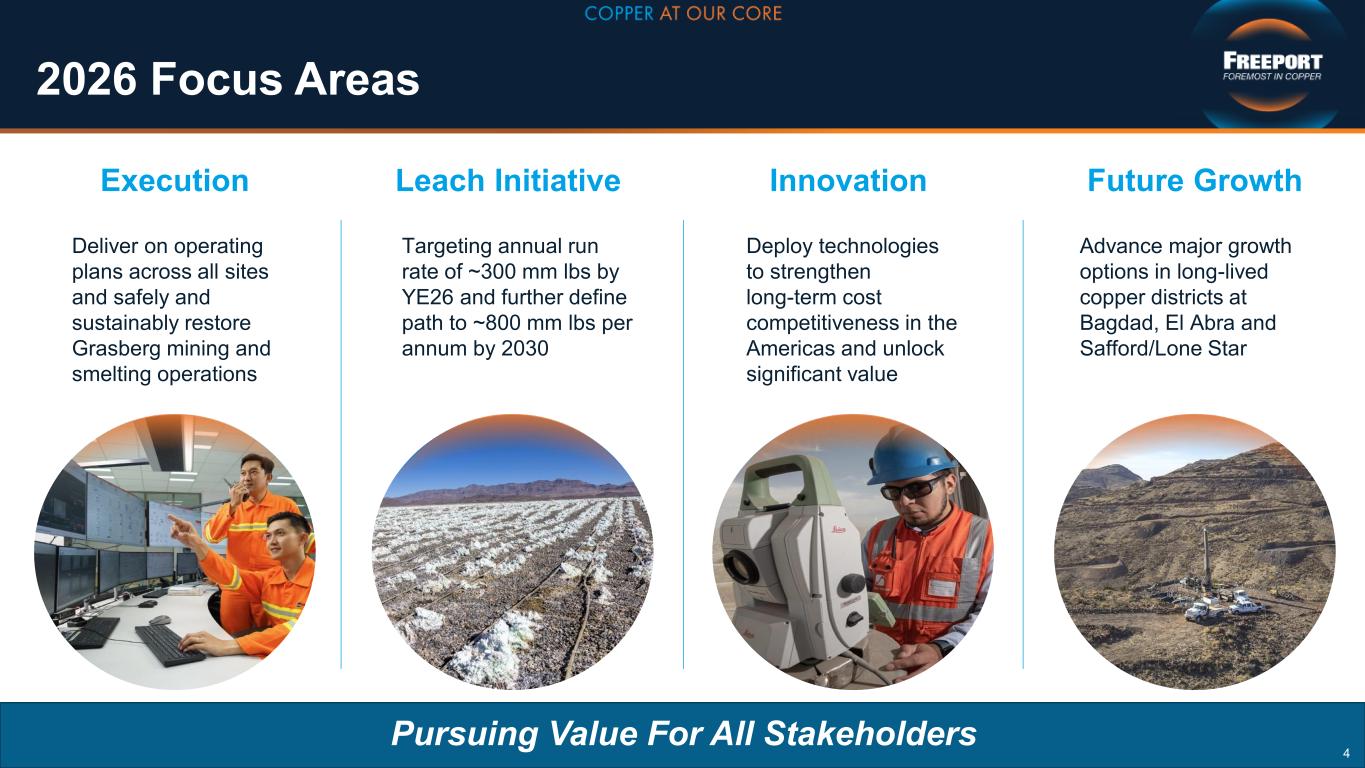
Pursuing Value For All Stakeholders 2026 Focus Areas 4 Leach Initiative Targeting annual run rate of ~300 mm lbs by YE26 and further define path to ~800 mm lbs per annum by 2030 Innovation Deploy technologies to strengthen long-term cost competitiveness in the Americas and unlock significant value Future Growth Advance major growth options in long-lived copper districts at Bagdad, El Abra and Safford/Lone Star Execution Deliver on operating plans across all sites and safely and sustainably restore Grasberg mining and smelting operations
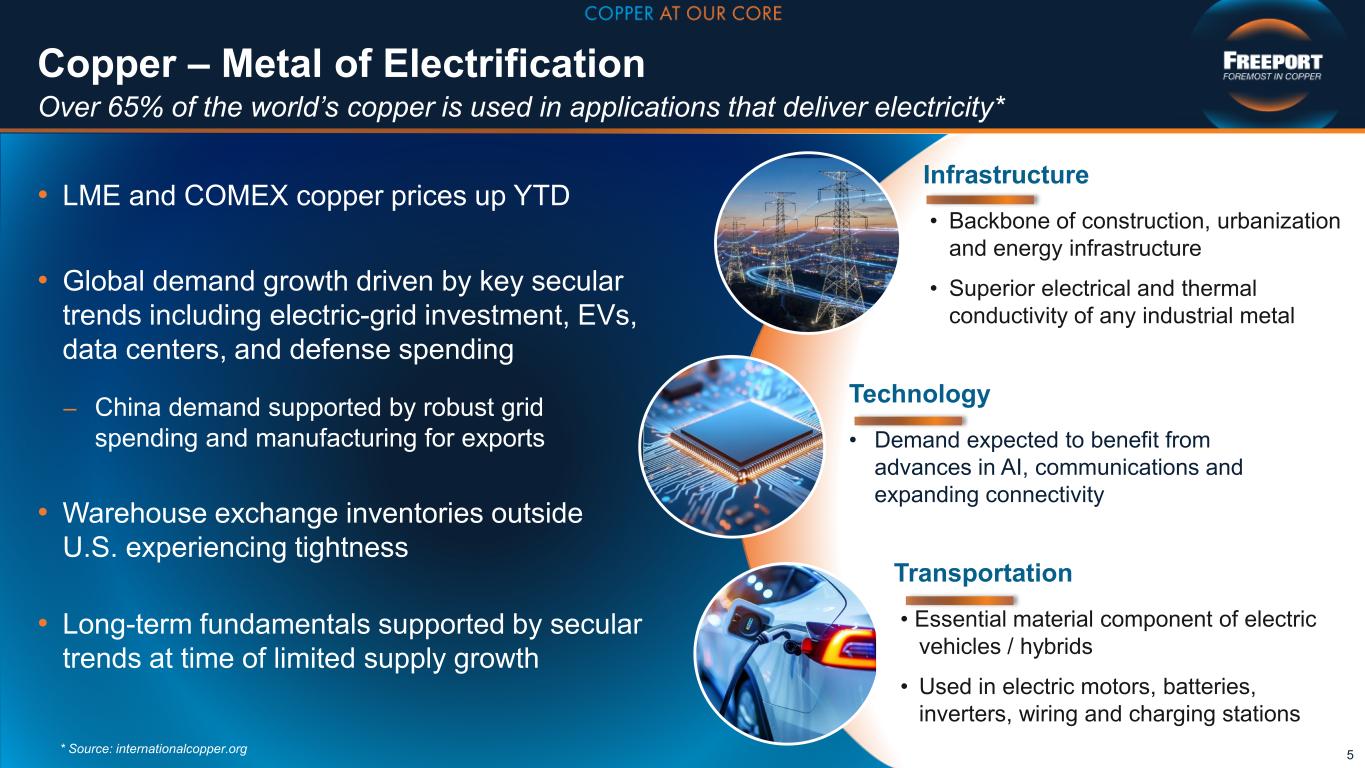
Copper – Metal of Electrification • LME and COMEX copper prices up YTD • Global demand growth driven by key secular trends including electric-grid investment, EVs, data centers, and defense spending – China demand supported by robust grid spending and manufacturing for exports • Warehouse exchange inventories outside U.S. experiencing tightness • Long-term fundamentals supported by secular trends at time of limited supply growth Over 65% of the world’s copper is used in applications that deliver electricity* 5 Technology • Demand expected to benefit from advances in AI, communications and expanding connectivity Infrastructure • Backbone of construction, urbanization and energy infrastructure • Superior electrical and thermal conductivity of any industrial metal Transportation • Essential material component of electric vehicles / hybrids • Used in electric motors, batteries, inverters, wiring and charging stations * Source: internationalcopper.org
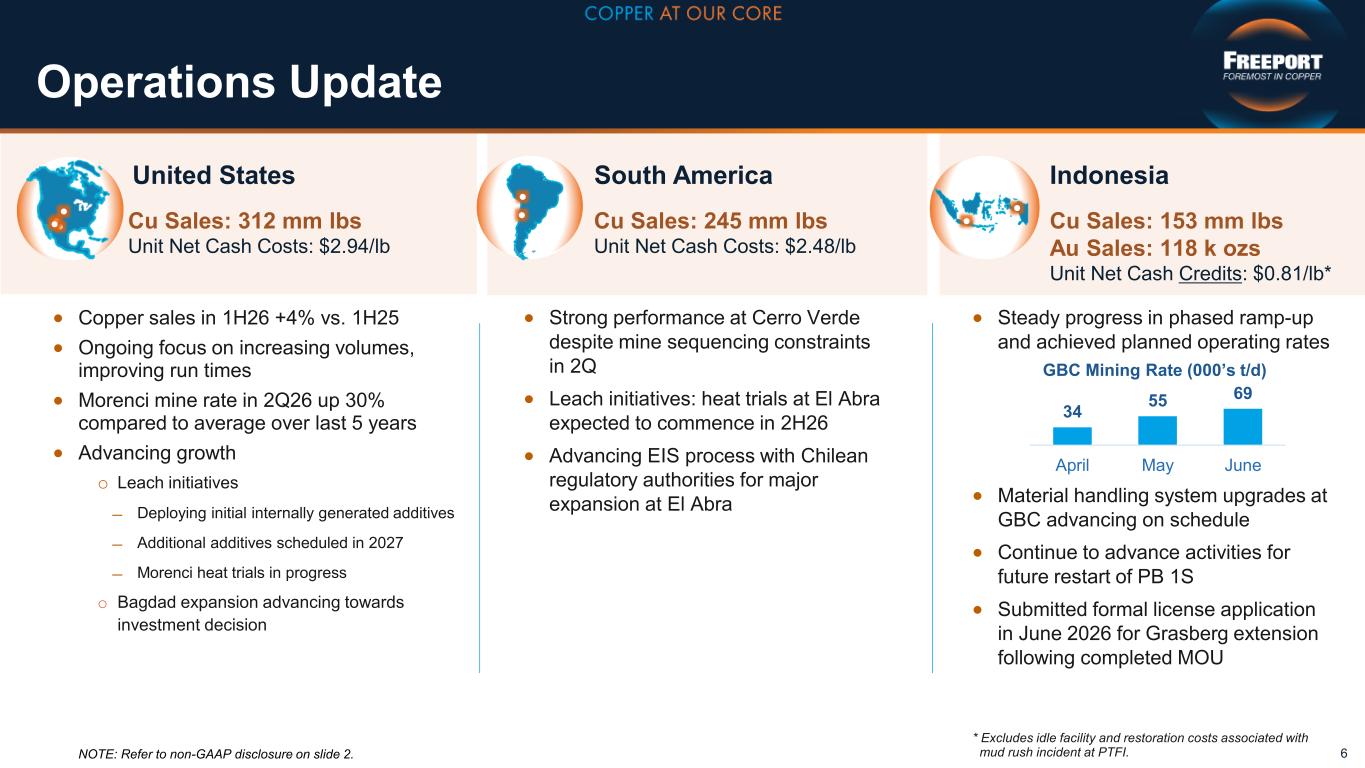
Operations Update 6 • Copper sales in 1H26 +4% vs. 1H25 • Ongoing focus on increasing volumes, improving run times • Morenci mine rate in 2Q26 up 30% compared to average over last 5 years • Advancing growth o Leach initiatives ̶ Deploying initial internally generated additives ̶ Additional additives scheduled in 2027 ̶ Morenci heat trials in progress o Bagdad expansion advancing towards investment decision • Strong performance at Cerro Verde despite mine sequencing constraints in 2Q • Leach initiatives: heat trials at El Abra expected to commence in 2H26 • Advancing EIS process with Chilean regulatory authorities for major expansion at El Abra • Steady progress in phased ramp-up and achieved planned operating rates • Material handling system upgrades at GBC advancing on schedule • Continue to advance activities for future restart of PB 1S • Submitted formal license application in June 2026 for Grasberg extension following completed MOU NOTE: Refer to non-GAAP disclosure on slide 2. United States South America Indonesia Cu Sales: 312 mm lbs Unit Net Cash Costs: $2.94/lb Cu Sales: 245 mm lbs Unit Net Cash Costs: $2.48/lb Cu Sales: 153 mm lbs Au Sales: 118 k ozs Unit Net Cash Credits: $0.81/lb* * Excludes idle facility and restoration costs associated with mud rush incident at PTFI. 34 55 69 April May June GBC Mining Rate (000’s t/d)
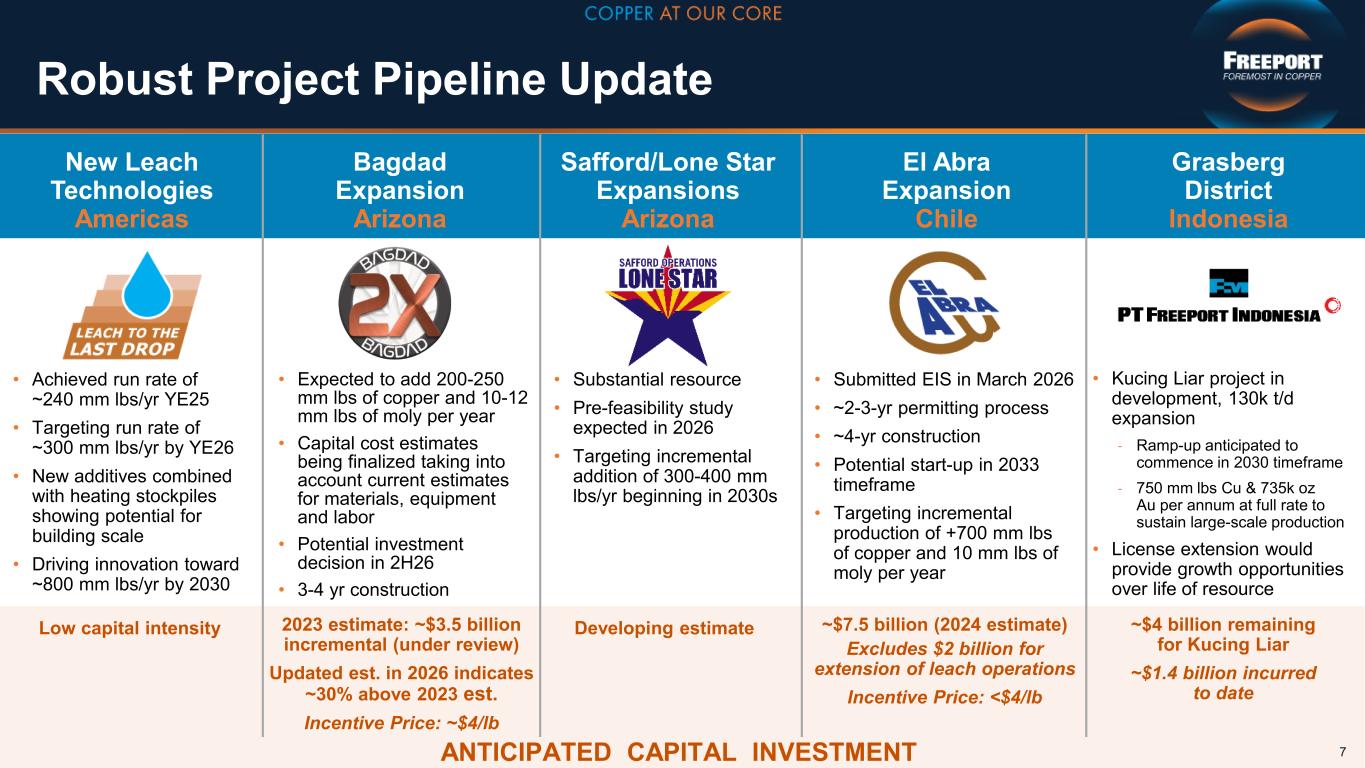
Robust Project Pipeline Update 7 El Abra Expansion Chile Safford/Lone Star Expansions Arizona Grasberg District Indonesia Bagdad Expansion Arizona New Leach Technologies Americas • Achieved run rate of ~240 mm lbs/yr YE25 • Targeting run rate of ~300 mm lbs/yr by YE26 • New additives combined with heating stockpiles showing potential for building scale • Driving innovation toward ~800 mm lbs/yr by 2030 • Expected to add 200-250 mm lbs of copper and 10-12 mm lbs of moly per year • Capital cost estimates being finalized taking into account current estimates for materials, equipment and labor • Potential investment decision in 2H26 • 3-4 yr construction • Substantial resource • Pre-feasibility study expected in 2026 • Targeting incremental addition of 300-400 mm lbs/yr beginning in 2030s • Kucing Liar project in development, 130k t/d expansion - Ramp-up anticipated to commence in 2030 timeframe - 750 mm lbs Cu & 735k oz Au per annum at full rate to sustain large-scale production • License extension would provide growth opportunities over life of resource • Submitted EIS in March 2026 • ~2-3-yr permitting process • ~4-yr construction • Potential start-up in 2033 timeframe • Targeting incremental production of +700 mm lbs of copper and 10 mm lbs of moly per year Low capital intensity 2023 estimate: ~$3.5 billion incremental (under review) Updated est. in 2026 indicates ~30% above 2023 est. Incentive Price: ~$4/lb Developing estimate ~$4 billion remaining for Kucing Liar ~$1.4 billion incurred to date ~$7.5 billion (2024 estimate) Excludes $2 billion for extension of leach operations Incentive Price: <$4/lb ANTICIPATED CAPITAL INVESTMENT
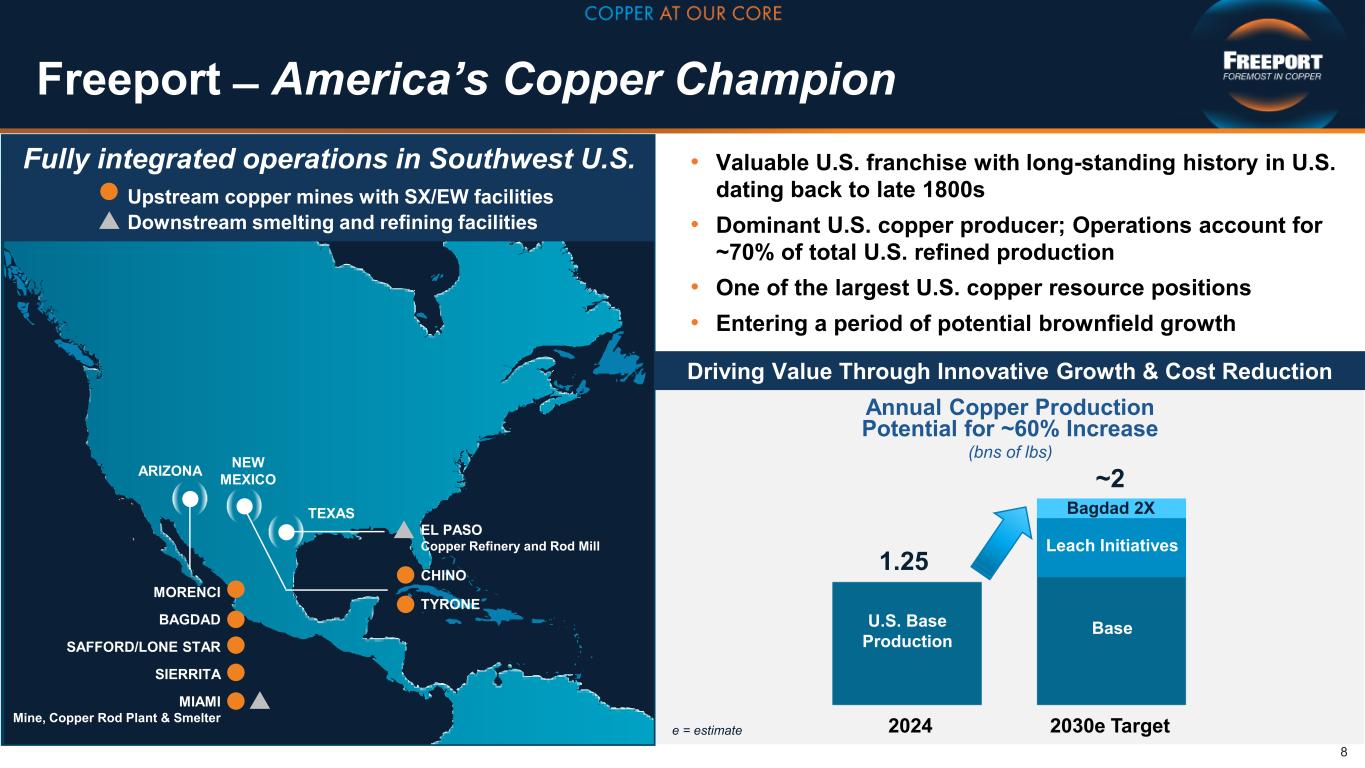
Freeport ̶ America’s Copper Champion 8 • Valuable U.S. franchise with long-standing history in U.S. dating back to late 1800s • Dominant U.S. copper producer; Operations account for ~70% of total U.S. refined production • One of the largest U.S. copper resource positions • Entering a period of potential brownfield growth Upstream copper mines with SX/EW facilities Downstream smelting and refining facilities EL PASO Copper Refinery and Rod Mill CHINO TYRONE MORENCI BAGDAD SAFFORD/LONE STAR SIERRITA MIAMI Mine, Copper Rod Plant & Smelter Fully integrated operations in Southwest U.S. ARIZONA NEW MEXICO TEXAS Driving Value Through Innovative Growth & Cost Reduction Annual Copper Production Potential for ~60% Increase (bns of lbs) ~2 1.25 U.S. Base Production Base Leach Initiatives Bagdad 2X 2024 2030e Target e = estimate
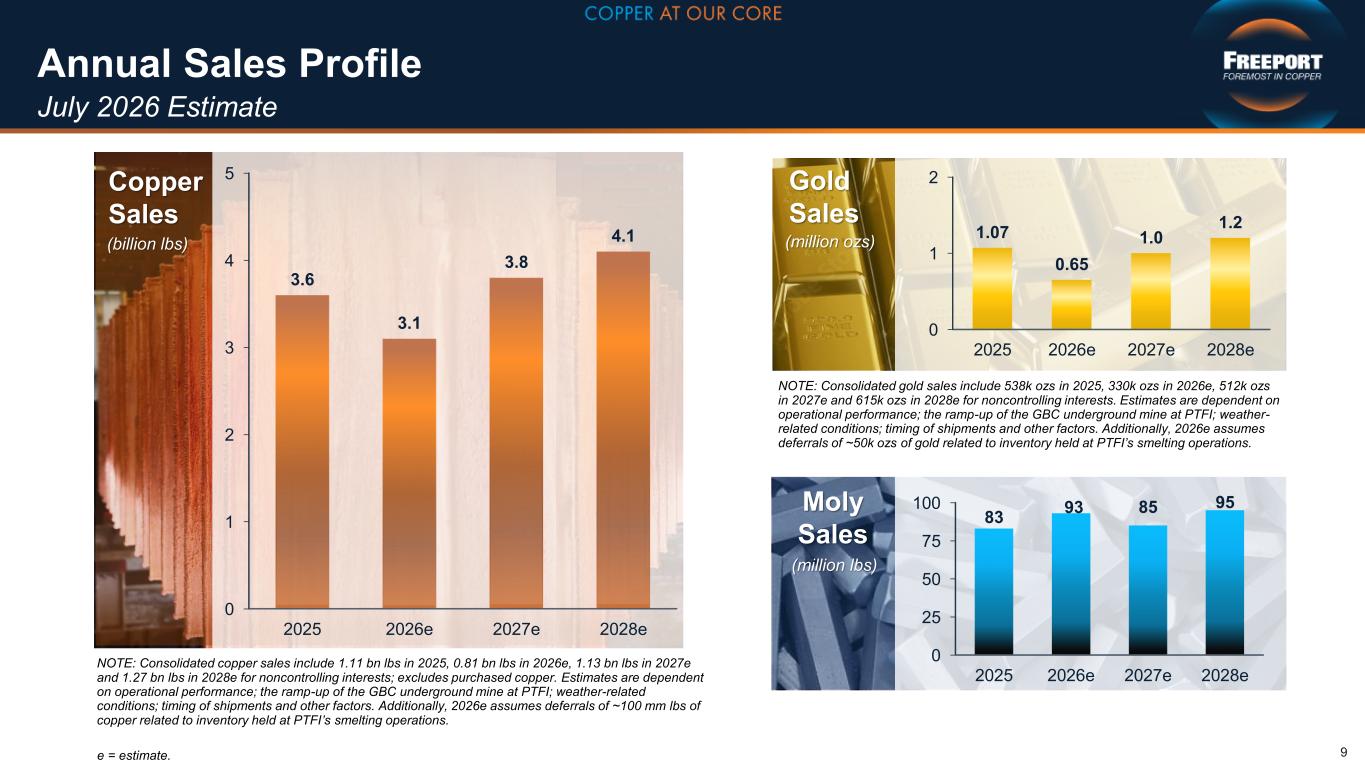
Gold Sales (million ozs)(billion lbs) Copper Sales Annual Sales Profile July 2026 Estimate 9 NOTE: Consolidated copper sales include 1.11 bn lbs in 2025, 0.81 bn lbs in 2026e, 1.13 bn lbs in 2027e and 1.27 bn lbs in 2028e for noncontrolling interests; excludes purchased copper. Estimates are dependent on operational performance; the ramp-up of the GBC underground mine at PTFI; weather-related conditions; timing of shipments and other factors. Additionally, 2026e assumes deferrals of ~100 mm lbs of copper related to inventory held at PTFI’s smelting operations. e = estimate. NOTE: Consolidated gold sales include 538k ozs in 2025, 330k ozs in 2026e, 512k ozs in 2027e and 615k ozs in 2028e for noncontrolling interests. Estimates are dependent on operational performance; the ramp-up of the GBC underground mine at PTFI; weather- related conditions; timing of shipments and other factors. Additionally, 2026e assumes deferrals of ~50k ozs of gold related to inventory held at PTFI’s smelting operations. (million lbs) Moly Sales 0 1 2 3 4 5 2025 2026e 2027e 2028e 3.6 3.1 3.8 4.1 0 25 50 75 100 2025 2026e 2027e 2028e 83 93 85 95 0 1 2 2025 2026e 2027e 2028e 1.07 0.65 1.0 1.2
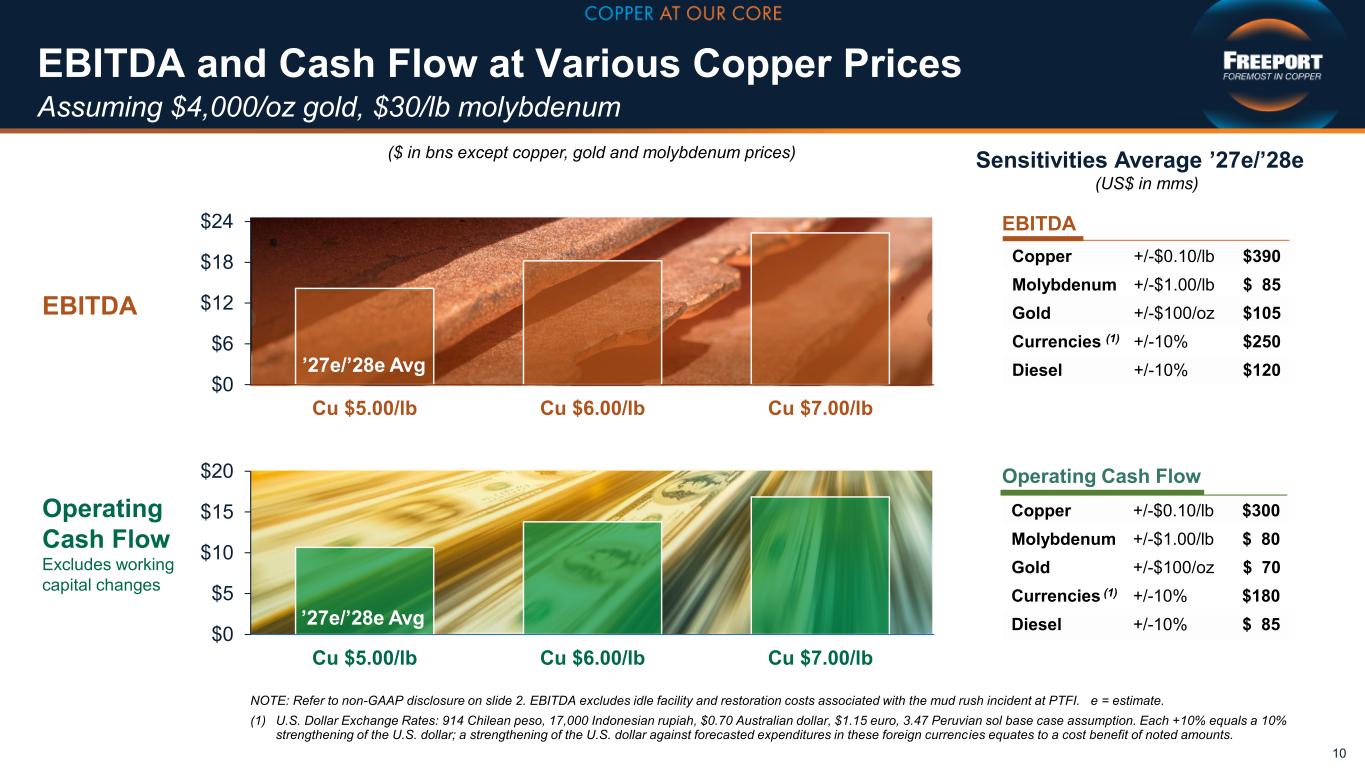
EBITDA and Cash Flow at Various Copper Prices Assuming $4,000/oz gold, $30/lb molybdenum 10 NOTE: Refer to non-GAAP disclosure on slide 2. EBITDA excludes idle facility and restoration costs associated with the mud rush incident at PTFI. e = estimate. (1) U.S. Dollar Exchange Rates: 914 Chilean peso, 17,000 Indonesian rupiah, $0.70 Australian dollar, $1.15 euro, 3.47 Peruvian sol base case assumption. Each +10% equals a 10% strengthening of the U.S. dollar; a strengthening of the U.S. dollar against forecasted expenditures in these foreign currencies equates to a cost benefit of noted amounts. ($ in bns except copper, gold and molybdenum prices) Operating Cash Flow Excludes working capital changes EBITDA Sensitivities Average ’27e/’28e (US$ in mms) EBITDA Operating Cash Flow Copper +/-$0.10/lb $300 Molybdenum +/-$1.00/lb $ 80 Gold +/-$100/oz $ 70 Currencies (1) +/-10% $180 Diesel +/-10% $ 85 Copper +/-$0.10/lb $390 Molybdenum +/-$1.00/lb $ 85 Gold +/-$100/oz $105 Currencies (1) +/-10% $250 Diesel +/-10% $120 $0 $5 $10 $15 $20 Cu $5.00/lb Cu $6.00/lb Cu $7.00/lb ’27e/’28e Avg $0 $6 $12 $18 $24 Cu $5.00/lb Cu $6.00/lb Cu $7.00/lb ’27e/’28e Avg
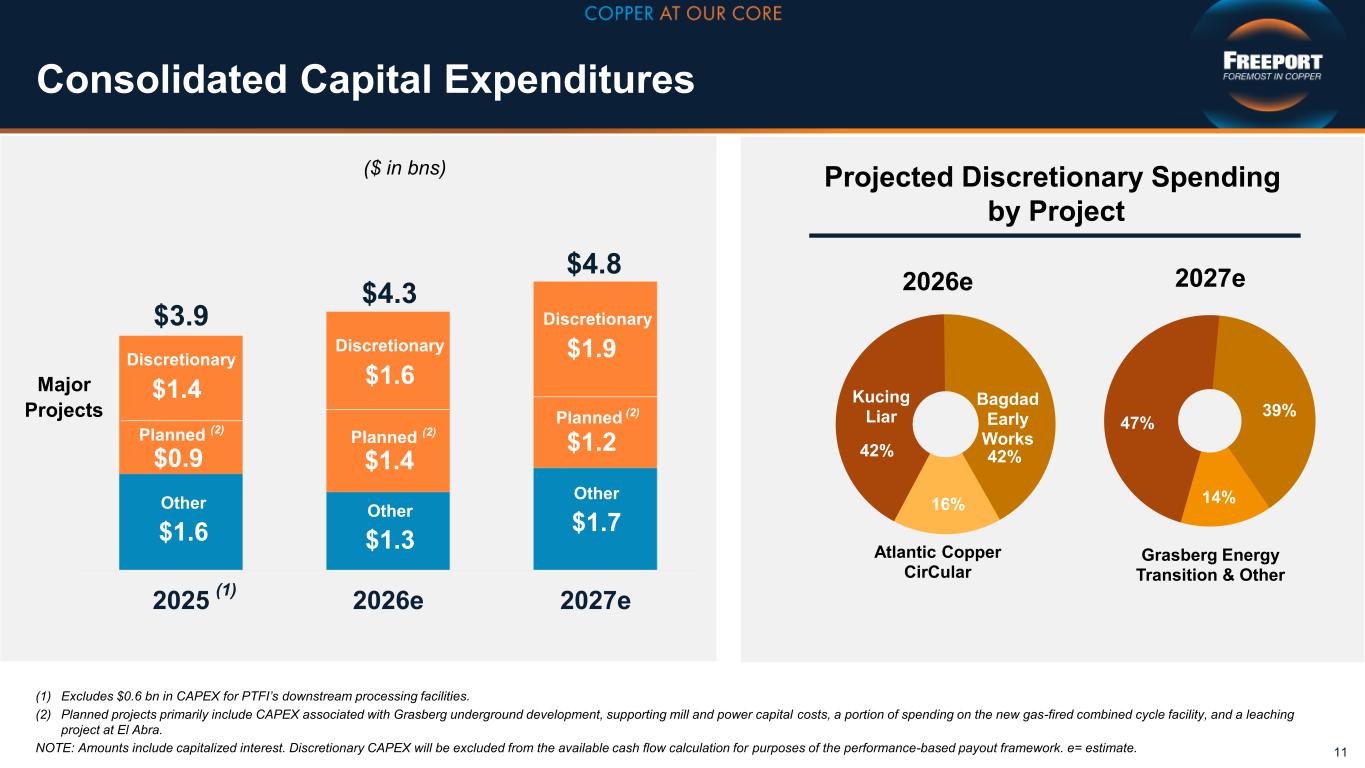
Consolidated Capital Expenditures 2025 2026e 2027e Major Projects (1) Excludes $0.6 bn in CAPEX for PTFI’s downstream processing facilities. (2) Planned projects primarily include CAPEX associated with Grasberg underground development, supporting mill and power capital costs, a portion of spending on the new gas-fired combined cycle facility, and a leaching project at El Abra. NOTE: Amounts include capitalized interest. Discretionary CAPEX will be excluded from the available cash flow calculation for purposes of the performance-based payout framework. e= estimate. $1.6 $0.9 Planned (2) Discretionary $1.4 $3.9 Other Other $1.7 Planned (2) Discretionary $4.8 Other $1.3 $1.4 $1.6 $4.3 47% 39% 14% Grasberg Energy Transition & Other Atlantic Copper CirCular 2027e Projected Discretionary Spending by Project 2026e ($ in bns) 11 42% 42% 16% (1) Planned (2) Discretionary $1.2 $1.9 Kucing Liar Bagdad Early Works
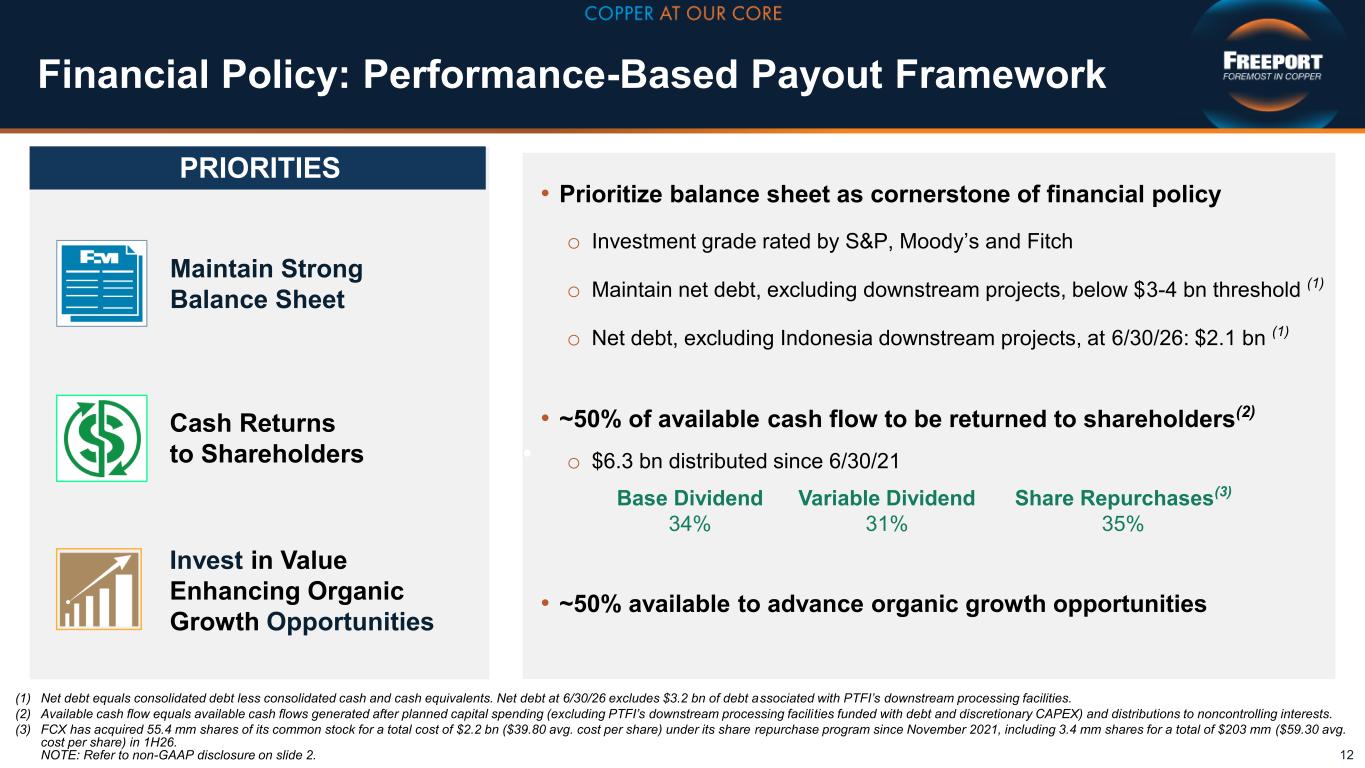
12 Cash Returns to Shareholders Invest in Value Enhancing Organic Growth Opportunities Maintain Strong Balance Sheet • Prioritize balance sheet as cornerstone of financial policy o Investment grade rated by S&P, Moody’s and Fitch o Maintain net debt, excluding downstream projects, below $3-4 bn threshold (1) o Net debt, excluding Indonesia downstream projects, at 6/30/26: $2.1 bn (1) • ~50% of available cash flow to be returned to shareholders(2) o $6.3 bn distributed since 6/30/21 • ~50% available to advance organic growth opportunities PRIORITIES Financial Policy: Performance-Based Payout Framework (1) Net debt equals consolidated debt less consolidated cash and cash equivalents. Net debt at 6/30/26 excludes $3.2 bn of debt associated with PTFI’s downstream processing facilities. (2) Available cash flow equals available cash flows generated after planned capital spending (excluding PTFI’s downstream processing facilities funded with debt and discretionary CAPEX) and distributions to noncontrolling interests. (3) FCX has acquired 55.4 mm shares of its common stock for a total cost of $2.2 bn ($39.80 avg. cost per share) under its share repurchase program since November 2021, including 3.4 mm shares for a total of $203 mm ($59.30 avg. cost per share) in 1H26. NOTE: Refer to non-GAAP disclosure on slide 2. Base Dividend 34% Variable Dividend 31% Share Repurchases(3) 35%
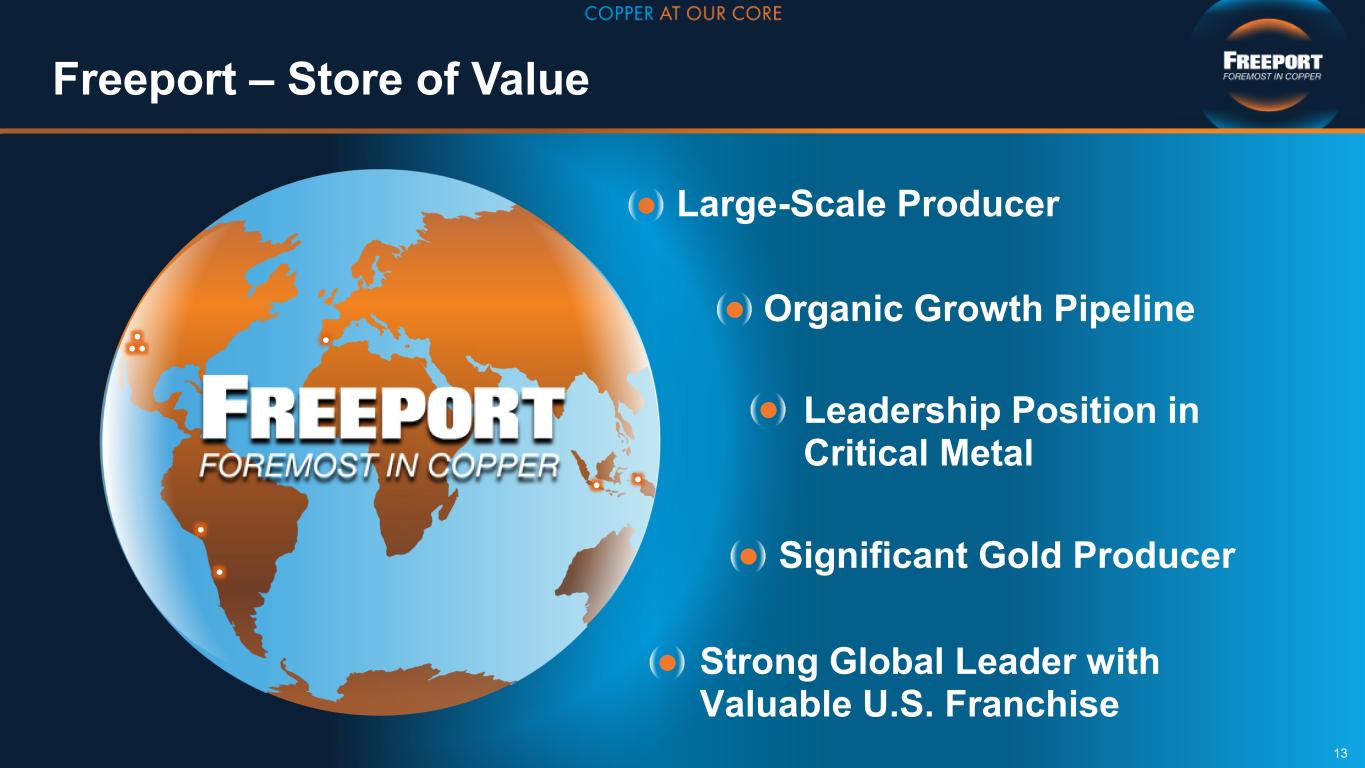
Significant Gold Producer Organic Growth Pipeline Strong Global Leader with Valuable U.S. Franchise Leadership Position in Critical Metal Large-Scale Producer Freeport – Store of Value 13

Reference Slides
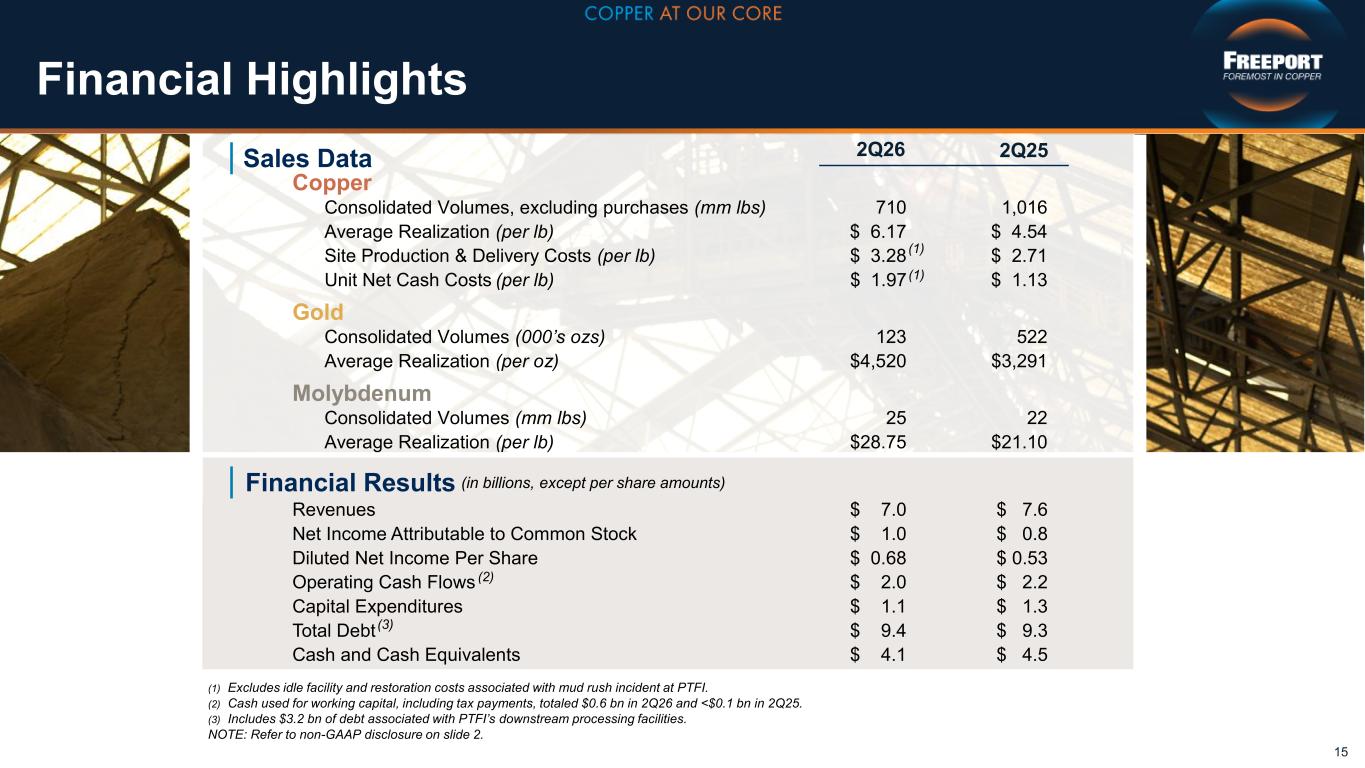
Financial Highlights 15 Copper Consolidated Volumes, excluding purchases (mm lbs) 710 1,016 Average Realization (per lb) $ 6.17 $ 4.54 Site Production & Delivery Costs (per lb) $ 3.28 $ 2.71 Unit Net Cash Costs (per lb) $ 1.97 $ 1.13 Gold Consolidated Volumes (000’s ozs) 123 522 Average Realization (per oz) $4,520 $3,291 Molybdenum Consolidated Volumes (mm lbs) 25 22 Average Realization (per lb) $28.75 $21.10 2Q26 (1) Excludes idle facility and restoration costs associated with mud rush incident at PTFI. (2) Cash used for working capital, including tax payments, totaled $0.6 bn in 2Q26 and <$0.1 bn in 2Q25. (3) Includes $3.2 bn of debt associated with PTFI’s downstream processing facilities. NOTE: Refer to non-GAAP disclosure on slide 2. Revenues $ 7.0 $ 7.6 Net Income Attributable to Common Stock $ 1.0 $ 0.8 Diluted Net Income Per Share $ 0.68 $ 0.53 Operating Cash Flows $ 2.0 $ 2.2 Capital Expenditures $ 1.1 $ 1.3 Total Debt $ 9.4 $ 9.3 Cash and Cash Equivalents $ 4.1 $ 4.5 (in billions, except per share amounts) | Sales Data | Financial Results 2Q25 (3) (1) (2) (1)
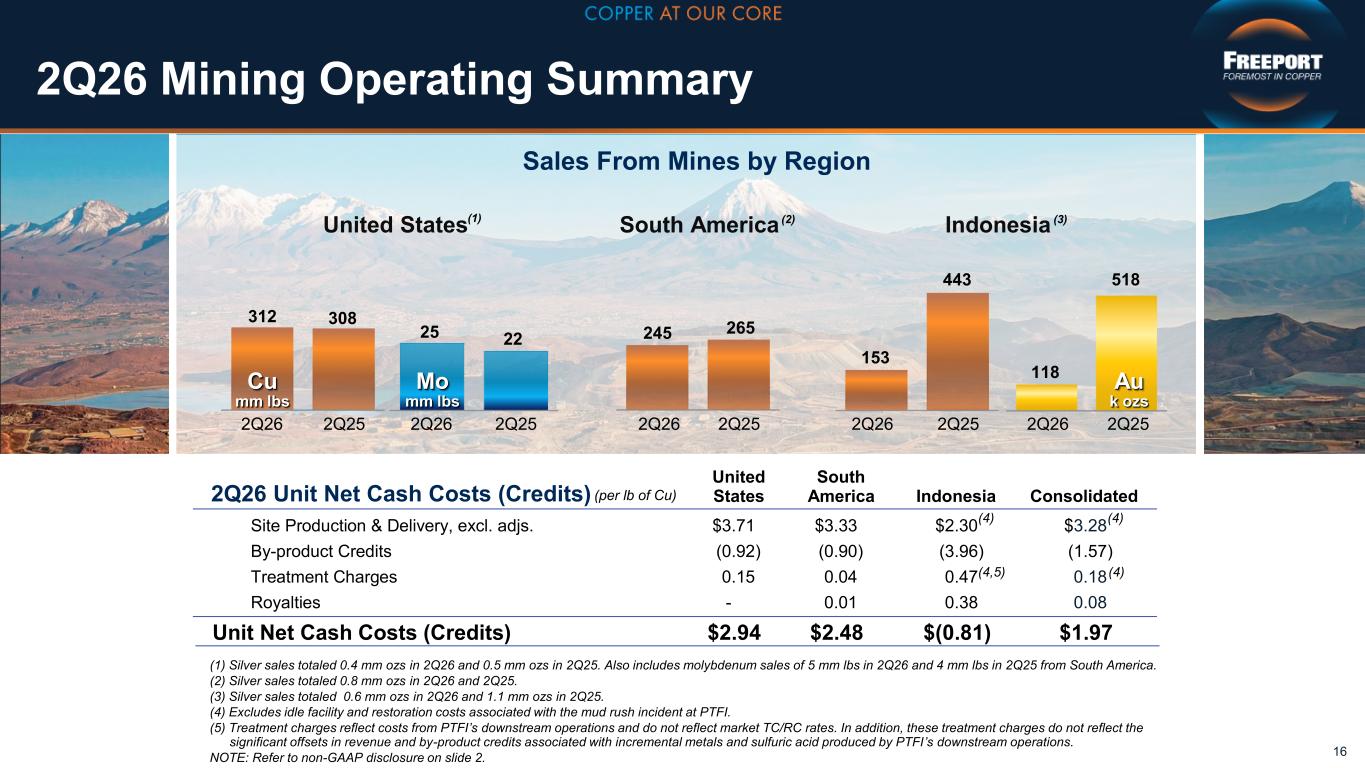
2Q26 Mining Operating Summary 16 (1) Silver sales totaled 0.4 mm ozs in 2Q26 and 0.5 mm ozs in 2Q25. Also includes molybdenum sales of 5 mm lbs in 2Q26 and 4 mm lbs in 2Q25 from South America. (2) Silver sales totaled 0.8 mm ozs in 2Q26 and 2Q25. (3) Silver sales totaled 0.6 mm ozs in 2Q26 and 1.1 mm ozs in 2Q25. (4) Excludes idle facility and restoration costs associated with the mud rush incident at PTFI. (5) Treatment charges reflect costs from PTFI’s downstream operations and do not reflect market TC/RC rates. In addition, these treatment charges do not reflect the significant offsets in revenue and by-product credits associated with incremental metals and sulfuric acid produced by PTFI’s downstream operations. NOTE: Refer to non-GAAP disclosure on slide 2. Site Production & Delivery, excl. adjs. $3.71 $3.33 $2.30 $3.28 By-product Credits (0.92) (0.90) (3.96) (1.57) Treatment Charges 0.15 0.04 0.47 0.18 Royalties - 0.01 0.38 0.08 Unit Net Cash Costs (Credits) $2.94 $2.48 $(0.81) $1.97 United South States America Indonesia Consolidated (per lb of Cu)2Q26 Unit Net Cash Costs (Credits) United States 2225 (1) 308312 2Q26 2Q25 Indonesia 443 153 518 118 South America 245 265 Sales From Mines by Region 2Q26 2Q25 2Q26 2Q25 2Q26 2Q252Q26 2Q25 (2) Au k ozs Mo mm lbs Cu mm lbs (4) (4) (3) (4,5) (4)
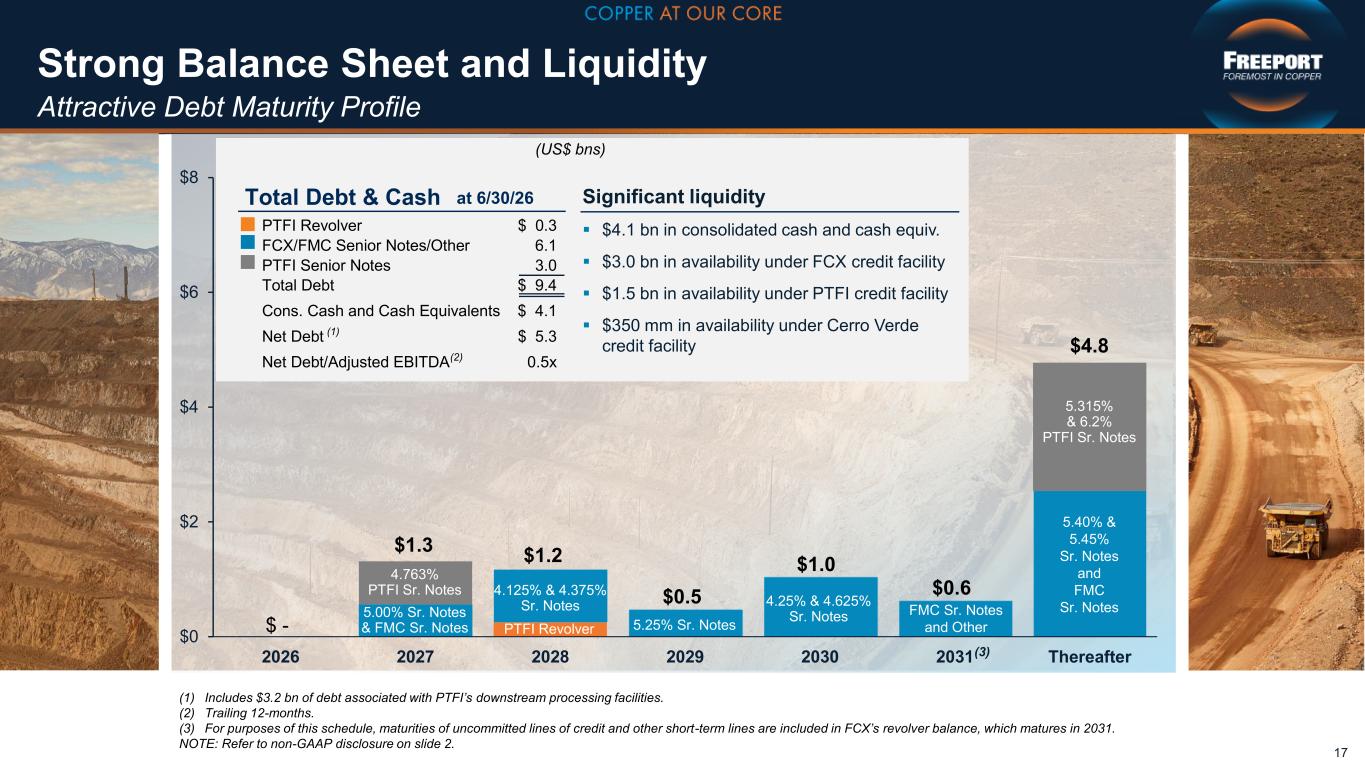
Strong Balance Sheet and Liquidity Attractive Debt Maturity Profile 17 $0 $2 $4 $6 $8 2026 2027 2028 2029 2030 2031 Thereafter (US$ bns) $4.8 5.40% & 5.45% Sr. Notes and FMC Sr. Notes PTFI Revolver $ 0.3 FCX/FMC Senior Notes/Other 6.1 PTFI Senior Notes 3.0 Total Debt $ 9.4 Cons. Cash and Cash Equivalents $ 4.1 Net Debt (1) $ 5.3 Net Debt/Adjusted EBITDA(2) 0.5x $ - at 6/30/26Total Debt & Cash $1.3 (3) 5.00% Sr. Notes & FMC Sr. Notes 4.763% PTFI Sr. Notes 5.315% & 6.2% PTFI Sr. Notes Significant liquidity ▪ $4.1 bn in consolidated cash and cash equiv. ▪ $3.0 bn in availability under FCX credit facility ▪ $1.5 bn in availability under PTFI credit facility ▪ $350 mm in availability under Cerro Verde credit facility 4.125% & 4.375% Sr. Notes $1.2 $0.5 5.25% Sr. Notes 4.25% & 4.625% Sr. Notes $1.0 PTFI Revolver (1) Includes $3.2 bn of debt associated with PTFI’s downstream processing facilities. (2) Trailing 12-months. (3) For purposes of this schedule, maturities of uncommitted lines of credit and other short-term lines are included in FCX’s revolver balance, which matures in 2031. NOTE: Refer to non-GAAP disclosure on slide 2. $0.6 FMC Sr. Notes and Other
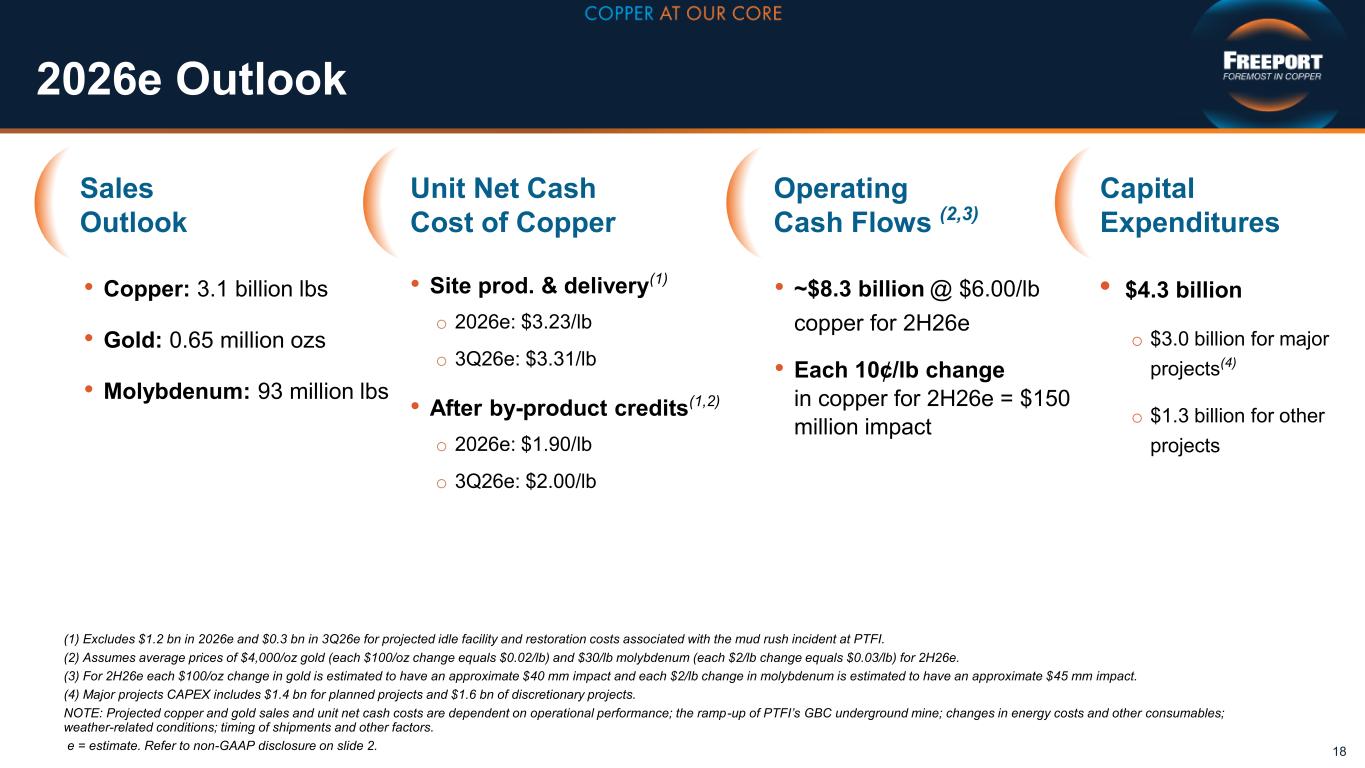
2026e Outlook 18 (1) Excludes $1.2 bn in 2026e and $0.3 bn in 3Q26e for projected idle facility and restoration costs associated with the mud rush incident at PTFI. (2) Assumes average prices of $4,000/oz gold (each $100/oz change equals $0.02/lb) and $30/lb molybdenum (each $2/lb change equals $0.03/lb) for 2H26e. (3) For 2H26e each $100/oz change in gold is estimated to have an approximate $40 mm impact and each $2/lb change in molybdenum is estimated to have an approximate $45 mm impact. (4) Major projects CAPEX includes $1.4 bn for planned projects and $1.6 bn of discretionary projects. NOTE: Projected copper and gold sales and unit net cash costs are dependent on operational performance; the ramp-up of PTFI’s GBC underground mine; changes in energy costs and other consumables; weather-related conditions; timing of shipments and other factors. e = estimate. Refer to non-GAAP disclosure on slide 2. • Copper: 3.1 billion lbs • Gold: 0.65 million ozs • Molybdenum: 93 million lbs • Site prod. & delivery(1) o 2026e: $3.23/lb o 3Q26e: $3.31/lb • After by-product credits(1,2) o 2026e: $1.90/lb o 3Q26e: $2.00/lb • $4.3 billion o $3.0 billion for major projects(4) o $1.3 billion for other projects • ~$8.3 billion @ $6.00/lb copper for 2H26e • Each 10¢/lb change in copper for 2H26e = $150 million impact Sales Outlook Unit Net Cash Cost of Copper Operating Cash Flows (2,3) Capital Expenditures
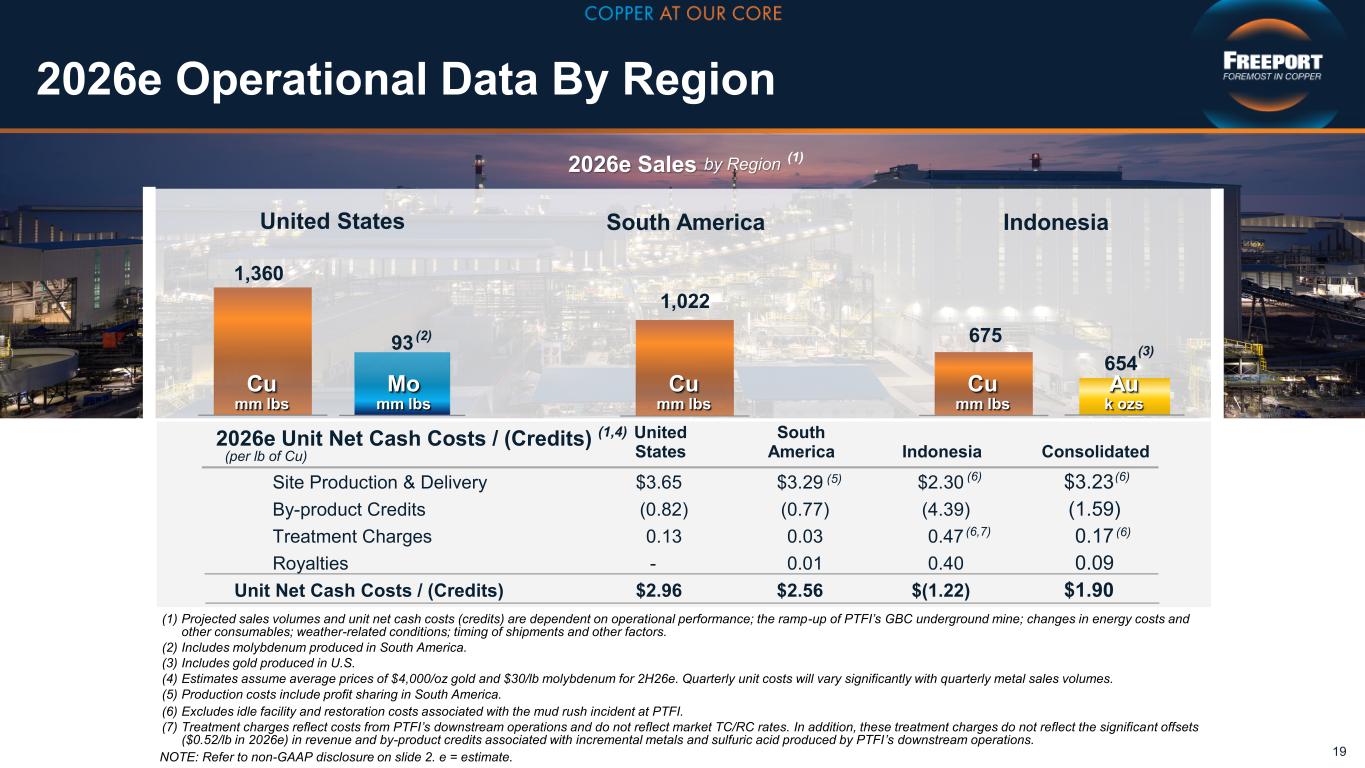
2026e Operational Data By Region 19 by Region2026e Sales (2) 1,022 93 1,360 675 654 (3) United States IndonesiaSouth America (per lb of Cu) Site Production & Delivery $3.65 $3.29 (5) $2.30 $3.23 By-product Credits (0.82) (0.77) (4.39) (1.59) Treatment Charges 0.13 0.03 0.47 0.17 Royalties - 0.01 0.40 0.09 Unit Net Cash Costs / (Credits) $2.96 $2.56 $(1.22) $1.90 2026e Unit Net Cash Costs / (Credits) (1,4) United South States America Indonesia Consolidated NOTE: Refer to non-GAAP disclosure on slide 2. e = estimate. (6,7) Au k ozs Mo mm lbs Cu mm lbs Cu mm lbs Cu mm lbs (1) Projected sales volumes and unit net cash costs (credits) are dependent on operational performance; the ramp-up of PTFI’s GBC underground mine; changes in energy costs and other consumables; weather-related conditions; timing of shipments and other factors. (2) Includes molybdenum produced in South America. (3) Includes gold produced in U.S. (4) Estimates assume average prices of $4,000/oz gold and $30/lb molybdenum for 2H26e. Quarterly unit costs will vary significantly with quarterly metal sales volumes. (5) Production costs include profit sharing in South America. (6) Excludes idle facility and restoration costs associated with the mud rush incident at PTFI. (7) Treatment charges reflect costs from PTFI’s downstream operations and do not reflect market TC/RC rates. In addition, these treatment charges do not reflect the significant offsets ($0.52/lb in 2026e) in revenue and by-product credits associated with incremental metals and sulfuric acid produced by PTFI’s downstream operations. (6) (6) (6) (1)
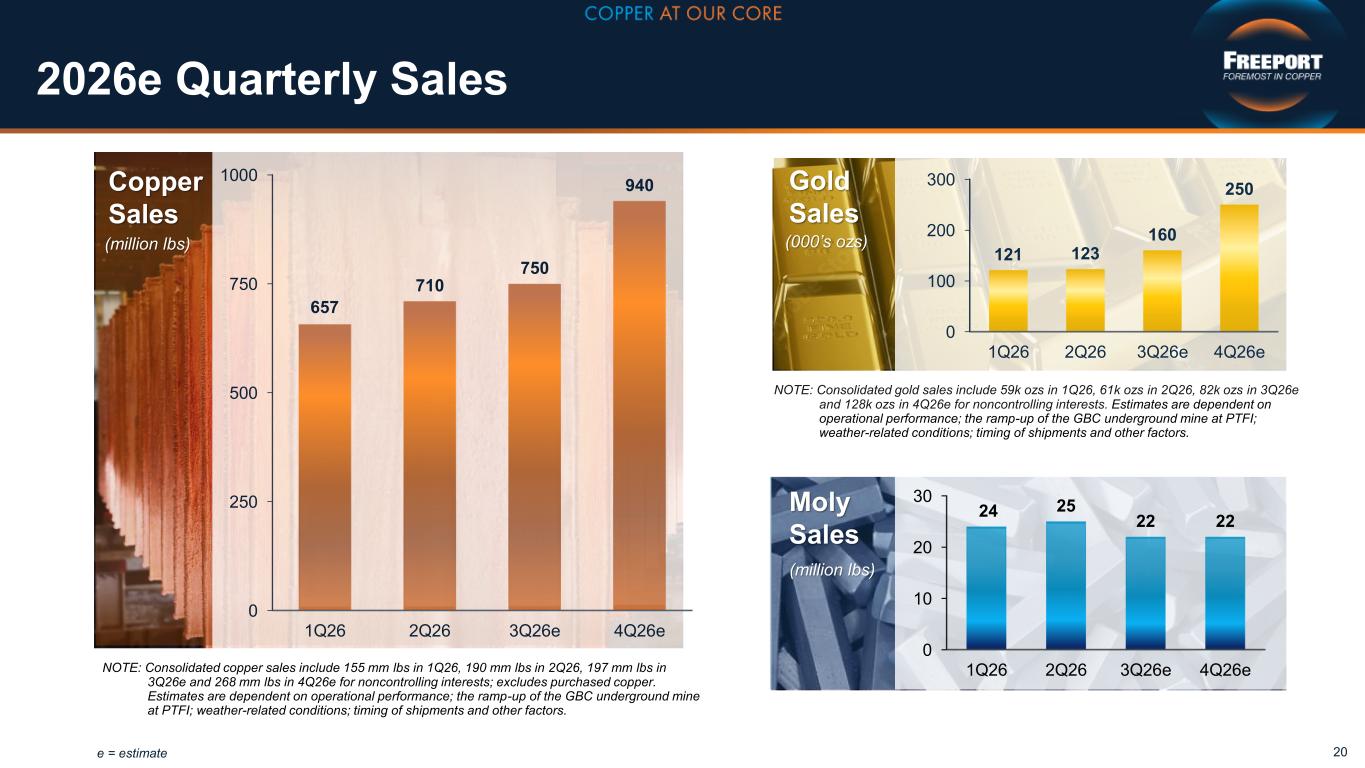
2026e Quarterly Sales 20e = estimate (million lbs) Moly Sales Gold Sales (000’s ozs) 0 100 200 300 1Q26 2Q26 3Q26e 4Q26e 121 123 160 250 0 10 20 30 1Q26 2Q26 3Q26e 4Q26e 24 25 22 22 NOTE: Consolidated copper sales include 155 mm lbs in 1Q26, 190 mm lbs in 2Q26, 197 mm lbs in 3Q26e and 268 mm lbs in 4Q26e for noncontrolling interests; excludes purchased copper. Estimates are dependent on operational performance; the ramp-up of the GBC underground mine at PTFI; weather-related conditions; timing of shipments and other factors. NOTE: Consolidated gold sales include 59k ozs in 1Q26, 61k ozs in 2Q26, 82k ozs in 3Q26e and 128k ozs in 4Q26e for noncontrolling interests. Estimates are dependent on operational performance; the ramp-up of the GBC underground mine at PTFI; weather-related conditions; timing of shipments and other factors. (million lbs) Copper Sales 0 250 500 750 1000 1Q26 2Q26 3Q26e 4Q26e 657 710 750 940
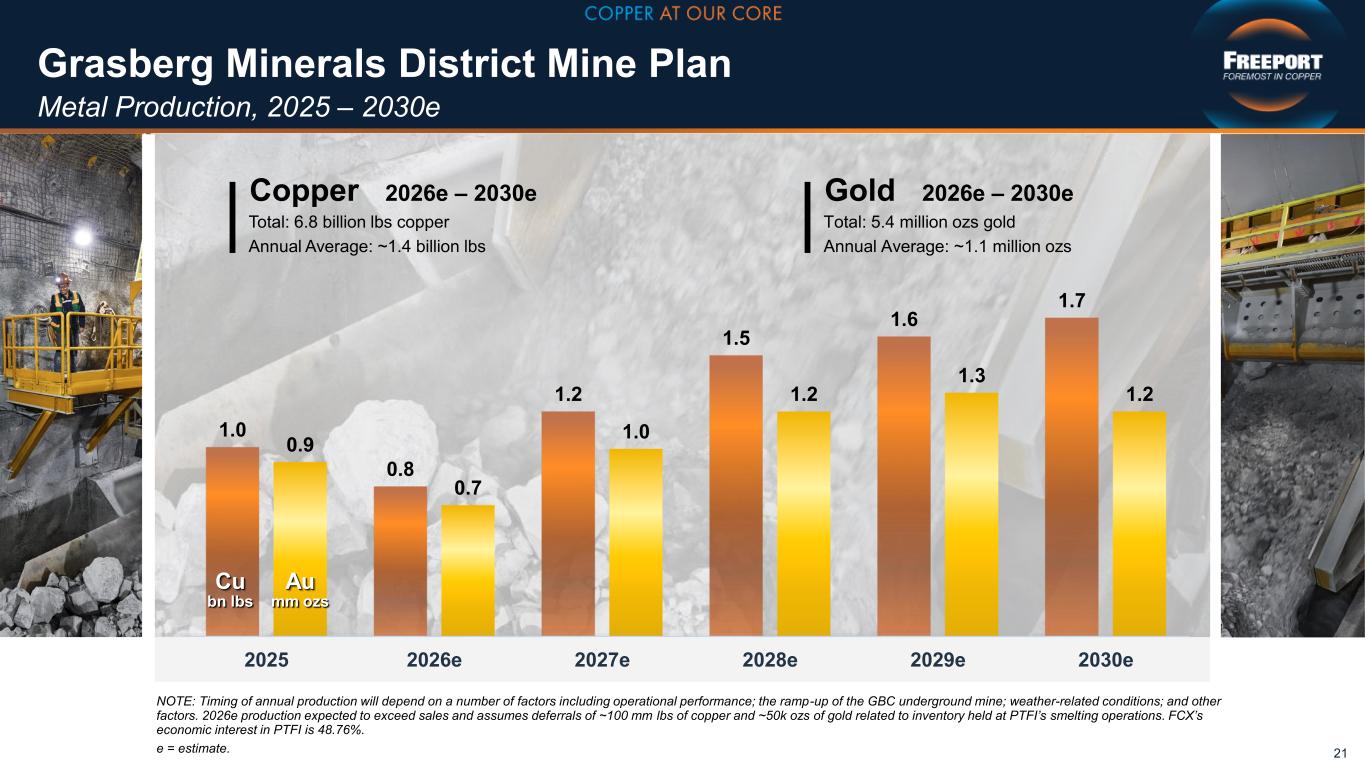
Grasberg Minerals District Mine Plan Metal Production, 2025 – 2030e 21 1.0 0.8 1.2 1.5 1.6 1.7 0.9 0.7 1.0 1.2 1.3 1.2 2025 2026e 2027e 2028e 2029e 2030e | Copper 2026e – 2030e Total: 6.8 billion lbs copper Annual Average: ~1.4 billion lbs | Gold 2026e – 2030e Total: 5.4 million ozs gold Annual Average: ~1.1 million ozs Cu bn lbs Au mm ozs NOTE: Timing of annual production will depend on a number of factors including operational performance; the ramp-up of the GBC underground mine; weather-related conditions; and other factors. 2026e production expected to exceed sales and assumes deferrals of ~100 mm lbs of copper and ~50k ozs of gold related to inventory held at PTFI’s smelting operations. FCX’s economic interest in PTFI is 48.76%. e = estimate.
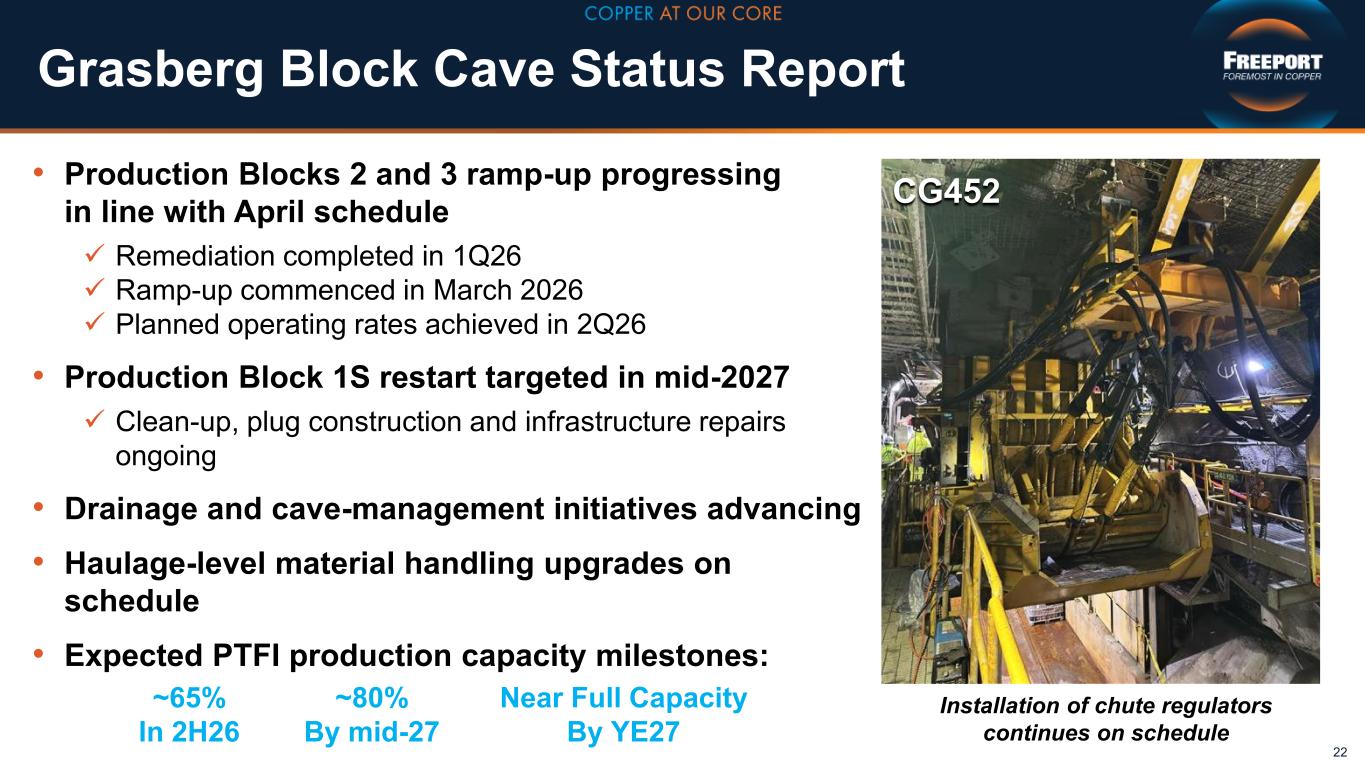
Grasberg Block Cave Status Report 22 • Production Blocks 2 and 3 ramp-up progressing in line with April schedule ✓ Remediation completed in 1Q26 ✓ Ramp-up commenced in March 2026 ✓ Planned operating rates achieved in 2Q26 • Production Block 1S restart targeted in mid-2027 ✓ Clean-up, plug construction and infrastructure repairs ongoing • Drainage and cave-management initiatives advancing • Haulage-level material handling upgrades on schedule • Expected PTFI production capacity milestones: ~65% In 2H26 ~80% By mid-27 Near Full Capacity By YE27 Installation of chute regulators continues on schedule CG452
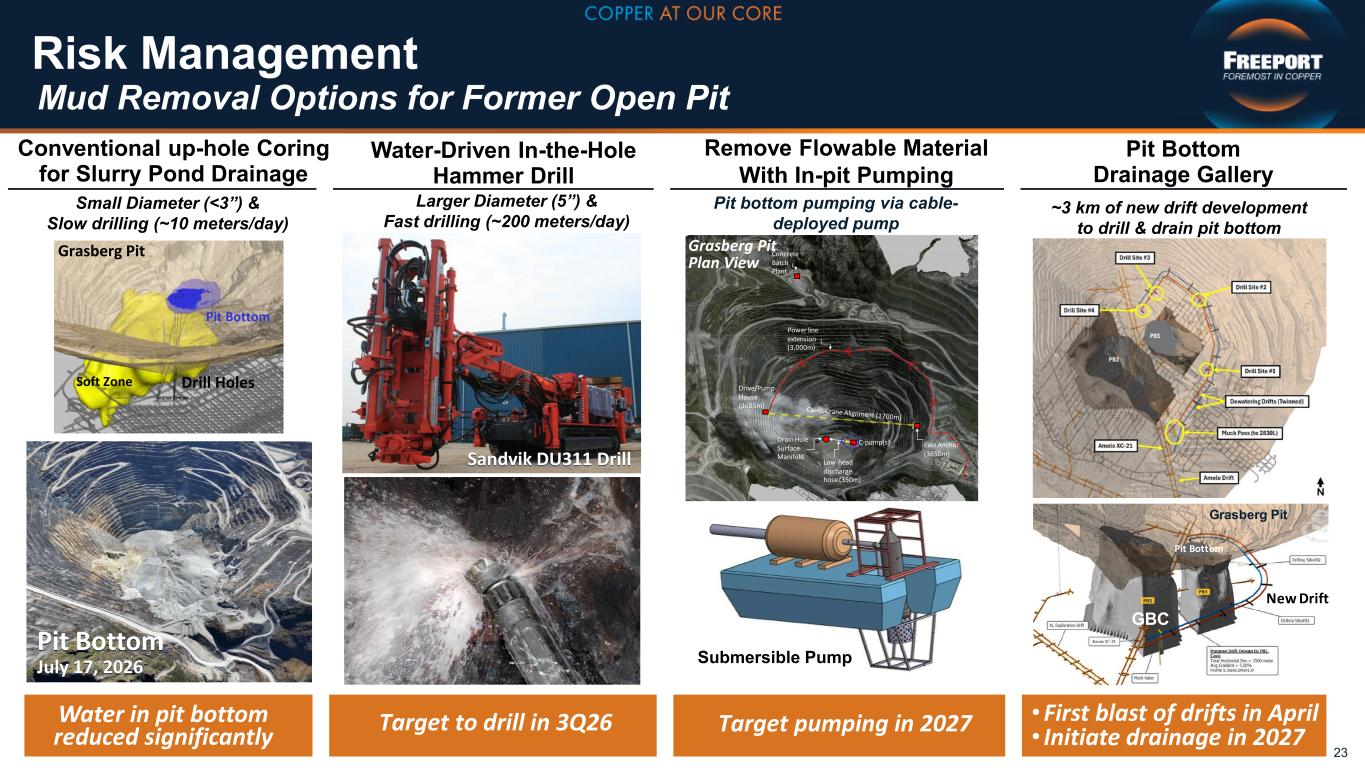
Concrete Batch Plant C-pump(s) Low-head discharge hose (350m) Power line extension (3,000m) Drive/Pump House (3685m) East Anchor (3650m) Drain Hole Surface Manifold Risk Management Sandvik DU311 Drill Remove Flowable Material With In-pit Pumping Conventional up-hole Coring for Slurry Pond Drainage Soft Zone Grasberg Pit Water-Driven In-the-Hole Hammer Drill Pit Bottom Drill Holes Grasberg Pit Plan View 23 ~3 km of new drift development to drill & drain pit bottom Larger Diameter (5”) & Fast drilling (~200 meters/day) Small Diameter (<3”) & Slow drilling (~10 meters/day) Mud Removal Options for Former Open Pit New Drift Grasberg Pit GBC Pit Bottom Water in pit bottom reduced significantly Target to drill in 3Q26 Target pumping in 2027 • First blast of drifts in April • Initiate drainage in 2027 Pit bottom pumping via cable- deployed pump Submersible Pump Pit Bottom Drainage Gallery Pit Bottom July 17, 2026
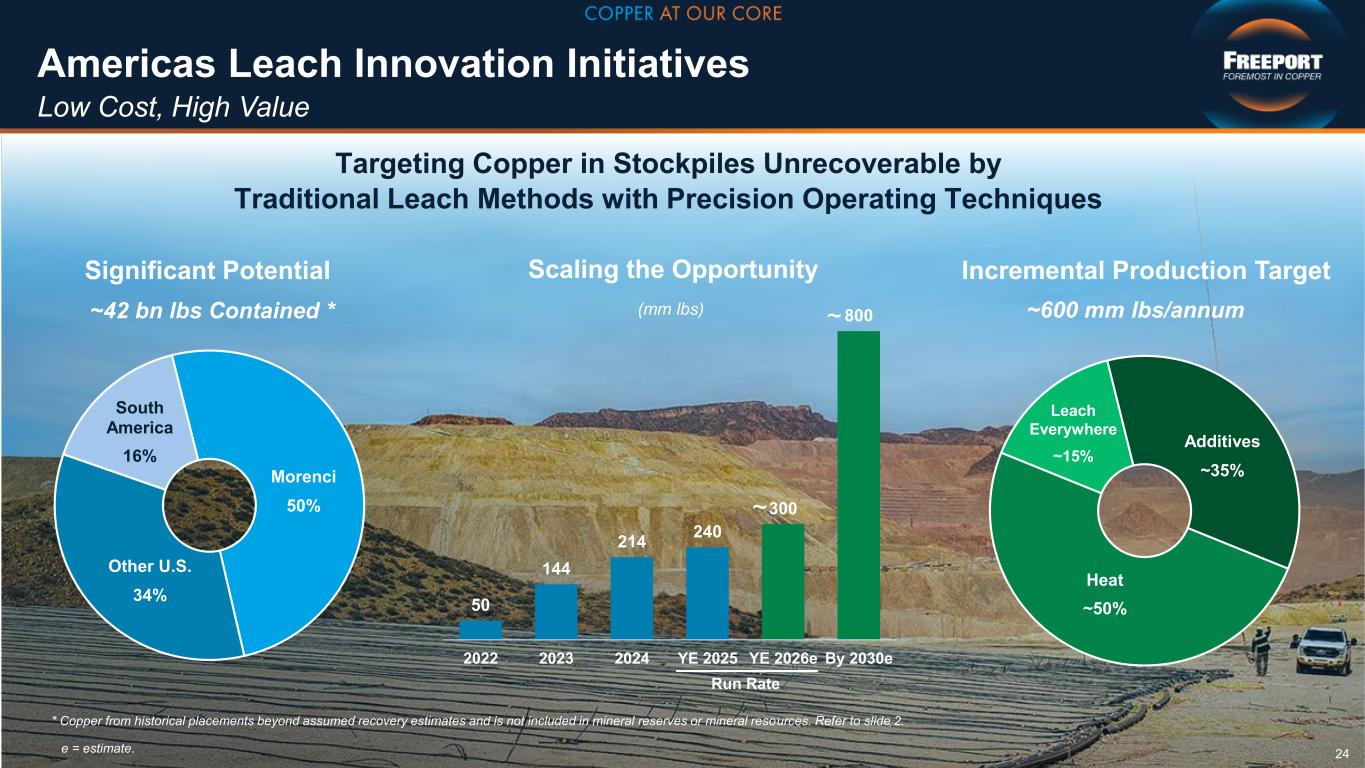
Americas Leach Innovation Initiatives Low Cost, High Value 24 * Copper from historical placements beyond assumed recovery estimates and is not included in mineral reserves or mineral resources. Refer to slide 2. South America 16% Other U.S. 34% Morenci 50% Significant Potential ~42 bn lbs Contained * Leach Everywhere ~15% Heat ~50% Additives ~35% ~600 mm lbs/annum Incremental Production Target Targeting Copper in Stockpiles Unrecoverable by Traditional Leach Methods with Precision Operating Techniques 50 144 214 240 300 800 2022 2023 2024 YE 2025 YE 2026e By 2030e Scaling the Opportunity (mm lbs) ~ ~ e = estimate. Run Rate
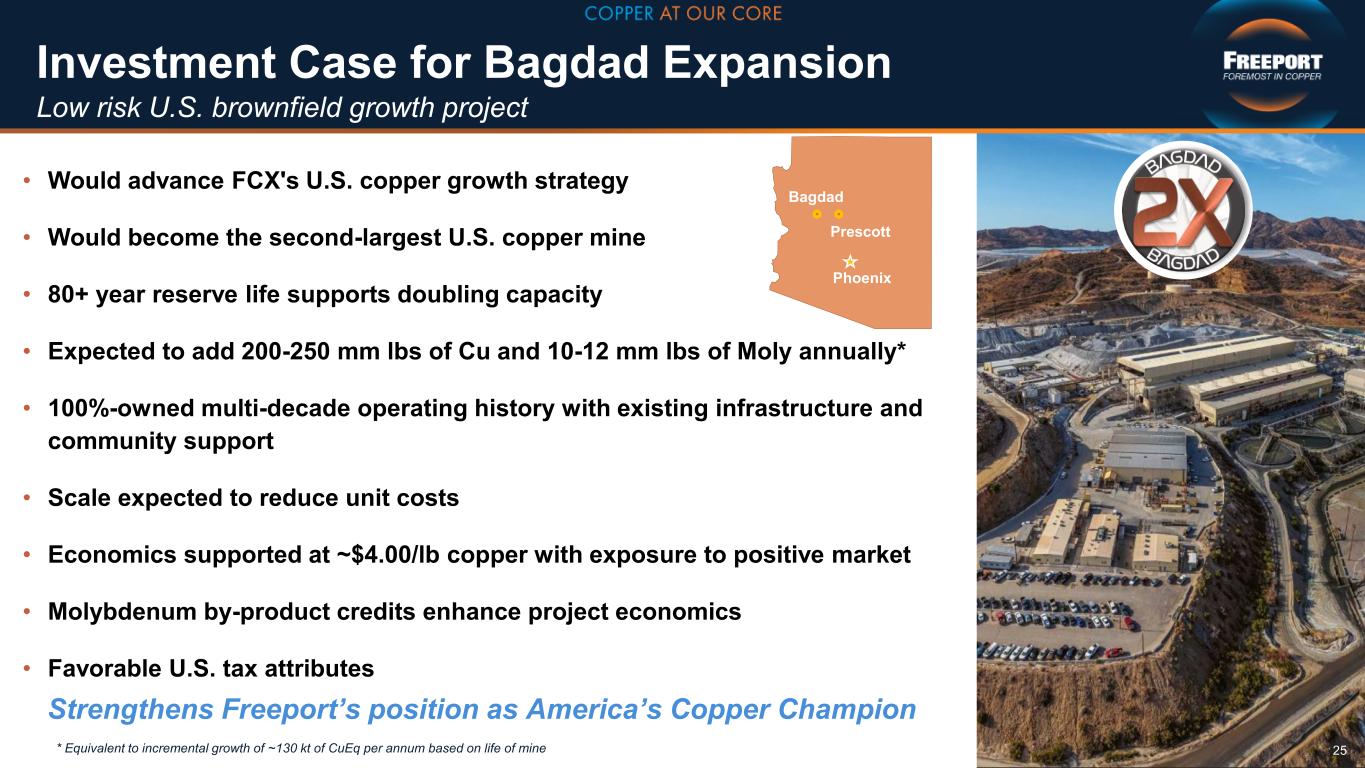
Investment Case for Bagdad Expansion 25 • Would advance FCX's U.S. copper growth strategy • Would become the second-largest U.S. copper mine • 80+ year reserve life supports doubling capacity • Expected to add 200-250 mm lbs of Cu and 10-12 mm lbs of Moly annually* • 100%-owned multi-decade operating history with existing infrastructure and community support • Scale expected to reduce unit costs • Economics supported at ~$4.00/lb copper with exposure to positive market • Molybdenum by-product credits enhance project economics • Favorable U.S. tax attributes Strengthens Freeport’s position as America’s Copper Champion Bagdad Prescott Phoenix Low risk U.S. brownfield growth project * Equivalent to incremental growth of ~130 kt of CuEq per annum based on life of mine
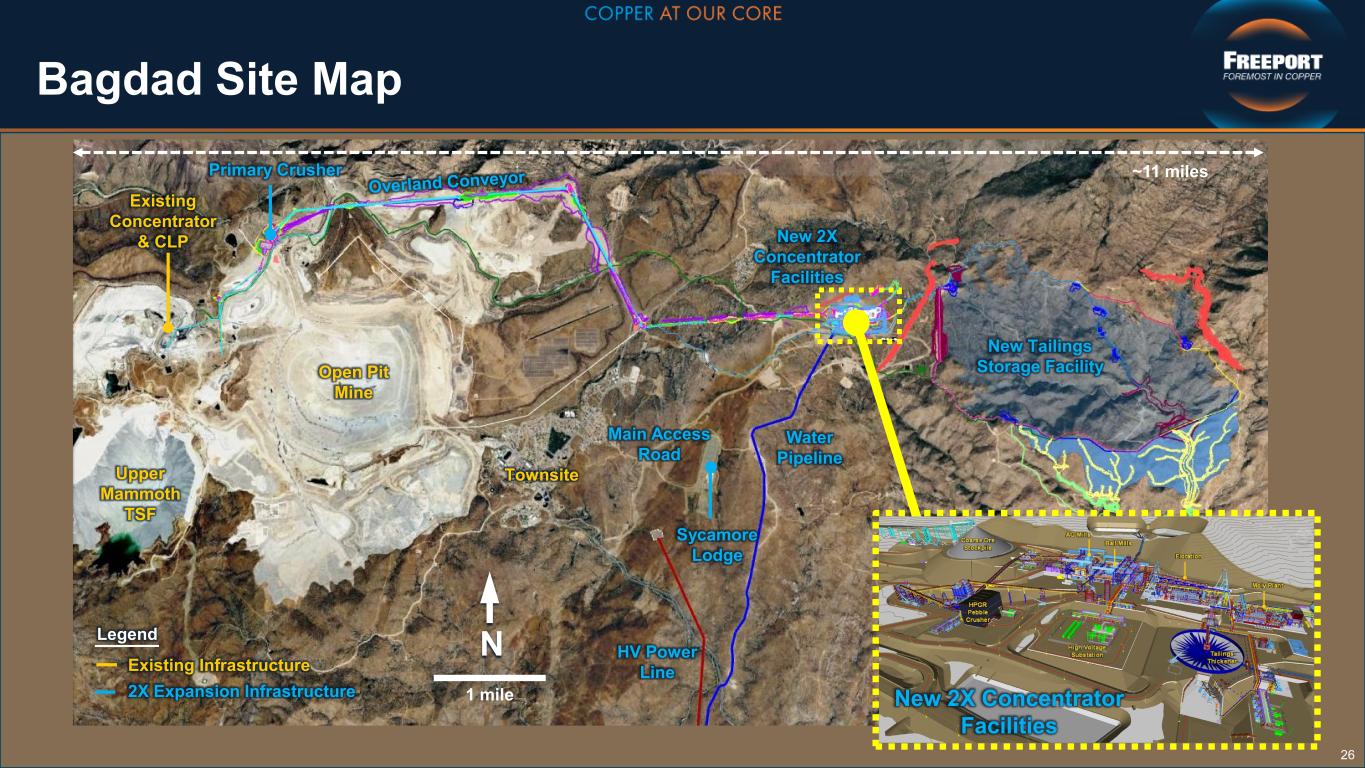
Bagdad Site Map 26 Townsite Existing Concentrator & CLP Upper Mammoth TSF Open Pit Mine N 1 mile New Tailings Storage Facility Water Pipeline New 2X Concentrator Facilities HV Power Line Sycamore Lodge Main Access Road Primary Crusher Existing Infrastructure 2X Expansion Infrastructure Legend ~11 miles New 2X Concentrator Facilities
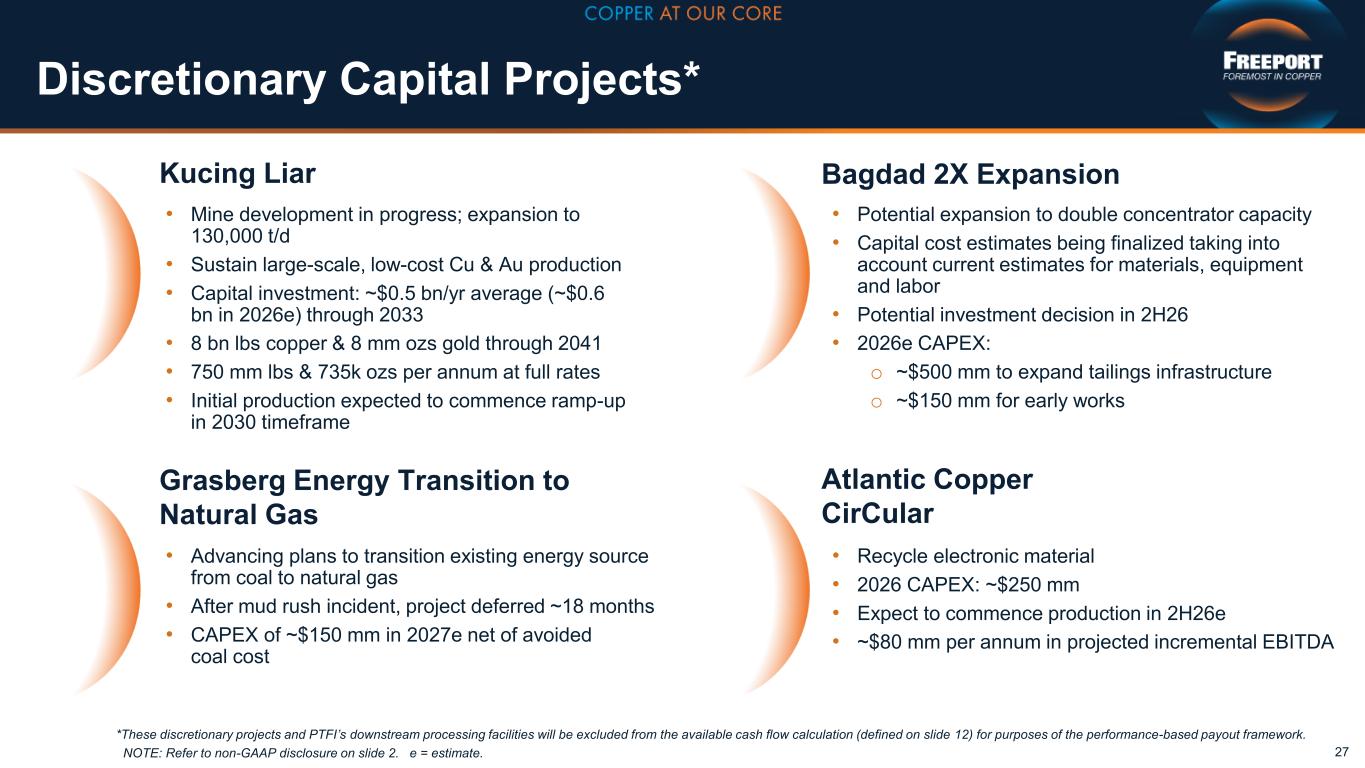
Discretionary Capital Projects* 27 • Mine development in progress; expansion to 130,000 t/d • Sustain large-scale, low-cost Cu & Au production • Capital investment: ~$0.5 bn/yr average (~$0.6 bn in 2026e) through 2033 • 8 bn lbs copper & 8 mm ozs gold through 2041 • 750 mm lbs & 735k ozs per annum at full rates • Initial production expected to commence ramp-up in 2030 timeframe *These discretionary projects and PTFI’s downstream processing facilities will be excluded from the available cash flow calculation (defined on slide 12) for purposes of the performance-based payout framework. NOTE: Refer to non-GAAP disclosure on slide 2. e = estimate. • Potential expansion to double concentrator capacity • Capital cost estimates being finalized taking into account current estimates for materials, equipment and labor • Potential investment decision in 2H26 • 2026e CAPEX: o ~$500 mm to expand tailings infrastructure o ~$150 mm for early works Bagdad 2X Expansion • Advancing plans to transition existing energy source from coal to natural gas • After mud rush incident, project deferred ~18 months • CAPEX of ~$150 mm in 2027e net of avoided coal cost • Recycle electronic material • 2026 CAPEX: ~$250 mm • Expect to commence production in 2H26e • ~$80 mm per annum in projected incremental EBITDA Atlantic Copper CirCular Kucing Liar Grasberg Energy Transition to Natural Gas
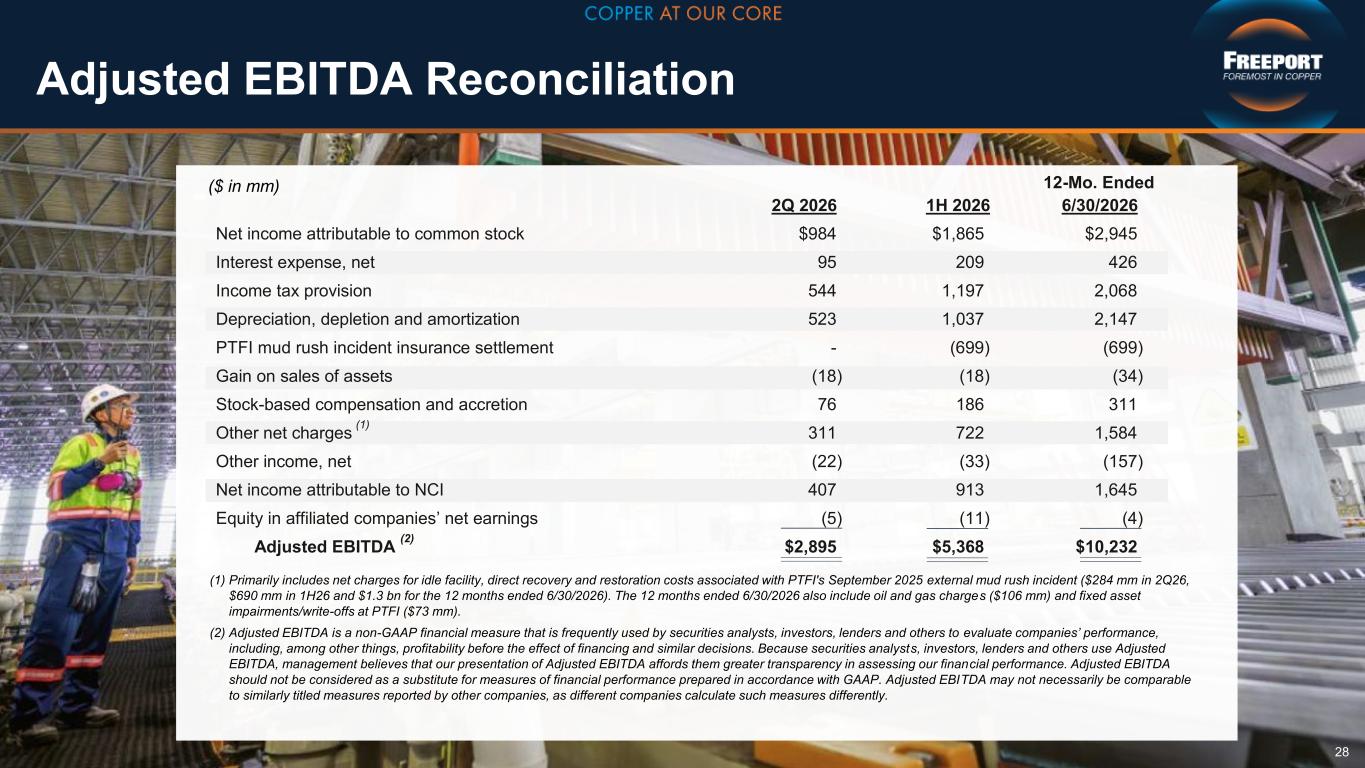
Adjusted EBITDA Reconciliation ($ in mm) 12-Mo. Ended 2Q 2026 1H 2026 6/30/2026 Net income attributable to common stock $984 $1,865 $2,945 Interest expense, net 95 209 426 Income tax provision 544 1,197 2,068 Depreciation, depletion and amortization 523 1,037 2,147 PTFI mud rush incident insurance settlement - (699) (699) Gain on sales of assets (18) (18) (34) Stock-based compensation and accretion 76 186 311 Other net charges (1) 311 722 1,584 Other income, net (22) (33) (157) Net income attributable to NCI 407 913 1,645 Equity in affiliated companies’ net earnings (5) (11) (4) Adjusted EBITDA (2) $2,895 $5,368 $10,232 (1) Primarily includes net charges for idle facility, direct recovery and restoration costs associated with PTFI's September 2025 external mud rush incident ($284 mm in 2Q26, $690 mm in 1H26 and $1.3 bn for the 12 months ended 6/30/2026). The 12 months ended 6/30/2026 also include oil and gas charges ($106 mm) and fixed asset impairments/write-offs at PTFI ($73 mm). (2) Adjusted EBITDA is a non-GAAP financial measure that is frequently used by securities analysts, investors, lenders and others to evaluate companies’ performance, including, among other things, profitability before the effect of financing and similar decisions. Because securities analysts, investors, lenders and others use Adjusted EBITDA, management believes that our presentation of Adjusted EBITDA affords them greater transparency in assessing our financial performance. Adjusted EBITDA should not be considered as a substitute for measures of financial performance prepared in accordance with GAAP. Adjusted EBITDA may not necessarily be comparable to similarly titled measures reported by other companies, as different companies calculate such measures differently. 28