1 NASDAQ: WTBA Q2 2026 | Earnings Highlights
2 Certain statements in this presentation, other than purely historical information, including estimates, projections, statements relating to the Company’s business plans, objectives and expected operating results, and the assumptions upon which those statements are based, are “forward-looking statements” within the meanings of Section 27A of the Securities Act of 1933, as amended, and Section 21E of the Securities Exchange Act of 1934, as amended (the Exchange Act). The Company intends such forward-looking statements to be covered by the safe harbor provisions for forward-looking statements contained in the Private Securities Litigation Reform Act of 1995. Forward-looking statements may appear throughout this presentation. These forward-looking statements are generally identified by the words “believes,” “expects,” “intends,” “anticipates,” “projects,” "forecasts," "plans," "targets," “future,” “confident,” "potentially," "probably," "outlook," “may,” “should,” "would," "could," “will,” “strategy,” “plan,” “opportunity,” “will be,” “will likely result,” “will continue” or similar references, as well as the negative of such words, or references to estimates, predictions or future events. Forward-looking statements are not historical facts but instead represent management's current expectations and forecasts regarding future events, many of which are inherently uncertain and outside our control. Such forward-looking statements are based upon certain underlying assumptions, known and unknown risks and uncertainties. Because of the possibility that the underlying assumptions are incorrect or do not materialize as expected in the future, actual results may differ, possibly materially, from these forward-looking statements. Risks and uncertainties that may affect future results include, but are not limited to: interest rate risk, including the effects of changes in interest rates; fluctuations in the values of the securities held in our investment portfolio, including as a result of rising interest rates; competitive pressures, including from non-bank competitors such as credit unions, “fintech” companies and digital asset service providers; technological changes implemented by us and other parties, including third-party vendors, which may be more difficult to implement or more expensive than anticipated or which may have unforeseen consequences to us and our customers, including the development and implementation of tools incorporating artificial intelligence; pricing pressures on loans and deposits; our ability to successfully manage liquidity risk; changes in credit and other risks posed by the Company’s loan portfolio, including declines in commercial or residential real estate values or changes in the allowance for credit losses dictated by new market conditions, accounting standards or regulatory requirements; the concentration of large deposits from certain clients, including those who have balances above current FDIC insurance limits; the threat or imposition of domestic or foreign tariffs or other governmental policies impacting the global supply chain and the value of products produced by our commercial borrowers; effects on the U.S. economy resulting from actions taken by the federal government, including executive orders and immigration enforcement; changes in local, national and international economic conditions, including the level and impact of inflation, and future monetary policies of the Federal Reserve in response thereto, and possible recession; the impact of bank failures or adverse developments at other banks and related negative publicity about the banking industry in general on investor and depositor sentiment regarding the stability and liquidity of banks; changes in legal and regulatory requirements, limitations and costs; changes in customers’ acceptance of the Company’s products and services; the occurrence of fraudulent activity, breaches or failures of our or our third-party partners' information security controls or cyber-security related incidents, including as a result of sophisticated attacks using artificial intelligence and similar tools; unexpected outcomes of existing or new litigation involving the Company; the monetary, trade and other regulatory policies of the U.S. government; the effects of acts of war or terrorism, including the wars in Iran and Ukraine, ongoing conflicts in the Middle East, and other international military conflicts that can increase levels of political and economic unpredictability, contribute to rising energy and commodity prices, affect global supply chains, increase the volatility of financial markets, and other matters beyond our control; widespread disease, pandemics or epidemics, or other adverse external events; risks related to climate change and the negative impact it may have on our customers and their business; changes to U.S. tax laws, regulations and guidance; potential changes in federal policy and at regulatory agencies; talent and labor shortages; emerging issues related to the development and use of artificial intelligence that could give rise to legal or regulatory action, damage our reputation or otherwise materially harm our business or customers; the availability of future equity and debt issuances and other capital raising opportunities on favorable terms; and any other risks described in the “Risk Factors” sections of reports filed by the Company with the Securities and Exchange Commission (the "SEC"). The Company cautions readers not to place undue reliance on any forward-looking statements. Moreover, any of the forward-looking statements that the Company makes in this report or the documents the Company files with or furnishes to the SEC are based only on information then actually known to the Company and upon management's beliefs and assumptions at the time they are made, which may turn out to be wrong because of inaccurate assumptions they might make, because of the factors described above or because other factors that the Company cannot foresee. Forward-looking statements speak only as of the date they are made, and the Company does not undertake and specifically disclaims any obligation to revise or update such forward- looking statements to reflect current or future events or circumstances after the date hereof or to reflect the occurrence of unanticipated events. Except as otherwise indicated, this presentation speaks as of the date hereof. The delivery of this presentation shall not, under any circumstances, create any implication that there has been no change in the affairs of West Bancorporation, Inc. after the date hereof. Certain of the information contained herein may be derived from information provided by industry sources. We believe that such information is accurate and that the sources from which it has been obtained are reliable. We cannot guarantee the accuracy of such information, however, and we have not independently verified such information. This presentation contains references to financial measures that are not defined in GAAP. Such non-GAAP financial measures include the Company’s presentation of net interest income and net interest margin on a fully taxable equivalent (FTE) basis and the presentation of the efficiency ratio on an adjusted and FTE basis, excluding certain income and expenses. Management believes these non-GAAP financial measures provide useful information to both management and investors to analyze and evaluate the Company’s financial performance. These measures are considered standard measures of comparison within the banking industry. Additionally, management believes providing measures on a FTE basis enhances the comparability of income arising from taxable and nontaxable sources. Limitations associated with non-GAAP financial measures include the risks that persons might disagree as to the appropriateness of items included in these measures and that different companies might calculate these measures differently. These non-GAAP disclosures should not be considered an alternative to the Company’s GAAP results. This presentation includes reconciliations of non-GAAP financial measures to comparable GAAP financial measures. Disclaimers
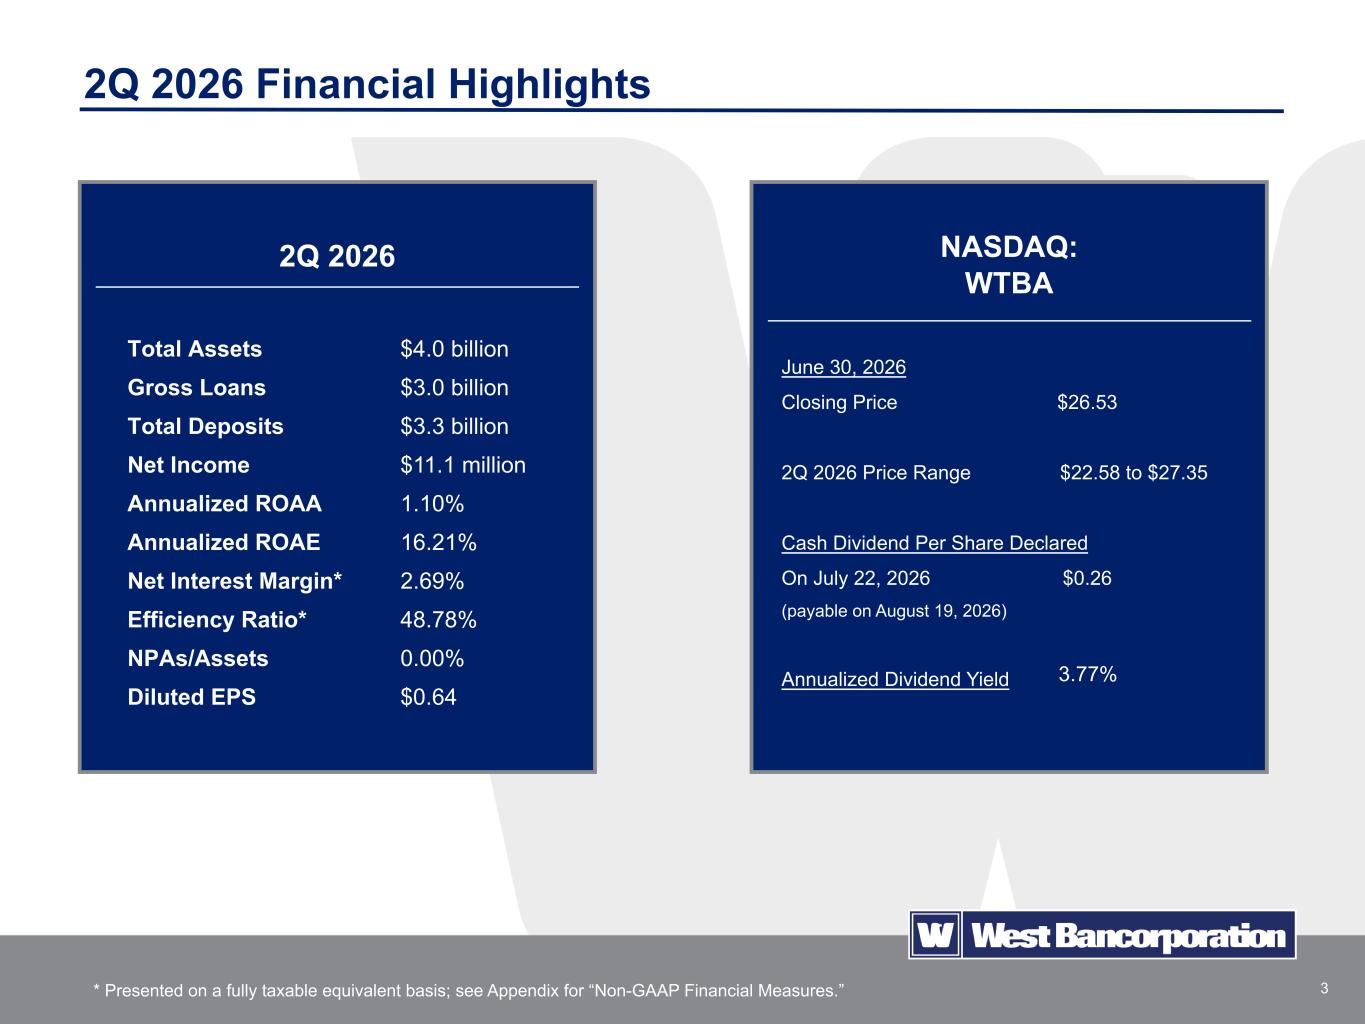
3 2Q 2026 Financial Highlights * Presented on a fully taxable equivalent basis; see Appendix for “Non-GAAP Financial Measures.” $26.26 NASDAQ: WTBA June 30, 2026 Closing Price $26.53 2Q 2026 Price Range $22.58 to $27.35 Cash Dividend Per Share Declared On July 22, 2026 $0.26 (payable on August 19, 2026) Annualized Dividend Yield 3.77% 2Q 2026 Total Assets $4.0 billion Gross Loans $3.0 billion Total Deposits $3.3 billion Net Income $11.1 million Annualized ROAA 1.10% Annualized ROAE 16.21% Net Interest Margin* 2.69% Efficiency Ratio* 48.78% NPAs/Assets 0.00% Diluted EPS $0.64
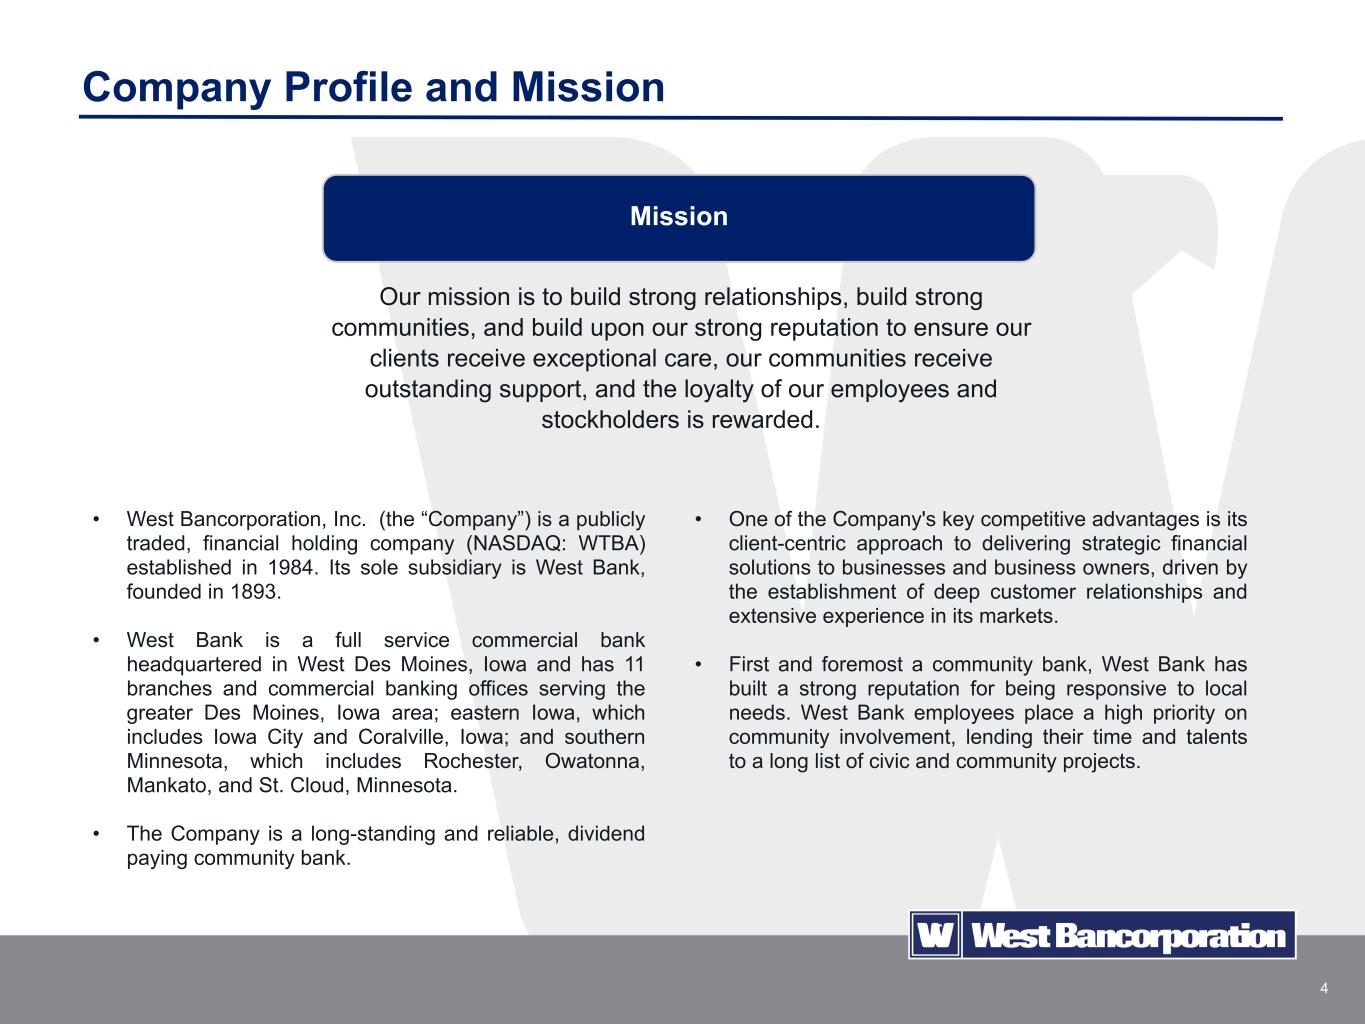
4 • West Bancorporation, Inc. (the “Company”) is a publicly traded, financial holding company (NASDAQ: WTBA) established in 1984. Its sole subsidiary is West Bank, founded in 1893. • West Bank is a full service commercial bank headquartered in West Des Moines, Iowa and has 11 branches and commercial banking offices serving the greater Des Moines, Iowa area; eastern Iowa, which includes Iowa City and Coralville, Iowa; and southern Minnesota, which includes Rochester, Owatonna, Mankato, and St. Cloud, Minnesota. • The Company is a long-standing and reliable, dividend paying community bank. Our mission is to build strong relationships, build strong communities, and build upon our strong reputation to ensure our clients receive exceptional care, our communities receive outstanding support, and the loyalty of our employees and stockholders is rewarded. Company Profile and Mission • One of the Company's key competitive advantages is its client-centric approach to delivering strategic financial solutions to businesses and business owners, driven by the establishment of deep customer relationships and extensive experience in its markets. • First and foremost a community bank, West Bank has built a strong reputation for being responsive to local needs. West Bank employees place a high priority on community involvement, lending their time and talents to a long list of civic and community projects. Mission
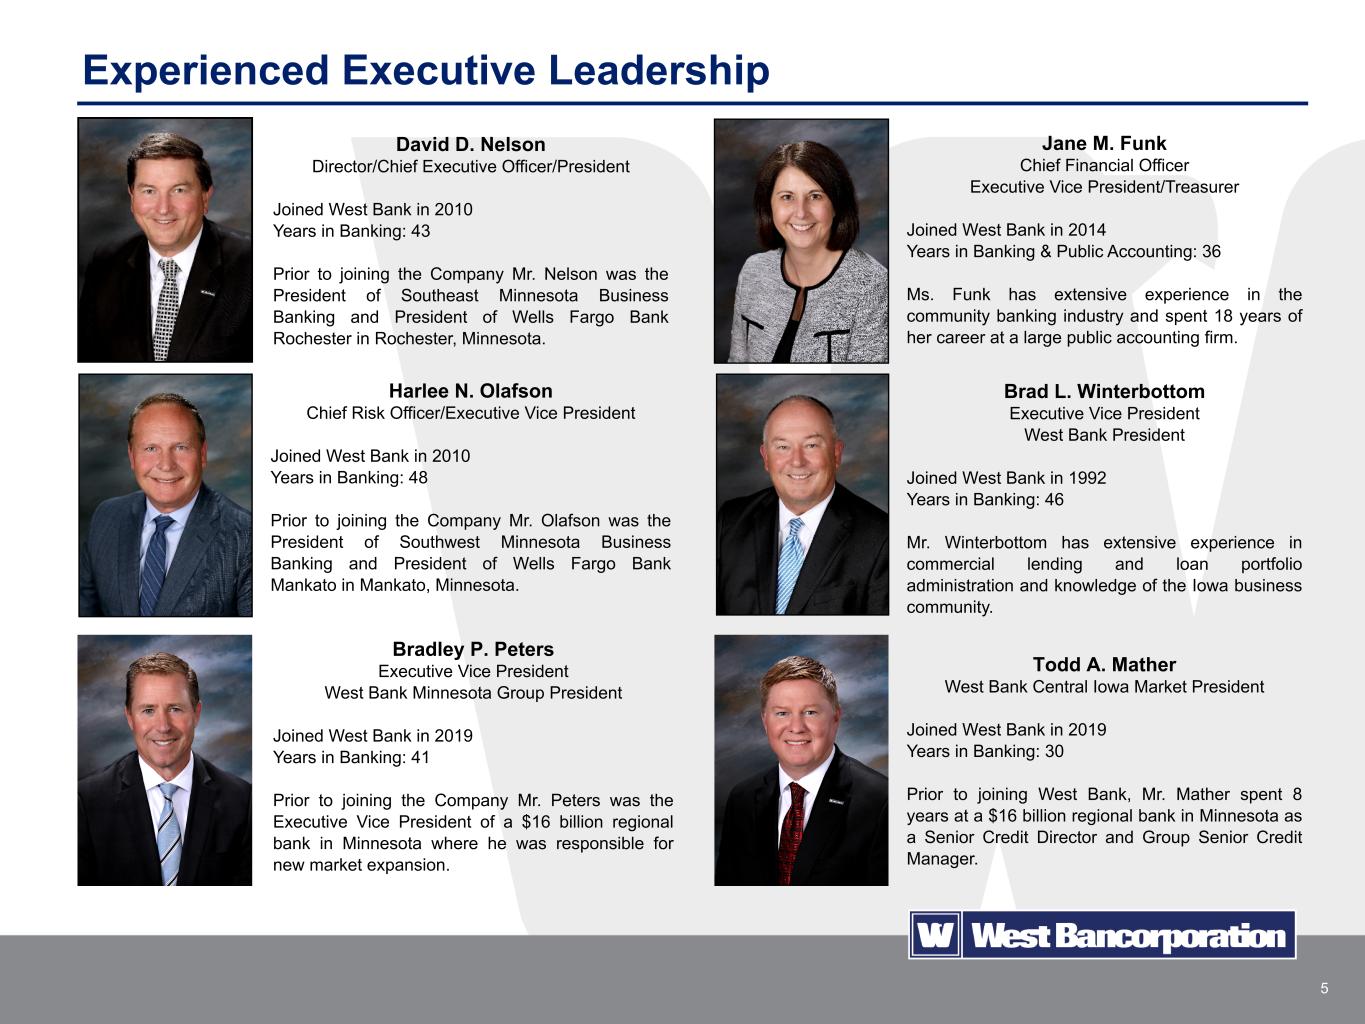
5 Experienced Executive Leadership David D. Nelson Director/Chief Executive Officer/President Joined West Bank in 2010 Years in Banking: 43 Prior to joining the Company Mr. Nelson was the President of Southeast Minnesota Business Banking and President of Wells Fargo Bank Rochester in Rochester, Minnesota. Harlee N. Olafson Chief Risk Officer/Executive Vice President Joined West Bank in 2010 Years in Banking: 48 Prior to joining the Company Mr. Olafson was the President of Southwest Minnesota Business Banking and President of Wells Fargo Bank Mankato in Mankato, Minnesota. Bradley P. Peters Executive Vice President West Bank Minnesota Group President Joined West Bank in 2019 Years in Banking: 41 Prior to joining the Company Mr. Peters was the Executive Vice President of a $16 billion regional bank in Minnesota where he was responsible for new market expansion. Jane M. Funk Chief Financial Officer Executive Vice President/Treasurer Joined West Bank in 2014 Years in Banking & Public Accounting: 36 Ms. Funk has extensive experience in the community banking industry and spent 18 years of her career at a large public accounting firm. Brad L. Winterbottom Executive Vice President West Bank President Joined West Bank in 1992 Years in Banking: 46 Mr. Winterbottom has extensive experience in commercial lending and loan portfolio administration and knowledge of the Iowa business community. Todd A. Mather West Bank Central Iowa Market President Joined West Bank in 2019 Years in Banking: 30 Prior to joining West Bank, Mr. Mather spent 8 years at a $16 billion regional bank in Minnesota as a Senior Credit Director and Group Senior Credit Manager.
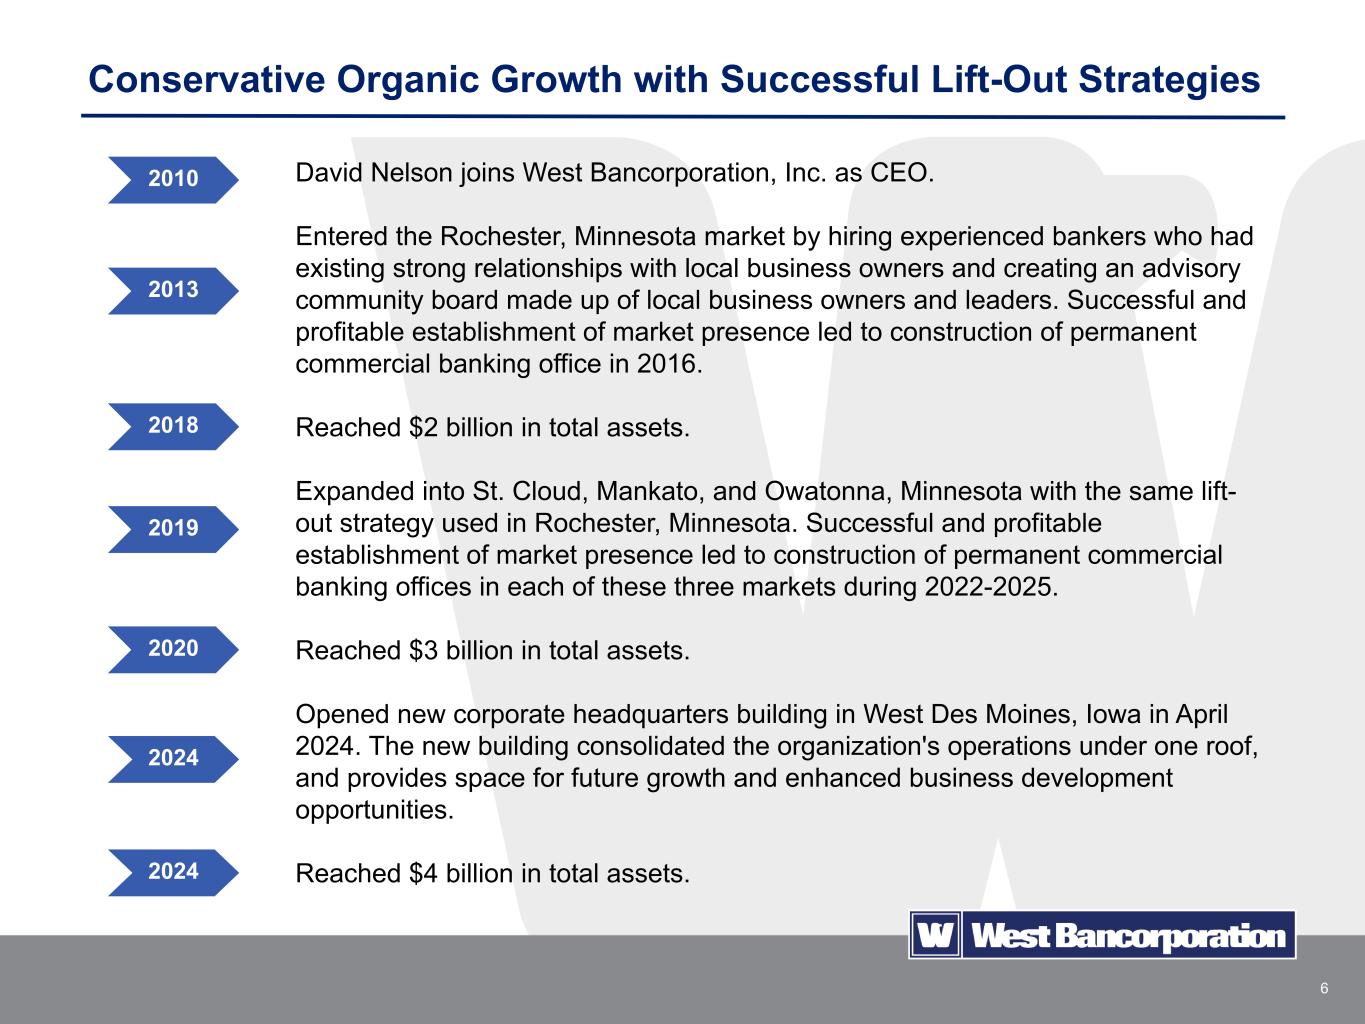
6 Conservative Organic Growth with Successful Lift-Out Strategies David Nelson joins West Bancorporation, Inc. as CEO. Entered the Rochester, Minnesota market by hiring experienced bankers who had existing strong relationships with local business owners and creating an advisory community board made up of local business owners and leaders. Successful and profitable establishment of market presence led to construction of permanent commercial banking office in 2016. Reached $2 billion in total assets. Expanded into St. Cloud, Mankato, and Owatonna, Minnesota with the same lift- out strategy used in Rochester, Minnesota. Successful and profitable establishment of market presence led to construction of permanent commercial banking offices in each of these three markets during 2022-2025. Reached $3 billion in total assets. Opened new corporate headquarters building in West Des Moines, Iowa in April 2024. The new building consolidated the organization's operations under one roof, and provides space for future growth and enhanced business development opportunities. Reached $4 billion in total assets. 2010 2013 2018 2019 2020 2024 2024
7 Company Highlights – Commitment to Excellence West Bancorporation, Inc. is a high performing company in U.S. community banking, well-versed in providing commercial banking services, including loans and lines of credit and all types of deposit services, to small- and medium-sized businesses in its Iowa and Minnesota markets. Attractive Franchise Strategy Community Service & Philanthropy • A 133 year presence in the Des Moines, Iowa metropolitan area and is West Des Moines' oldest business of any type. • Long track record of growth and stability coupled with attractive financial returns and dividend yield. • Simple and consistent business model with a conservative operating philosophy and expense management controls. • Efficient and right-sized branch network, with a total of 11 offices serving 6 markets. • Organic growth strategy with a track record of successful lift-out strategies and a branch-lite structure. • Disciplined business model highlighted by focus on risk management and consistent execution that has resulted in pristine credit quality. • Superior talent with business expertise in building relationships and providing a differentiated level of service. • In 2025, our employees volunteered over 7,000 hours of community service. • In 2025, the West Bancorporation Foundation and West Bank provided over $550,000 in total philanthropic contributions to more than 182 organizations. • West Bancorporation, Inc.'s corporate headquarters, which opened in April 2024, was constructed on a redevelopment site in West Des Moines, Iowa in an area in need of a catalyst for revitalization.
8 Company Highlights – Commitment to Excellence West Bank is a commercially-focused financial institution operating in high quality markets in Iowa and Minnesota led by a deep and experienced management team with skills developed internally and with other large regional banking institutions. Credit Culture Asset Quality & Risk Management • Strict credit risk management with robust processes and experienced credit personnel. • 31 high quality commercial bankers with an average of 21 years of commercial banking experience. • Centralized committee structure that is agile and responsive to customer needs and an organizational structure that provides deep support of credit and administrative functions. • We are a local lender to local customers. • Proven credit culture with a history of strong asset quality. • Classified and watch list loan balance was 0.73% of the loan portfolio at June 30, 2026. • No nonperforming assets at June 30, 2026. • Commercial real estate stress testing is completed quarterly. • Independent third party loan review is performed semi-annually.
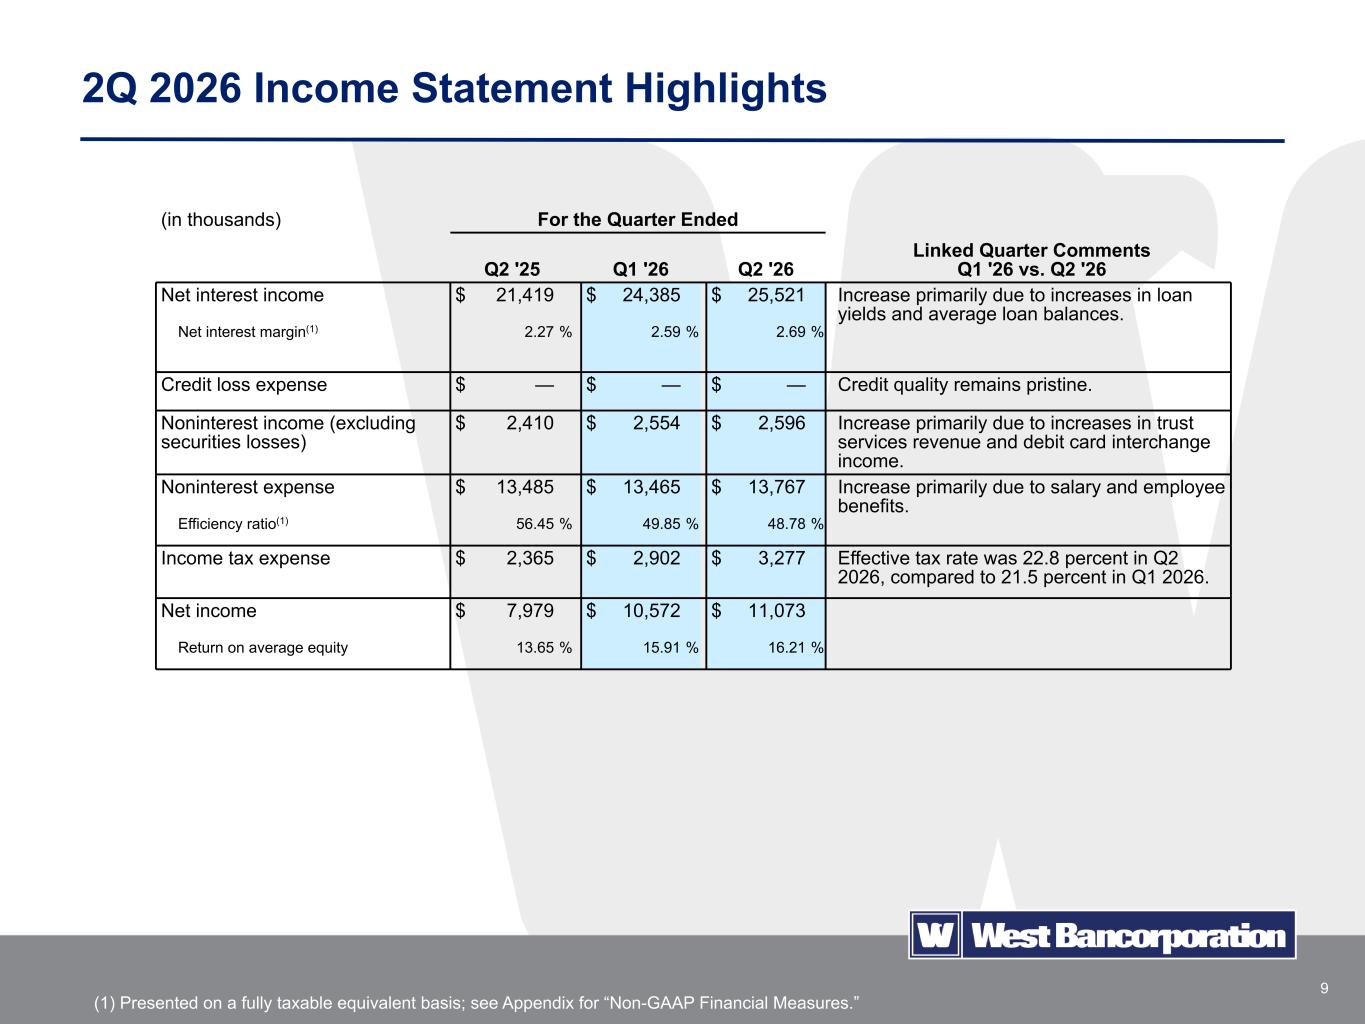
9 2Q 2026 Income Statement Highlights (in thousands) For the Quarter Ended Q2 '25 Q1 '26 Q2 '26 Linked Quarter Comments Q1 '26 vs. Q2 '26 Net interest income $ 21,419 $ 24,385 $ 25,521 Increase primarily due to increases in loan yields and average loan balances. Net interest margin(1) 2.27 % 2.59 % 2.69 % Credit loss expense $ — $ — $ — Credit quality remains pristine. Noninterest income (excluding securities losses) $ 2,410 $ 2,554 $ 2,596 Increase primarily due to increases in trust services revenue and debit card interchange income. Noninterest expense $ 13,485 $ 13,465 $ 13,767 Increase primarily due to salary and employee benefits. Efficiency ratio(1) 56.45 % 49.85 % 48.78 % Income tax expense $ 2,365 $ 2,902 $ 3,277 Effective tax rate was 22.8 percent in Q2 2026, compared to 21.5 percent in Q1 2026. Net income $ 7,979 $ 10,572 $ 11,073 Return on average equity 13.65 % 15.91 % 16.21 % (1) Presented on a fully taxable equivalent basis; see Appendix for “Non-GAAP Financial Measures.”
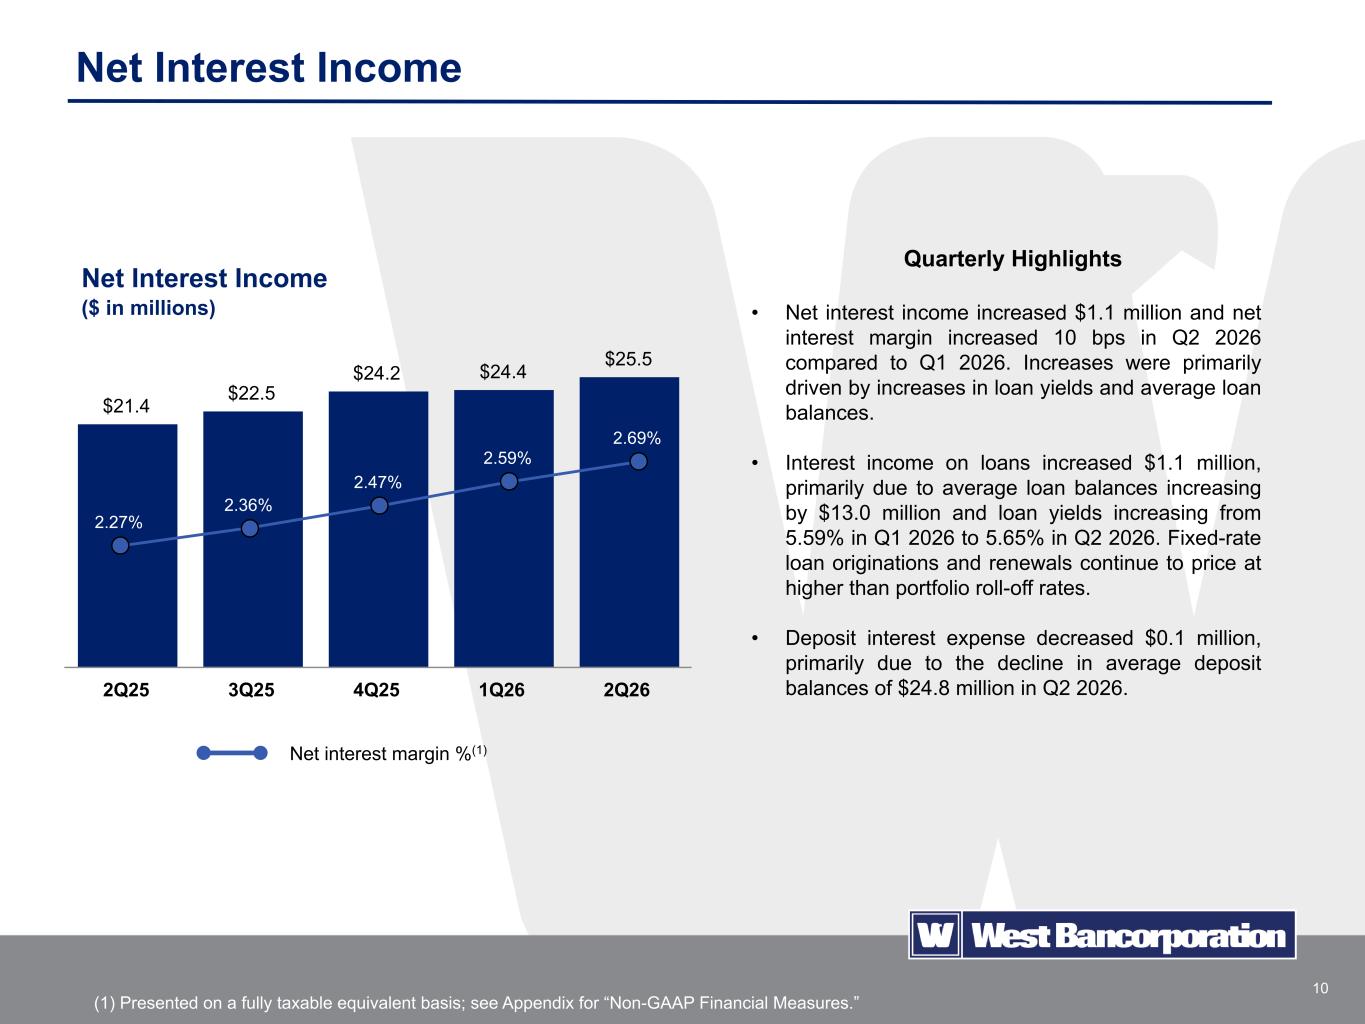
10 Net Interest Income (1) Presented on a fully taxable equivalent basis; see Appendix for “Non-GAAP Financial Measures.” $21.4 $22.5 $24.2 $24.4 $25.5 2Q25 3Q25 4Q25 1Q26 2Q26 Net Interest Income ($ in millions) 2.27% 2.36% 2.47% 2.59% 2.69% Net interest margin %(1) Quarterly Highlights • Net interest income increased $1.1 million and net interest margin increased 10 bps in Q2 2026 compared to Q1 2026. Increases were primarily driven by increases in loan yields and average loan balances. • Interest income on loans increased $1.1 million, primarily due to average loan balances increasing by $13.0 million and loan yields increasing from 5.59% in Q1 2026 to 5.65% in Q2 2026. Fixed-rate loan originations and renewals continue to price at higher than portfolio roll-off rates. • Deposit interest expense decreased $0.1 million, primarily due to the decline in average deposit balances of $24.8 million in Q2 2026.
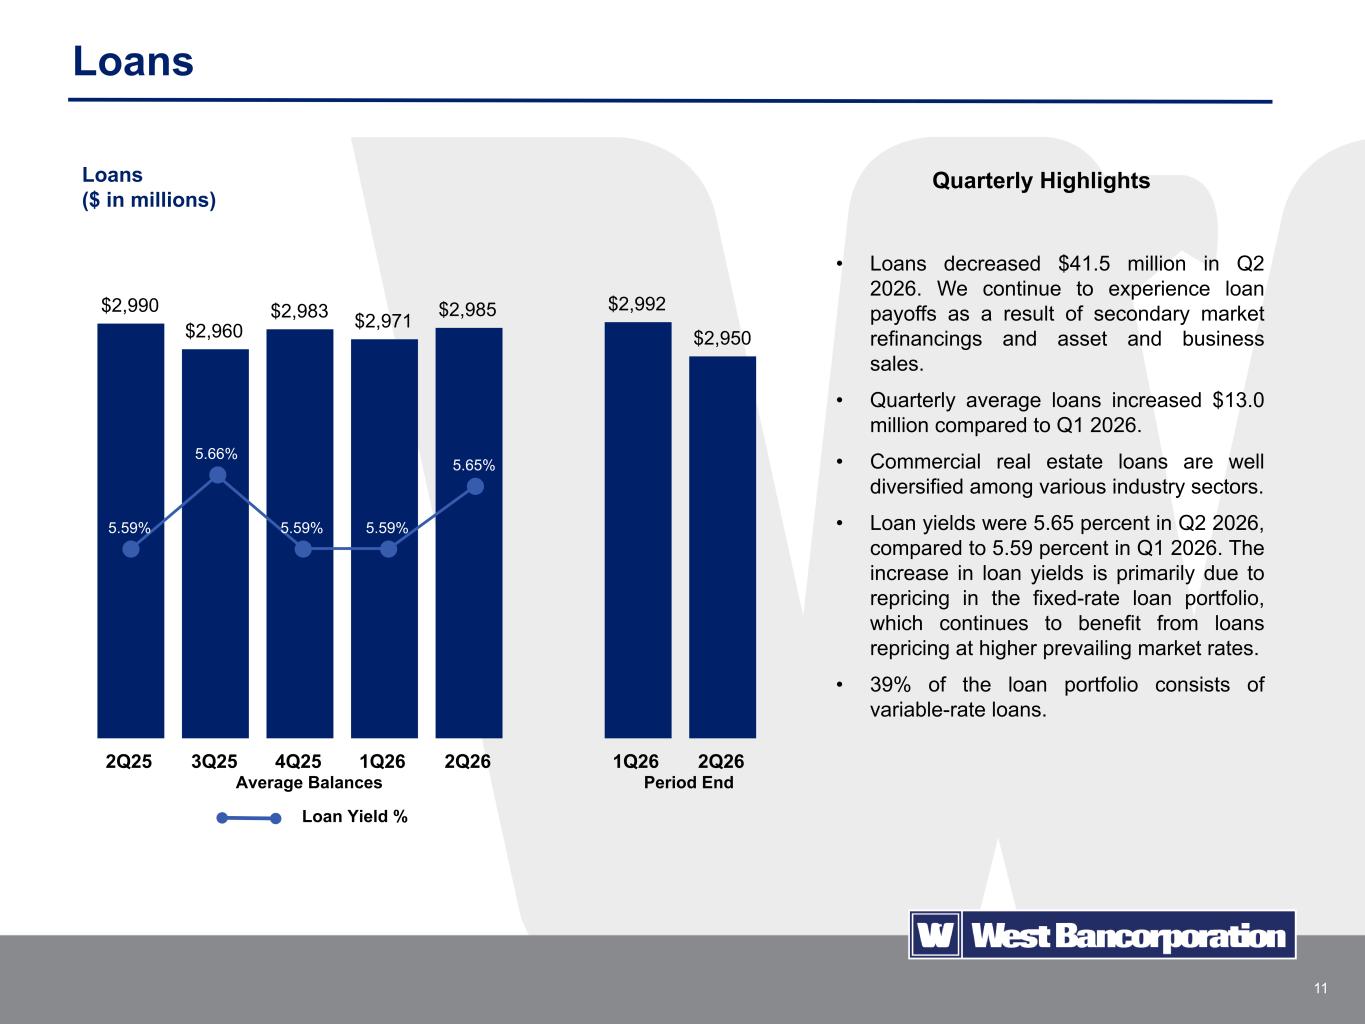
11 $2,990 $2,960 $2,983 $2,971 $2,985 $2,992 $2,950 2Q25 3Q25 4Q25 1Q26 2Q26 1Q26 2Q26 Loans • Loans decreased $41.5 million in Q2 2026. We continue to experience loan payoffs as a result of secondary market refinancings and asset and business sales. • Quarterly average loans increased $13.0 million compared to Q1 2026. • Commercial real estate loans are well diversified among various industry sectors. • Loan yields were 5.65 percent in Q2 2026, compared to 5.59 percent in Q1 2026. The increase in loan yields is primarily due to repricing in the fixed-rate loan portfolio, which continues to benefit from loans repricing at higher prevailing market rates. • 39% of the loan portfolio consists of variable-rate loans. Quarterly Highlights 5.59% 5.66% 5.59% 5.59% 5.65% Loans ($ in millions) Average Balances Period End Loan Yield %
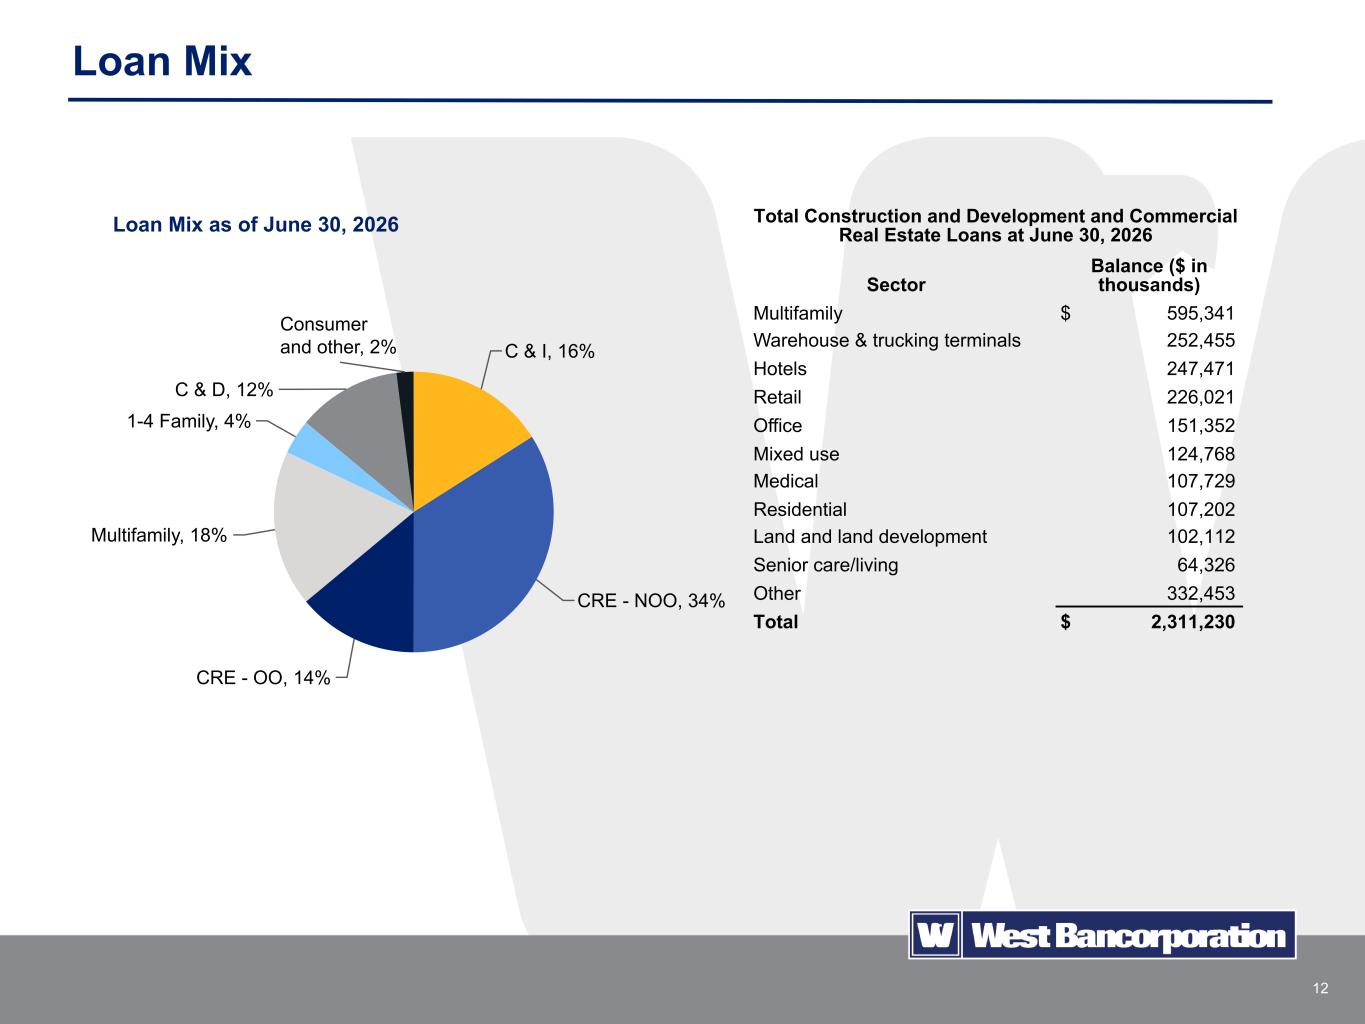
12 Loan Mix C & I, 16% CRE - NOO, 34% CRE - OO, 14% Multifamily, 18% 1-4 Family, 4% C & D, 12% Consumer and other, 2% Loan Mix as of June 30, 2026 Total Construction and Development and Commercial Real Estate Loans at June 30, 2026 Sector Balance ($ in thousands) Multifamily $ 595,341 Warehouse & trucking terminals 252,455 Hotels 247,471 Retail 226,021 Office 151,352 Mixed use 124,768 Medical 107,729 Residential 107,202 Land and land development 102,112 Senior care/living 64,326 Other 332,453 Total $ 2,311,230
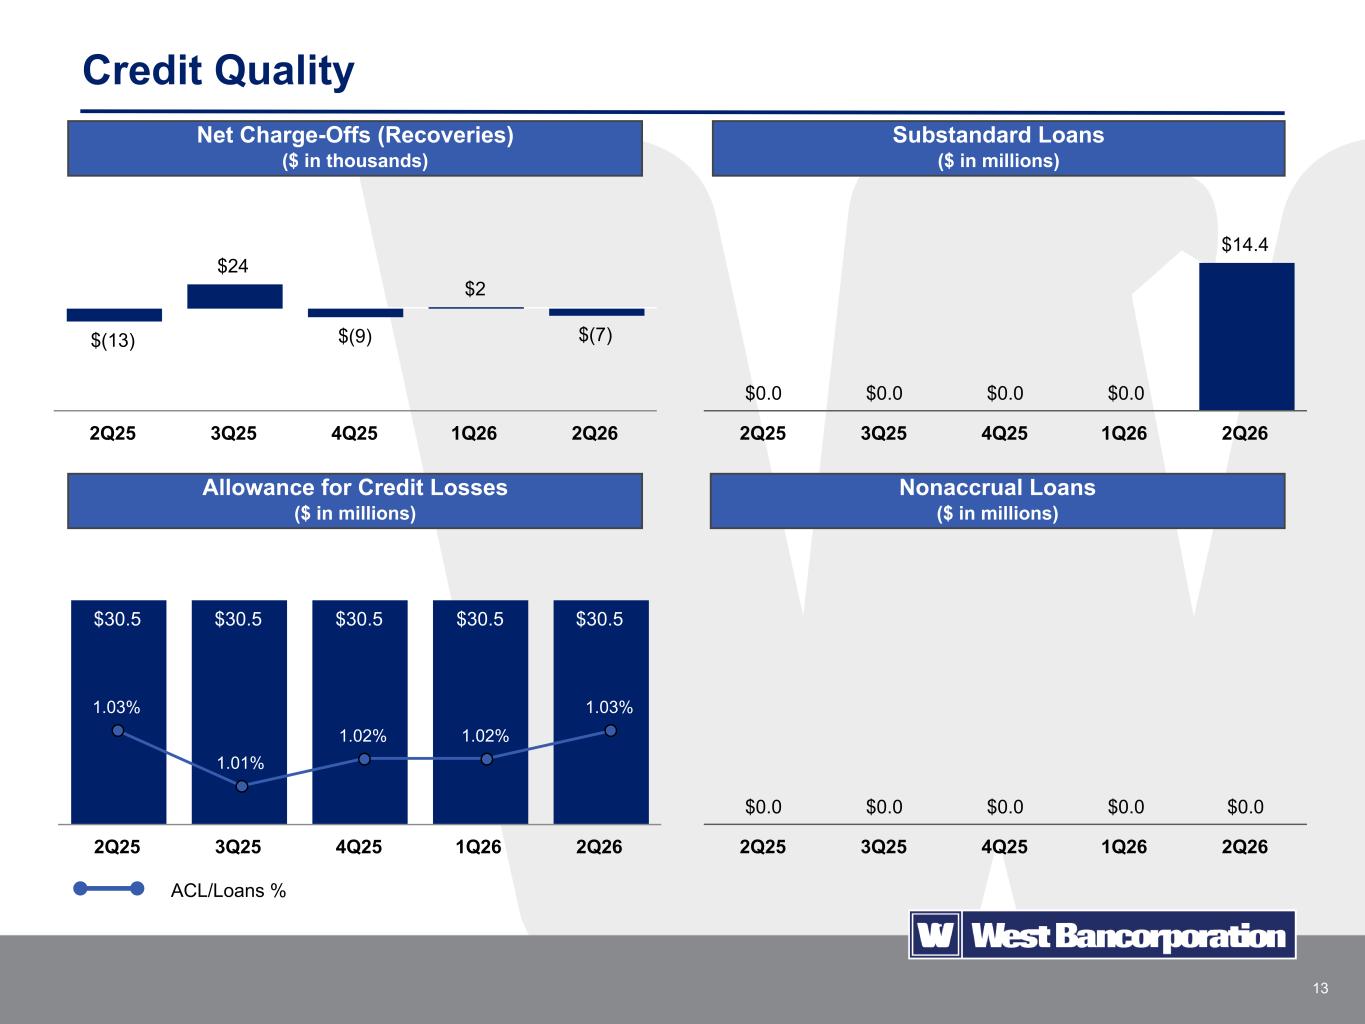
13 $(13) $24 $(9) $2 $(7) 2Q25 3Q25 4Q25 1Q26 2Q26 Credit Quality $0.0 $0.0 $0.0 $0.0 $14.4 2Q25 3Q25 4Q25 1Q26 2Q26 $0.0 $0.0 $0.0 $0.0 $0.0 2Q25 3Q25 4Q25 1Q26 2Q26 $30.5 $30.5 $30.5 $30.5 $30.5 2Q25 3Q25 4Q25 1Q26 2Q26 Net Charge-Offs (Recoveries) ($ in thousands) Substandard Loans ($ in millions) Nonaccrual Loans ($ in millions) Allowance for Credit Losses ($ in millions) 1.03% 1.01% 1.02% 1.02% 1.03% ACL/Loans %
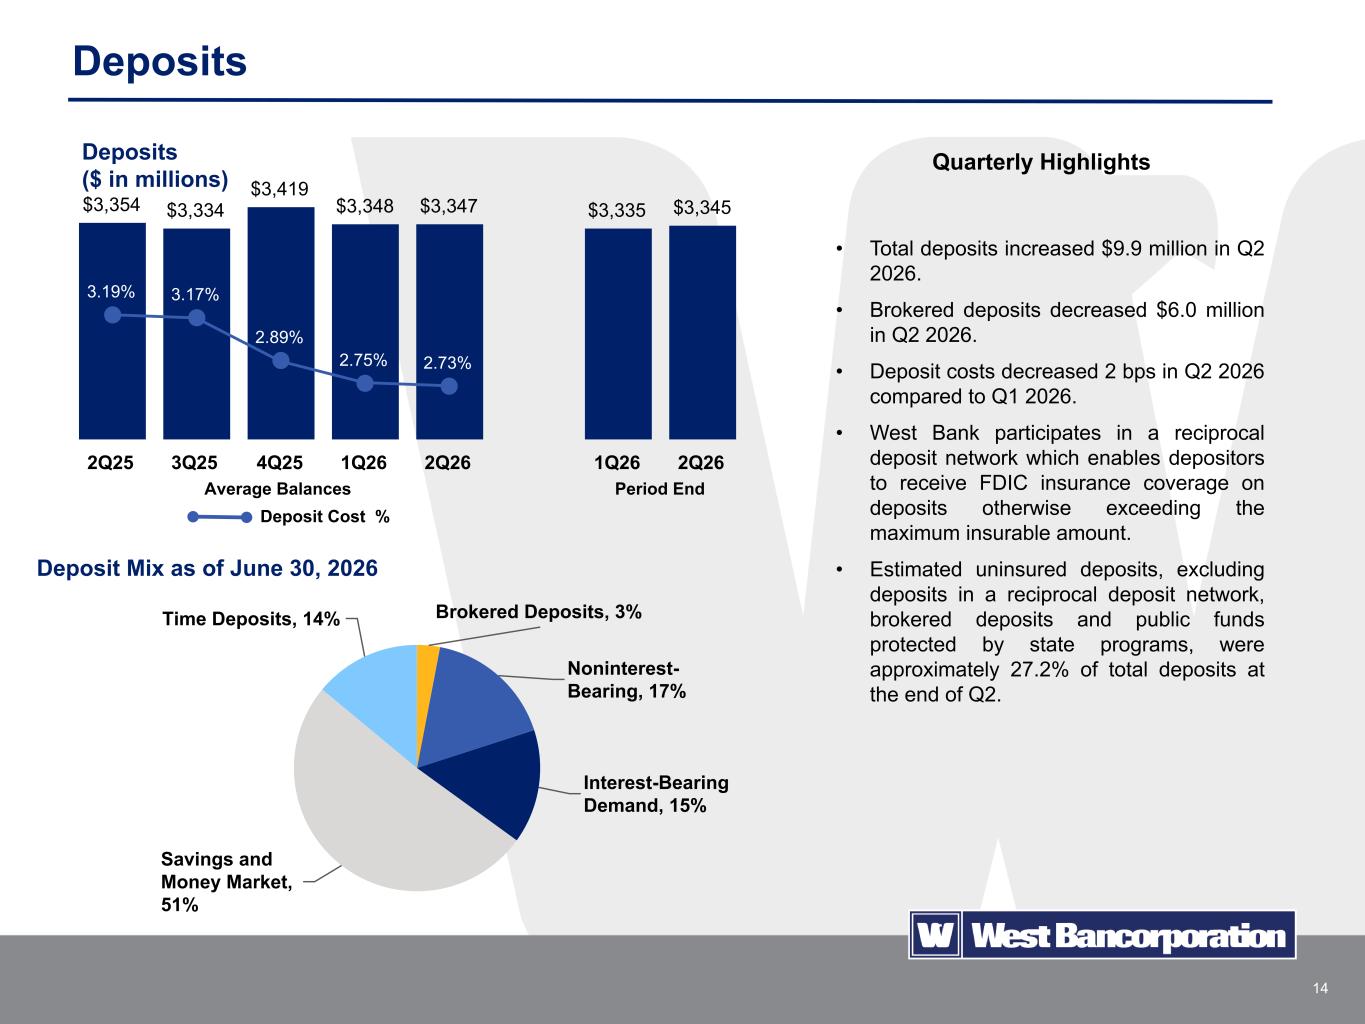
14 Deposits • Total deposits increased $9.9 million in Q2 2026. • Brokered deposits decreased $6.0 million in Q2 2026. • Deposit costs decreased 2 bps in Q2 2026 compared to Q1 2026. • West Bank participates in a reciprocal deposit network which enables depositors to receive FDIC insurance coverage on deposits otherwise exceeding the maximum insurable amount. • Estimated uninsured deposits, excluding deposits in a reciprocal deposit network, brokered deposits and public funds protected by state programs, were approximately 27.2% of total deposits at the end of Q2. Quarterly Highlights $3,354 $3,334 $3,419 $3,348 $3,347 $3,335 $3,345 2Q25 3Q25 4Q25 1Q26 2Q26 1Q26 2Q26 Average Balances Deposit Cost % Period End Deposits ($ in millions) 3.19% 3.17% 2.89% 2.75% 2.73% Brokered Deposits, 3% Noninterest- Bearing, 17% Interest-Bearing Demand, 15% Savings and Money Market, 51% Time Deposits, 14% Deposit Mix as of June 30, 2026
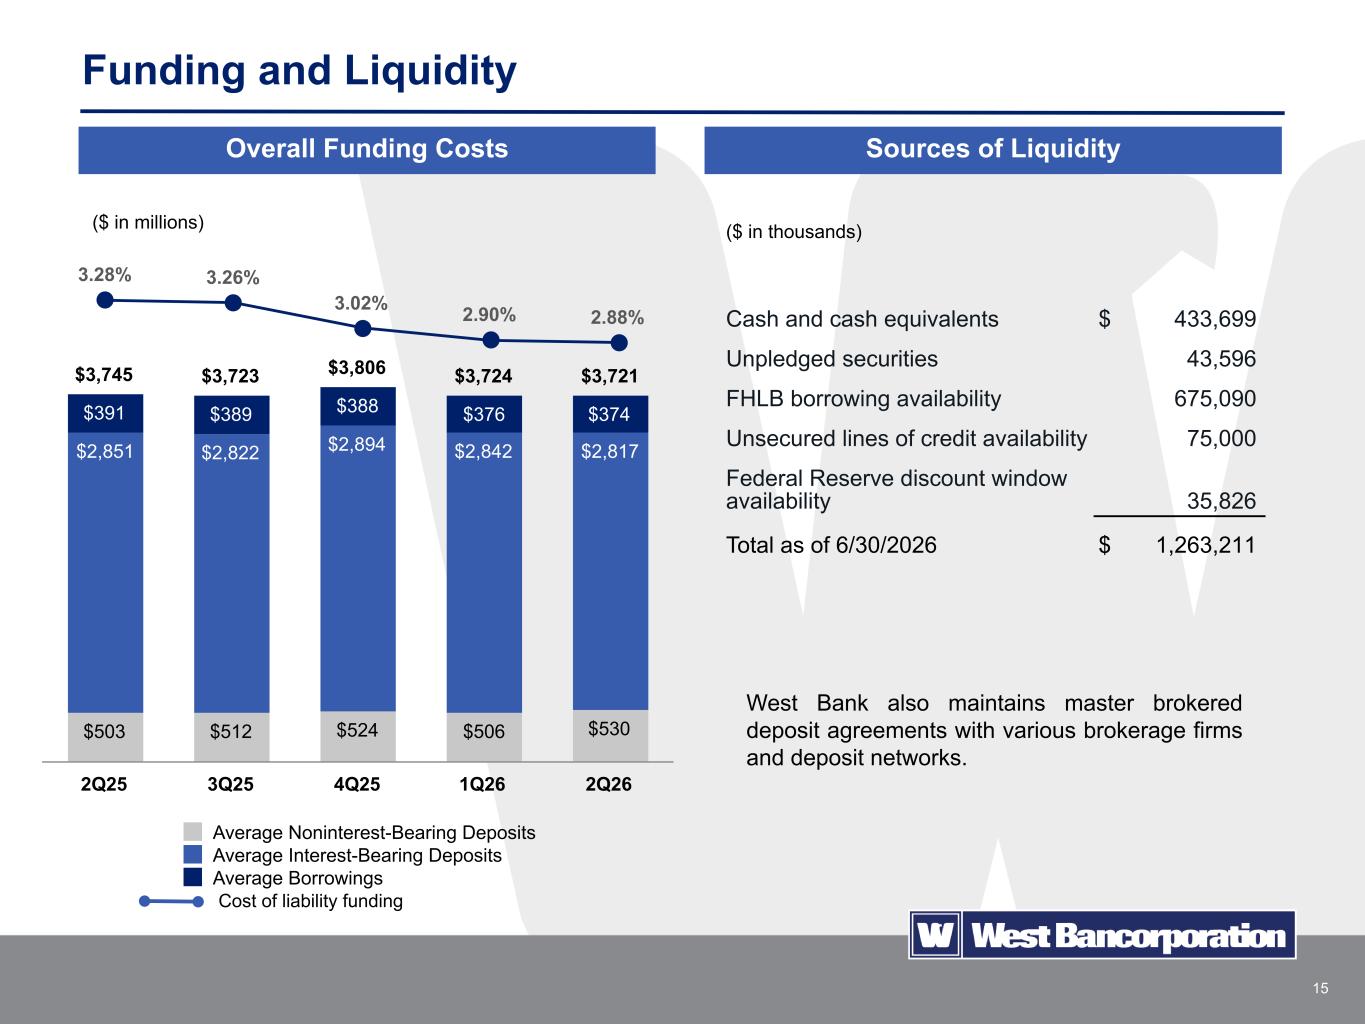
15 Funding and Liquidity Cost of liability funding ($ in thousands) Cash and cash equivalents $ 433,699 Unpledged securities 43,596 FHLB borrowing availability 675,090 Unsecured lines of credit availability 75,000 Federal Reserve discount window availability 35,826 Total as of 6/30/2026 $ 1,263,211 $3,745 $3,723 $3,806 $3,724 $3,721 $503 $512 $524 $506 $530 $2,851 $2,822 $2,894 $2,842 $2,817 $391 $389 $388 $376 $374 Average Noninterest-Bearing Deposits Average Interest-Bearing Deposits Average Borrowings 2Q25 3Q25 4Q25 1Q26 2Q26 3.28% 3.26% 3.02% 2.90% 2.88% Overall Funding Costs Sources of Liquidity West Bank also maintains master brokered deposit agreements with various brokerage firms and deposit networks. ($ in millions)
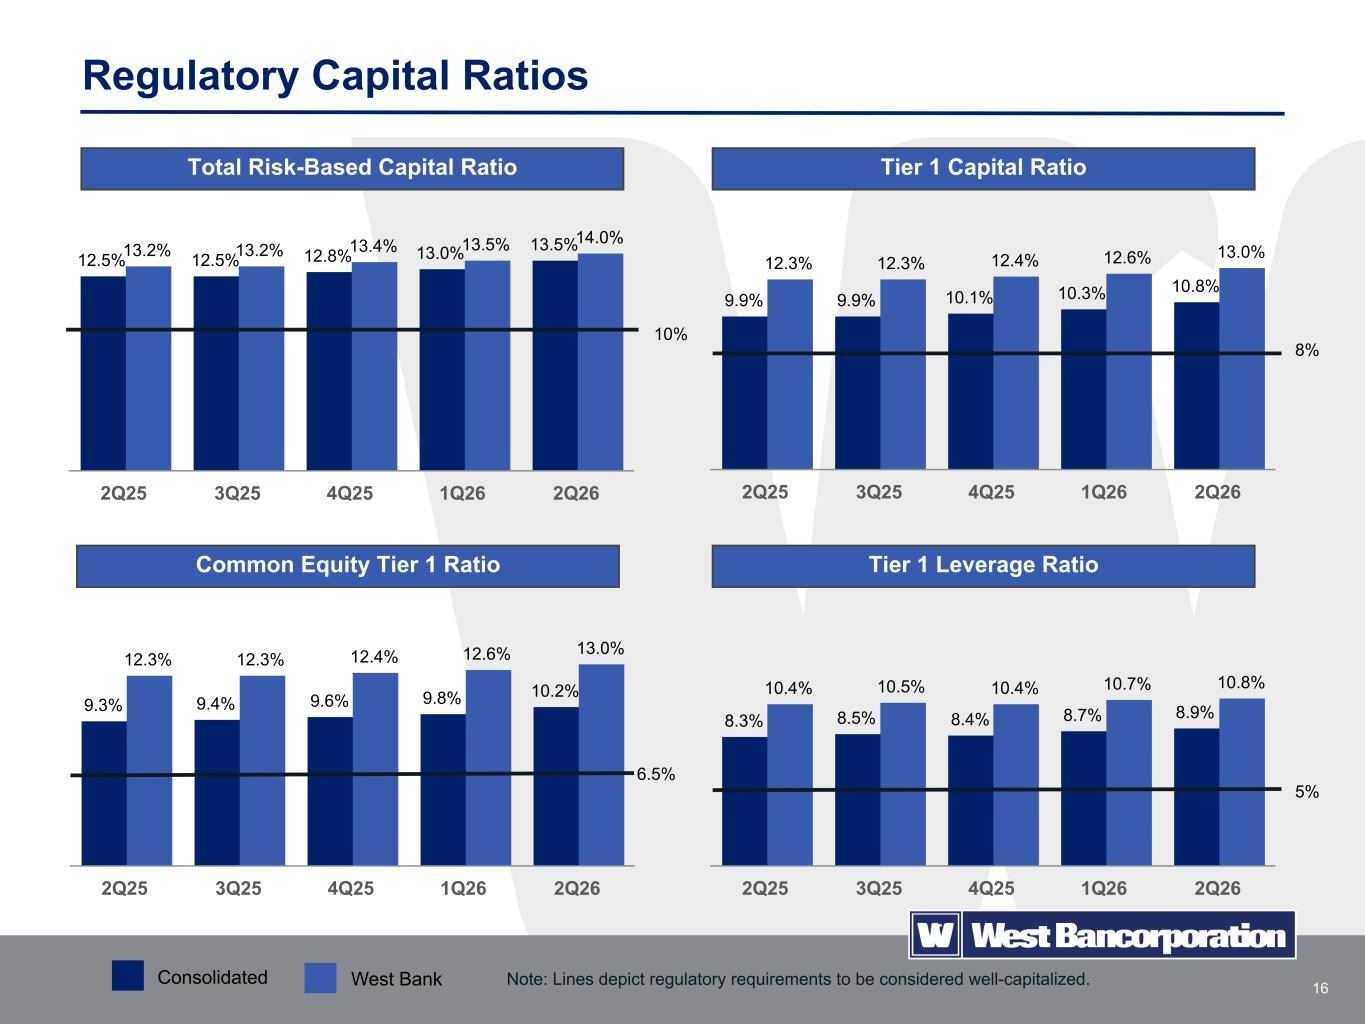
16 9.3% 9.4% 9.6% 9.8% 10.2% 12.3% 12.3% 12.4% 12.6% 13.0% 2Q25 3Q25 4Q25 1Q26 2Q26 8.3% 8.5% 8.4% 8.7% 8.9% 10.4% 10.5% 10.4% 10.7% 10.8% 2Q25 3Q25 4Q25 1Q26 2Q26 9.9% 9.9% 10.1% 10.3% 10.8% 12.3% 12.3% 12.4% 12.6% 13.0% 2Q25 3Q25 4Q25 1Q26 2Q26 12.5% 12.5% 12.8% 13.0% 13.5%13.2% 13.2% 13.4% 13.5% 14.0% 2Q25 3Q25 4Q25 1Q26 2Q26 Regulatory Capital Ratios Note: Lines depict regulatory requirements to be considered well-capitalized.Consolidated West Bank Total Risk-Based Capital Ratio Tier 1 Capital Ratio Common Equity Tier 1 Ratio Tier 1 Leverage Ratio 6.5% 10% 8% 5%
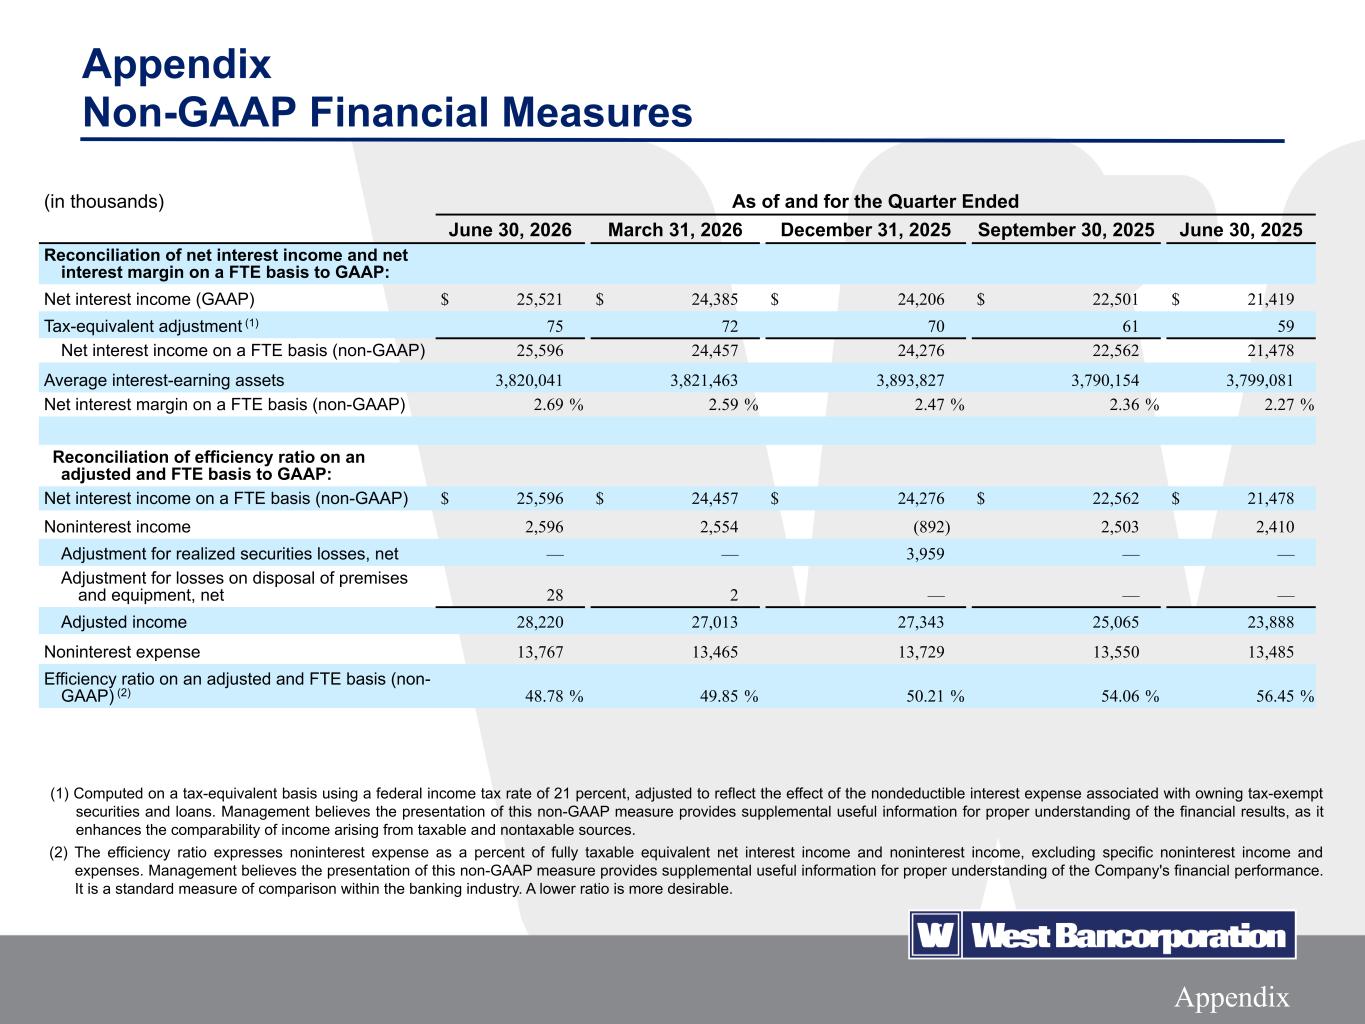
17Appendix Appendix Non-GAAP Financial Measures (in thousands) As of and for the Quarter Ended June 30, 2026 March 31, 2026 December 31, 2025 September 30, 2025 June 30, 2025 Reconciliation of net interest income and net interest margin on a FTE basis to GAAP: Net interest income (GAAP) $ 25,521 $ 24,385 $ 24,206 $ 22,501 $ 21,419 Tax-equivalent adjustment (1) 75 72 70 61 59 Net interest income on a FTE basis (non-GAAP) 25,596 24,457 24,276 22,562 21,478 Average interest-earning assets 3,820,041 3,821,463 3,893,827 3,790,154 3,799,081 Net interest margin on a FTE basis (non-GAAP) 2.69 % 2.59 % 2.47 % 2.36 % 2.27 % Reconciliation of efficiency ratio on an adjusted and FTE basis to GAAP: Net interest income on a FTE basis (non-GAAP) $ 25,596 $ 24,457 $ 24,276 $ 22,562 $ 21,478 Noninterest income 2,596 2,554 (892) 2,503 2,410 Adjustment for realized securities losses, net — — 3,959 — — Adjustment for losses on disposal of premises and equipment, net 28 2 — — — Adjusted income 28,220 27,013 27,343 25,065 23,888 Noninterest expense 13,767 13,465 13,729 13,550 13,485 Efficiency ratio on an adjusted and FTE basis (non- GAAP) (2) 48.78 % 49.85 % 50.21 % 54.06 % 56.45 % (1) Computed on a tax-equivalent basis using a federal income tax rate of 21 percent, adjusted to reflect the effect of the nondeductible interest expense associated with owning tax-exempt securities and loans. Management believes the presentation of this non-GAAP measure provides supplemental useful information for proper understanding of the financial results, as it enhances the comparability of income arising from taxable and nontaxable sources. (2) The efficiency ratio expresses noninterest expense as a percent of fully taxable equivalent net interest income and noninterest income, excluding specific noninterest income and expenses. Management believes the presentation of this non-GAAP measure provides supplemental useful information for proper understanding of the Company's financial performance. It is a standard measure of comparison within the banking industry. A lower ratio is more desirable.