Second Quarter 2026 Earnings Presentation July 23, 2026
Certain matters set forth herein constitute “forward-looking statements” within the meaning of Section 21E of the Securities Exchange Act of 1934, as amended, and Rule 3b-6 promulgated thereunder. All statements that are not statements of historical fact are forward-looking, and readers should not construe these statements of assurances of expected or intended results, or of promises that management will take a given course of action or pursue the currently expected strategies and objectives. Forward-looking statements in this report include comments about the Company’s current business plans and expectations regarding future operating results, as well as management’s statements about expected future events and economic developments, plans, strategies and objectives. All such statements reflect the current intentions, beliefs and expectations of the Company’s executive management based on currently available information and current and expected market conditions. Forward-looking statements can sometimes be identified by the use of forward-looking language, such as “likely result in,” “expects,” “anticipates,” “estimates,” “forecasts,” “projects,” “intends to,” or may include other similar words or phrases, such as “believes,” “plans,” “trend,” “objective,” “continues,” “remains,” or similar expressions, or future or conditional verbs, such as “will,” “would,” “should,” “could,” “may,” “might,” “can,” or similar verbs. Readers should not construe these statements as assurances of a given level of performance, or as promises that we will take the actions our management currently expects. Our forward-looking statements are subject to risks and uncertainties that could cause actual results, performance or achievements to differ materially from those projected or could cause us to change plans or strategies or otherwise to take actions that differ from those we currently expect. The known risks and uncertainties that may have these effects are described in Part II, Item 1A, of our Quarterly Report on Form 10-Q for the period ended March 31, 2026, and in our other filings with the Securities and Exchange Commission. You should read all forward-looking statements in the context of the foregoing and should not consider them to be reliable predictions of future events or as assurances of a particular level of performance or intended course of action. Any forward-looking statement speaks only as of the date on which it is made, and we do not undertake any obligation to update or review any forward-looking statement, whether as a result of new information, future developments or otherwise. Cautionary Note Regarding Forward-Looking Statements 2
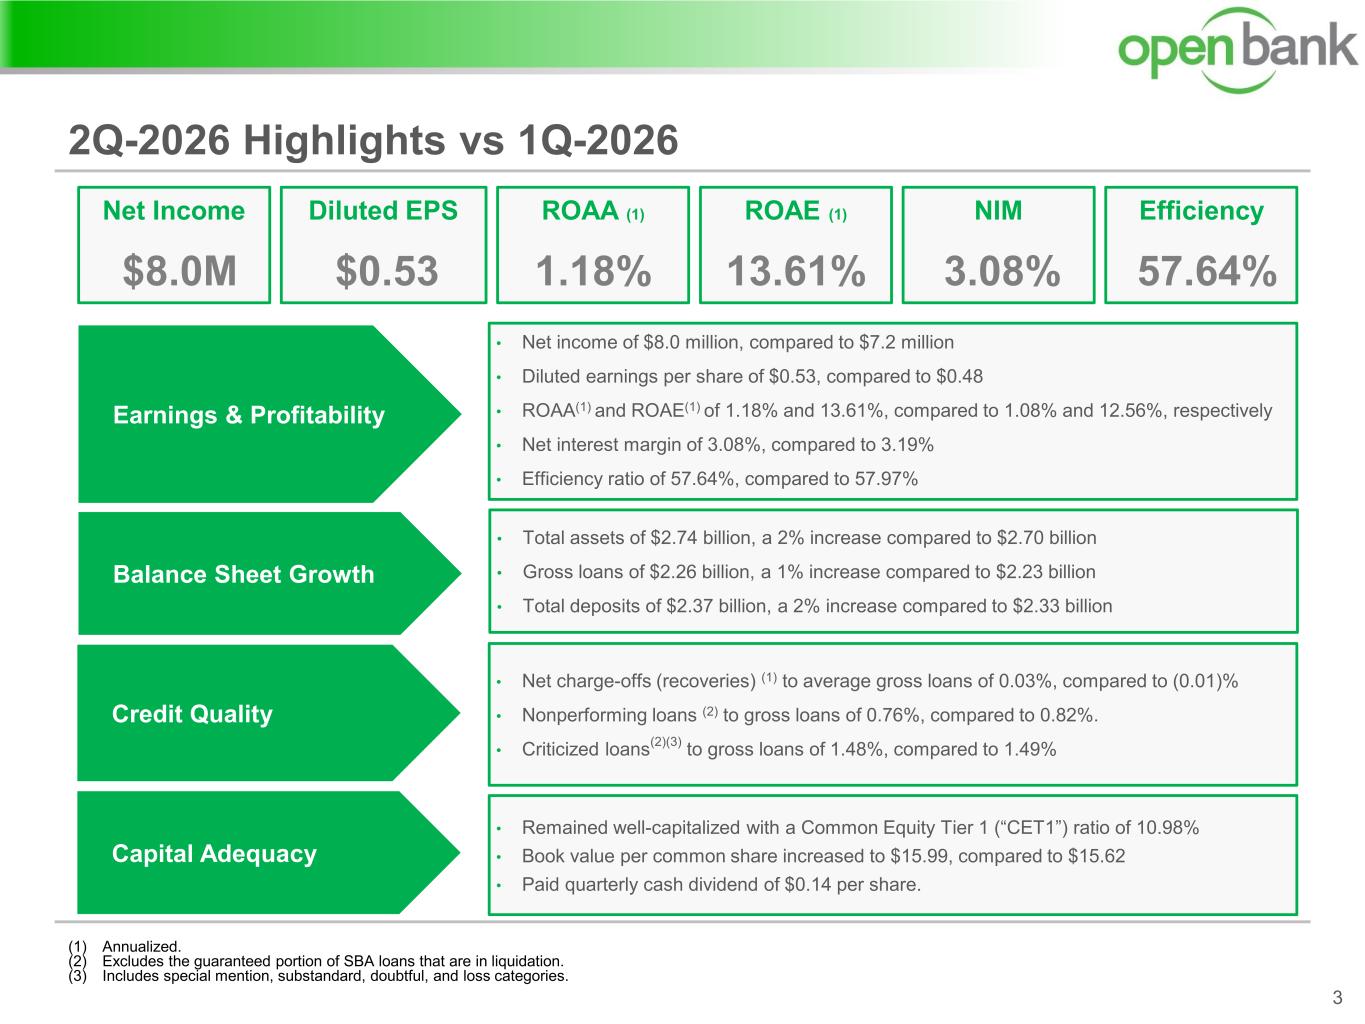
2Q-2026 Highlights vs 1Q-2026 3 (1) Annualized. (2) Excludes the guaranteed portion of SBA loans that are in liquidation. (3) Includes special mention, substandard, doubtful, and loss categories. Net Income $8.0M Earnings & Profitability Balance Sheet Growth Credit Quality Capital Adequacy • Net income of $8.0 million, compared to $7.2 million • Diluted earnings per share of $0.53, compared to $0.48 • ROAA(1) and ROAE(1) of 1.18% and 13.61%, compared to 1.08% and 12.56%, respectively • Net interest margin of 3.08%, compared to 3.19% • Efficiency ratio of 57.64%, compared to 57.97% • Total assets of $2.74 billion, a 2% increase compared to $2.70 billion • Gross loans of $2.26 billion, a 1% increase compared to $2.23 billion • Total deposits of $2.37 billion, a 2% increase compared to $2.33 billion • Net charge-offs (recoveries) (1) to average gross loans of 0.03%, compared to (0.01)% • Nonperforming loans (2) to gross loans of 0.76%, compared to 0.82%. • Criticized loans (2)(3) to gross loans of 1.48%, compared to 1.49% • Remained well-capitalized with a Common Equity Tier 1 (“CET1”) ratio of 10.98% • Book value per common share increased to $15.99, compared to $15.62 • Paid quarterly cash dividend of $0.14 per share. Diluted EPS $0.53 ROAA (1) 1.18% ROAE (1) 13.61% NIM 3.08% Efficiency 57.64%
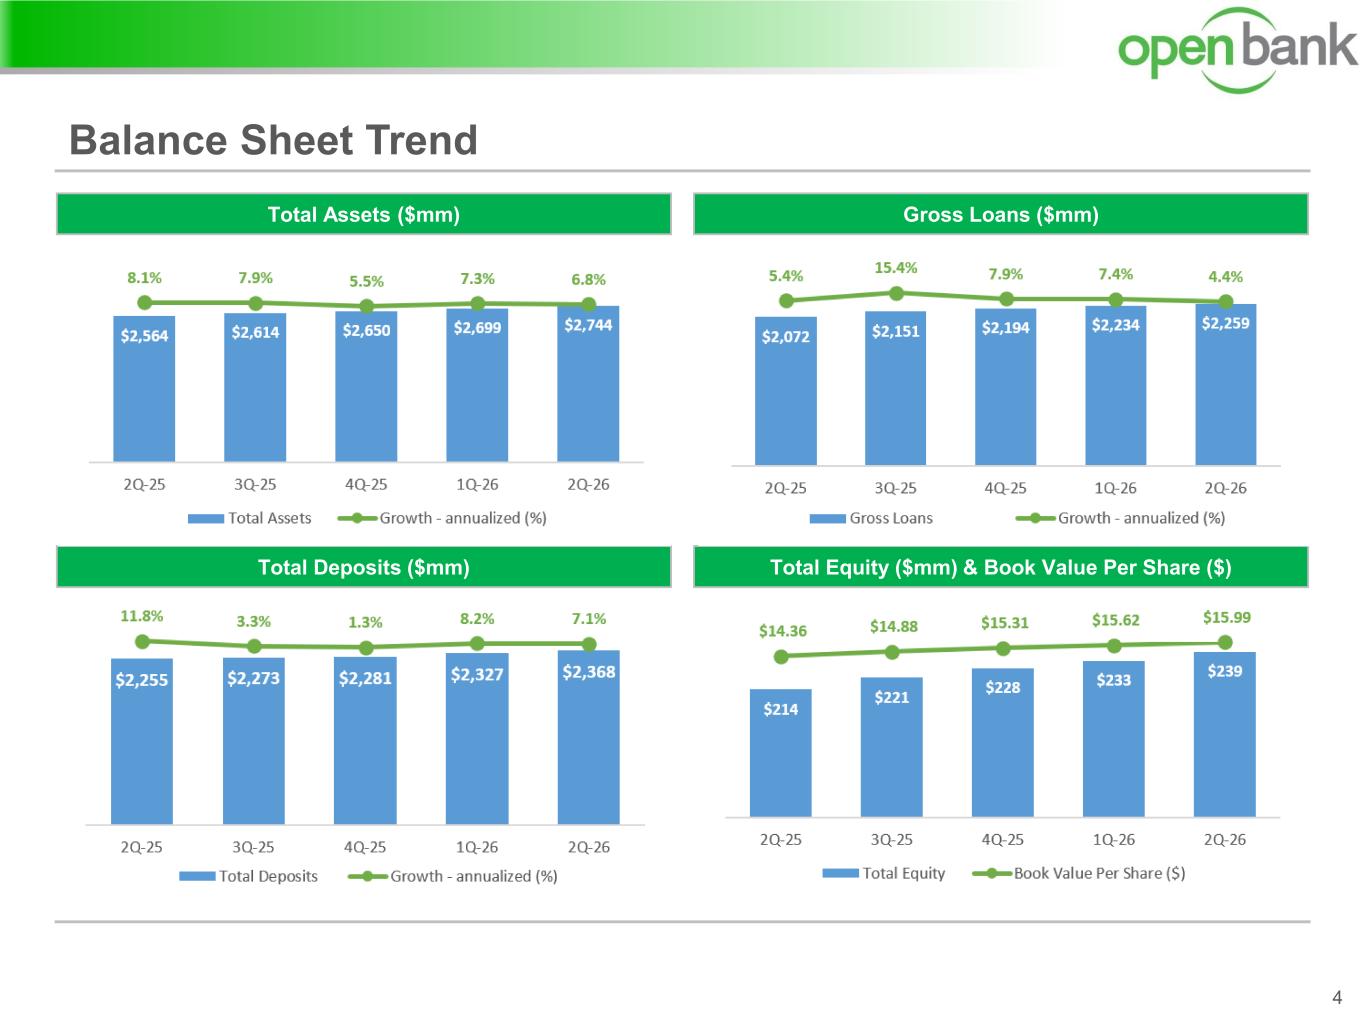
Balance Sheet Trend 4 Gross Loans ($mm)Total Assets ($mm) Total Equity ($mm) & Book Value Per Share ($)Total Deposits ($mm)
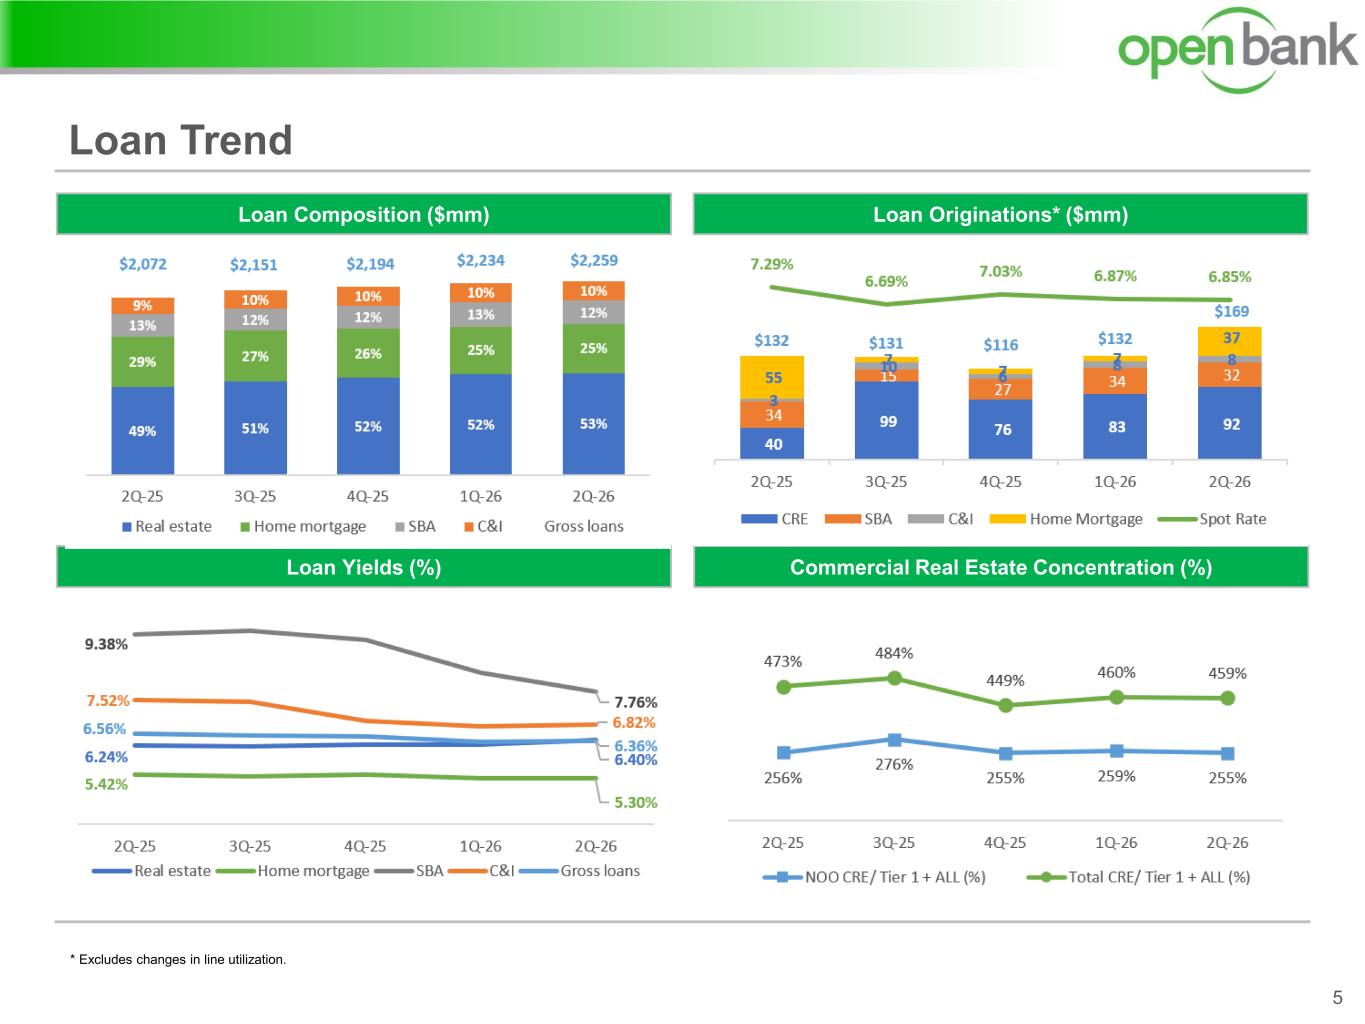
Loan Trend 5 Loan Originations* ($mm)Loan Composition ($mm) Loan Yields (%) Commercial Real Estate Concentration (%) * Excludes changes in line utilization.
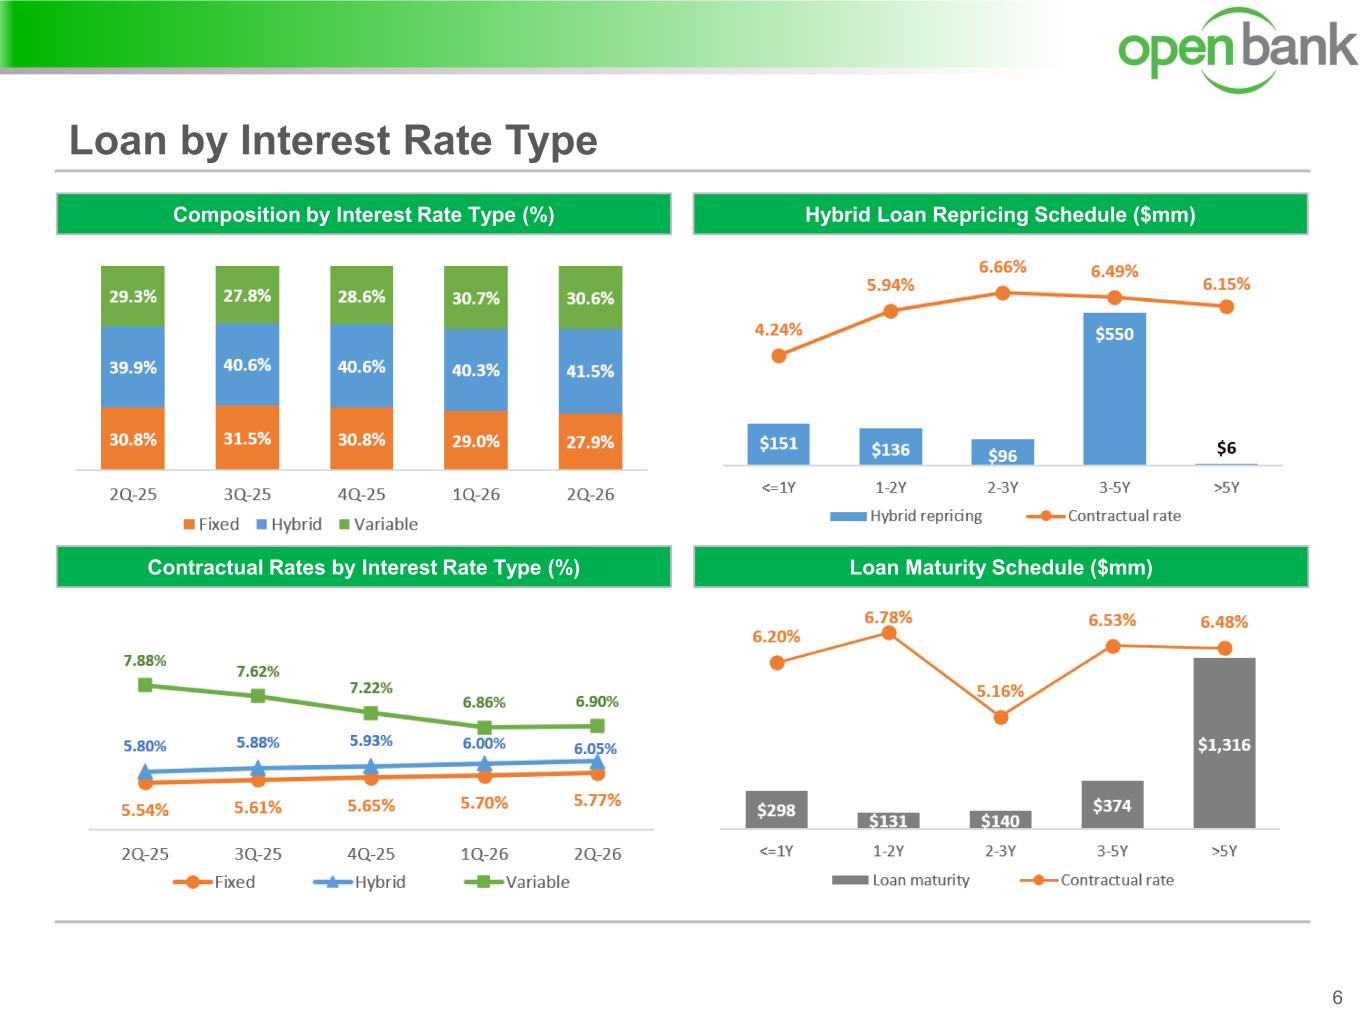
Loan by Interest Rate Type 6 Hybrid Loan Repricing Schedule ($mm)Composition by Interest Rate Type (%) Contractual Rates by Interest Rate Type (%) Loan Maturity Schedule ($mm)
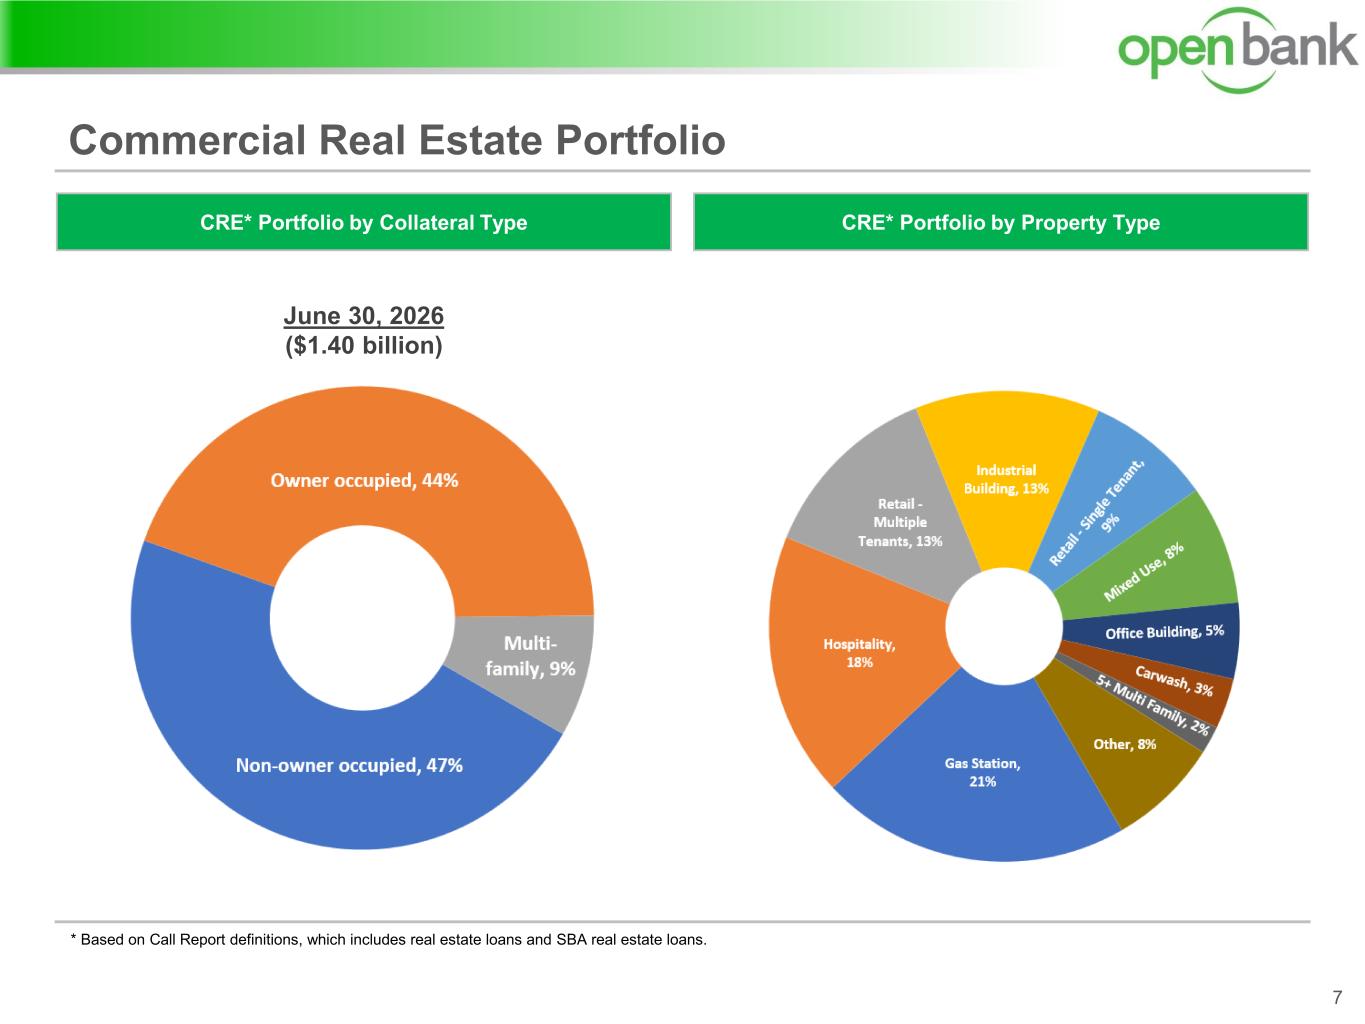
* Based on Call Report definitions, which includes real estate loans and SBA real estate loans. Commercial Real Estate Portfolio 7 CRE* Portfolio by Property TypeCRE* Portfolio by Collateral Type June 30, 2026 ($1.40 billion)
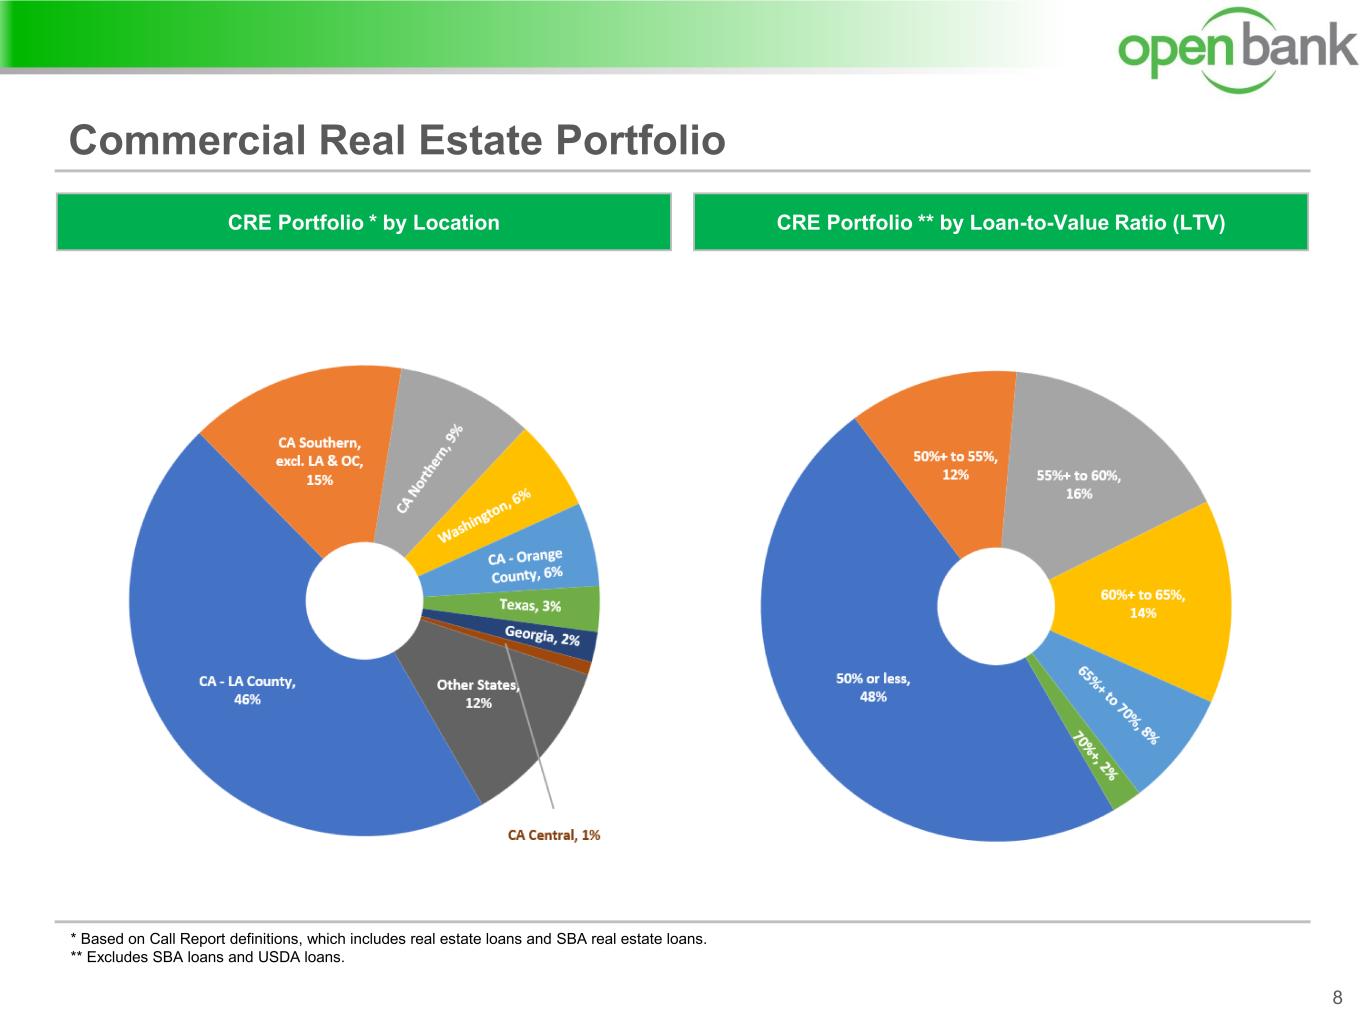
* Based on Call Report definitions, which includes real estate loans and SBA real estate loans. ** Excludes SBA loans and USDA loans. Commercial Real Estate Portfolio 8 CRE Portfolio ** by Loan-to-Value Ratio (LTV)CRE Portfolio * by Location
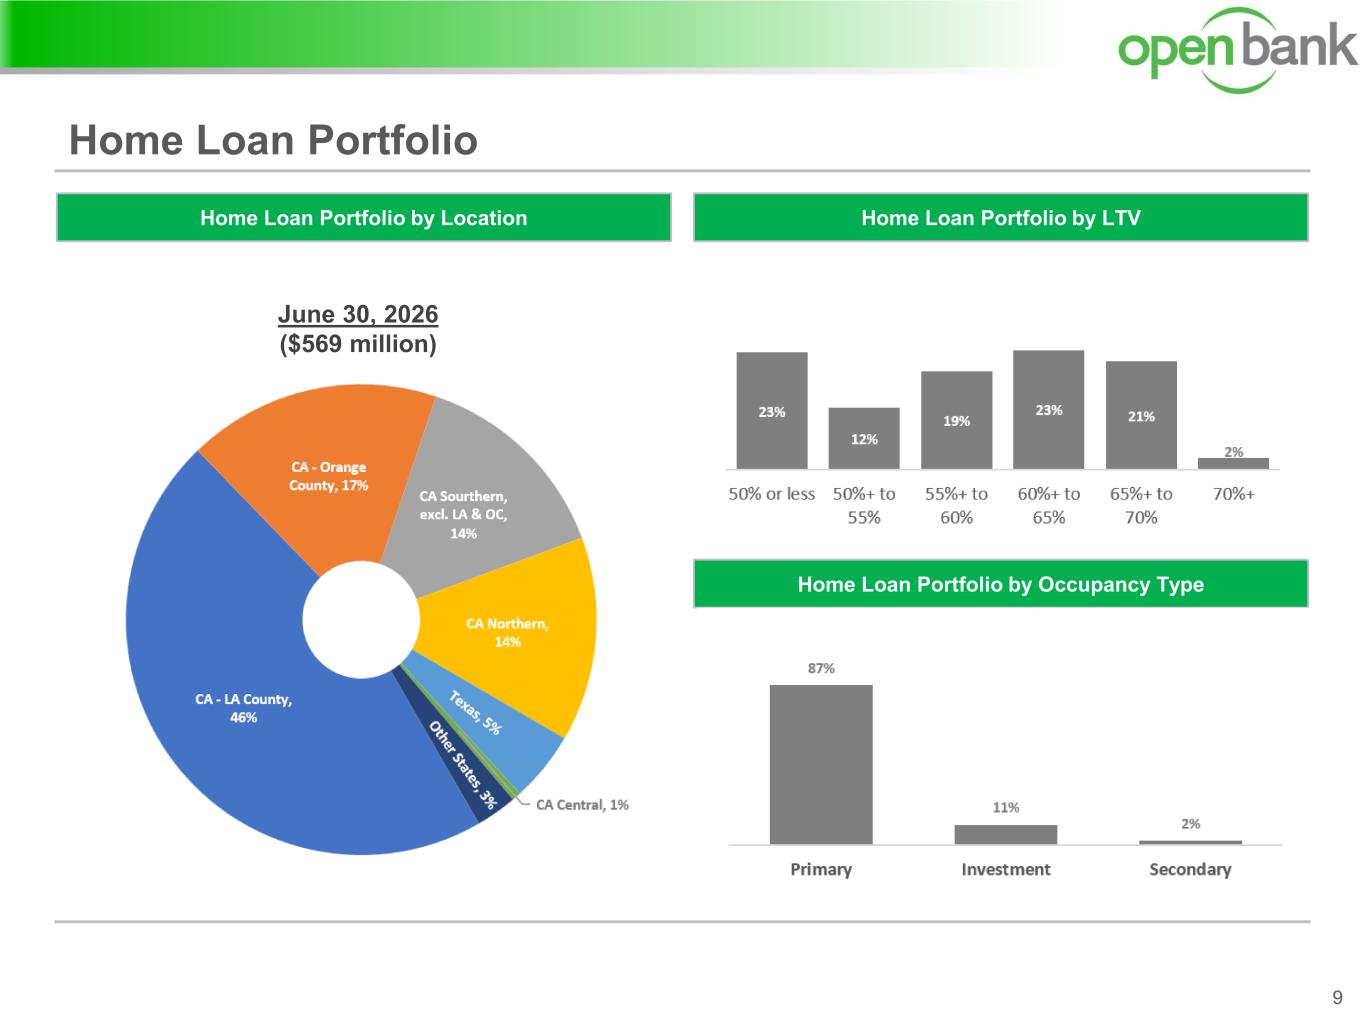
Home Loan Portfolio 9 Home Loan Portfolio by LTVHome Loan Portfolio by Location Home Loan Portfolio by Occupancy Type June 30, 2026 ($569 million)
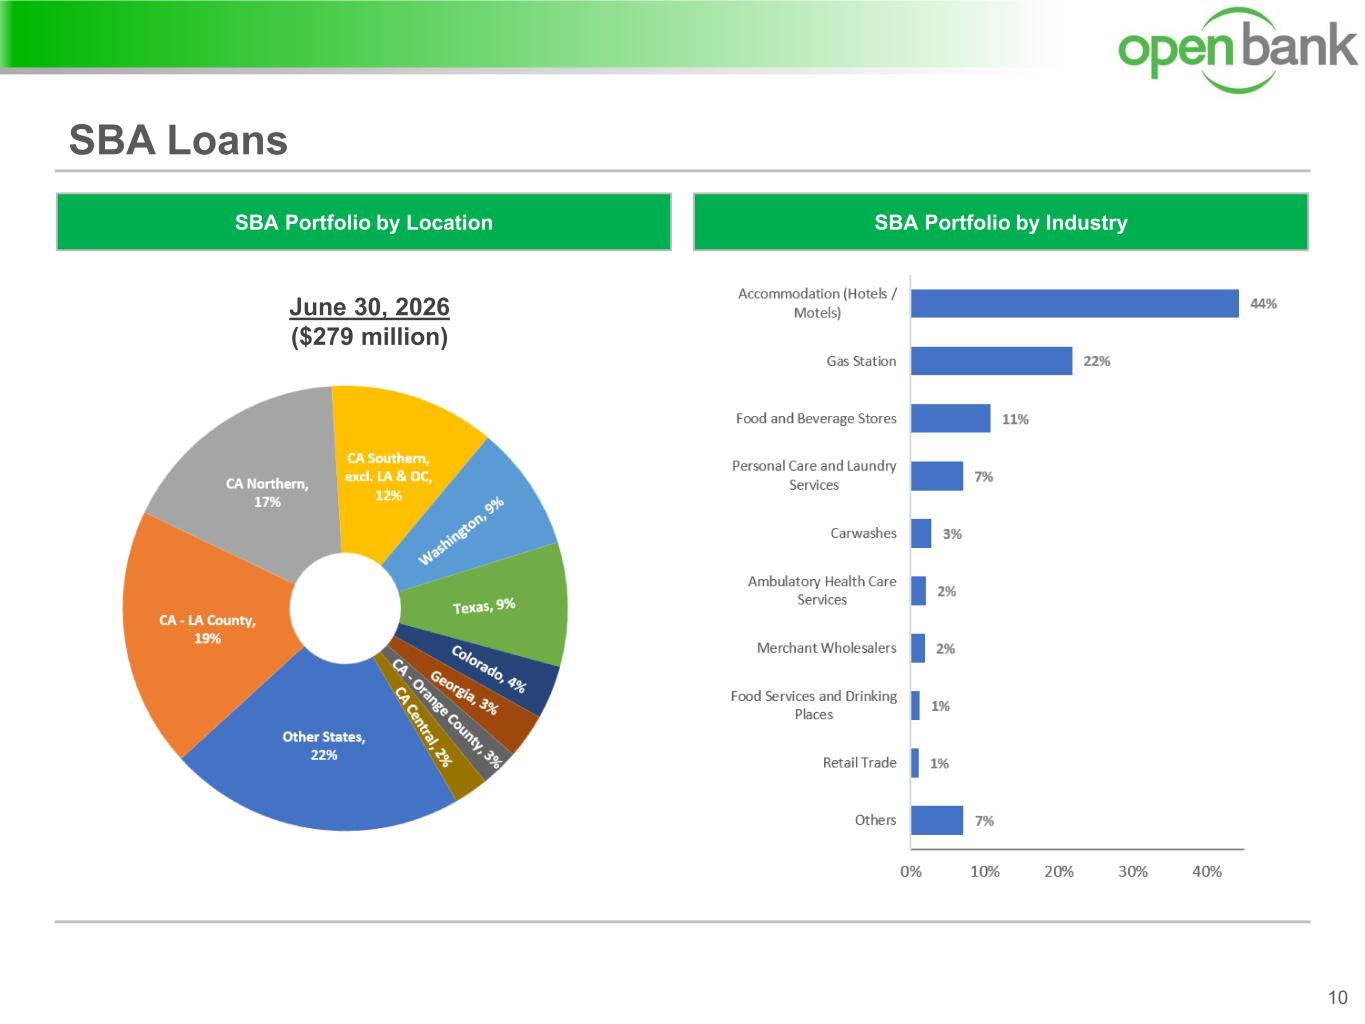
SBA Loans 10 SBA Portfolio by IndustrySBA Portfolio by Location June 30, 2026 ($279 million)
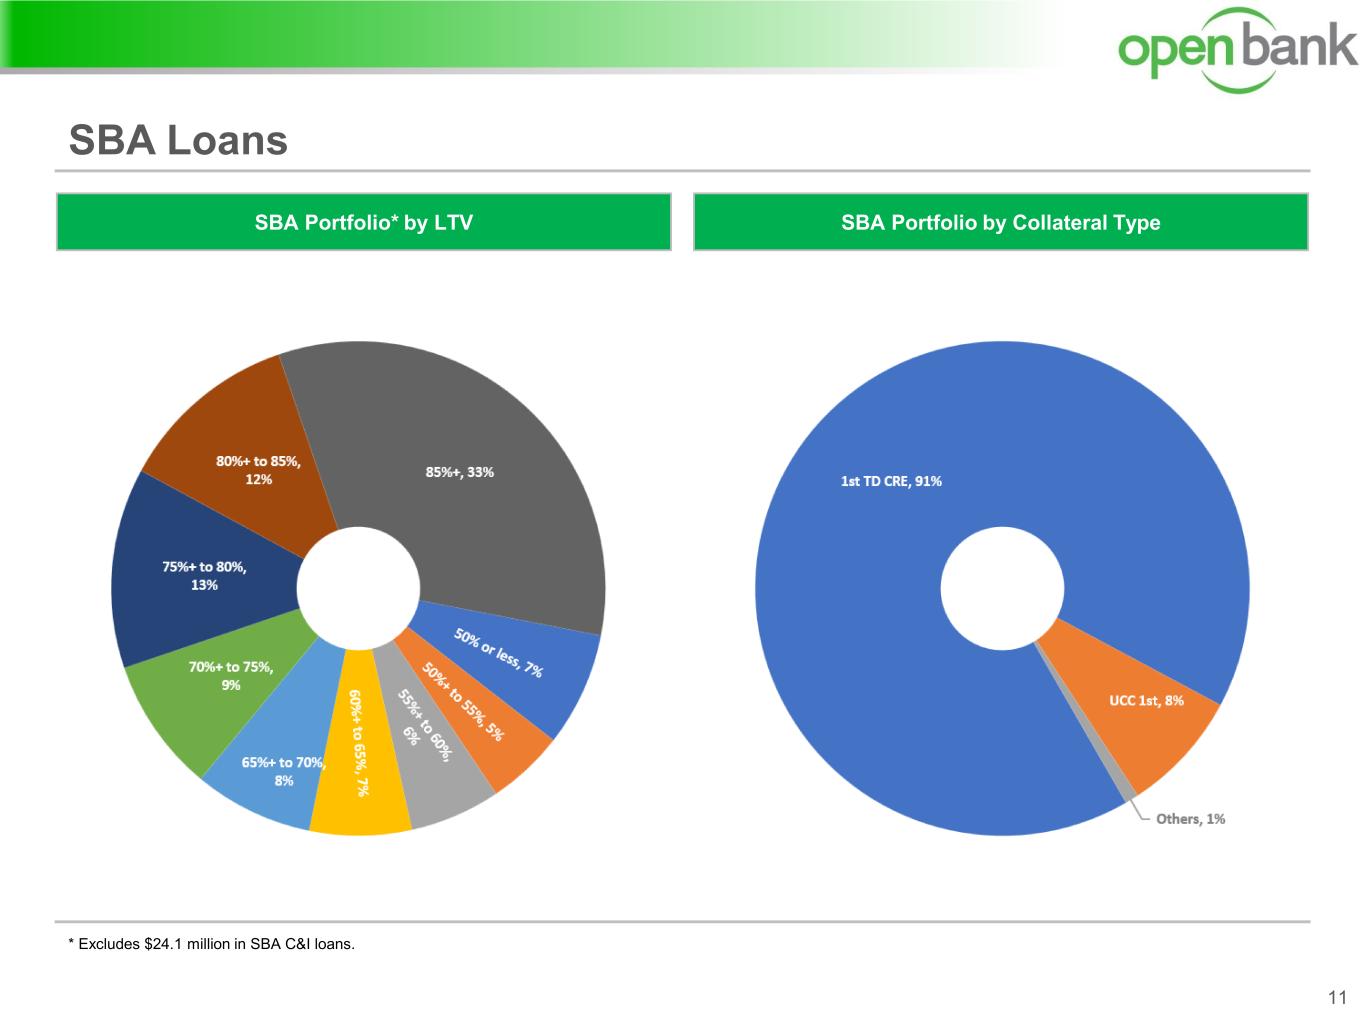
* Excludes $24.1 million in SBA C&I loans. SBA Loans 11 SBA Portfolio by Collateral TypeSBA Portfolio* by LTV
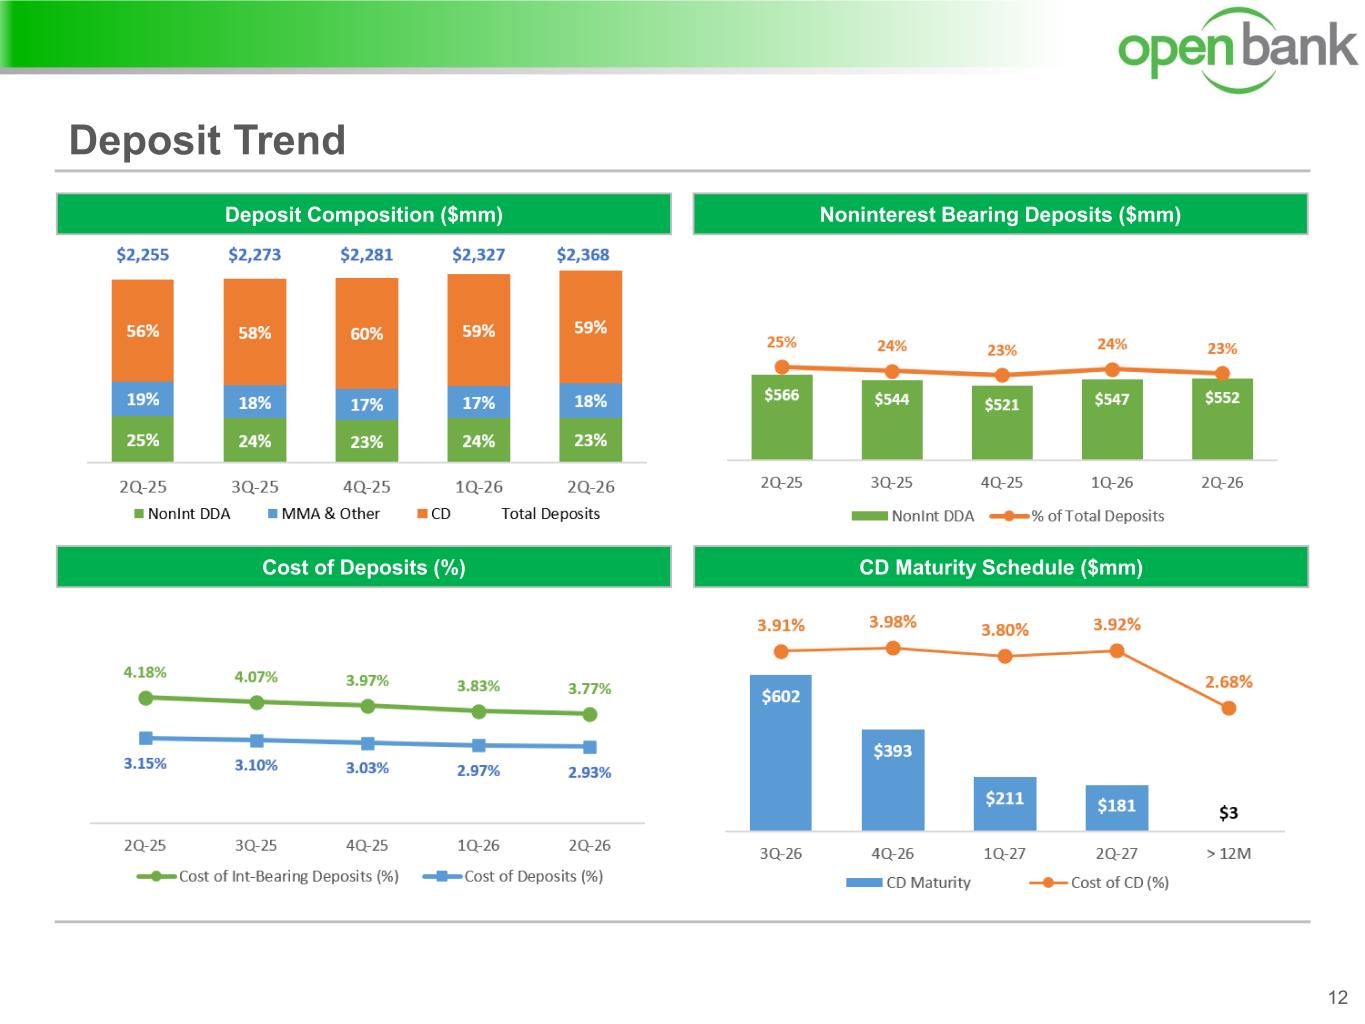
Deposit Trend 12 Noninterest Bearing Deposits ($mm)Deposit Composition ($mm) Cost of Deposits (%) CD Maturity Schedule ($mm)
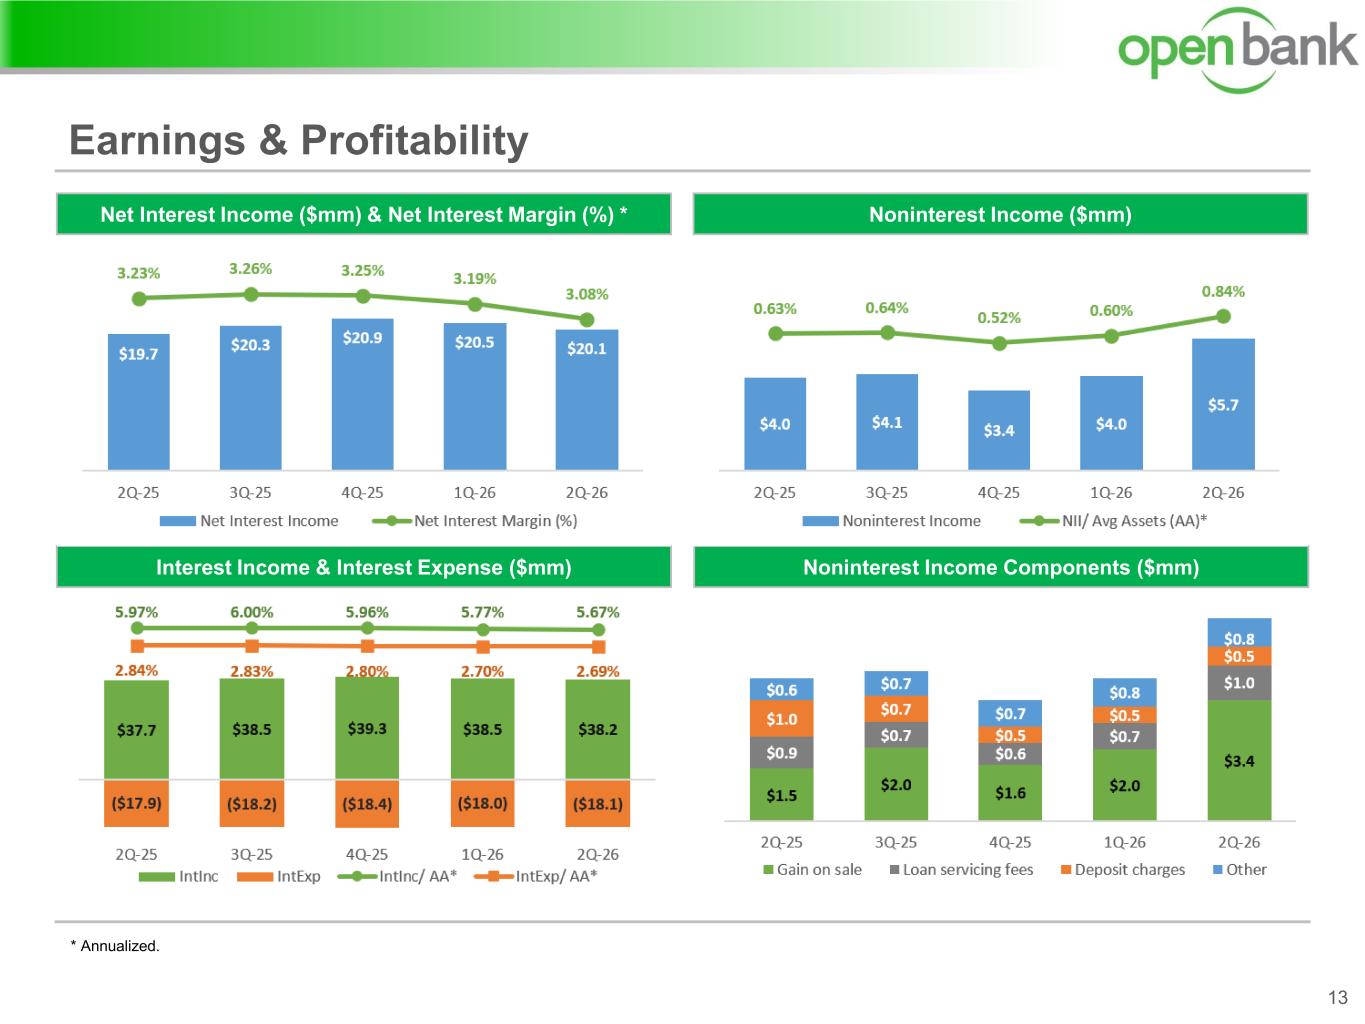
Earnings & Profitability 13 Noninterest Income ($mm)Net Interest Income ($mm) & Net Interest Margin (%) * Interest Income & Interest Expense ($mm) Noninterest Income Components ($mm) * Annualized.
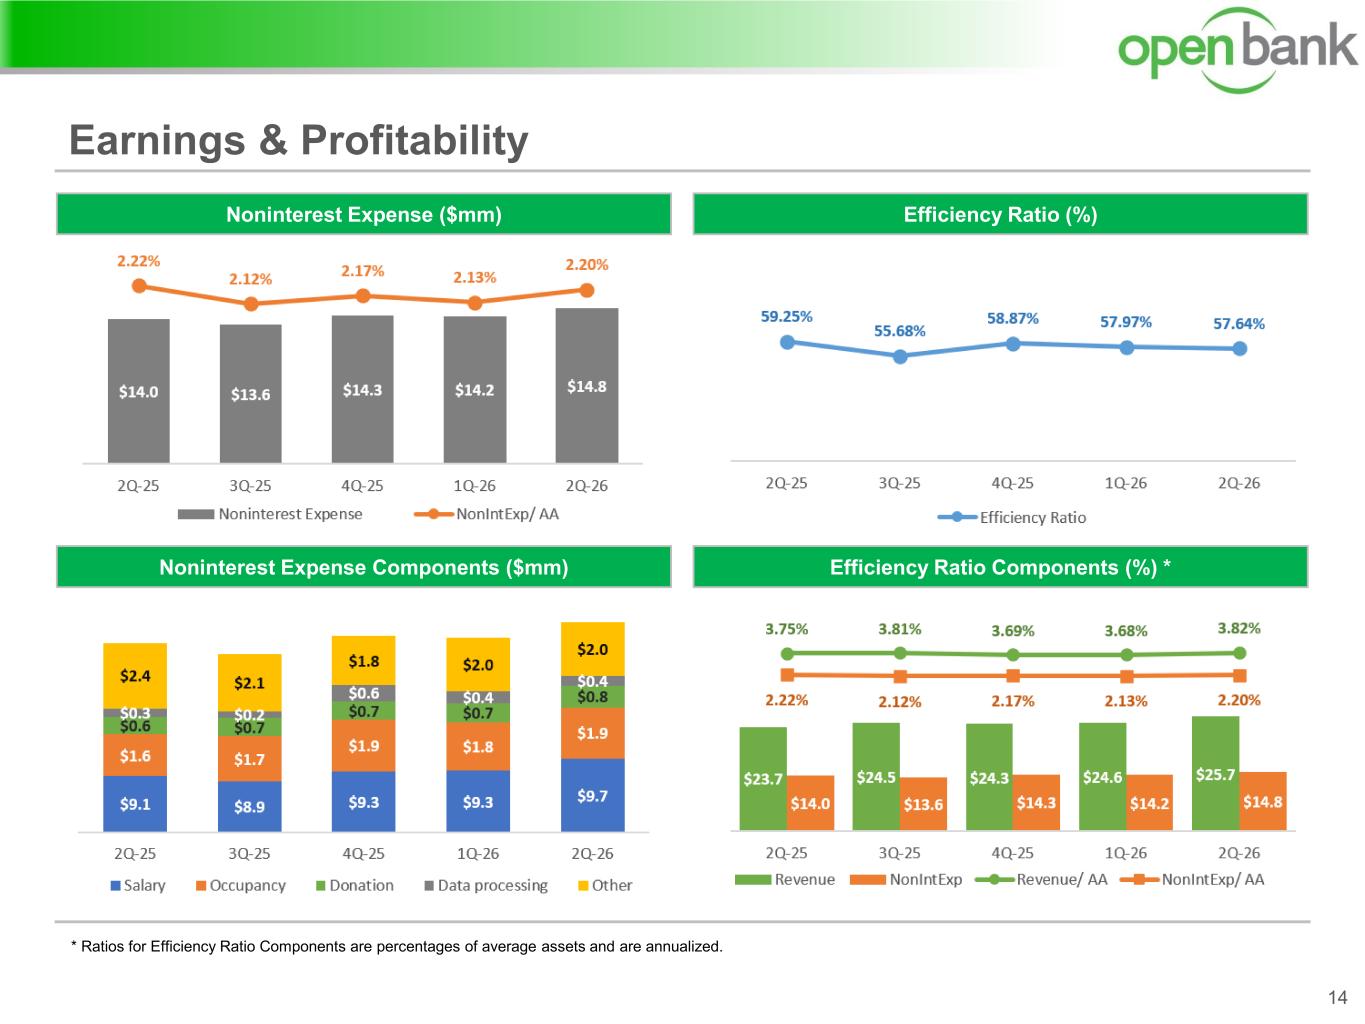
Earnings & Profitability 14 Efficiency Ratio (%)Noninterest Expense ($mm) Noninterest Expense Components ($mm) Efficiency Ratio Components (%) * * Ratios for Efficiency Ratio Components are percentages of average assets and are annualized.
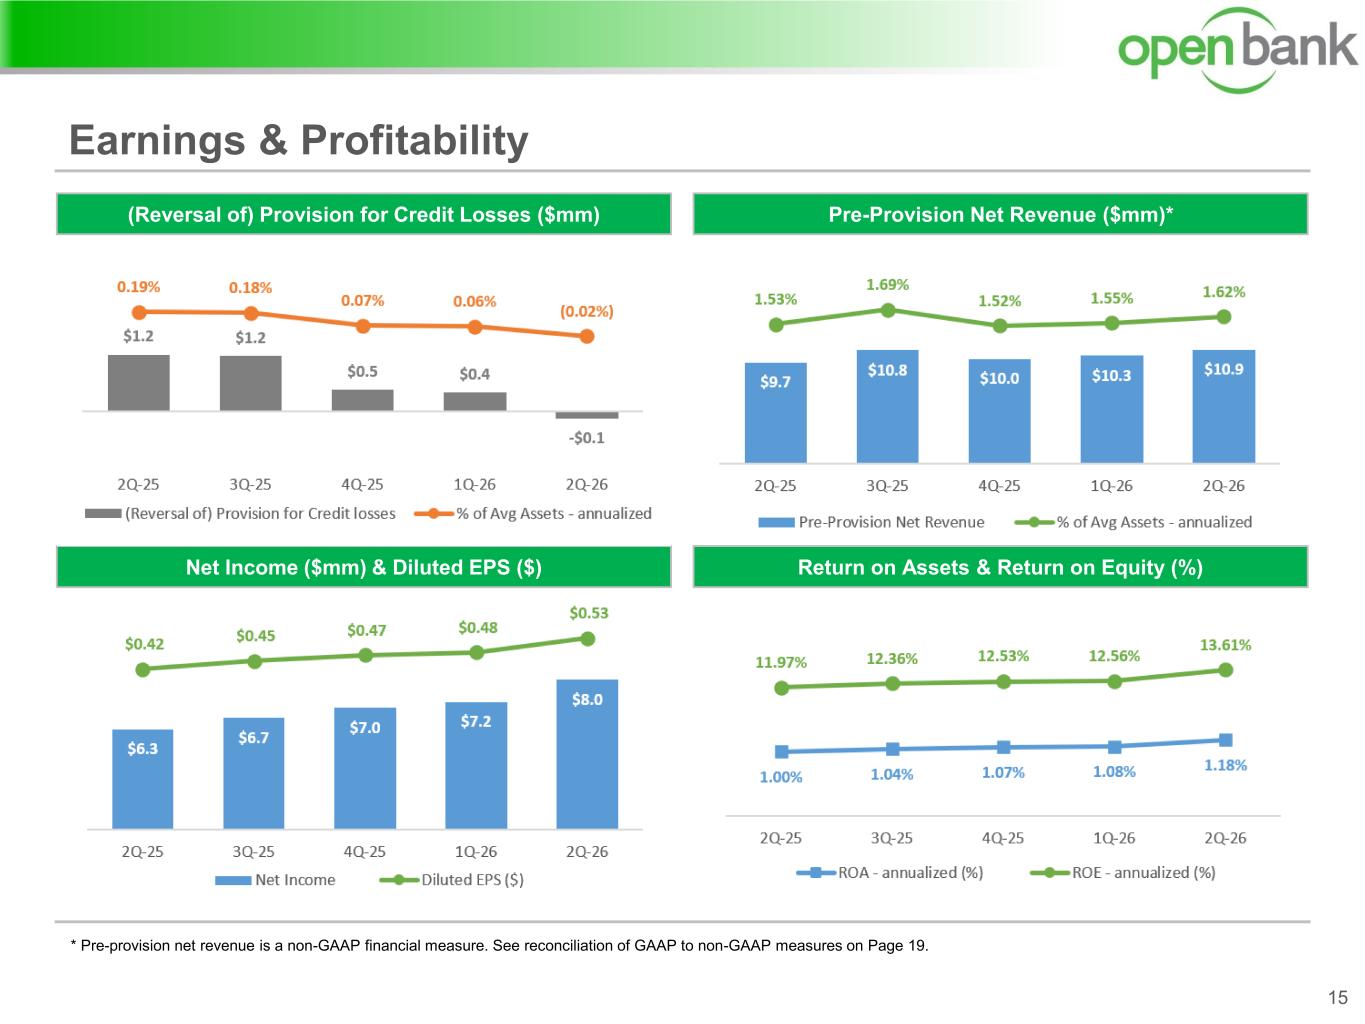
Earnings & Profitability 15 Pre-Provision Net Revenue ($mm)*(Reversal of) Provision for Credit Losses ($mm) Net Income ($mm) & Diluted EPS ($) Return on Assets & Return on Equity (%) * Pre-provision net revenue is a non-GAAP financial measure. See reconciliation of GAAP to non-GAAP measures on Page 19.
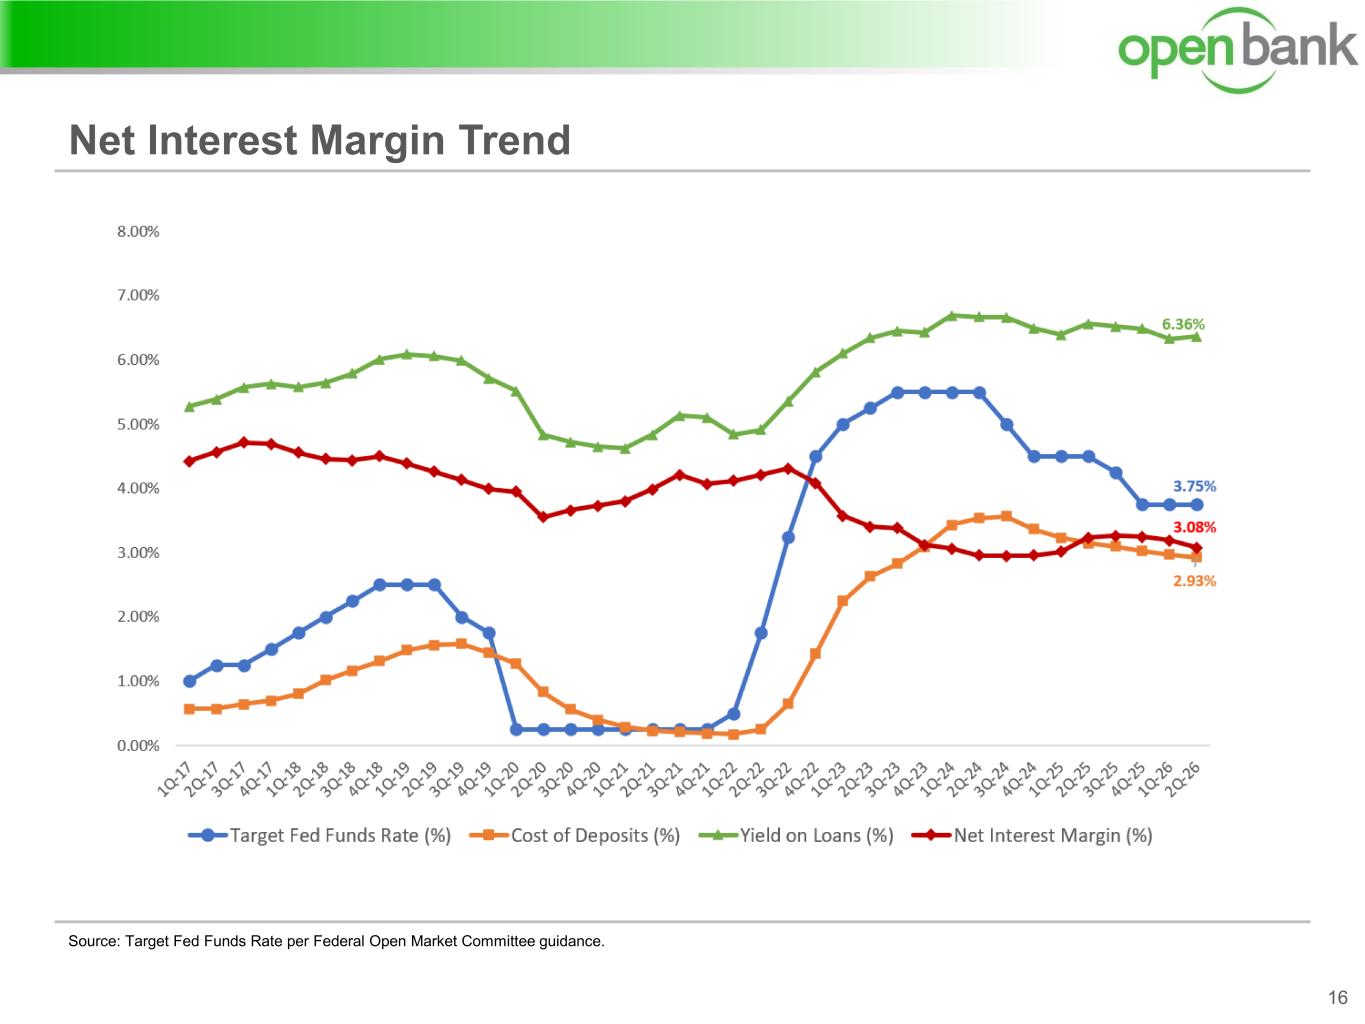
Source: Target Fed Funds Rate per Federal Open Market Committee guidance. Net Interest Margin Trend 16
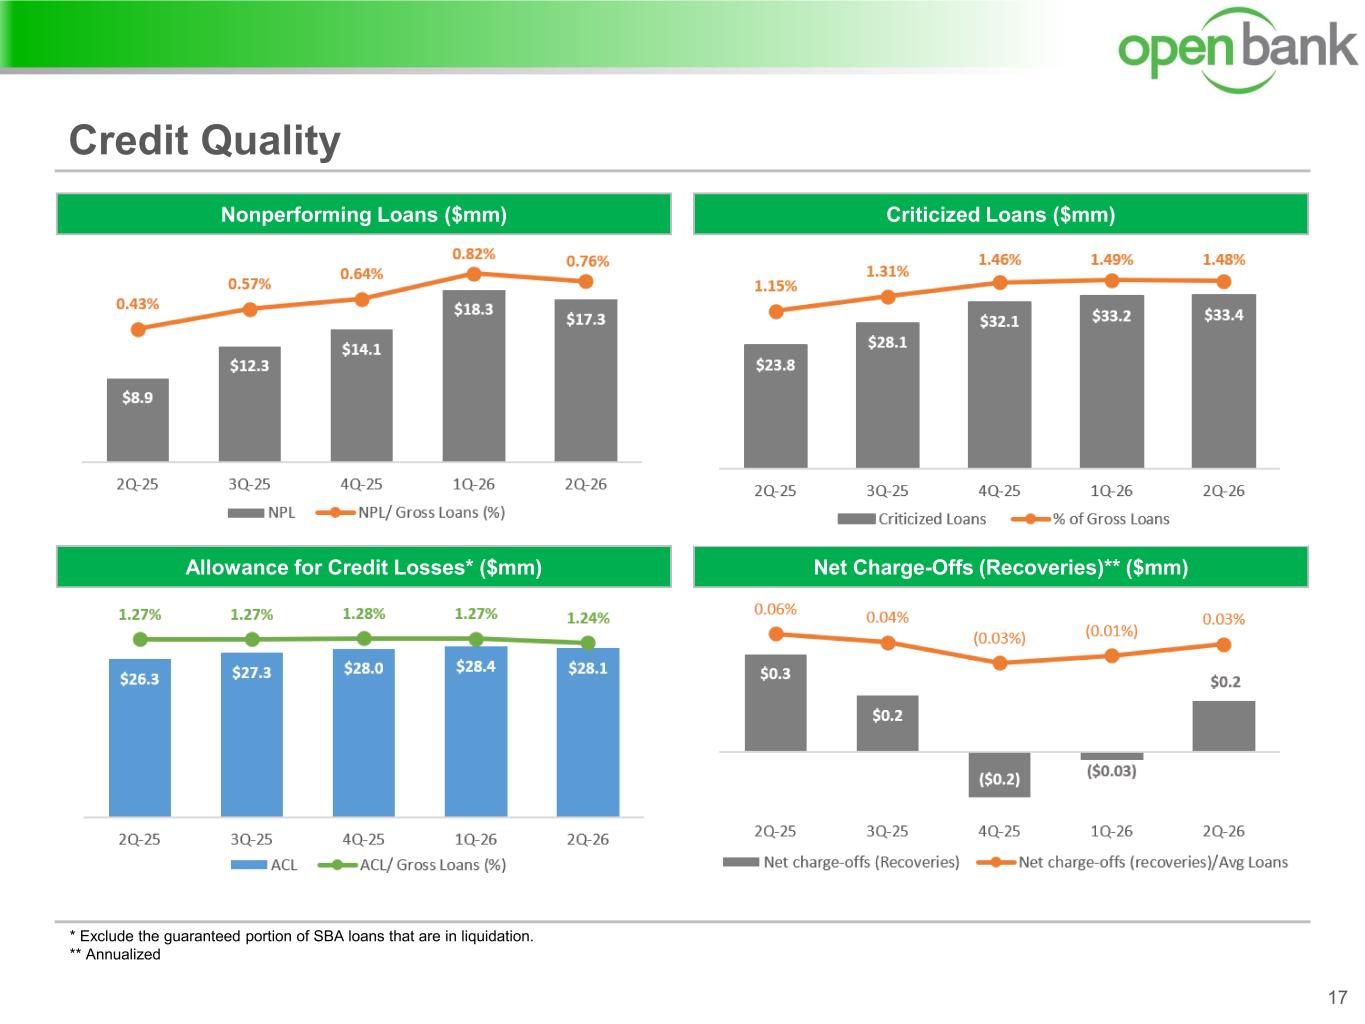
Credit Quality 17 Criticized Loans ($mm)Nonperforming Loans ($mm) Net Charge-Offs (Recoveries)** ($mm)Allowance for Credit Losses* ($mm) * Exclude the guaranteed portion of SBA loans that are in liquidation. ** Annualized
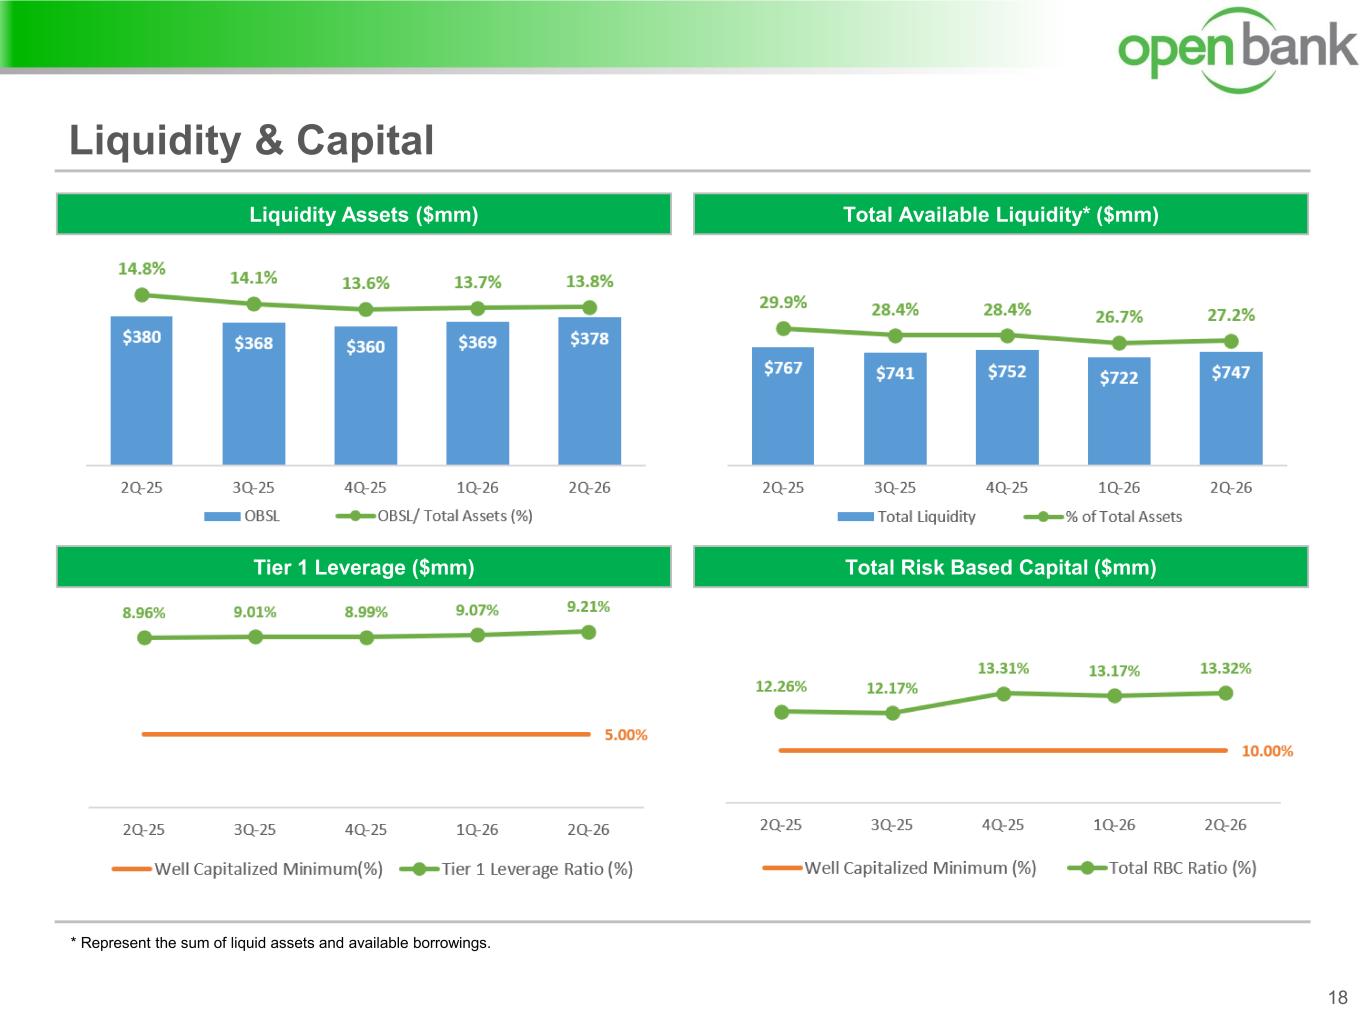
Liquidity & Capital 18 Total Available Liquidity* ($mm)Liquidity Assets ($mm) Tier 1 Leverage ($mm) Total Risk Based Capital ($mm) * Represent the sum of liquid assets and available borrowings.
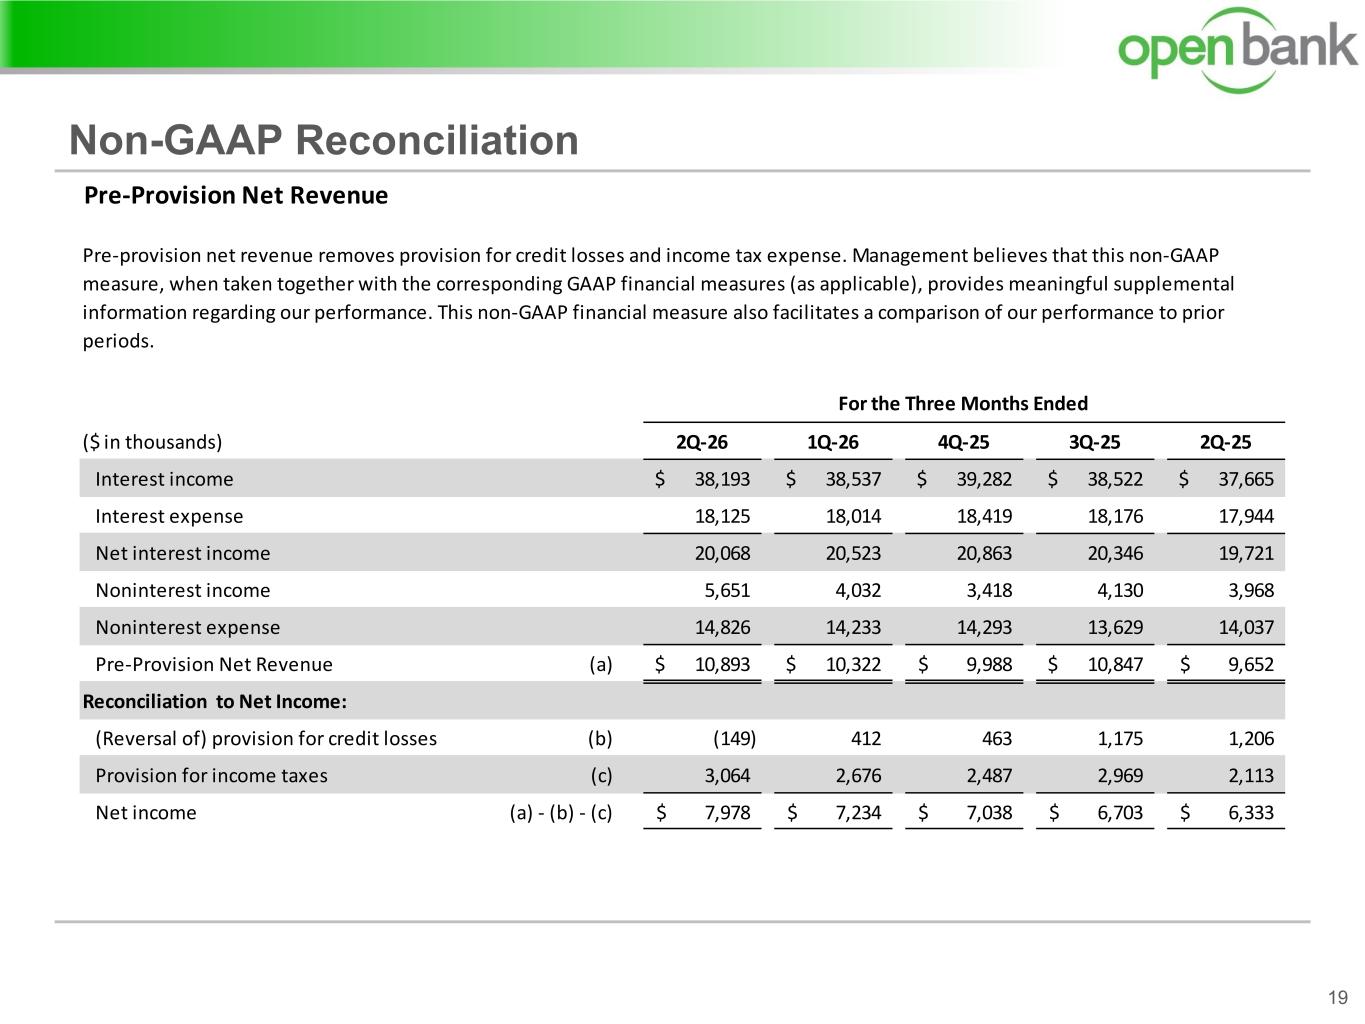
Non-GAAP Reconciliation 19 Pre-Provision Net Revenue ($ in thousands) 2Q-26 1Q-26 4Q-25 3Q-25 2Q-25 Interest income 38,193$ 38,537$ 39,282$ 38,522$ 37,665$ Interest expense 18,125 18,014 18,419 18,176 17,944 Net interest income 20,068 20,523 20,863 20,346 19,721 Noninterest income 5,651 4,032 3,418 4,130 3,968 Noninterest expense 14,826 14,233 14,293 13,629 14,037 Pre-Provision Net Revenue (a) 10,893$ 10,322$ 9,988$ 10,847$ 9,652$ Reconciliation to Net Income: (Reversal of) provision for credit losses (b) (149) 412 463 1,175 1,206 Provision for income taxes (c) 3,064 2,676 2,487 2,969 2,113 Net income (a) - (b) - (c) 7,978$ 7,234$ 7,038$ 6,703$ 6,333$ For the Three Months Ended Pre-provision net revenue removes provision for credit losses and income tax expense. Management believes that this non-GAAP measure, when taken together with the corresponding GAAP financial measures (as applicable), provides meaningful supplemental information regarding our performance. This non-GAAP financial measure also facilitates a comparison of our performance to prior periods.