Exhibit 2


LOGO

Second Quarter Results 2026


LOGO

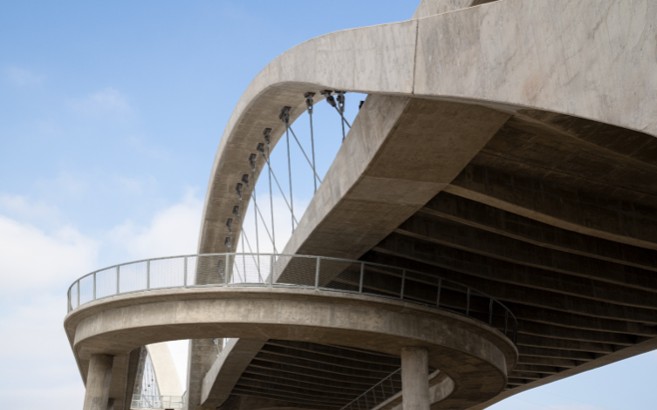
Sixth Street Viaduct, Los Angeles, United States


Stock Listing Information


NYSE (ADS)

Ticker: CX

Mexican Stock Exchange (CPO)

Ticker: CEMEX.CPO

Ratio of CEMEXCPO to CX = 10:1


Investor Relations


In the United States:

+ 1 877 7CX NYSE

In Mexico:

+ 52 (81) 8888 4327

E-Mail: ir@cemex.com


LOGO

Operating and financial highlights


           January - June           Second Quarter  
     2026     2025     % var     l-t-l
% var
    2026     2025     % var     l-t-l
% var
 

Consolidated volumes


Domestic gray cement

     21,492       21,311       1       11,311       11,212       1  

Ready-mix

     20,946       21,191       (1 %)        10,848       10,802       0  

Aggregates

     63,139       63,565       (1 %)        32,967       33,519       (2 %)   


Sales

     8,613       7,707       12     5     4,593       4,093       12     7

Gross profit

     2,938       2,522       16     20     1,618       1,398       16     30

as % of Sales

     34.1     32.7     1.4 pp        35.2     34.2     1.0pp    

Operating earnings before other income and expenses, net

     1,133       785       44     33     681       495       38     30

as % of Sales

     13.2     10.2     3.0pp         14.8     12.1     2.7pp    

SG&A expenses as % of Sales

     9.1     10.1     (1.0pp       9.0     9.7     (0.7pp  

Controlling interest net income (loss)

     574       1,052       (45 %)        347       318       9  

Operating EBITDA

     1,812       1,417       28     20     1,018       822       24     18

as % of Sales

     21.0     18.4     2.6pp         22.2     20.1     2.1pp    


Free cash Flow from Operations

     666       (67     N/A         637       204       212  


Total debt

     6,879       6,921       (1 %)        6,879       6,921       (1 %)   

Earnings (loss) of continuing operations per ADS

     0.40       0.73       (45 %)        0.24       0.22       10  

Fully diluted earnings (loss) of continuing operations per ADS

     0.39       0.72       (45 %)        0.24       0.22       10  

Average ADSs outstanding (1)

     1,461       1,470       (1 %)        1,459       1,469       (1 %)   

Employees

     38,495       42,108       (9 %)        38,495       42,108       (9 %)   


(1)

For purposes of this report, Average ADSs outstanding equals the total number of Series A shares and Series B shares outstanding as if they were all held in ADS form. The calculation of Average ADSs outstanding also includes the restricted ADSs allocated to eligible employees as variable compensation.

Cement and aggregates volumes in thousands of metric tons. Ready-mix volumes in thousands of cubic meters.

In millions of U.S. dollars, except volumes, percentages, employees, and per-ADS amounts. Average ADSs outstanding are presented in millions.


Consolidated Net Sales reached US$4.6 billion in 2Q26, a 7% increase from 2Q25 on a like-to-like basis, supported by positive performance in Mexico and EMEA.

Cost of sales, as a percentage of Net Sales, decreased by 1.1pp to 64.8% in 2Q26 compared with the same period last year, driven by efficiencies under Project Cutting Edge and a favorable energy environment.

Operating expenses, as a percentage of Net Sales, decreased 1.7pp in 2Q26 to 20.4%, mainly benefiting from overhead savings under Project Cutting Edge.

Operating EBITDA reached US$1,018 million in 2Q26, increasing 18% on a like-to-like basis, including a favorable one-off settlement of an outstanding claim in Europe of US$42 million. Additionally, growth reflects cost savings of US$60 million this quarter, along with organic growth in most of our regions.

Operating EBITDA margin in 2Q26 increased 2.1pp to 22.2% year-on-year. Expansion is largely explained by structural efficiencies, pricing discipline, benefits from operating leverage as volumes recover in Mexico, as well as the favorable one-off in Europe.

Controlling interest net income of US$347 million in 2Q26 increased 9% year-on-year driven by robust operating performance.


2026 Second Quarter Results    Page 2


LOGO

Operating results


Mexico


     January - June     Second Quarter  
     2026     2025     % var     l-t-l
% var
    2026     2025     % var     l-t-l
% var
 

Sales

     2,567       2,041       26     11     1,311       1,060       24     12

Operating EBITDA

     945       655       44     26     491       347       42     27

Operating EBITDA margin

     36.8     32.1     4.7pp         37.5     32.7     4.8pp    


In millions of U.S. dollars, except percentages.


     Domestic gray cement     Ready-mix     Aggregates  
Year-over-year percentage variation    January - June     Second Quarter     January - June     Second Quarter     January - June     Second Quarter  

Volume

     7     7     (4 %)      (2 %)      5     4

Price (USD)

     21     18     17     12     18     16

Price (local currency)

     6     6     3     2     4     5


Mexico delivered strong results supported by cost efficiencies, improving demand, operating leverage, and a pricing strategy designed to offset input cost inflation. Operating EBITDA rose 27% on a like-to-like basis while Operating EBITDA margin expanded by 4.8pp in the quarter. Efforts to identify savings and achieve a best in class business model continued to pay off.

For the second consecutive quarter, cement volumes posted year-over-year growth as self-construction and government-backed social programs, such as Rural Roads and housing, continued to underpin bagged cement demand, and residential demand drove bulk cement volumes.

The social housing program continues to scale and is a meaningful lever of growth in our business this quarter.

United States


     January - June     Second Quarter  
     2026     2025     % var     l-t-l
% var
    2026     2025     % var     l-t-l
% var
 

Sales

     2,511       2,496       1     1     1,315       1,306       1     1

Operating EBITDA

     438       468       (6 %)      (6 %)      248       279       (11 %)      (11 %) 

Operating EBITDA margin

     17.5     18.8     (1.3pp       18.9     21.3     (2.4pp  


In millions of U.S. dollars, except percentages.


     Domestic gray cement     Ready-mix     Aggregates  
Year-over-year percentage variation    January - June     Second Quarter     January - June     Second Quarter     January - June     Second Quarter  

Volume

     (1 %)      (0 %)      0     (2 %)      5     1

Price (USD)

     (2 %)      (2 %)      (1 %)      (0 %)      2     2

Price (local currency)

     (2 %)      (2 %)      (1 %)      (0 %)      2     2


In United States demand remained resilient despite unusually wet conditions in Texas and parts of the Mid-South. Adjusting for weather-related disruptions, we estimate that cement and ready-mix volumes would have both grown 1%, while aggregates would have expanded 7%. Cement volumes were supported by the integration of our new mortars business, Omega.

On a sequential basis, cement prices improved 1%, reflecting successful price increases across certain micro markets and geographic mix. In ready-mix, prices increased 2%, reflecting effective implementation of fuel surcharges. In aggregates, adjusted for mix, prices have increased at a mid-single-digit rate, compared to year-end 2025.

Disruptions in our operations related to bad weather in Texas, together with rising materials and freight costs, weighed on EBITDA and margin in the quarter.

Demand continues to be mainly led by infrastructure supported by the ongoing rollout of IIJA projects, while industrial demand, particularly related to the AI environment, continues to grow. Residential construction remains challenged by affordability constraints and elevated housing inventories in certain markets.


2026 Second Quarter Results    Page 3


LOGO

Operating results


Europe, Middle East and Africa


     January - June     Second Quarter  
     2026     2025     % var     l-t-l
% var
    2026     2025     % var     l-t-l
% var
 

Sales

     2,681       2,411       11     5     1,518       1,341       13     9

Operating EBITDA

     444       346       28     23     293       229       28     24

Operating EBITDA margin

     16.6     14.4     2.2pp         19.3     17.1     2.2pp    


In millions of U.S. dollars, except percentages.


     Domestic gray cement     Ready-mix     Aggregates  
Year-over-year percentage variation    January - June     Second Quarter     January - June     Second Quarter     January - June     Second Quarter  

Volume

     (4 %)      (4 %)      (0 %)      3     (6 %)      (4 %) 

Price (USD)

     6     3     13     11     11     9

Price (local currency) (*)

     3     3     4     4     5     5


The EMEA region delivered positive results, driven by a favorable one-off adjustment in Europe, cost efficiencies and pricing, resulting in an Operating EBITDA margin expansion of 2.2pp. Adjusting for the US$42 million one-off benefit, Operating EBITDA expanded 9%, with margin flat year-over-year as lower volumes weighed on results.

In Europe, country volume performance reflected meaningful divergence, with recent heatwaves, project delays and slower demand recovery impacting construction activity across several markets. Continued growth in cement volumes in Spain and the Czech Republic partially offset softer performance in other countries.

Sequentially, prices across our three core products showed a muted performance, explained by a geographic mix effect, as most of our markets saw stable to higher prices. On a cumulative basis, compared to 4Q25, cement and ready-mix prices are up 3%, and aggregates prices are up 7%.

In continental Europe, the introduction of the Carbon Border Adjustment Mechanism, together with the gradual reduction of free CO₂ allowances under the EU ETS have been and should continue to be supportive of higher prices.

The Middle East and Africa region continued delivering strong results, with EBITDA growing 34%, driven by Project Cutting Edge and improved pricing. Encouragingly, our operations remained resilient amid regional tensions.


(*)

Calculated on a volume-weighted-average basis at constant foreign exchange rates.


2026 Second Quarter Results    Page 4


LOGO

Operating results


South, Central America and the Caribbean


     January - June     Second Quarter  
     2026     2025     % var     l-t-l
% var
    2026     2025     % var     l-t-l
% var
 

Sales

     602       566       6     (1 %)      307       285       7     (1 %) 

Operating EBITDA

     133       105       27     19     66       50       34     25

Operating EBITDA margin

     22.0     18.5     3.5pp         21.7     17.4     4.3pp    


In millions of U.S. dollars, except percentages.


     Domestic gray cement     Ready-mix     Aggregates  
Year-over-year percentage variation    January - June     Second Quarter     January - June     Second Quarter     January - June     Second Quarter  

Volume

     2     1     (8 %)      (6 %)      (28 %)      (28 %) 

Price (USD)

     5     6     13     14     13     16

Price (local currency) (*)

     1     1     (1 %)      (1 %)      (1 %)      1


In South, Central America and the Caribbean we posted another strong quarter, with Operating EBITDA growing double digits, driven largely by disciplined cost management. These efforts translated into a robust margin expansion of 4.3pp.

Cement demand in the region was led by the informal sector, with Jamaica also benefiting from a pickup in reconstruction efforts related to last year’s hurricane Melissa as well as from tourism-related projects. Higher cement volumes in Colombia and Jamaica have offset softer performance in other markets.

We remain optimistic on the fundamentals of the region, supported by resilient informal construction.


(*)

Calculated on a volume-weighted-average basis at constant foreign-exchange rates.


2026 Second Quarter Results    Page 5


LOGO

Operating results


Operating EBITDA and Free Cash Flow from Operations


     January - June     Second Quarter  
     2026     2025     % var     2026     2025     % var  

Operating earnings before other expenses, net

     1,133       785       44     681       495       38

Depreciation and amortization of assets

     679       632         337       327    

Operating EBITDA

     1,812       1,417       28     1,018       822       24

Net Interest Paid

     (157     (210       (67     (103  

Maintenance capital expenditures & lease payments(1)

     (312     (381       (168     (208  

Change in working capital

     (502     (677       (49     (193  

Net Taxes Paid

     (144     (136       (79     (77  

Other cash expenditures

     (90     (153       (59     (79  

Proceeds from sales of fixed assets

     59       80         42       45    

Free cash flows from discontinued operations

     —        (6       —        (2  


Free cash Flow from Operations

     666       (67     N/A       637       204       212


In millions of U.S. dollars, except percentages.


(1)

Including lease payments of US$69 million in 2Q26 and US$73 million in 2Q25.


Net Debt Variation    YTD variation      Quarterly variation  

Net debt

     4Q25:        4,958        1Q26:        5,549  


Free Cash Flow from Operations (effect on Net Debt)

        (666         (637


Growth capital expenditures

        156           107  

Acquisitions and divestments

        259           59  

Investments in intangible assets

        70           33  

Coupons on subordinated notes

        77           15  

Dividends

        77           45  

Share buybacks

        100           —   

Redemption of 5.125% subordinated notes

        1,000           1,000  

Others net (1)

        195           53  


Net debt variation

        1,268           675  


Net debt

     2Q26:        6,225        2Q26:        6,225  


In millions of U.S. dollars.


(1)

Others, net is largely explained by the change in outstanding balance under securitization programs, activities related to our stock compensation plan, and contributions to pension plans.

Information on debt


     Second Quarter     First
Quarter
         Second Quarter  
     2026     2025     % var     2026          2026     2025  

Total debt (1)

     6,879       6,921       (1 %)      6,236     Currency denomination (3)     

Short-term

     6     13       10   U.S. dollar      81     69

Long-term

     94     87       90   Euro      14     21

Cash and cash equivalents

     654       1,166       (44 %)      687     Mexican peso      2     7


Net debt

     6,225       5,756       8     5,549     Other      3     3


           Interest rate (3)     
               

Leverage ratio (2)

     2.08       2.72         2.30     Fixed      83     66


           Variable      17     34


In millions of U.S. dollars, except percentages and ratios.


(1)

Includes leases, in accordance with International Financial Reporting Standards (IFRS).

(2)

Calculated based on Net debt plus subordinated notes.

(3)

Includes the effect of our interest rate and cross-currency derivatives, as applicable.


2026 Second Quarter Results    Page 6


LOGO

Operating results


Consolidated Statement of Operations & Statement of Financial Position

Cemex, S.A.B. de C.V. and Subsidiaries

(Thousands of U.S. dollars, except per ADS amounts)


     January - June     Second Quarter  

STATEMENT OF OPERATIONS

   2026     2025     % var     like-to-like
% var
    2026     2025     % var     like-to-like
% var
 

Sales

     8,612,510       7,706,754       12     5     4,593,416       4,092,536       12     7

Cost of sales

     (5,674,308     (5,184,568     (9 %)        (2,975,426     (2,694,343     (10 %)   


Gross profit

     2,938,202       2,522,186       16     20     1,617,990       1,398,193       16     30

Operating expenses

     (1,804,870     (1,737,433     (4 %)        (937,346     (903,673     (4 %)   


Operating earnings before other income and expenses, net

     1,133,332       784,753       44     33     680,643       494,520       38     30

Other expenses, net

     (92,662     (113,544     18       (49,614     (69,189     28  


Operating earnings

     1,040,669       671,208       55       631,028       425,331       48  

Financial expense

     (204,448     (235,573     13       (101,697     (120,533     16  

Other financial income (expense), net

     (40,846     150,025       N/A         (52,697     110,428       N/A    

Financial income

     27,923       19,146       46       13,092       8,420       55  

Results from financial instruments, net

     3,094       (32,934     N/A         (10,369     (16,862     39  

Foreign exchange results

     (21,179     207,934       N/A         (29,429     141,339       N/A    

Effects of net present value on assets and liabilities and others, net

     (50,684     (44,122     (15 %)        (25,990     (22,470     (16 %)   

Equity in gain (loss) of associates

     25,367       25,259       0       18,779       19,842       (5 %)   


Income (loss) before income tax

     820,743       610,920       34       495,414       435,068       14  

Income tax

     (233,658     (151,667     (54 %)        (139,729     (99,906     (40 %)   


Profit (loss) of continuing operations

     587,085       459,252       28       355,685       335,163       6  

Discontinued operations

     2,489       599,571       (100 %)        (214     (18,037     99  


Consolidated net income (loss)

     589,574       1,058,823       (44 %)        355,470       317,126       12  

Non-controlling interest net income (loss)

     15,279       6,846       123       8,831       (893     N/A    


Controlling interest net income (loss)

     574,295       1,051,977       (45 %)        346,639       318,018       9  


Operating EBITDA

     1,811,962       1,416,775       28     20     1,017,682       821,826       24     18

Earnings (loss) of continued operations per ADS

     0.40       0.73       (45 %)        0.24       0.22       10  


     As of June 30  

STATEMENT OF FINANCIAL POSITION

   2026      2025      % var  

Total assets

     28,269,103        28,801,933        (2 %) 

Cash and cash equivalents

     653,684        1,165,526        (44 %) 

Trade receivables less allowance for doubtful accounts

     2,065,065        1,918,649        8

Other accounts receivable

     894,874        739,183        21

Inventories, net

     1,573,707        1,619,668        (3 %) 

Assets held for sale

     545,957        29,536        N/A  

Other current assets

     146,726        186,711        (21 %) 

Current assets

     5,880,012        5,659,272        4

Property, machinery and equipment, net

     11,794,831        11,912,731        (1 %) 

Other assets

     10,594,260        11,229,930        (6 %) 


Total liabilities

     15,433,130        15,144,566        2

Current liabilities

     6,373,890        6,596,824        (3 %) 

Long-term liabilities

     5,645,650        5,101,757        11

Other liabilities

     3,413,590        3,445,985        (1 %) 


Total stockholder’s equity

     12,835,973        13,657,367        (6 %) 

Common stock and additional paid-in capital

     7,699,108        7,699,108        0

Other equity reserves

     (2,614,417      (2,482,799      (5 %) 

Subordinated notes

     974,000        1,975,480        (51 %) 

Retained earnings

     6,471,330        6,168,730        5

Non-controlling interest

     305,952        296,848        3


2026 Second Quarter Results    Page 7


LOGO

Operating results


Operating Summary per Country

In thousands of U.S. dollars


     January - June     Second Quarter  
                       like-to-like                       like-to-like  

Sales

   2026     2025     % var     % var     2026     2025     % var     % var  

Mexico

     2,566,918       2,040,925       26     11     1,311,469       1,059,643       24     12

U.S.A.

     2,510,724       2,496,274       1     1     1,314,783       1,305,978       1     1

Europe, Middle East and Africa

     2,680,552       2,410,937       11     5     1,518,385       1,341,395       13     9

Europe

     1,927,879       1,822,826       6     2     1,114,306       1,041,139       7     6

Middle East and Africa

     752,673       588,111       28     14     404,079       300,256       35     19

South, Central America and the Caribbean

     602,149       566,063       6     (1 %)      306,528       285,373       7     (1 %) 

Others and intercompany eliminations

     252,167       192,555       31     35     142,251       100,147       42     46


TOTAL

     8,612,510       7,706,754       12     5     4,593,416       4,092,536       12     7


GROSS PROFIT


Mexico

     1,373,624       1,028,579       34     18     710,481       546,248       30     18

U.S.A.

     657,429       694,454       (5 %)      (5 %)      364,263       393,598       (7 %)      (7 %) 

Europe, Middle East and Africa

     716,904       616,390       16     11     449,967       377,909       19     16

Europe

     558,107       489,453       14     10     365,748       314,630       16     15

Middle East and Africa

     158,798       126,938       25     15     84,219       63,279       33     21

South, Central America and the Caribbean

     191,890       173,296       11     5     99,121       81,727       21     16

Others and intercompany eliminations

     (1,645     9,467       N/A       N/A       (5,842     (1,290     N/A       N/A  


TOTAL

     2,938,202       2,522,186       16     20     1,617,990       1,398,193       16     30


OPERATING EARNINGS BEFORE OTHER EXPENSES, NET


Mexico

     831,754       553,153       50     31     435,038       294,029       48     33

U.S.A.

     175,483       212,287       (17 %)      (17 %)      119,182       149,229       (20 %)      (20 %) 

Europe, Middle East and Africa

     272,425       182,864       49     45     205,365       141,022       46     42

Europe

     182,242       114,516       59     57     156,848       107,056       47     45

Middle East and Africa

     90,182       68,349       32     25     48,517       33,965       43     34

South, Central America and the Caribbean

     88,467       72,741       22     16     44,118       32,597       35     28

Others and intercompany eliminations

     (234,797     (236,294     1     14     (123,061     (122,355     (1 %)      9


TOTAL

     1,133,332       784,753       44     33     680,643       494,520       38     30


2026 Second Quarter Results    Page 8


LOGO

Operating results


Operating Summary per Country

Operating EBITDA in thousands of U.S. dollars. Operating EBITDA margin as a percentage of sales.


     January - June     Second Quarter  
                       like-to-like                       like-to-like  

OPERATING EBITDA

   2026     2025     % var     % var     2026     2025     % var     % var  

Mexico

     944,560       655,109       44     26     491,330       346,875       42     27

U.S.A.

     438,124       468,282       (6 %)      (6 %)      248,207       278,537       (11 %)      (11 %) 

Europe, Middle East and Africa

     444,286       346,060       28     23     292,624       229,194       28     24

Europe

     314,178       246,589       27     24     223,654       177,904       26     25

Middle East and Africa

     130,109       99,471       31     20     68,969       51,290       34     23

South, Central America and the Caribbean

     132,756       104,720       27     19     66,407       49,540       34     25

Others and intercompany eliminations

     (147,764     (157,396     6     27     (80,886     (82,319     2     16


TOTAL

     1,811,962       1,416,775       28     20     1,017,682       821,826       24     18


OPERATING EBITDA MARGIN


Mexico

     36.8     32.1     4.7pp         37.5     32.7     4.8pp    

U.S.A.

     17.5     18.8     (1.3pp       18.9     21.3     (2.4pp  

Europe, Middle East and Africa

     16.6     14.4     2.2pp         19.3     17.1     2.2pp    

Europe

     16.3     13.5     2.8pp         20.1     17.1     3.0pp    

Middle East and Africa

     17.3     16.9     0.4pp         17.1     17.1     0.0pp    

South, Central America and the Caribbean

     22.0     18.5     3.5pp         21.7     17.4     4.3pp    


TOTAL

     21.0     18.4     2.6pp         22.2     20.1     2.1pp    


2026 Second Quarter Results    Page 9


LOGO

Operating results


Volume Summary

Cement and aggregates: Thousands of metric tons.

Ready-mix: Thousands of cubic meters.


     January - June            Second Quarter         
     2026      2025      % var     2026      2025      % var  

Consolidated cement volume (1)

     25,409        25,381        0     13,360        13,215        1

Consolidated ready-mix volume

     20,946        21,191        (1 %)      10,848        10,802        0

Consolidated aggregates volume (2)

     63,139        63,565        (1 %)      32,967        33,519        (2 %) 


Per-country volume summary


     January - June     Second Quarter     Second Quarter 2026  

DOMESTIC GRAY CEMENT VOLUME

   2026 vs. 2025     2026 vs. 2025     vs. First Quarter 2026  

Mexico

     7     7     3

U.S.A.

     (1 %)      (0 %)      11

Europe, Middle East and Africa

     (4 %)      (4 %)      25

Europe

     (5 %)      (3 %)      41

Middle East and Africa

     (2 %)      (7 %)      (3 %) 

South, Central America and the Caribbean

     2     1     3


READY-MIX VOLUME


Mexico

     (4 %)      (2 %)      0

U.S.A.

     0     (2 %)      1

Europe, Middle East and Africa

     (0 %)      3     16

Europe

     (6 %)      (4 %)      24

Middle East and Africa

     8     14     6

South, Central America and the Caribbean

     (8 %)      (6 %)      6


AGGREGATES VOLUME


Mexico

     5     4     (4 %) 

U.S.A.

     5     1     6

Europe, Middle East and Africa

     (6 %)      (4 %)      20

Europe

     (7 %)      (7 %)      25

Middle East and Africa

     (0 %)      5     6

South, Central America and the Caribbean

     (28 %)      (28 %)      (7 %) 


(1) 

Consolidated cement volume includes domestic and export volume of gray cement, white cement, special cement, mortar, and clinker.

(2) 

Consolidated aggregates volumes include aggregates from our marine business in the United Kingdom.


2026 Second Quarter Results    Page 10


LOGO

Operating results


Price Summary

Variation in U.S. dollars


     January - June     Second Quarter     Second Quarter 2026 vs.  

DOMESTIC GRAY CEMENT PRICE

   2026 vs. 2025     2026 vs. 2025     First Quarter 2026  

Mexico

     21     18     2

U.S.A.

     (2 %)      (2 %)      1

Europe, Middle East and Africa (*)

     6     3     4

Europe (*)

     5     2     (2 %) 

Middle East and Africa (*)

     15     7     (2 %) 

South, Central America and the Caribbean (*)

     5     6     0


READY-MIX PRICE


Mexico

     17     12     3

U.S.A.

     (1 %)      (0 %)      2

Europe, Middle East and Africa (*)

     13     11     5

Europe (*)

     7     3     (1 %) 

Middle East and Africa (*)

     25     30     13

South, Central America and the Caribbean (*)

     13     14     3


AGGREGATES PRICE


Mexico

     18     16     5

U.S.A.

     2     2     (0 %) 

Europe, Middle East and Africa (*)

     11     9     2

Europe (*)

     8     5     (0 %) 

Middle East and Africa (*)

     27     29     8

South, Central America and the Caribbean (*)

     13     16     11


All price variations are based on FOB prices.

(*)

Price variation in U.S. dollars calculated on a volume-weighted-average basis; price variation in local currency calculated on a volume-weighted-average basis at constant foreign-exchange rates.


2026 Second Quarter Results    Page 11


LOGO

Operating results


Variation in Local Currency


     January - June     Second Quarter     Second Quarter 2026 vs.  

DOMESTIC GRAY CEMENT PRICE

   2026 vs. 2025     2026 vs. 2025     First Quarter 2026  

Mexico

     6     6     2

U.S.A.

     (2 %)      (2 %)      1

Europe, Middle East and Africa (*)

     3     3     5

Europe (*)

     1     1     (1 %) 

Middle East and Africa (*)

     16     10     1

South, Central America and the Caribbean (*)

     1     1     (1 %) 


READY-MIX PRICE


Mexico

     3     2     2

U.S.A.

     (1 %)      (0 %)      2

Europe, Middle East and Africa (*)

     4     4     3

Europe (*)

     2     2     (0 %) 

Middle East and Africa (*)

     9     12     7

South, Central America and the Caribbean (*)

     (1 %)      (1 %)      (0 %) 


AGGREGATES PRICE


Mexico

     4     5     4

U.S.A.

     2     2     (0 %) 

Europe, Middle East and Africa (*)

     5     5     1

Europe (*)

     4     5     0

Middle East and Africa (*)

     7     8     0

South, Central America and the Caribbean (*)

     (1 %)      1     7


All price variations are based on FOB prices.

(*)

Price variation in U.S. dollars calculated on a volume-weighted-average basis; price variation in local currency calculated on a volume-weighted-average basis at constant foreign-exchange rates.


2026 Second Quarter Results    Page 12


LOGO

Definitions of terms and disclosures


Operating expenses

The following table shows the breakdown of operating expenses for the period presented.


    January – June     Second Quarter  

In thousands of US dollars

  2026     2025     % var     2026     2025     % var  

General and administrative expenses

    609,915       596,906       2%       320,611       303,327       6%  

Selling expenses

    178,069       182,086       (2%     90,643       94,596       (4%

Distribution and logistics expenses

    879,688       840,894       5%       457,129       446,241       2%  


Operating expenses before depreciation

    1,667,671       1,619,885       3%       868,384       844,164       3%  

Depreciation in operating expenses

    137,199       117,548       17%       68,963       59,508       16%  


Operating expenses

    1,804,871       1,737,433       4%       937,347       903,673       4%  


As % of Net Sales


General and administrative expenses

    7.1%       7.7%         7.0%       7.4%    

SG&A expenses

    9.1%       10.1%         9.0%       9.7%    


Equity-related information

As of December 31, 2025, the number of outstanding CPO-equivalents was 14,508,328,248. See Cemex’s reports furnished to or filed with the U.S. Securities and Exchange Commission for information, if any, regarding repurchases of securities and other developments that may have caused a change in the number of CPO-equivalents outstanding after December 31, 2025. For the three-month period ended March 31, 2026, 78,803,711 CPOs were repurchased by Cemex under its share repurchase program approved at Cemex, S.A.B. de C.V.’s ordinary annual shareholders meeting held on March 25, 2025. On March 26, 2026, Cemex, S.A.B. de C.V.’s ordinary annual shareholders meeting approved a new repurchase program that will be in effect until the next annual shareholders meeting to be held in 2027. No CPOs were repurchased by Cemex under such program from March 26, 2026 to June 30, 2026.

One Cemex ADS represents ten Cemex CPOs. One Cemex CPO represents two Series A shares and one Series B share.

For purposes of this report, outstanding CPO-equivalents equal the total number of Series A and B shares outstanding as if they were all held in CPO form, less CPOs held by Cemex and its subsidiaries, which as of December 31, 2025, were 20,541,277. Starting 2024, employees receive restricted ADRs instead of restricted CPOs. Restricted ADRs allocated to eligible employees as variable compensation are not included in the outstanding CPO-equivalents.

Derivative instruments

The following table shows the notional amount for each type of derivative instrument and the aggregate fair market value for all of Cemex’s derivative instruments as of the last day of each quarter presented.


    Second Quarter     First Quarter  
    2026     2025     2026  
In millions of US dollars   Notional
amount
    Fair
value
    Notional
amount
    Fair
value
    Notional
amount
    Fair
value
 

Exchange rate derivatives (1)

    1,225       (80     1,506       (35     1,318       (59

Interest rate swaps (2)

    1,733       7       1,505       (44     2,332       (8

Fuel derivatives (3)

    264       31       298       6       183       64  


    3,222       (42     3,309       (73     3,833       (3


1)

The exchange rate derivatives are used to manage currency exposures arising from net investments in foreign operations.

2)

As of June 30, 2026, these instruments are associated with bank loans, including interest rate and exchange rate swap derivatives.

3)

Cemex’s derivative financial instruments portfolio includes swaps and financial options. These derivative instruments are mainly used to hedge the market price risk of certain fuels associated with certain Cemex operations, such as transportation and production. In addition, there are call spreads on Brent oil and derivatives thereof, designed to mitigate the exposure related to the implicit cost of fuel in distribution expenses.

Under IFRS, companies are required to recognize the fair value of all derivative financial instruments on the balance sheet as financial assets or liabilities, with changes in such fair market values recorded in the income statement, except when transactions are entered into for hedging purposes. In cash-flow hedging cases, changes in the fair market value of the related derivative instruments are recognized temporarily in equity and subsequently reclassified into earnings as the effects of the underlying are recognized in the income statement. Moreover, in transactions related to net investment hedges, changes in fair market value are recorded directly in equity as part of the currency translation effect and are reclassified to the income statement only in the case of disposal of the net investment. As of June 30, 2026, in connection with the derivatives portfolio’s fair market value, Cemex recognized changes in fair market value resulting in a financial liability of US$42 million.


2026 Second Quarter Results    Page 13


LOGO

Definitions of terms and disclosures


Discontinued operations

On October 6, 2025, Cemex concluded the sale of substantially all its operations and the majority of its assets in Panama to Grupo Estrella, primarily comprising one cement plant and related cement assets, ready-mix concrete, and aggregates, for a total consideration of US$200 million. Cemex retained its admixtures business in Panama. The sale resulted in a loss on disposal of US$63 million and a goodwill write-off of US$24 million. For the six-month period ended June 30, 2025, Cemex’s operations in Panama are reported in Cemex’s income statements, net of income tax, in the single line item “Discontinued operations”.

On January 30, 2025, Cemex completed the sale of its operations in the Dominican Republic to Cementos Progreso Holdings, S.L., and its strategic partners for a total consideration of US$928 million, after adjustments for final cash, debt, and working capital balances. The divested assets consisted of one cement plant in the Dominican Republic with two integrated production lines, along with related cement, ready-mix concrete, aggregates, and marine terminal assets. For the six-month period ended June 30, 2025, Cemex’s operations in the Dominican Republic are reported in Cemex’s income statements, net of income tax, in the single line item “Discontinued operations,” including a gain on sale of US$551 million, net of the reclassification of foreign currency translation effects accrued in equity until the date of sale and goodwill write off of US$13 million.

The table below summarizes the income statements for the six-month period ended June 30, 2025. It includes Cemex’s discontinued operations related to Panama and the Dominican Republic.


INCOME STATEMENTS    Jan - Jun     Second Quarter  

(Millions of U.S. dollars)

   2026      2025     2026      2025  

Sales

     —         94       —         33  

Cost of sales, operating expenses, other expenses, and gain on sale, net

     2        513       —         (49

Interest expense, net, and others

     —         (4     —         (2


Income (loss) before income tax

     2        603       —         (18

Income tax

     —         (3     —         —   


Net result from discontinued operations

     2        600       —         (18


Assets held for sale and related liabilities

As of June 30, 2026, Cemex presents “Assets held for sale” and “Liabilities directly related to assets held for sale”, respectively, in connection with the agreement to divest several assets in Colombia, including cement operations and a portfolio of ready-mix concrete, aggregates, mortars, and admixtures, for total proceeds of approximately US$485 million. This transaction is expected to close by year-end. We will continue to consolidate these operations in our P&L until the transaction closes.

The following table presents condensed combined information of the statement of financial position for the assets held for sale in Colombia as of June 30, 2026:


(Millions of U.S. dollars)

   2026  

Current assets

     122  

Non-current assets

     377  


Total assets

     499  

Current liabilities

     69  

Non-current liabilities

     98  


Total liabilities

     167  


Net assets sold or held for sale

     332  


2026 Second Quarter Results    Page 14


LOGO

Definitions of terms and disclosures


Methodology for translation, consolidation, and presentation of results

Under IFRS, Cemex translates the financial statements of foreign subsidiaries using exchange rates at the reporting date for the balance sheet and the exchange rates at the end of each month for the income statement.

Breakdown of regions and subregions

The South, Central America and the Caribbean region includes Cemex’s operations in Colombia, Puerto Rico, Nicaragua, Jamaica, Trinidad and Tobago, Guyana, Barbados, Peru and Bahamas.

The EMEA region includes Europe, Middle East and Africa.

Europe subregion includes operations in Spain, Croatia, the Czech Republic, France, Germany, Poland, and the United Kingdom.

Middle East and Africa subregion includes operations in United Arab Emirates, Egypt, and Israel.

Definition of terms

Free cash flow from operations Cemex defines it as Operating EBITDA minus net interest paid, maintenance capital expenditures, maintenance lease payments, fixed asset sales, change in working capital, net taxes paid, and other cash expenditures.

l-t-l (like to like) on a like-to-like basis adjusting for currency fluctuations.

Maintenance capital expenditures equal investments incurred for the purpose of ensuring the company’s operational continuity. These include capital expenditures on projects required to replace obsolete assets or maintain current operational levels, and mandatory capital expenditures, which are projects required to comply with governmental regulations or company policies.

Net debt equals total debt (debt plus financial leases) minus cash and cash equivalents.

Sales, when referring to reportable segment sales, revenues are presented before eliminations of intragroup transactions. When referring to Consolidated Sales, these represent the total revenues (Net Sales) of the company as reported in the financial statements.

Operating EBITDA, or EBITDA equals operating earnings before other income and expenses, net, plus depreciation and amortization.

Operating EBITDA margin, or EBITDA margin, is calculated by dividing our “Operating EBITDA” by our sales.

pp equals percentage points.

Prices all reference to pricing initiatives, price increases or decreases, refer to our prices for our products and services.

SG&A expenses equal selling and administrative expenses

Growth capital expenditures equal investments incurred with the purpose of increasing the company’s profitability. These include capital expenditures on projects designed to increase profitability by expanding capacity, and margin improvement capital expenditures, which are projects designed to increase profitability by reducing costs.

Investment in intangible assets equals investments and expenses incurred in the development of internal-use software, industrial property, and trademarks, and aggregates mining rights.

Working capital equals operating accounts receivable (including other current assets received as payment in kind) plus historical inventories minus operating payables.

% var percentage variation

Earnings per ADS

Please refer to page 2 for the number of average ADSs outstanding used for the calculation of earnings per ADS.

According to the IAS 33 Earnings per share, the weighted-average number of common shares outstanding is determined considering the number of days during the accounting period in which the shares have been outstanding, including shares derived from corporate events that have modified the stockholder’s equity structure during the period, such as increases in the number of shares by a public offering and the distribution of shares from stock dividends or recapitalizations of retained earnings and the potential diluted shares (Stock options, Restricted Stock Options and Mandatory Convertible Shares). The shares issued because of share dividends, recapitalizations and potential diluted shares are considered as issued at the beginning of the period.


Exchange rates    January - June      Second Quarter      Second Quarter  
     2026      2025      2026      2025      2026      2025  
   Average      Average      Average      Average      End of period      End of period  

Mexican peso

     17.49        19.92        17.43        19.26        17.49        18.75  

Euro

     0.8567        0.9094        0.8618        0.8693        0.8754        0.8485  

British pound

     0.7434        0.7650        0.7440        0.7390        0.7541        0.7282  


Amounts provided in units of local currency per U.S. dollar.


2026 Second Quarter Results    Page 15


LOGO

Disclaimer


Except as the context otherwise may require, references in this report to “we,” “us,” “our,” or similar expressions refer to Cemex, S.A.B. de C.V. (“Cemex”) (NYSE: CX; BMV: CEMEX.CPO) and its consolidated entities. The information disclosed in this report and the current or future events referenced therein may contain forward-looking statements within the meaning of applicable securities laws and regulations, including but not limited to Section 27A of the Securities Act of 1933, as amended, and Section 21E of the Securities Exchange Act of 1934, as amended. We intend these forward-looking statements to be covered by the “safe harbor” provisions for forward-looking statements within the meaning of applicable securities laws and regulations in all jurisdictions where such provisions exist, including but not limited to the US Private Securities Litigation Reform Act of 1995. These forward-looking statements and information are necessarily subject to risks, uncertainties, and assumptions, including but not limited to statements related to our plans, objectives, and expectations (financial or otherwise), and typically can be identified by the use of words such as, but not limited to, “will”, “may,” “assume,” “might,” “should,” “could,” “continue,” “would,” “can,” “consider,” “anticipate,” “estimate,” “expect,” “envision,” “plan,” “believe,” “foresee,” “predict,” “potential,” “target,” “goal,” “strategy,” “intend,” “aimed”, or other forward-looking words. Although we believe that our expectations are reasonable, we can give no assurance that these expectations will prove to be correct, and actual results, performance and/or achievements may vary, including materially, from historical results, performance and/or achievements or those anticipated by forward-looking statements due to various factors. Unless otherwise indicated, these forward-looking statements reflect our current expectations and projections about the future based on certain assumptions and on our knowledge of facts and circumstances as of the date such forward-looking statements are made. These forward-looking statements necessarily involve risks, uncertainties, assumptions and other important factors that could cause results and any estimate, projection and/or guidance presented in this report to differ materially from historical results, performance and/or achievements or those anticipated by forward-looking statements due to various factors. Among others, such risks, uncertainties, assumptions, and other important factors that could cause results and any estimate, projection and/or guidance presented in this report to differ or fail to materialize, or that otherwise could have an impact on us, include those discussed in our most recent annual report and those detailed from time to time in our other filings with the U.S. Securities and the Exchange Commission (“SEC”), Mexican National Banking and Securities Commission (Comisión Nacional Bancaria y de Valores, the “CNBV”) and the Mexican Stock Exchange (Bolsa Mexicana de Valores, the “BMV”), which factors are incorporated herein by reference, including, but not limited to: changes in general economic, political and social conditions, including government shutdowns, new governments or regimes and decisions implemented by such new governments or regimes, changes in laws or regulations in the countries in which we do business, elections, changes in inflation, interest and foreign exchange rates, employment levels, population growth, any slowdown in the flow of remittances into countries where we operate, consumer confidence and the liquidity of the financial and capital markets in Mexico, the United States of America, the European Union (“EU”), the United Kingdom or other countries in which we operate; the cyclical activity of the construction sector and reduced construction activity in our end markets or reduced use in our end markets for our products; our exposure to sectors that impact our and our clients’ businesses, particularly those operating in the commercial and residential construction sectors, and the public and private infrastructure and energy sectors; volatility in pension plan asset values and liabilities, which may require cash or other contributions to the pension plans; changes in spending levels for residential and commercial construction and general infrastructure projects; the availability of short-term credit lines or working capital facilities, which can assist us in connection with market cycles; any impact of not maintaining investment grade debt rating or not obtaining investment grade debt ratings from additional rating agencies on our cost of capital and on the cost of the products and services we purchase; availability of raw materials and related fluctuating prices of raw materials, as well as of goods and services in general, in particular increases in prices of raw materials, goods and services, as a result of inflation, trade barriers, measures imposed by governments or as a result of conflicts between countries that disrupt supply chains; our ability to maintain and expand our distribution network and maintain favorable relationships with third parties who supply us with equipment, services and essential supplies; competition in the markets in which we offer our products and services; the impact of environmental cleanup costs and other remedial actions, and other environmental, climate and related liabilities relating to existing and/or divested businesses, assets and/or operations; our ability to secure and permit aggregates reserves in strategically located areas in amounts that our operations require to operate or operate in a cost-efficient manner; the timing and amount of federal, state, and local funding for infrastructure; changes in our effective tax rate; our ability to comply with regulations and implement technologies and other initiatives that aim to reduce and/or capture CO2 emissions and comply with related carbon emissions regulations in place in the jurisdictions where we have operations; the legal and regulatory environment, including environmental, climate, trade, energy, tax, antitrust, sanctions, import and export controls, construction, human rights and labor welfare, and acquisition-related rules and regulations in the countries and regions in which we have operations; the effects of currency fluctuations on our results of operations and financial condition; our ability to satisfy our obligations under our debt agreements, the indentures that govern our outstanding notes, and our other debt instruments and financial obligations, and also regarding our subordinated notes with no fixed maturity and other financial obligations; adverse legal or regulatory proceedings or disputes, such as class actions or enforcement or other proceedings brought by third parties, government and regulatory agencies, including antitrust investigations and claims; our ability to protect our reputation and intellectual property; our ability to consummate asset sales or consummate asset sales in terms favorable to us, fully integrate newly acquired businesses, achieve cost-savings from our cost-reduction initiatives, implement our pricing and commercial initiatives for our products and services, and generally meet our business strategy’s goals; the increasing reliance on information technology infrastructure for our sales, invoicing, procurement, financial statements, and other processes that can adversely affect our sales and operations in the event that the infrastructure does not work as intended, experiences technical difficulties, or is subjected to invasion, disruption, or damage caused by circumstances beyond our control, including cyber-attacks, catastrophic events, power outages, natural disasters, computer system or network failures, or other security breaches; the effects of climate change, in particular reflected in weather conditions, including but not limited to excessive rain and snow, shortage of usable water, wildfires and natural disasters, such as earthquakes, hurricanes, tornadoes and floods, that could affect our facilities or the markets in which we offer our products and services or from where we source our raw materials; trade barriers, including but not limited to tariffs or import taxes, including those imposed by the United States of America to key markets in which we operate, in particular, Mexico, China and the EU, and changes in existing trade policies or changes to, or withdrawals from, free trade agreements, including the United States-Mexico-Canada Agreement (the “USMCA”), and the overall impact that the imposition or threat of trade barriers may cause on the overall economy of the countries in which we do business or that are part of our global supply chain; availability and cost of trucks, railcars, barges, and ships, terminals, warehouses, as well as their licensed operators, drivers, staff and workers for transport, loading and unloading of our materials or that are otherwise a part of our supply chain; labor shortages and constraints; our ability to hire, effectively compensate and retain our key personnel and maintain satisfactory labor relations; our ability to detect and prevent money laundering, terrorism financing and corruption, as well as other illegal activities, and how any measures implemented by governments to detect and prevent money laundering, terrorism financing and corruption, and other illegal activities, affect our customers, suppliers and countries in which we do business in general; defaults, losses or disruptions in agreements, financial transactions or operations resulting from sanctions or restrictions imposed on any financial institution, including but not limited to banks, common representatives, trustees, payment processors, paying agents or other financial intermediaries, or any related parties; terrorist and organized criminal activities, social unrest, as well as geopolitical events, such as global, regional or national instability, hostilities, war, and armed conflicts, including the current war between Russia and Ukraine, the ongoing war among Israel, the United States and Iran, conflicts in the Middle East and any insecurity and hostilities in Mexico related to illegal activities or organized crime and any actions any government takes to prevent these illegal activities and organized crime; the impact of pandemics, epidemics, or outbreaks of infectious diseases and the response of governments and other third parties, which could adversely affect, among other matters, the ability of our operating facilities to operate at full or any capacity, supply chains, international operations, availability of liquidity, investor confidence and


2026 Second Quarter Results    Page 16


LOGO

Disclaimer


consumer spending, as well as the availability of, and demand for, our products and services; changes in the economy that affect demand for consumer goods, consequently affecting demand for our products and services; the depth and duration of an economic slowdown or recession, instability in the business landscape and lack of availability of credit; declarations of insolvency or bankruptcy, or becoming subject to similar proceedings; natural disasters and other unforeseen events (including global health hazards such as, for example, COVID-19); and our ability to implement our climate action program in effect at any given time, if any, including our current “Future in Action” climate action and nature program, and to achieve our sustainability goals and objectives in effect at any given time, if any, including under our current “Future in Action” climate action and nature program. Many factors could cause our expectations, expected results, and/or projections expressed in this report and in the events referenced herein not being reached and/or not producing the expected benefits and/or results, as any such benefits or results are subject to uncertainties, costs, performance, and also rate of success and/or implementation of technologies, some of which are not yet proven, among other factors. Should one or more of these risks or uncertainties materialize, or should underlying assumptions prove incorrect, actual results, performance and/or achievements may vary materially from historical results, performance, and/or achievements and/or results; performance and/or achievements expressly or implicitly anticipated by the forward-looking statements; or otherwise could have an impact on us. Forward-looking statements should not be considered guarantees of future performance, and past results or developments are not indicative of results or developments in subsequent periods. Actual results, performance and/or achievements of our operations and the development of market conditions in which we operate, or other circumstances that may materialize, may differ materially from those described in, or suggested by, the forward-looking statements contained in this report, and events referenced therein. Any or all of our forward-looking statements may turn out to be inaccurate and the factors identified above are not exhaustive. Accordingly, undue reliance on forward-looking statements should not be placed, as such forward-looking statements speak only as of the dates on which they are made. The forward-looking statements and the information disclosed in this report are made and stated as of the dates specified in such referenced report and are subject to change without notice; and, except to the extent legally required, we expressly disclaim any obligation or undertaking to update or correct the information contained in this report, or revise any forward-looking statements in such referenced report, whether to reflect new information, the occurrence of anticipated or unanticipated future events or circumstances, any change in our expectations regarding those forward-looking statements, any change in events, conditions or circumstances on which any such statement is based, or otherwise. Readers should review future reports filed or furnished by us with the SEC, the CNBV and the BMV. Market data used in this report and events referenced herein not attributed to a specific source are our estimates and have not been independently verified. Certain financial and statistical information contained in this report is subject to rounding adjustments; accordingly, any discrepancies between the totals and the sums of the amounts listed are due to rounding. Unless otherwise specified, all references to records are our internal records. This report includes certain non-International Financial Reporting Standards (“IFRS”) financial measures that differ from financial information presented by us in accordance with IFRS in our financial statements and reports containing financial information. The aforementioned non-IFRS financial measures include “Operating EBITDA” or “EBITDA” (operating earnings before other expenses, net plus depreciation and amortization), “Operating EBITDA Margin” or “EBITDA Margin” (Operating EBITDA for the period divided by revenues reported for the same period), “Operating EBIT” or “EBIT” (operating earnings before other expenses, net), and “Free Cash Flow from Operations” (Operating EBITDA minus net interest paid, maintenance capital expenditures, maintenance lease payments, fixed asset sales, change in working capital, net taxes paid, and other cash expenditures). The closest IFRS financial measure to Operating EBITDA is “Operating earnings before other expenses, net”, as Operating EBITDA adds depreciation and amortization to the IFRS financial measure. We believe there is no close IFRS financial measure to compare to Operating EBITDA Margin. The closest IFRS financial measure to Operating EBIT is “Operating earnings before other expenses, net”. We believe there is no close IFRS financial measure to compare to Free Cash Flow from Operations. These non-IFRS financial measures are designed to complement and should not be considered superior to financial measures calculated in accordance with IFRS. Although Operating EBITDA, Operating EBITDA Margin, Operating EBIT and Free Cash Flow from Operations are not measures of operating performance, an alternative to cash flows or a measure of financial position under IFRS, Operating EBITDA is the financial measure used by our management to review operating performance and profitability, for decision-making purposes and to allocate resources. Moreover, our Operating EBITDA is a measure used by our creditors to review our ability to internally fund capital expenditures, service or incur debt and comply with financial covenants under our financing agreements. Furthermore, our management regularly reviews our Operating EBITDA Margin by reportable segment and on a consolidated basis as a measure of performance and profitability. These non-IFRS financial measures do not have any standardized meaning and are therefore unlikely to be comparable to similarly titled measures presented by other companies. The financial measures presented in this report are being provided for informative purposes only and shall not be construed as investment, financial, or other advice. Also, this report includes statistical data regarding the production, distribution, marketing and sale of cement, ready-mix concrete, clinker, aggregates and Urbanization Solutions. We generated some of this data internally, and some was obtained from independent industry publications and reports that we believe to be reliable sources. We have not independently verified this data nor sought the consent of any organizations to refer to their reports in this report. We act in strict compliance with antitrust laws and as such, among other measures, maintain an independent pricing policy that has been independently developed and its core element is to price our products and services based upon their quality and characteristics as well as their value to our customers. We do not accept any communications or agreements of any type with competitors regarding the determination of our prices for our products and services. Unless the context indicates otherwise, all references to pricing initiatives, price increases or decreases, refer to our prices for our products. The information, statements, and opinions contained in this report are for informational purposes only and do not constitute a public offer under any applicable legislation, an offer to sell, or solicitation of any offer to buy any securities or financial instruments, or any advice or recommendation with respect to such securities or other financial instruments. You should not construe any such information or other material as legal, tax, investment, financial, or other advice. We are not responsible for any third-party information referenced in this report. Cautionary Statement Regarding Environmental, Social, and Governance (“ESG”) and Sustainability-Related Data, Metrics, and Methodologies. This report includes non-financial metrics, estimates, or other information related to ESG and sustainability matters that are subject to significant uncertainties, which may include the methodology, collection, and verification of data, various estimates, and assumptions, and/or underlying data that is obtained from third parties, some of which cannot be independently verified. The preparation of certain information on ESG and sustainability matters contained in this report requires the application of a number of key judgments, assumptions, and estimates. The reported measures reflect good faith estimates, assumptions, and judgments at the given point in time. There is a risk that these judgments, estimates, or assumptions may subsequently prove to be incorrect and/or, to the extent legally required, may need to be restated or changed. The disclosure of information on sustainability-related matters is not yet subject to the same recognized or accepted reporting or accounting principles and rules as traditional financial information. Consequently, there are no commonly accepted reporting practices for us to follow, and ESG metrics among organizations in our industry may not be comparable. In addition, the underlying data, systems, and controls that support non-financial reporting are generally considerably less sophisticated than the systems and internal control for financial reporting and rely on manual processes. This may result in non-comparable information between organizations and/or between reporting periods within organizations as methodologies continue to develop and/or be socialized. The further development of or changes to accounting and/or reporting standards could materially impact the performance metrics, data points, and targets contained in this report, and the reader may not be able to compare non-financial information performance metrics, data points, or targets between reporting periods on a direct like-for-like basis. Additionally, the information disclosed in this report contains references to “green,” “social,” “sustainable,” or equivalent-labelled activities, products, assets, or projects. There is currently no single globally recognized or accepted, consistent, and comparable set of definitions or standards (legal, regulatory, or otherwise) of, nor widespread cross-market consensus


2026 Second Quarter Results    Page 17


LOGO

Disclaimer


i) as to what constitutes, a ‘green’, ‘social,’ or ‘sustainable’ or having equivalent-labelled activity, product, or asset; or ii) as to what precise attributes are required for a particular activity, product, or asset to be defined as ‘green’, ‘social,’ or ‘sustainable’ or such other equivalent label; or iii) as to climate and sustainable funding and financing activities and their classification and reporting. Therefore, there is little certainty, and no assurance or representation is given that such activities, products, assets or projects and/or reporting of those activities, products, assets or projects will meet any present or future expectations or requirements for describing or classifying such activities, products, assets or projects as ‘green,’ ‘social,’ or ‘sustainable,’ or attributing similar labels. We expect policies, regulatory requirements, standards, and definitions to be developed and continuously evolve over time. Cautionary Statement Regarding Forward-Looking ESG or Sustainability Statements. Certain sections in this report contain ESG- or sustainability-related forward-looking statements, such as aims, ambitions, estimates, forecasts, plans, projections, targets, goals and other metrics, including but not limited to: climate and emissions, business and human rights, corporate governance, research and development and partnerships, development of products and services that intend to address sustainability-related concerns and sustainability related targets/ ambitions when finalized, including the implementation of technologies and other initiatives that aim to reduce and/or capture CO2 emissions. These forward-looking statements also include references to specific programs, such as our current “Future in Action” climate action and nature program, as well as various ESG-related indicators, objectives or metrics disclosed previously or that may be disclosed in the future, none of which are guarantees and any and all of which may ultimately not be achieved or may be abandoned at any time, whether in part, in full, or within any specific timeframe. There are many significant uncertainties, assumptions, judgements, opinions, estimates, forecasts and statements made of future expectations underlying these forward-looking statements which could cause actual results, performance, outcomes or events to differ materially from those expressed or implied in these forward-looking statements, which include, but are not limited to: the extent and pace of climate change, including the timing and manifestation of physical and transition risks; the macroeconomic environment; uncertainty around future climate-related policy and regulations, including the timely implementation and integration of adequate government policies; the effectiveness of actions of governments, legislators, regulators, businesses, investors, customers, and other stakeholders to mitigate the impact of climate and sustainability-related risks; changes in customer behavior and demand, changes in the available technology for mitigation and the effectiveness of any such technologies, as some of these new technologies may be unproven; excessive costs and expenses related to acquire and/or develop technology for mitigation; the roll-out of low carbon infrastructure; the availability and adoption of renewable energy in our value chain; the development of carbon capture, circular utilization, and sequestration technologies, including the adoption of cost-effective carbon-related technologies such as carbon capture, utilization, and storage; the availability of accurate, verifiable, reliable, consistent, and comparable climate-related data; lack of transparency and comparability of climate-related forward-looking methodologies; variation in approaches and outcomes, as variations in methodologies may lead to under or overestimates and consequently present exaggerated indication of climate-related risk; and reliance on assumptions and future uncertainty. Calculations of forward-looking metrics are complex and require many methodological choices and assumptions. Accordingly, undue reliance should not be placed on these forward-looking statements. Furthermore, changing national and international standards, industry and scientific practices, regulatory requirements, and market expectations regarding climate change, which remain under continuous development, are subject to different interpretations. There can be no assurance that these standards, practices, requirements, and expectations will not be interpreted differently than our understanding when defining sustainability-related ambitions and targets or change in a manner that substantially increases the cost or effort for us to achieve such ambitions and targets.

UNLESS OTHERWISE NOTED, ALL MONETARY FIGURES ARE PRESENTED IN DOLLARS, BASED ON INTERNATIONAL FINANCIAL REPORTING STANDARDS, AS APPLICABLE

Copyright Cemex, S.A.B. de C.V. and subsidiaries.


2026 Second Quarter Results    Page 18