
2nd Quarter 2026 Earnings Presentation July 23, 2026
Disclaimer FORWARD-LOOKING STATEMENTS This communication may contain certain forward-looking statements, including, but not limited to, certain plans, expectations, goals, projections, and statements about the benefits of the acquisition of Pacific Premier Bancorp, Inc. (“Pacific Premier”) by Columbia Banking System, Inc. (“Columbia”) the plans, objectives, expectations and intentions of Columbia and other statements that are not historical facts. Such statements are subject to numerous assumptions, risks, and uncertainties. All statements other than statements of historical fact, including statements about beliefs and expectations, are forward-looking statements. Forward-looking statements may be identified by words such as “expect,” “anticipate,” “believe,” “intend,” “estimate,” “plan,” “believe,” “target,” “goal,” or similar expressions, or future or conditional verbs such as “will,” “may,” “might,” “should,” “would,” “could,” or similar variations. The forward-looking statements are intended to be subject to the safe harbor provided by Section 27A of the Securities Act of 1933, Section 21E of the Securities Exchange Act of 1934, and the Private Securities Litigation Reform Act of 1995. In this presentation we make forward-looking statements about strategic and growth initiatives and the result of such activity. Risks and uncertainties that could cause results to differ from forward-looking statements we make include, without limitation: current and future economic and market conditions, including the effects of declines in housing and commercial real estate prices, high unemployment rates, renewed inflation and any recession or slowdown in economic growth particularly in the western United States; economic forecast variables that are either materially worse or better than end of quarter projections and deterioration in the economy that could result in increased loan and lease losses, especially those risks associated with concentrations in real estate related loans; risks related to our acquisition of Pacific Premier (the "Transaction"), including, among others, (i) any revenue synergies from the Transaction may not be fully realized or may take longer than anticipated to be realized, and (ii) deposit attrition as a result of the Transaction; the impact of proposed or imposed tariffs by the U.S. government and retaliatory tariffs proposed or imposed by U.S. trading partners that could have an adverse impact on customers; our ability to effectively manage problem credits; the impact of bank failures or adverse developments at other banks on general investor sentiment regarding the liquidity and stability of banks; changes in interest rates that could significantly reduce net interest income and negatively affect asset yields and valuations and funding sources; changes in the scope and cost of FDIC insurance and other coverage; our ability to successfully implement efficiency and operational excellence initiatives; our ability to successfully develop and market new products and technology; changes in laws or regulations; potential adverse reactions or changes to business or employee relationships; the effect of geopolitical instability, including wars, conflicts and terrorist attacks; and natural disasters and other similar unexpected events outside of our control. We also caution that the amount and timing of any future common stock dividends or repurchases will depend on the earnings, cash requirements and financial condition of Columbia, market conditions, capital requirements, applicable law and regulations (including federal securities laws and federal banking and state regulations), and other factors deemed relevant by Columbia's Board of Directors. NON-GAAP FINANCIAL MEASURES In addition to results presented in accordance with GAAP, this presentation contains certain non-GAAP financial measures. A reconciliation of GAAP to non-GAAP measures is included in the Appendix. The Company believes presenting certain non-GAAP financial measures provides investors with information useful in understanding our financial performance, our performance trends, and our financial position. We utilize these measures for internal planning and forecasting purposes, and operating pre-provision net revenue and operating return on tangible common equity are also used as part of our incentive compensation program for our executive officers. We, as well as securities analysts, investors, and other interested parties, also use these measures to compare peer company operating performance. We believe that our presentation and discussion, together with the accompanying reconciliations, provides a complete understanding of factors and trends affecting our business and allows investors to view performance in a manner similar to management. These non-GAAP measures should not be considered a substitution for GAAP basis measures and results, and we strongly encourage investors to review our consolidated financial statements in their entirety and not to rely on any single financial measure. Because non-GAAP financial measures are not standardized, it may not be possible to compare these financial measures with other companies’ non-GAAP financial measures having the same or similar names. 2
Table of Contents 3 Page Columbia Corporate Overview 4 2nd Quarter 2026 8 Appendix 22 Loan Portfolio Slides 23 Liquidity Overview 27 Securities Portfolio 28 Summary Income Statements 29 Summary Balance Sheets 30 Non-GAAP Reconciliations 31
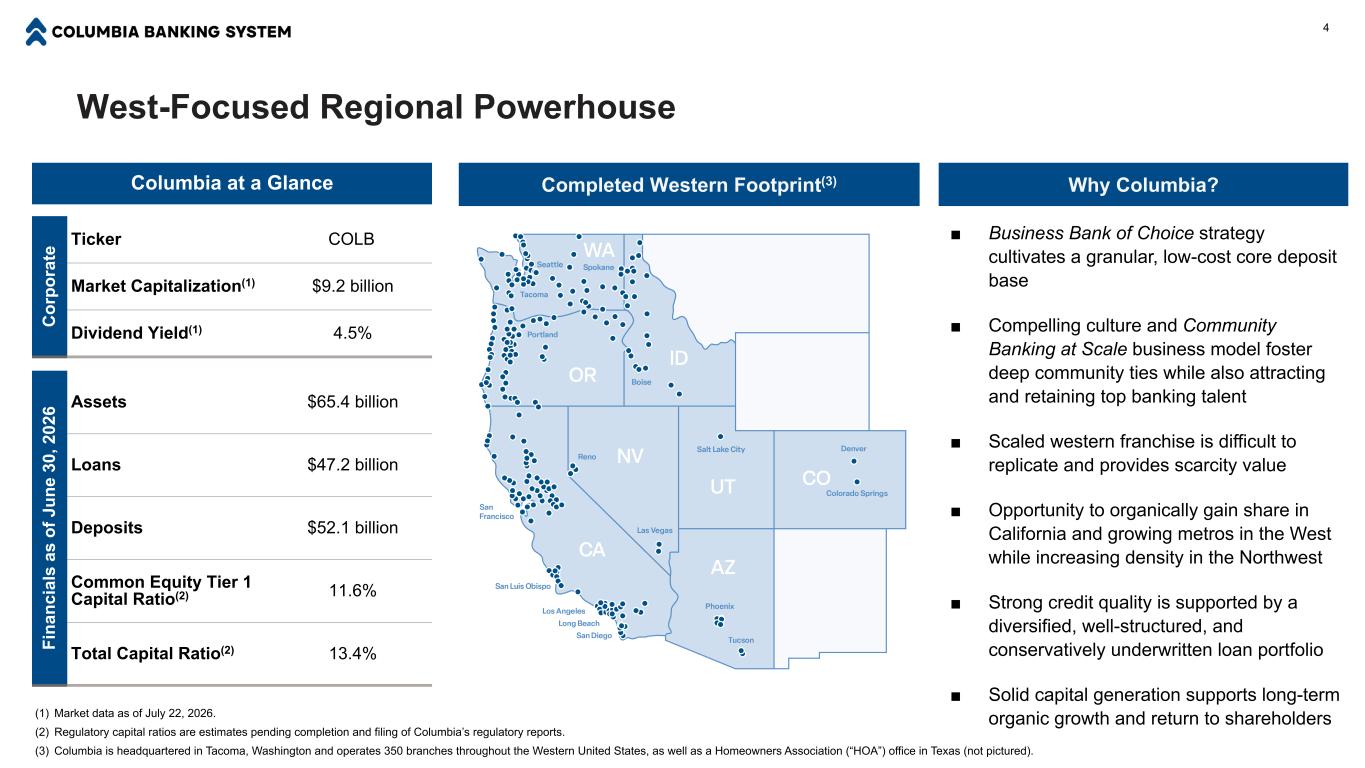
West-Focused Regional Powerhouse 4 Completed Western Footprint(3) Why Columbia? ■ Business Bank of Choice strategy cultivates a granular, low-cost core deposit base ■ Compelling culture and Community Banking at Scale business model foster deep community ties while also attracting and retaining top banking talent ■ Scaled western franchise is difficult to replicate and provides scarcity value ■ Opportunity to organically gain share in California and growing metros in the West while increasing density in the Northwest ■ Strong credit quality is supported by a diversified, well-structured, and conservatively underwritten loan portfolio ■ Solid capital generation supports long-term organic growth and return to shareholders Columbia at a Glance C or po ra te Ticker COLB Market Capitalization(1) $9.2 billion Dividend Yield(1) 4.5% Fi na nc ia ls a s of J un e 30 , 2 02 6 Assets $65.4 billion Loans $47.2 billion Deposits $52.1 billion Common Equity Tier 1 Capital Ratio(2) 11.6% Total Capital Ratio(2) 13.4% (1) Market data as of July 22, 2026. (2) Regulatory capital ratios are estimates pending completion and filing of Columbia’s regulatory reports. (3) Columbia is headquartered in Tacoma, Washington and operates 350 branches throughout the Western United States, as well as a Homeowners Association (“HOA”) office in Texas (not pictured).
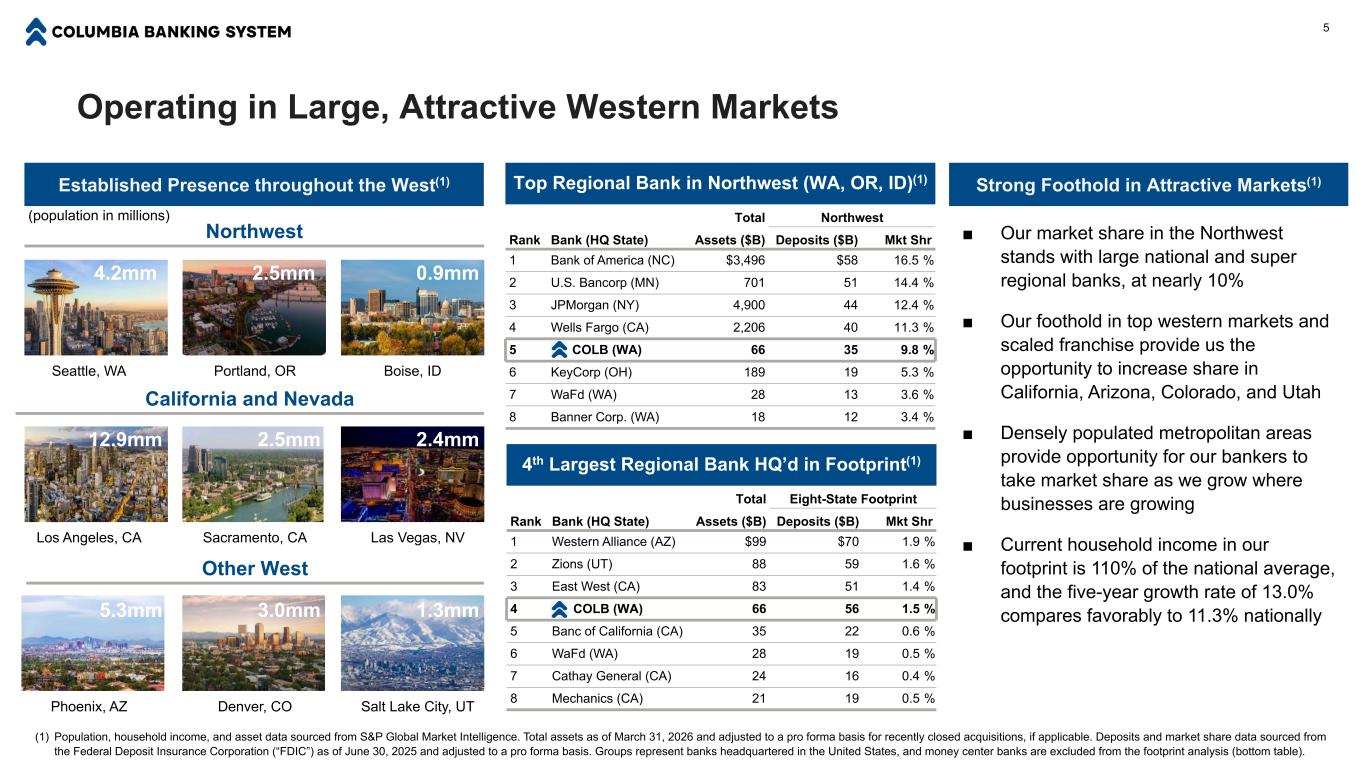
Operating in Large, Attractive Western Markets 5 Established Presence throughout the West(1) Northwest (population in millions) Seattle, WA Portland, OR California and Nevada Los Angeles, CA Sacramento, CA Other West Phoenix, AZ Denver, CO 4.2mm 2.5mm 12.9mm 2.5mm 5.3mm 3.0mm Top Regional Bank in Northwest (WA, OR, ID)(1) Total Northwest Rank Bank (HQ State) Assets ($B) Deposits ($B) Mkt Shr 1 Bank of America (NC) $3,496 $58 16.5 % 2 U.S. Bancorp (MN) 701 51 14.4 % 3 JPMorgan (NY) 4,900 44 12.4 % 4 Wells Fargo (CA) 2,206 40 11.3 % 5 COLB (WA) 66 35 9.8 % 6 KeyCorp (OH) 189 19 5.3 % 7 WaFd (WA) 28 13 3.6 % 8 Banner Corp. (WA) 18 12 3.4 % 4th Largest Regional Bank HQ’d in Footprint(1) Total Eight-State Footprint Rank Bank (HQ State) Assets ($B) Deposits ($B) Mkt Shr 1 Western Alliance (AZ) $99 $70 1.9 % 2 Zions (UT) 88 59 1.6 % 3 East West (CA) 83 51 1.4 % 4 COLB (WA) 66 56 1.5 % 5 Banc of California (CA) 35 22 0.6 % 6 WaFd (WA) 28 19 0.5 % 7 Cathay General (CA) 24 16 0.4 % 8 Mechanics (CA) 21 19 0.5 % Strong Foothold in Attractive Markets(1) ■ Our market share in the Northwest stands with large national and super regional banks, at nearly 10% ■ Our foothold in top western markets and scaled franchise provide us the opportunity to increase share in California, Arizona, Colorado, and Utah ■ Densely populated metropolitan areas provide opportunity for our bankers to take market share as we grow where businesses are growing ■ Current household income in our footprint is 110% of the national average, and the five-year growth rate of 13.0% compares favorably to 11.3% nationally Boise, ID Salt Lake City, UT Las Vegas, NV 0.9mm 2.4mm 1.3mm (1) Population, household income, and asset data sourced from S&P Global Market Intelligence. Total assets as of March 31, 2026 and adjusted to a pro forma basis for recently closed acquisitions, if applicable. Deposits and market share data sourced from the Federal Deposit Insurance Corporation (“FDIC”) as of June 30, 2025 and adjusted to a pro forma basis. Groups represent banks headquartered in the United States, and money center banks are excluded from the footprint analysis (bottom table).
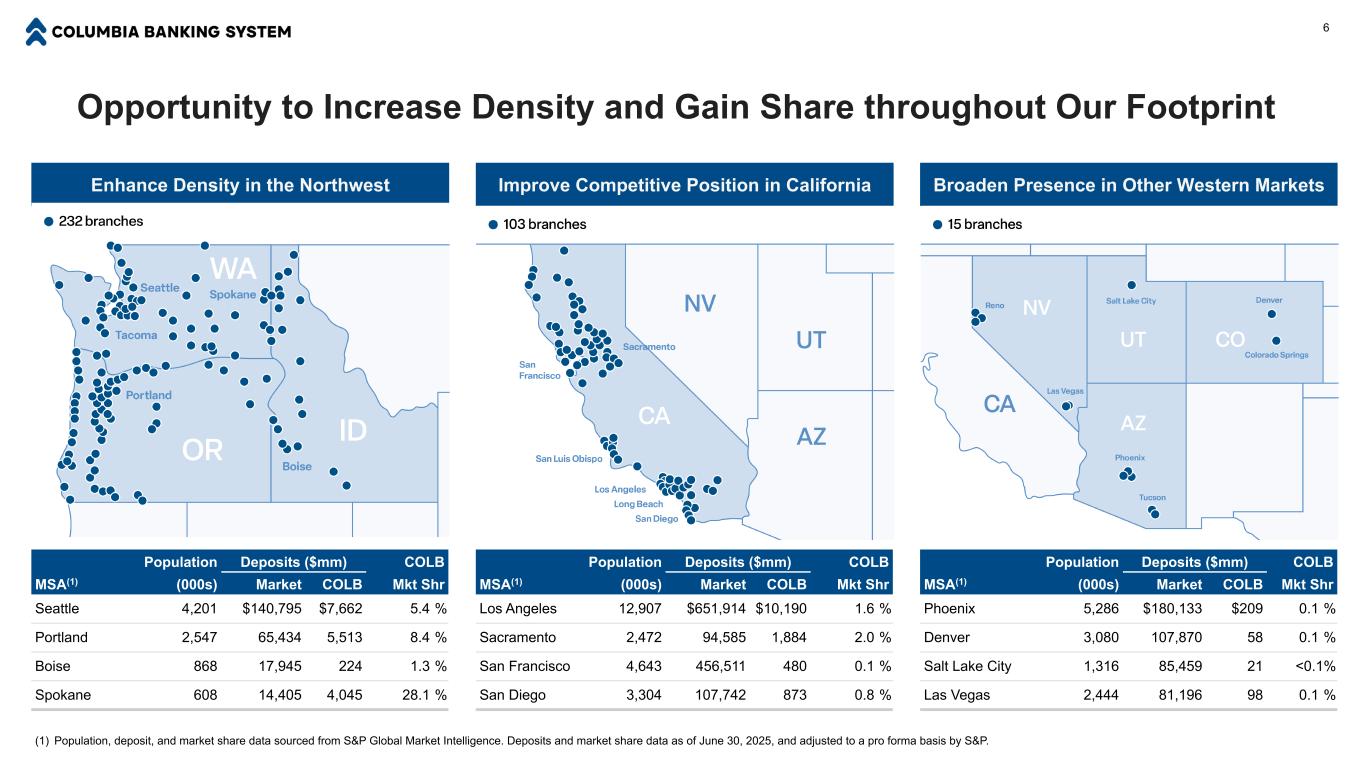
Population Deposits ($mm) COLB MSA(1) (000s) Market COLB Mkt Shr Seattle 4,201 $140,795 $7,662 5.4 % Portland 2,547 65,434 5,513 8.4 % Boise 868 17,945 224 1.3 % Spokane 608 14,405 4,045 28.1 % Opportunity to Increase Density and Gain Share throughout Our Footprint 6 Improve Competitive Position in California Broaden Presence in Other Western MarketsEnhance Density in the Northwest Population Deposits ($mm) COLB MSA(1) (000s) Market COLB Mkt Shr Phoenix 5,286 $180,133 $209 0.1 % Denver 3,080 107,870 58 0.1 % Salt Lake City 1,316 85,459 21 <0.1% Las Vegas 2,444 81,196 98 0.1 % Population Deposits ($mm) COLB MSA(1) (000s) Market COLB Mkt Shr Los Angeles 12,907 $651,914 $10,190 1.6 % Sacramento 2,472 94,585 1,884 2.0 % San Francisco 4,643 456,511 480 0.1 % San Diego 3,304 107,742 873 0.8 % (1) Population, deposit, and market share data sourced from S&P Global Market Intelligence. Deposits and market share data as of June 30, 2025, and adjusted to a pro forma basis by S&P.
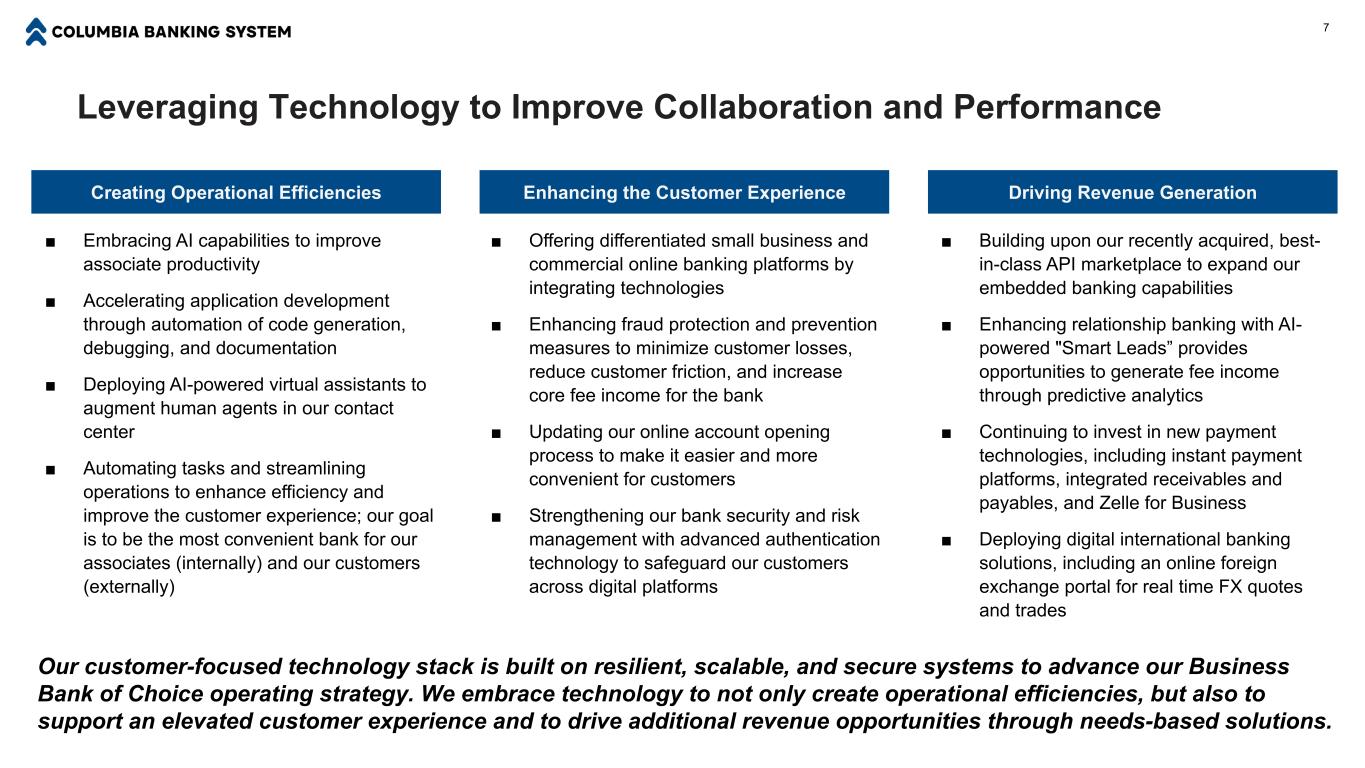
Leveraging Technology to Improve Collaboration and Performance 7 Enhancing the Customer Experience Driving Revenue GenerationCreating Operational Efficiencies ■ Building upon our recently acquired, best- in-class API marketplace to expand our embedded banking capabilities ■ Enhancing relationship banking with AI- powered "Smart Leads” provides opportunities to generate fee income through predictive analytics ■ Continuing to invest in new payment technologies, including instant payment platforms, integrated receivables and payables, and Zelle for Business ■ Deploying digital international banking solutions, including an online foreign exchange portal for real time FX quotes and trades ■ Offering differentiated small business and commercial online banking platforms by integrating technologies ■ Enhancing fraud protection and prevention measures to minimize customer losses, reduce customer friction, and increase core fee income for the bank ■ Updating our online account opening process to make it easier and more convenient for customers ■ Strengthening our bank security and risk management with advanced authentication technology to safeguard our customers across digital platforms ■ Embracing AI capabilities to improve associate productivity ■ Accelerating application development through automation of code generation, debugging, and documentation ■ Deploying AI-powered virtual assistants to augment human agents in our contact center ■ Automating tasks and streamlining operations to enhance efficiency and improve the customer experience; our goal is to be the most convenient bank for our associates (internally) and our customers (externally) Our customer-focused technology stack is built on resilient, scalable, and secure systems to advance our Business Bank of Choice operating strategy. We embrace technology to not only create operational efficiencies, but also to support an elevated customer experience and to drive additional revenue opportunities through needs-based solutions.
2nd Quarter 2026 8
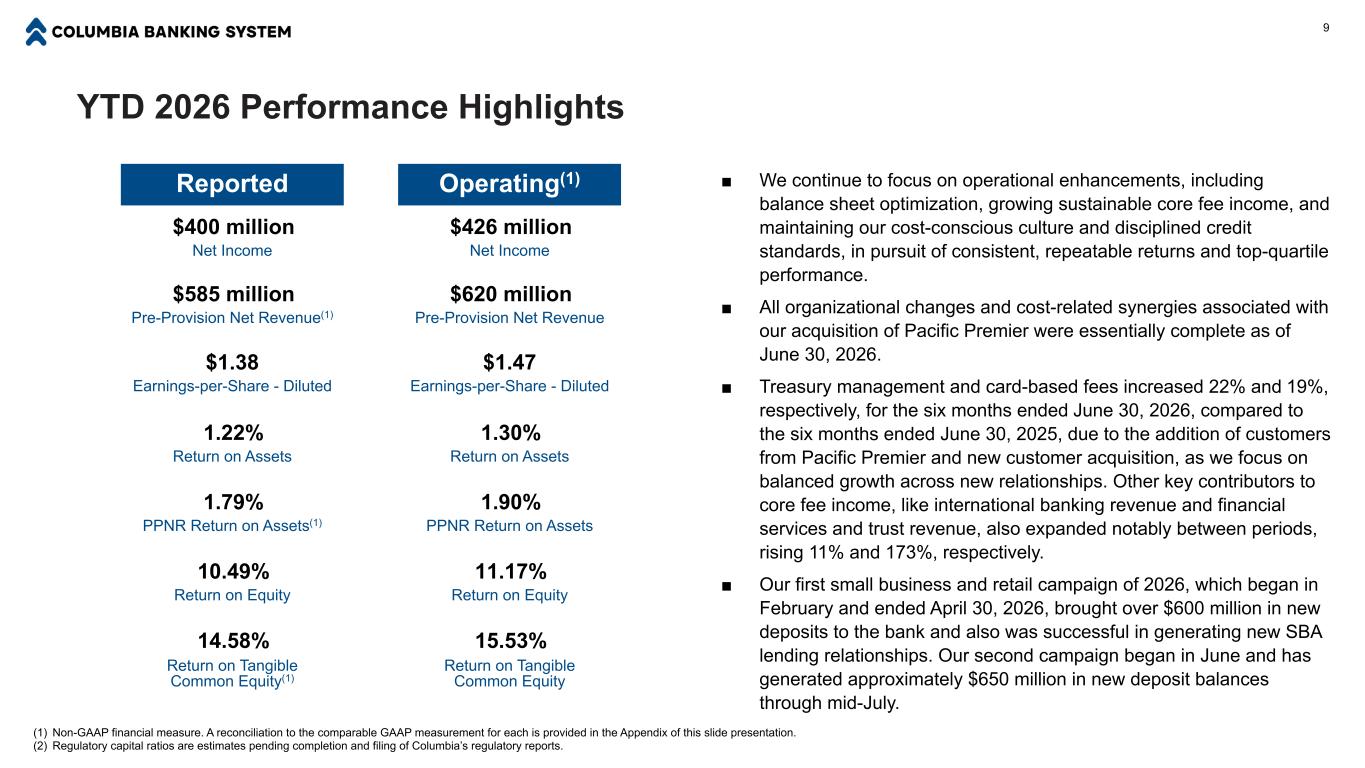
YTD 2026 Performance Highlights 9 ■ We continue to focus on operational enhancements, including balance sheet optimization, growing sustainable core fee income, and maintaining our cost-conscious culture and disciplined credit standards, in pursuit of consistent, repeatable returns and top-quartile performance. ■ All organizational changes and cost-related synergies associated with our acquisition of Pacific Premier were essentially complete as of June 30, 2026. ■ Treasury management and card-based fees increased 22% and 19%, respectively, for the six months ended June 30, 2026, compared to the six months ended June 30, 2025, due to the addition of customers from Pacific Premier and new customer acquisition, as we focus on balanced growth across new relationships. Other key contributors to core fee income, like international banking revenue and financial services and trust revenue, also expanded notably between periods, rising 11% and 173%, respectively. ■ Our first small business and retail campaign of 2026, which began in February and ended April 30, 2026, brought over $600 million in new deposits to the bank and also was successful in generating new SBA lending relationships. Our second campaign began in June and has generated approximately $650 million in new deposit balances through mid-July. Reported Operating(1) $400 million $426 million Net Income Net Income $585 million $620 million Pre-Provision Net Revenue(1) Pre-Provision Net Revenue $1.38 $1.47 Earnings-per-Share - Diluted Earnings-per-Share - Diluted 1.22% 1.30% Return on Assets Return on Assets 1.79% 1.90% PPNR Return on Assets(1) PPNR Return on Assets 10.49% 11.17% Return on Equity Return on Equity 14.58% 15.53% Return on Tangible Common Equity(1) Return on Tangible Common Equity (1) Non-GAAP financial measure. A reconciliation to the comparable GAAP measurement for each is provided in the Appendix of this slide presentation. (2) Regulatory capital ratios are estimates pending completion and filing of Columbia’s regulatory reports.
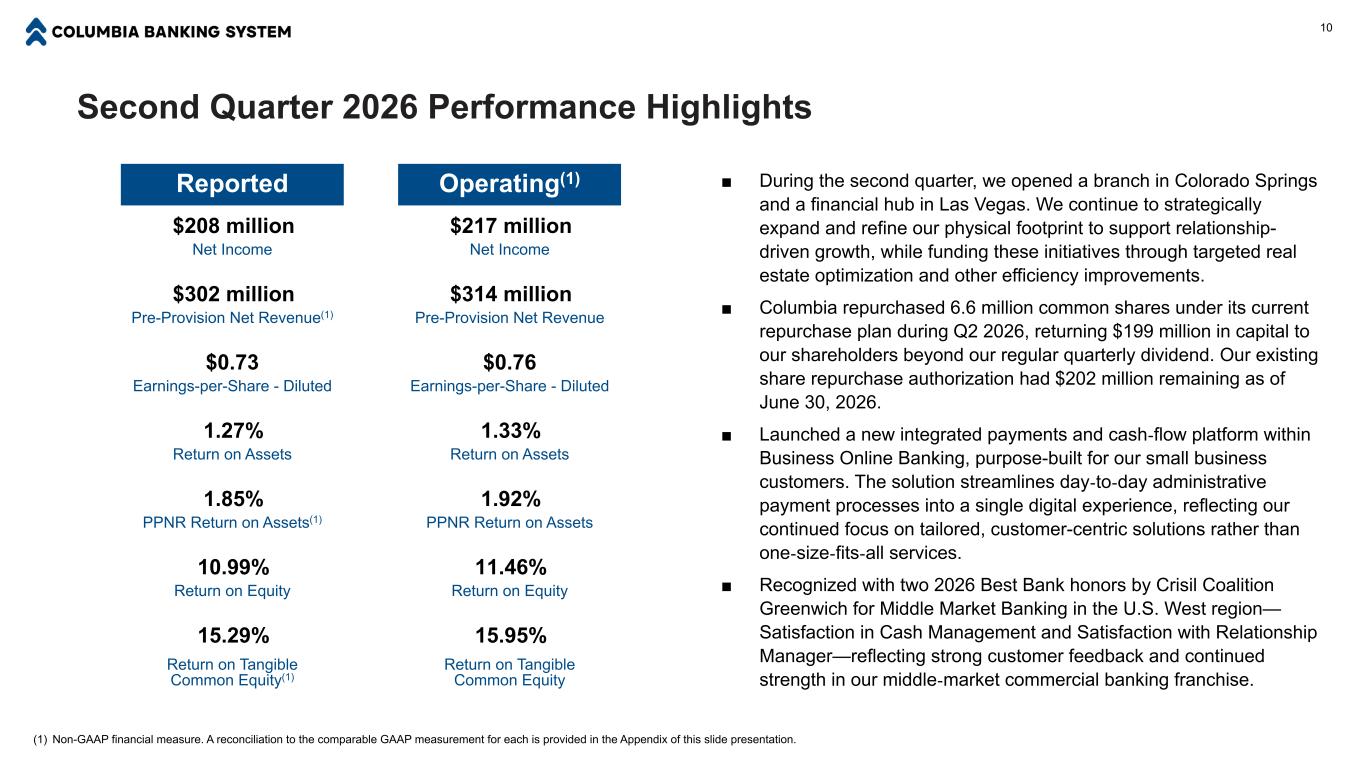
Second Quarter 2026 Performance Highlights 10 ■ During the second quarter, we opened a branch in Colorado Springs and a financial hub in Las Vegas. We continue to strategically expand and refine our physical footprint to support relationship- driven growth, while funding these initiatives through targeted real estate optimization and other efficiency improvements. ■ Columbia repurchased 6.6 million common shares under its current repurchase plan during Q2 2026, returning $199 million in capital to our shareholders beyond our regular quarterly dividend. Our existing share repurchase authorization had $202 million remaining as of June 30, 2026. ■ Launched a new integrated payments and cash-flow platform within Business Online Banking, purpose-built for our small business customers. The solution streamlines day-to-day administrative payment processes into a single digital experience, reflecting our continued focus on tailored, customer-centric solutions rather than one-size-fits-all services. ■ Recognized with two 2026 Best Bank honors by Crisil Coalition Greenwich for Middle Market Banking in the U.S. West region— Satisfaction in Cash Management and Satisfaction with Relationship Manager—reflecting strong customer feedback and continued strength in our middle-market commercial banking franchise. Reported Operating(1) $208 million $217 million Net Income Net Income $302 million $314 million Pre-Provision Net Revenue(1) Pre-Provision Net Revenue $0.73 $0.76 Earnings-per-Share - Diluted Earnings-per-Share - Diluted 1.27% 1.33% Return on Assets Return on Assets 1.85% 1.92% PPNR Return on Assets(1) PPNR Return on Assets 10.99% 11.46% Return on Equity Return on Equity 15.29% 15.95% Return on Tangible Common Equity(1) Return on Tangible Common Equity (1) Non-GAAP financial measure. A reconciliation to the comparable GAAP measurement for each is provided in the Appendix of this slide presentation.
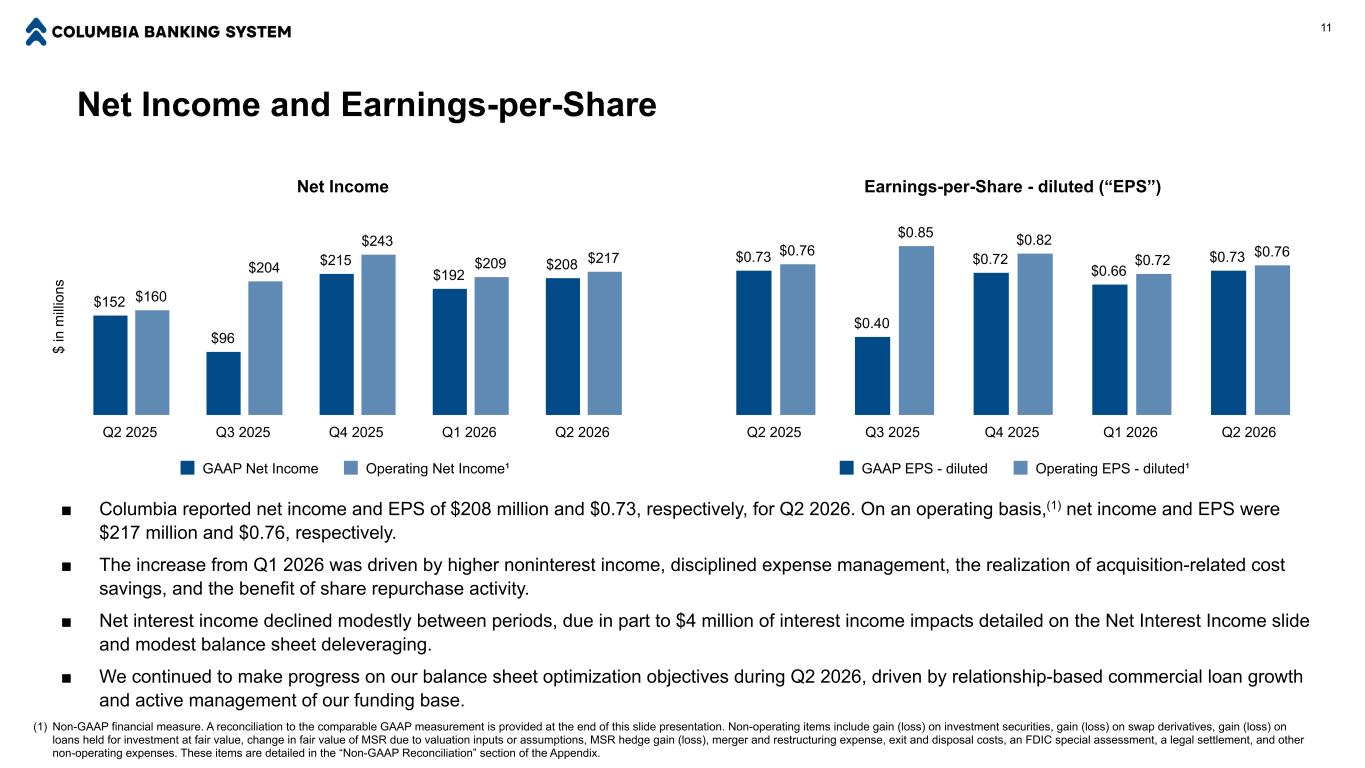
Net Income and Earnings-per-Share 11 $ in m ill io ns Net Income $152 $96 $215 $192 $208 $160 $204 $243 $209 $217 GAAP Net Income Operating Net Income¹ Q2 2025 Q3 2025 Q4 2025 Q1 2026 Q2 2026 ■ Columbia reported net income and EPS of $208 million and $0.73, respectively, for Q2 2026. On an operating basis,(1) net income and EPS were $217 million and $0.76, respectively. ■ The increase from Q1 2026 was driven by higher noninterest income, disciplined expense management, the realization of acquisition-related cost savings, and the benefit of share repurchase activity. ■ Net interest income declined modestly between periods, due in part to $4 million of interest income impacts detailed on the Net Interest Income slide and modest balance sheet deleveraging. ■ We continued to make progress on our balance sheet optimization objectives during Q2 2026, driven by relationship-based commercial loan growth and active management of our funding base. (1) Non-GAAP financial measure. A reconciliation to the comparable GAAP measurement is provided at the end of this slide presentation. Non-operating items include gain (loss) on investment securities, gain (loss) on swap derivatives, gain (loss) on loans held for investment at fair value, change in fair value of MSR due to valuation inputs or assumptions, MSR hedge gain (loss), merger and restructuring expense, exit and disposal costs, an FDIC special assessment, a legal settlement, and other non-operating expenses. These items are detailed in the “Non-GAAP Reconciliation” section of the Appendix. Earnings-per-Share - diluted (“EPS”) $0.73 $0.40 $0.72 $0.66 $0.73$0.76 $0.85 $0.82 $0.72 $0.76 GAAP EPS - diluted Operating EPS - diluted¹ Q2 2025 Q3 2025 Q4 2025 Q1 2026 Q2 2026
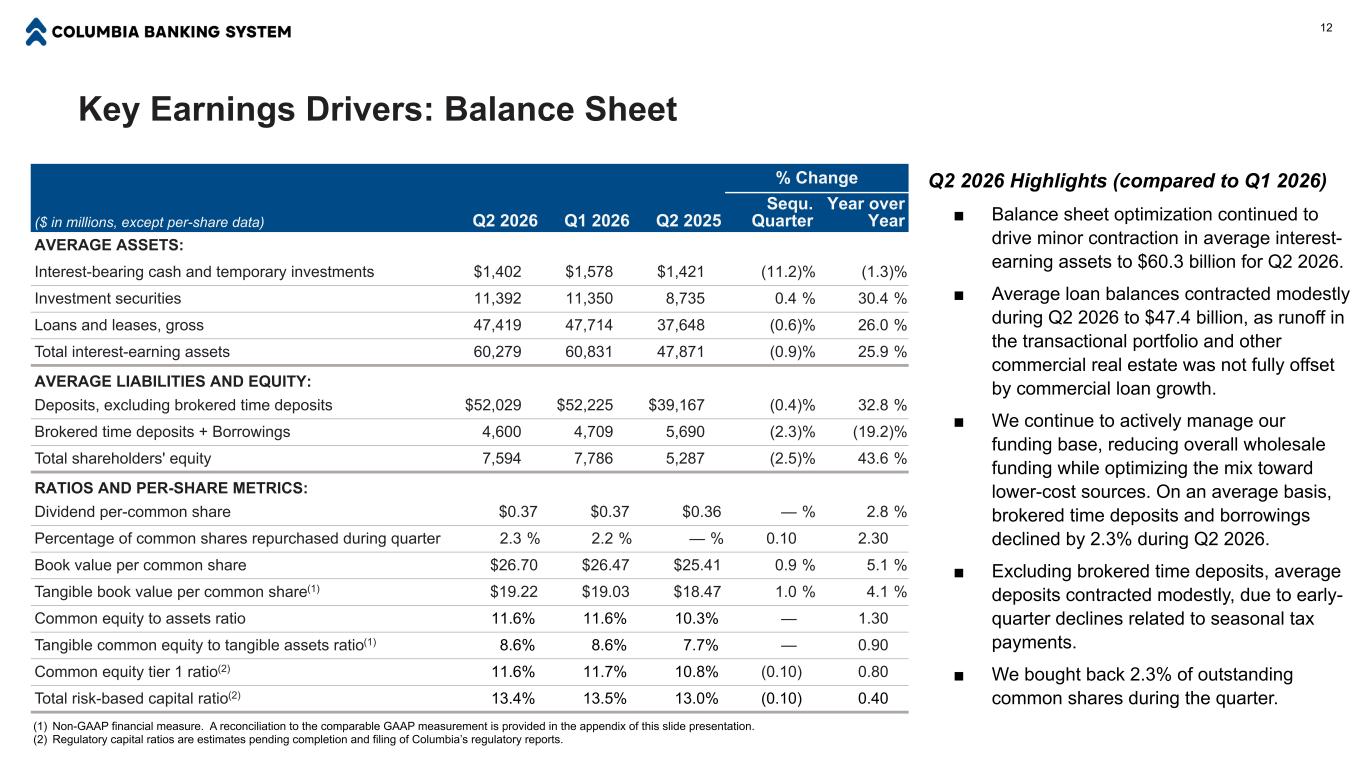
Key Earnings Drivers: Balance Sheet (1) Non-GAAP financial measure. A reconciliation to the comparable GAAP measurement is provided in the appendix of this slide presentation. (2) Regulatory capital ratios are estimates pending completion and filing of Columbia’s regulatory reports. % Change ($ in millions, except per-share data) Q2 2026 Q1 2026 Q2 2025 Sequ. Quarter Year over Year AVERAGE ASSETS: Interest-bearing cash and temporary investments $1,402 $1,578 $1,421 (11.2) % (1.3) % Investment securities 11,392 11,350 8,735 0.4 % 30.4 % Loans and leases, gross 47,419 47,714 37,648 (0.6) % 26.0 % Total interest-earning assets 60,279 60,831 47,871 (0.9) % 25.9 % AVERAGE LIABILITIES AND EQUITY: Deposits, excluding brokered time deposits $52,029 $52,225 $39,167 (0.4) % 32.8 % Brokered time deposits + Borrowings 4,600 4,709 5,690 (2.3) % (19.2) % Total shareholders' equity 7,594 7,786 5,287 (2.5) % 43.6 % RATIOS AND PER-SHARE METRICS: Dividend per-common share $0.37 $0.37 $0.36 — % 2.8 % Percentage of common shares repurchased during quarter 2.3 % 2.2 % — % 0.10 2.30 Book value per common share $26.70 $26.47 $25.41 0.9 % 5.1 % Tangible book value per common share(1) $19.22 $19.03 $18.47 1.0 % 4.1 % Common equity to assets ratio 11.6% 11.6% 10.3% — 1.30 Tangible common equity to tangible assets ratio(1) 8.6% 8.6% 7.7% — 0.90 Common equity tier 1 ratio(2) 11.6% 11.7% 10.8% (0.10) 0.80 Total risk-based capital ratio(2) 13.4% 13.5% 13.0% (0.10) 0.40 12 Q2 2026 Highlights (compared to Q1 2026) ■ Balance sheet optimization continued to drive minor contraction in average interest- earning assets to $60.3 billion for Q2 2026. ■ Average loan balances contracted modestly during Q2 2026 to $47.4 billion, as runoff in the transactional portfolio and other commercial real estate was not fully offset by commercial loan growth. ■ We continue to actively manage our funding base, reducing overall wholesale funding while optimizing the mix toward lower-cost sources. On an average basis, brokered time deposits and borrowings declined by 2.3% during Q2 2026. ■ Excluding brokered time deposits, average deposits contracted modestly, due to early- quarter declines related to seasonal tax payments. ■ We bought back 2.3% of outstanding common shares during the quarter.
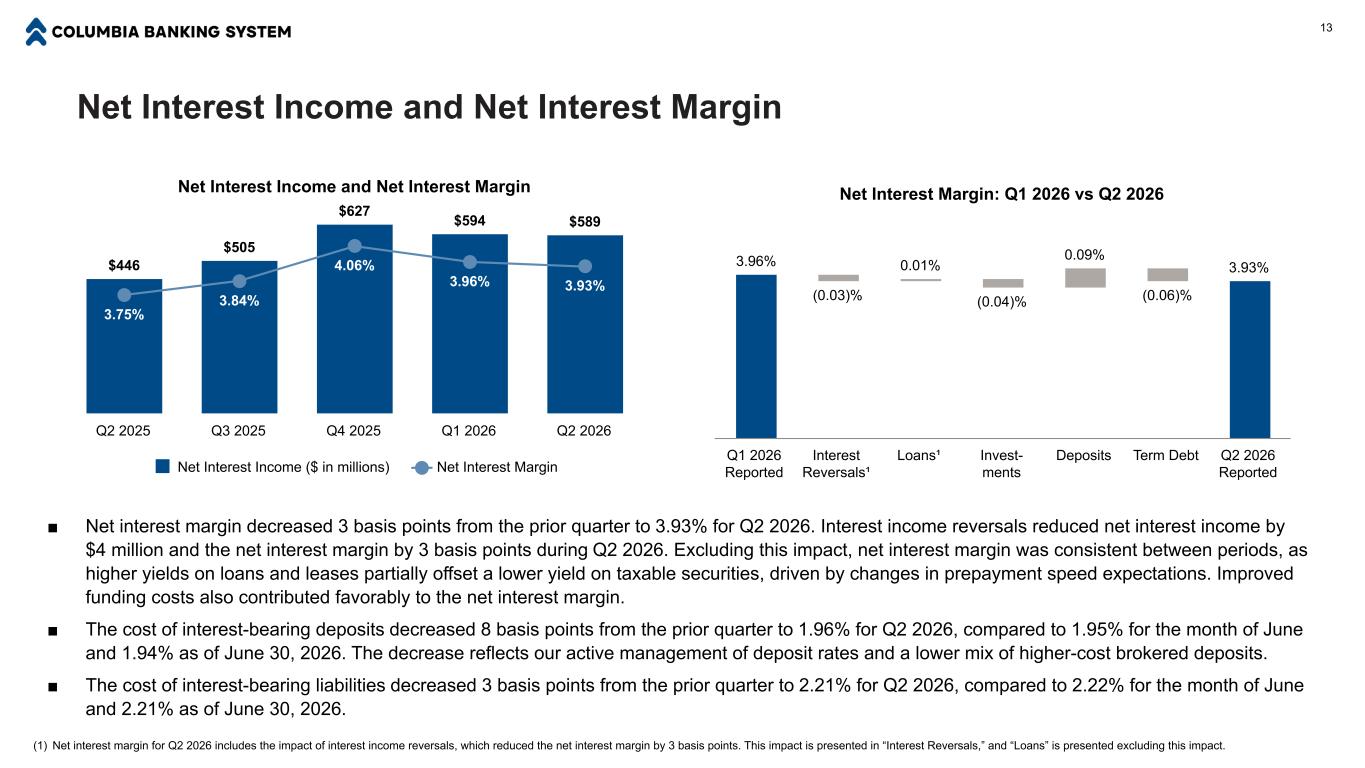
Net Interest Income and Net Interest Margin Net Interest Income and Net Interest Margin $446 $505 $627 $594 $589 3.75% 3.84% 4.06% 3.96% 3.93% Net Interest Income ($ in millions) Net Interest Margin Q2 2025 Q3 2025 Q4 2025 Q1 2026 Q2 2026 Net Interest Margin: Q1 2026 vs Q2 2026 3.96% (0.03)% 0.01% (0.04)% 0.09% (0.06)% 3.93% Q1 2026 Reported Interest Reversals¹ Loans¹ Invest- ments Deposits Term Debt Q2 2026 Reported 13 ■ Net interest margin decreased 3 basis points from the prior quarter to 3.93% for Q2 2026. Interest income reversals reduced net interest income by $4 million and the net interest margin by 3 basis points during Q2 2026. Excluding this impact, net interest margin was consistent between periods, as higher yields on loans and leases partially offset a lower yield on taxable securities, driven by changes in prepayment speed expectations. Improved funding costs also contributed favorably to the net interest margin. ■ The cost of interest-bearing deposits decreased 8 basis points from the prior quarter to 1.96% for Q2 2026, compared to 1.95% for the month of June and 1.94% as of June 30, 2026. The decrease reflects our active management of deposit rates and a lower mix of higher-cost brokered deposits. ■ The cost of interest-bearing liabilities decreased 3 basis points from the prior quarter to 2.21% for Q2 2026, compared to 2.22% for the month of June and 2.21% as of June 30, 2026. (1) Net interest margin for Q2 2026 includes the impact of interest income reversals, which reduced the net interest margin by 3 basis points. This impact is presented in “Interest Reversals,” and “Loans” is presented excluding this impact.
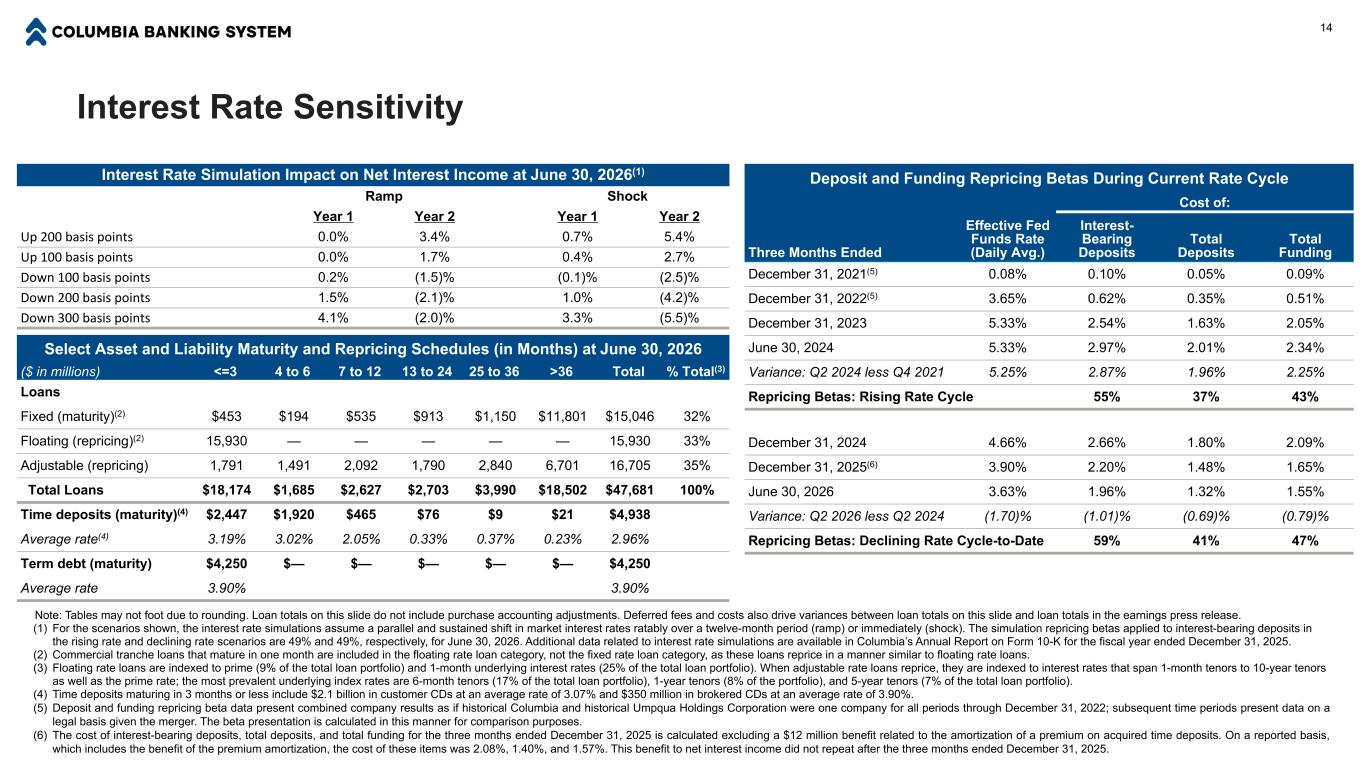
Select Asset and Liability Maturity and Repricing Schedules (in Months) at June 30, 2026 ($ in millions) <=3 4 to 6 7 to 12 13 to 24 25 to 36 >36 Total % Total(3) Loans Fixed (maturity)(2) $453 $194 $535 $913 $1,150 $11,801 $15,046 32% Floating (repricing)(2) 15,930 — — — — — 15,930 33% Adjustable (repricing) 1,791 1,491 2,092 1,790 2,840 6,701 16,705 35% Total Loans $18,174 $1,685 $2,627 $2,703 $3,990 $18,502 $47,681 100% Time deposits (maturity)(4) $2,447 $1,920 $465 $76 $9 $21 $4,938 Average rate(4) 3.19% 3.02% 2.05% 0.33% 0.37% 0.23% 2.96% Term debt (maturity) $4,250 $— $— $— $— $— $4,250 Average rate 3.90% 3.90% Interest Rate Sensitivity 14 Note: Tables may not foot due to rounding. Loan totals on this slide do not include purchase accounting adjustments. Deferred fees and costs also drive variances between loan totals on this slide and loan totals in the earnings press release. (1) For the scenarios shown, the interest rate simulations assume a parallel and sustained shift in market interest rates ratably over a twelve-month period (ramp) or immediately (shock). The simulation repricing betas applied to interest-bearing deposits in the rising rate and declining rate scenarios are 49% and 49%, respectively, for June 30, 2026. Additional data related to interest rate simulations are available in Columbia’s Annual Report on Form 10-K for the fiscal year ended December 31, 2025. (2) Commercial tranche loans that mature in one month are included in the floating rate loan category, not the fixed rate loan category, as these loans reprice in a manner similar to floating rate loans. (3) Floating rate loans are indexed to prime (9% of the total loan portfolio) and 1-month underlying interest rates (25% of the total loan portfolio). When adjustable rate loans reprice, they are indexed to interest rates that span 1-month tenors to 10-year tenors as well as the prime rate; the most prevalent underlying index rates are 6-month tenors (17% of the total loan portfolio), 1-year tenors (8% of the portfolio), and 5-year tenors (7% of the total loan portfolio). (4) Time deposits maturing in 3 months or less include $2.1 billion in customer CDs at an average rate of 3.07% and $350 million in brokered CDs at an average rate of 3.90%. (5) Deposit and funding repricing beta data present combined company results as if historical Columbia and historical Umpqua Holdings Corporation were one company for all periods through December 31, 2022; subsequent time periods present data on a legal basis given the merger. The beta presentation is calculated in this manner for comparison purposes. (6) The cost of interest-bearing deposits, total deposits, and total funding for the three months ended December 31, 2025 is calculated excluding a $12 million benefit related to the amortization of a premium on acquired time deposits. On a reported basis, which includes the benefit of the premium amortization, the cost of these items was 2.08%, 1.40%, and 1.57%. This benefit to net interest income did not repeat after the three months ended December 31, 2025. Interest Rate Simulation Impact on Net Interest Income at June 30, 2026(1) Ramp Shock Year 1 Year 2 Year 1 Year 2 Up 200 basis points 0.0% 3.4% 0.7% 5.4% Up 100 basis points 0.0% 1.7% 0.4% 2.7% Down 100 basis points 0.2% (1.5)% (0.1)% (2.5)% Down 200 basis points 1.5% (2.1)% 1.0% (4.2)% Down 300 basis points 4.1% (2.0)% 3.3% (5.5)% Deposit and Funding Repricing Betas During Current Rate Cycle Effective Fed Funds Rate (Daily Avg.) Cost of: Three Months Ended Interest- Bearing Deposits Total Deposits Total Funding December 31, 2021(5) 0.08% 0.10% 0.05% 0.09% December 31, 2022(5) 3.65% 0.62% 0.35% 0.51% December 31, 2023 5.33% 2.54% 1.63% 2.05% June 30, 2024 5.33% 2.97% 2.01% 2.34% Variance: Q2 2024 less Q4 2021 5.25% 2.87% 1.96% 2.25% Repricing Betas: Rising Rate Cycle 55% 37% 43% December 31, 2024 4.66% 2.66% 1.80% 2.09% December 31, 2025(6) 3.90% 2.20% 1.48% 1.65% June 30, 2026 3.63% 1.96% 1.32% 1.55% Variance: Q2 2026 less Q2 2024 (1.70)% (1.01)% (0.69)% (0.79)% Repricing Betas: Declining Rate Cycle-to-Date 59% 41% 47%
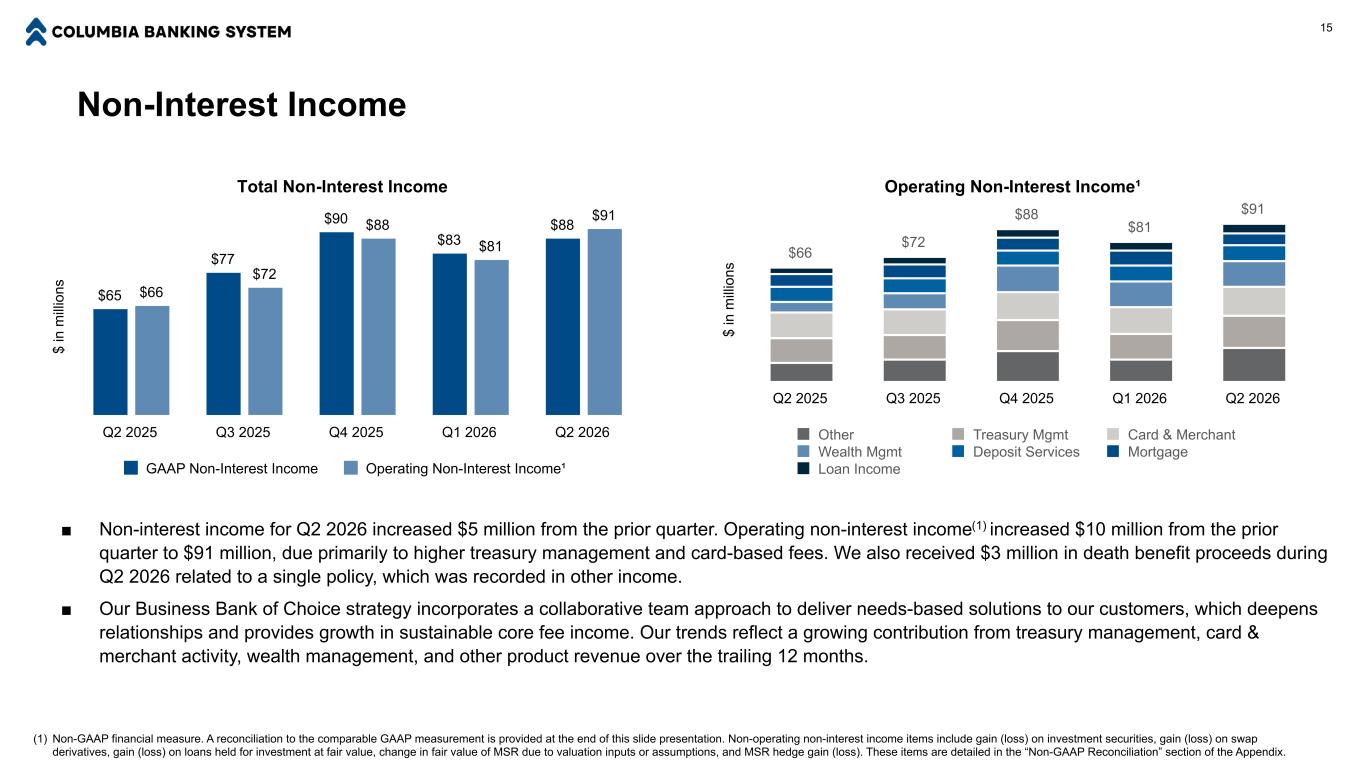
Non-Interest Income 15 $ in m ill io ns Total Non-Interest Income $65 $77 $90 $83 $88 $66 $72 $88 $81 $91 GAAP Non-Interest Income Operating Non-Interest Income¹ Q2 2025 Q3 2025 Q4 2025 Q1 2026 Q2 2026 ■ Non-interest income for Q2 2026 increased $5 million from the prior quarter. Operating non-interest income(1) increased $10 million from the prior quarter to $91 million, due primarily to higher treasury management and card-based fees. We also received $3 million in death benefit proceeds during Q2 2026 related to a single policy, which was recorded in other income. ■ Our Business Bank of Choice strategy incorporates a collaborative team approach to deliver needs-based solutions to our customers, which deepens relationships and provides growth in sustainable core fee income. Our trends reflect a growing contribution from treasury management, card & merchant activity, wealth management, and other product revenue over the trailing 12 months. $ in m ill io ns Operating Non-Interest Income¹ $66 $72 $88 $81 $91 Other Treasury Mgmt Card & Merchant Wealth Mgmt Deposit Services Mortgage Loan Income Q2 2025 Q3 2025 Q4 2025 Q1 2026 Q2 2026 (1) Non-GAAP financial measure. A reconciliation to the comparable GAAP measurement is provided at the end of this slide presentation. Non-operating non-interest income items include gain (loss) on investment securities, gain (loss) on swap derivatives, gain (loss) on loans held for investment at fair value, change in fair value of MSR due to valuation inputs or assumptions, and MSR hedge gain (loss). These items are detailed in the “Non-GAAP Reconciliation” section of the Appendix.
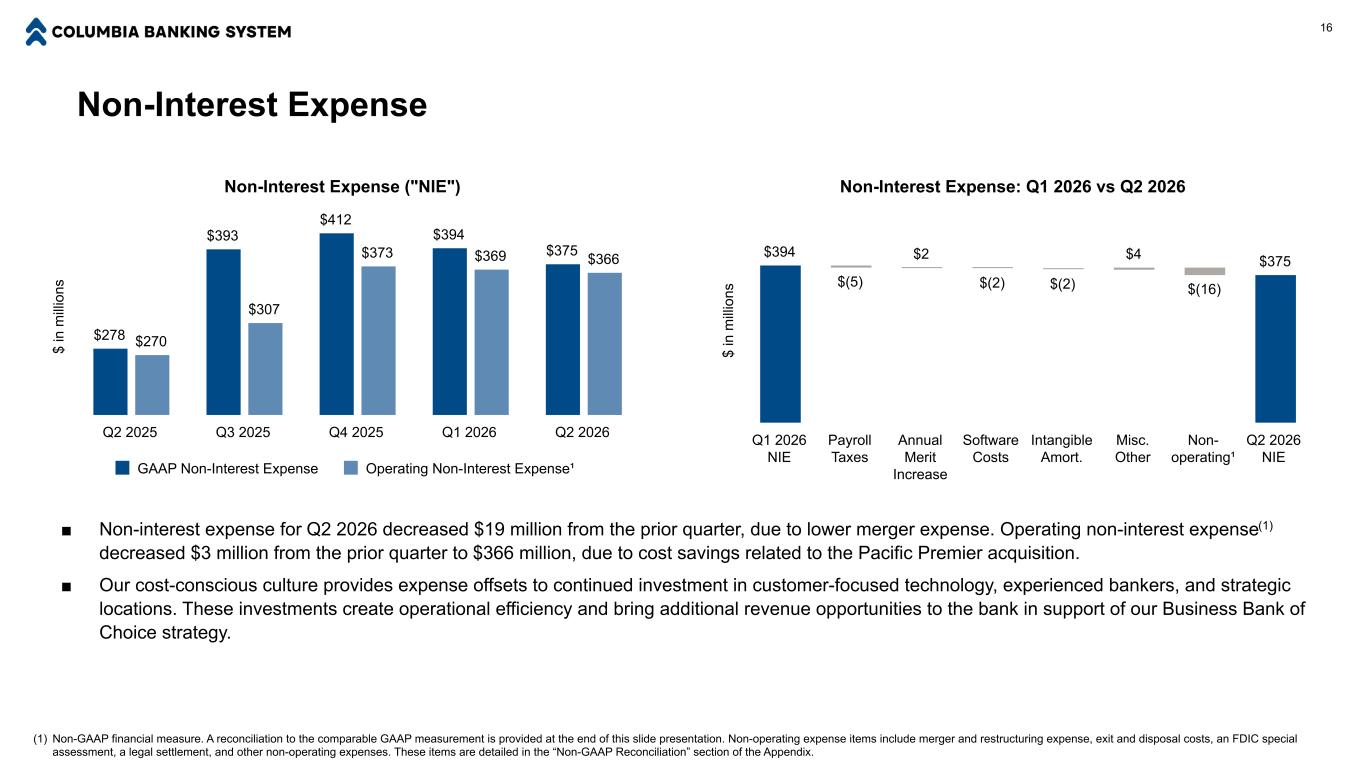
Non-Interest Expense 16 $ in m ill io ns Non-Interest Expense ("NIE") $278 $393 $412 $394 $375 $270 $307 $373 $369 $366 GAAP Non-Interest Expense Operating Non-Interest Expense¹ Q2 2025 Q3 2025 Q4 2025 Q1 2026 Q2 2026 ■ Non-interest expense for Q2 2026 decreased $19 million from the prior quarter, due to lower merger expense. Operating non-interest expense(1) decreased $3 million from the prior quarter to $366 million, due to cost savings related to the Pacific Premier acquisition. ■ Our cost-conscious culture provides expense offsets to continued investment in customer-focused technology, experienced bankers, and strategic locations. These investments create operational efficiency and bring additional revenue opportunities to the bank in support of our Business Bank of Choice strategy. $ in m ill io ns Non-Interest Expense: Q1 2026 vs Q2 2026 $394 $(5) $2 $(2) $(2) $4 $(16) $375 Q1 2026 NIE Payroll Taxes Annual Merit Increase Software Costs Intangible Amort. Misc. Other Non- operating¹ Q2 2026 NIE (1) Non-GAAP financial measure. A reconciliation to the comparable GAAP measurement is provided at the end of this slide presentation. Non-operating expense items include merger and restructuring expense, exit and disposal costs, an FDIC special assessment, a legal settlement, and other non-operating expenses. These items are detailed in the “Non-GAAP Reconciliation” section of the Appendix.
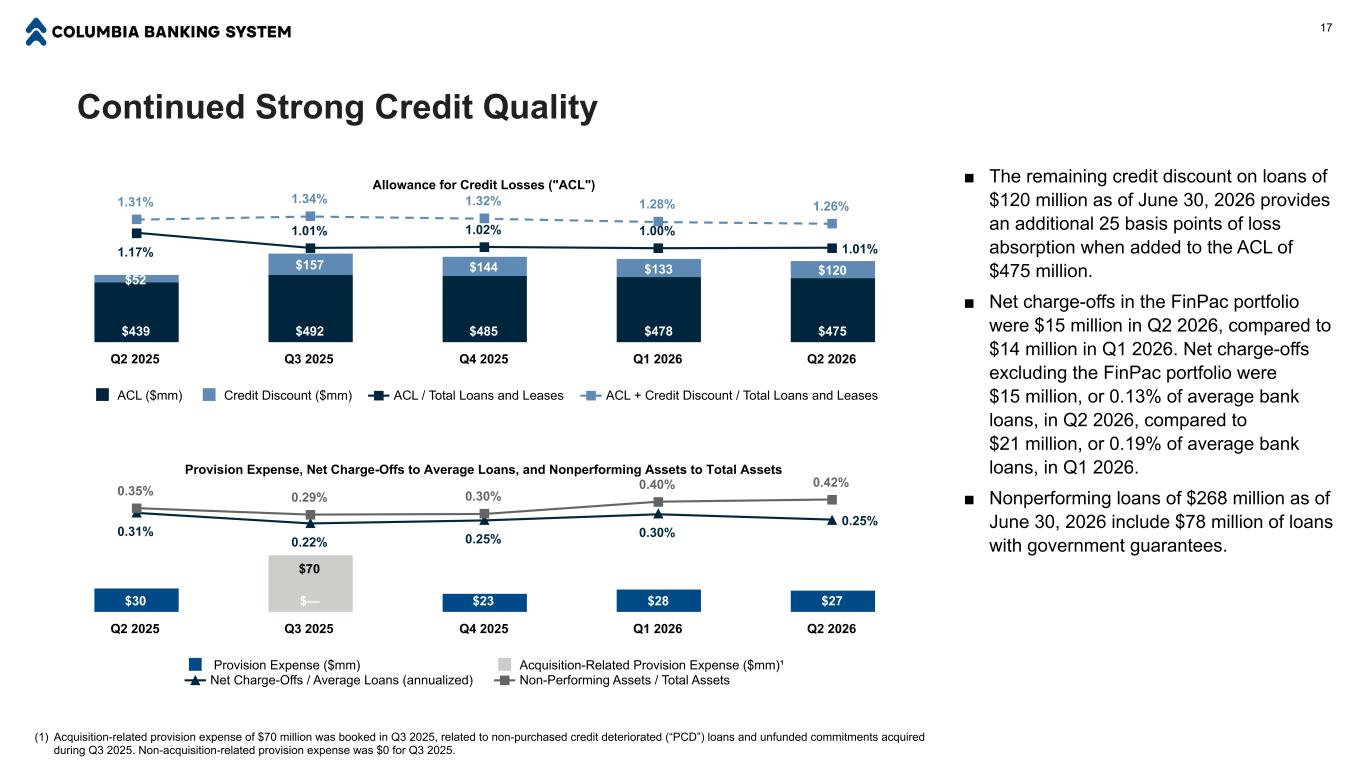
Continued Strong Credit Quality Provision Expense, Net Charge-Offs to Average Loans, and Nonperforming Assets to Total Assets $30 $— $23 $28 $27 $70 0.31% 0.22% 0.25% 0.30% 0.25% 0.35% 0.29% 0.30% 0.40% 0.42% Provision Expense ($mm) Acquisition-Related Provision Expense ($mm)¹ Net Charge-Offs / Average Loans (annualized) Non-Performing Assets / Total Assets Q2 2025 Q3 2025 Q4 2025 Q1 2026 Q2 2026 17 Allowance for Credit Losses ("ACL") $439 $492 $485 $478 $475 $52 $157 $144 $133 $120 1.17% 1.01% 1.02% 1.00% 1.01% 1.31% 1.34% 1.32% 1.28% 1.26% ACL ($mm) Credit Discount ($mm) ACL / Total Loans and Leases ACL + Credit Discount / Total Loans and Leases Q2 2025 Q3 2025 Q4 2025 Q1 2026 Q2 2026 ■ The remaining credit discount on loans of $120 million as of June 30, 2026 provides an additional 25 basis points of loss absorption when added to the ACL of $475 million. ■ Net charge-offs in the FinPac portfolio were $15 million in Q2 2026, compared to $14 million in Q1 2026. Net charge-offs excluding the FinPac portfolio were $15 million, or 0.13% of average bank loans, in Q2 2026, compared to $21 million, or 0.19% of average bank loans, in Q1 2026. ■ Nonperforming loans of $268 million as of June 30, 2026 include $78 million of loans with government guarantees. (1) Acquisition-related provision expense of $70 million was booked in Q3 2025, related to non-purchased credit deteriorated (“PCD”) loans and unfunded commitments acquired during Q3 2025. Non-acquisition-related provision expense was $0 for Q3 2025.
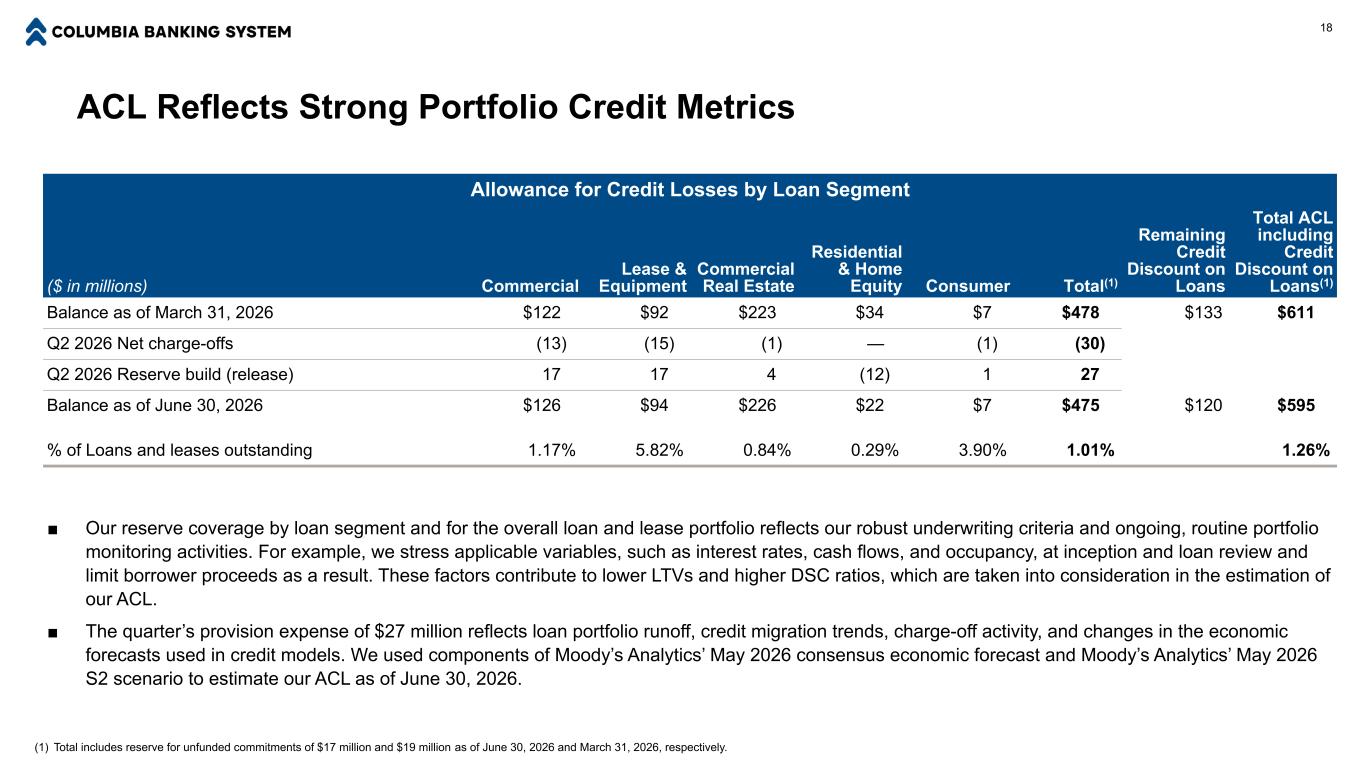
ACL Reflects Strong Portfolio Credit Metrics (1) Total includes reserve for unfunded commitments of $17 million and $19 million as of June 30, 2026 and March 31, 2026, respectively. 18 ■ Our reserve coverage by loan segment and for the overall loan and lease portfolio reflects our robust underwriting criteria and ongoing, routine portfolio monitoring activities. For example, we stress applicable variables, such as interest rates, cash flows, and occupancy, at inception and loan review and limit borrower proceeds as a result. These factors contribute to lower LTVs and higher DSC ratios, which are taken into consideration in the estimation of our ACL. ■ The quarter’s provision expense of $27 million reflects loan portfolio runoff, credit migration trends, charge-off activity, and changes in the economic forecasts used in credit models. We used components of Moody’s Analytics’ May 2026 consensus economic forecast and Moody’s Analytics’ May 2026 S2 scenario to estimate our ACL as of June 30, 2026. Allowance for Credit Losses by Loan Segment ($ in millions) Commercial Lease & Equipment Commercial Real Estate Residential & Home Equity Consumer Total(1) Remaining Credit Discount on Loans Total ACL including Credit Discount on Loans(1) Balance as of March 31, 2026 $122 $92 $223 $34 $7 $478 $133 $611 Q2 2026 Net charge-offs (13) (15) (1) — (1) (30) Q2 2026 Reserve build (release) 17 17 4 (12) 1 27 Balance as of June 30, 2026 $126 $94 $226 $22 $7 $475 $120 $595 % of Loans and leases outstanding 1.17% 5.82% 0.84% 0.29% 3.90% 1.01% 1.26%
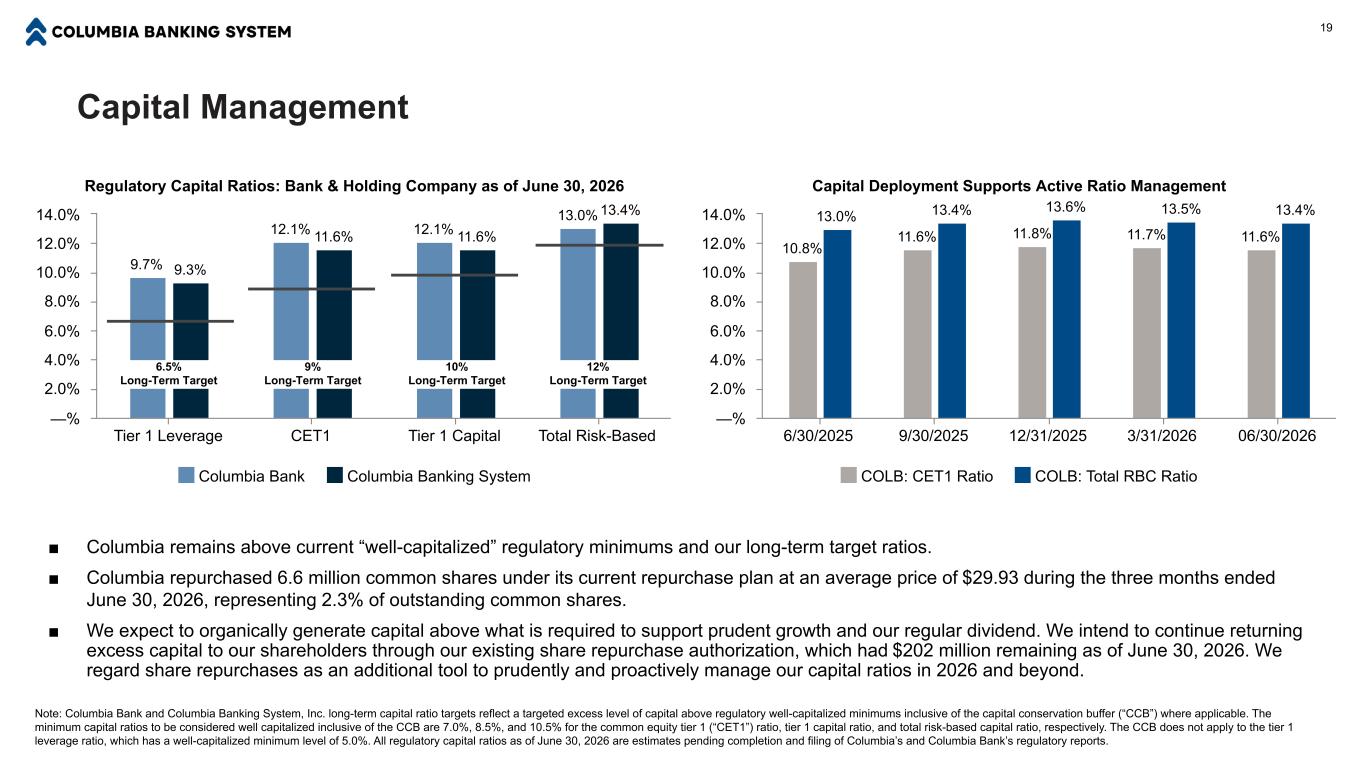
Capital Management 19 Regulatory Capital Ratios: Bank & Holding Company as of June 30, 2026 9.7% 12.1% 12.1% 13.0% 9.3% 11.6% 11.6% 13.4% Columbia Bank Columbia Banking System Tier 1 Leverage CET1 Tier 1 Capital Total Risk-Based —% 2.0% 4.0% 6.0% 8.0% 10.0% 12.0% 14.0% ■ Columbia remains above current “well-capitalized” regulatory minimums and our long-term target ratios. ■ Columbia repurchased 6.6 million common shares under its current repurchase plan at an average price of $29.93 during the three months ended June 30, 2026, representing 2.3% of outstanding common shares. ■ We expect to organically generate capital above what is required to support prudent growth and our regular dividend. We intend to continue returning excess capital to our shareholders through our existing share repurchase authorization, which had $202 million remaining as of June 30, 2026. We regard share repurchases as an additional tool to prudently and proactively manage our capital ratios in 2026 and beyond. Note: Columbia Bank and Columbia Banking System, Inc. long-term capital ratio targets reflect a targeted excess level of capital above regulatory well-capitalized minimums inclusive of the capital conservation buffer (“CCB”) where applicable. The minimum capital ratios to be considered well capitalized inclusive of the CCB are 7.0%, 8.5%, and 10.5% for the common equity tier 1 (“CET1”) ratio, tier 1 capital ratio, and total risk-based capital ratio, respectively. The CCB does not apply to the tier 1 leverage ratio, which has a well-capitalized minimum level of 5.0%. All regulatory capital ratios as of June 30, 2026 are estimates pending completion and filing of Columbia’s and Columbia Bank’s regulatory reports. Capital Deployment Supports Active Ratio Management 10.8% 11.6% 11.8% 11.7% 11.6% 13.0% 13.4% 13.6% 13.5% 13.4% COLB: CET1 Ratio COLB: Total RBC Ratio 6/30/2025 9/30/2025 12/31/2025 3/31/2026 06/30/2026 —% 2.0% 4.0% 6.0% 8.0% 10.0% 12.0% 14.0% 12% Long-Term Target 10% Long-Term Target 9% Long-Term Target 6.5% Long-Term Target
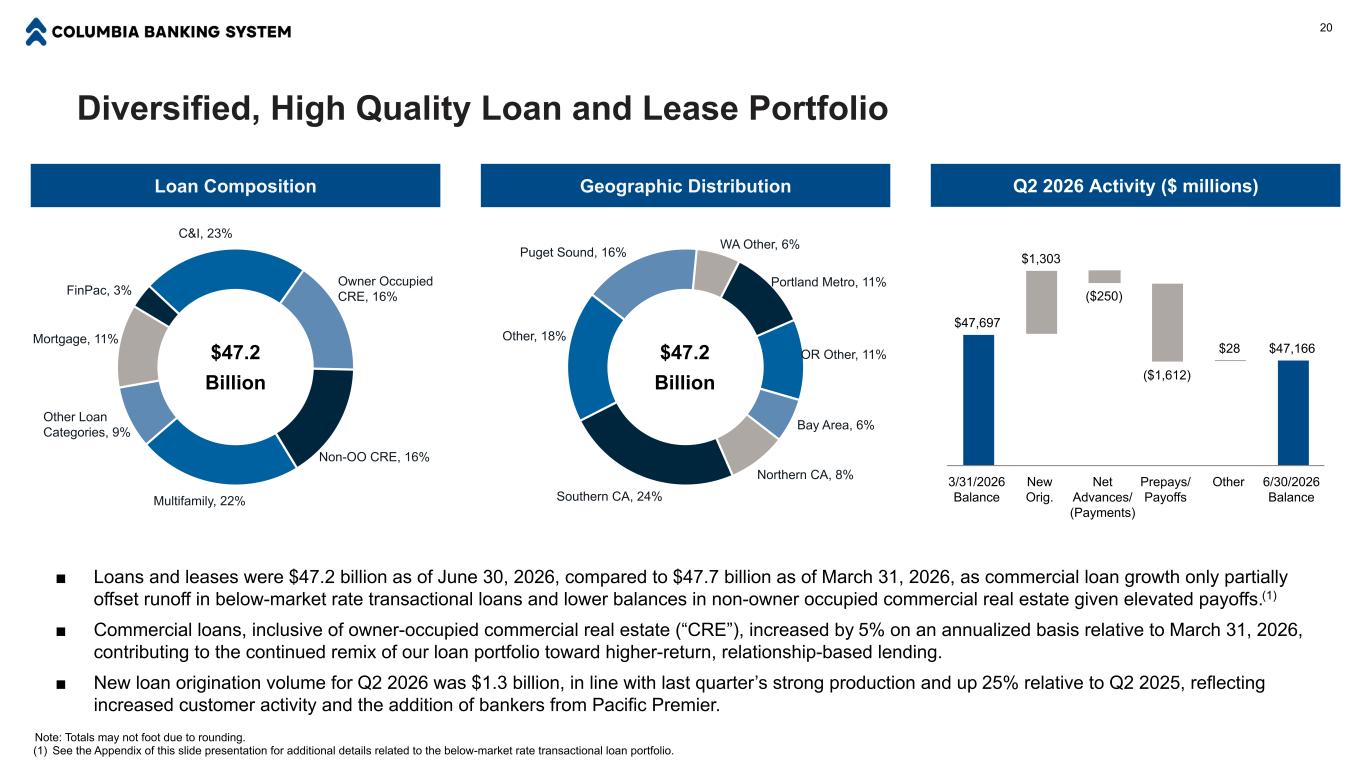
Diversified, High Quality Loan and Lease Portfolio $47,697 $1,303 ($250) ($1,612) $28 $47,166 3/31/2026 Balance New Orig. Net Advances/ (Payments) Prepays/ Payoffs Other 6/30/2026 Balance 20 Mortgage, 11% FinPac, 3% C&I, 23% Owner Occupied CRE, 16% Non-OO CRE, 16% Multifamily, 22% Other Loan Categories, 9% Q2 2026 Activity ($ millions) Other, 18% Puget Sound, 16% WA Other, 6% Portland Metro, 11% OR Other, 11% Bay Area, 6% Northern CA, 8% Southern CA, 24% Geographic Distribution ■ Loans and leases were $47.2 billion as of June 30, 2026, compared to $47.7 billion as of March 31, 2026, as commercial loan growth only partially offset runoff in below-market rate transactional loans and lower balances in non-owner occupied commercial real estate given elevated payoffs.(1) ■ Commercial loans, inclusive of owner-occupied commercial real estate (“CRE”), increased by 5% on an annualized basis relative to March 31, 2026, contributing to the continued remix of our loan portfolio toward higher-return, relationship-based lending. ■ New loan origination volume for Q2 2026 was $1.3 billion, in line with last quarter’s strong production and up 25% relative to Q2 2025, reflecting increased customer activity and the addition of bankers from Pacific Premier. Loan Composition $47.2 Billion $47.2 Billion Note: Totals may not foot due to rounding. (1) See the Appendix of this slide presentation for additional details related to the below-market rate transactional loan portfolio.
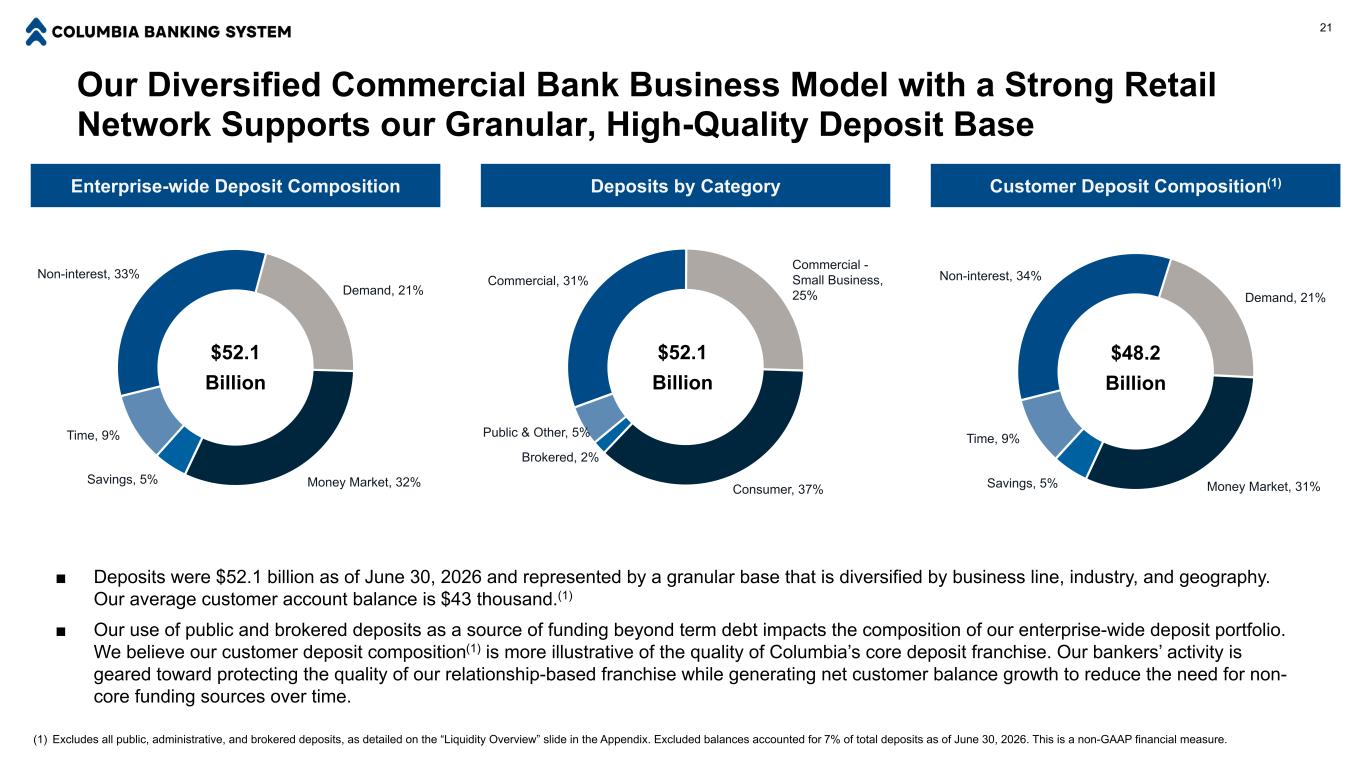
Our Diversified Commercial Bank Business Model with a Strong Retail Network Supports our Granular, High-Quality Deposit Base Non-interest, 33% Demand, 21% Money Market, 32%Savings, 5% Time, 9% Enterprise-wide Deposit Composition 21 ■ Deposits were $52.1 billion as of June 30, 2026 and represented by a granular base that is diversified by business line, industry, and geography. Our average customer account balance is $43 thousand.(1) ■ Our use of public and brokered deposits as a source of funding beyond term debt impacts the composition of our enterprise-wide deposit portfolio. We believe our customer deposit composition(1) is more illustrative of the quality of Columbia’s core deposit franchise. Our bankers’ activity is geared toward protecting the quality of our relationship-based franchise while generating net customer balance growth to reduce the need for non- core funding sources over time. Commercial, 31% Commercial - Small Business, 25% Consumer, 37% Brokered, 2% Public & Other, 5% Deposits by Category Customer Deposit Composition(1) Non-interest, 34% Demand, 21% Money Market, 31%Savings, 5% Time, 9% (1) Excludes all public, administrative, and brokered deposits, as detailed on the “Liquidity Overview” slide in the Appendix. Excluded balances accounted for 7% of total deposits as of June 30, 2026. This is a non-GAAP financial measure. $52.1 Billion $52.1 Billion $48.2 Billion
Appendix 22 Page Loan Portfolio Slides 23 Liquidity Overview 27 Securities Portfolio 28 Summary Income Statements 29 Summary Balance Sheets 30 Non-GAAP Reconciliations 31
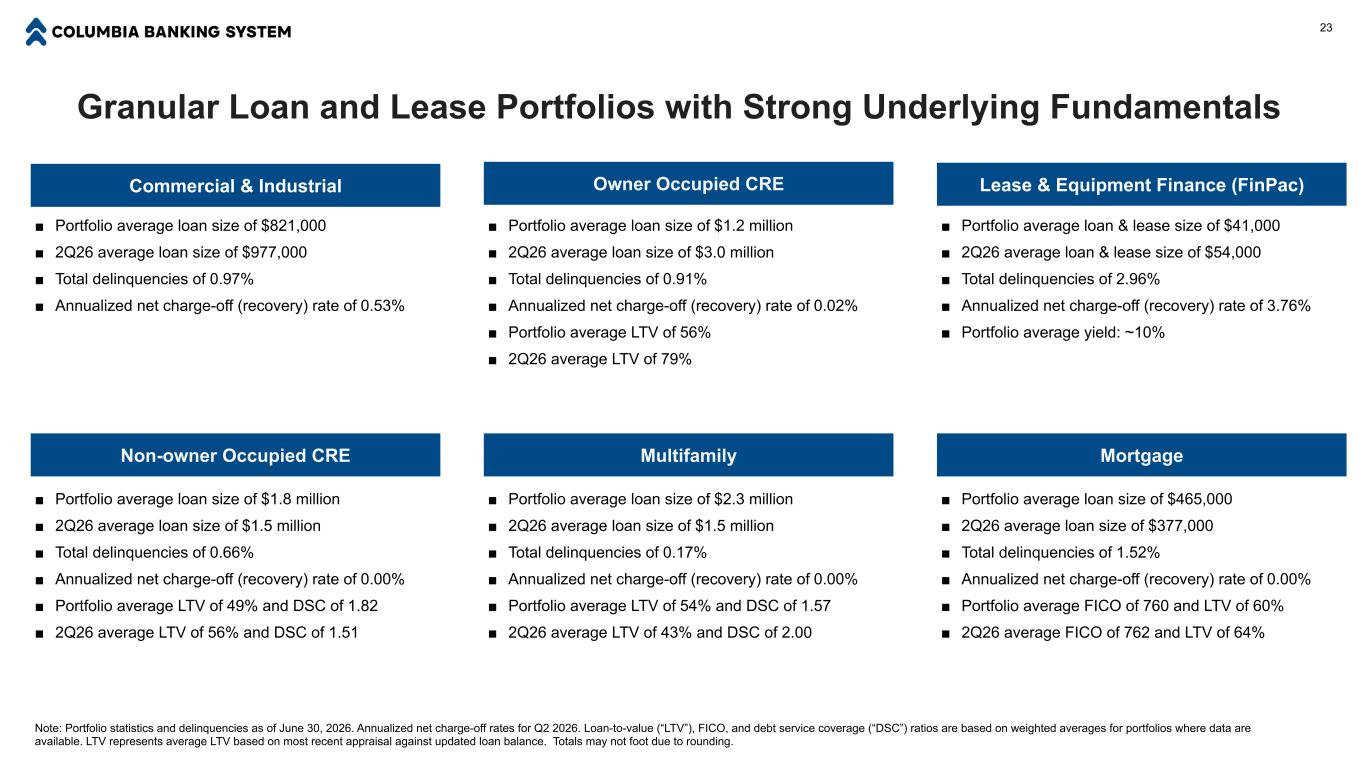
Granular Loan and Lease Portfolios with Strong Underlying Fundamentals Note: Portfolio statistics and delinquencies as of June 30, 2026. Annualized net charge-off rates for Q2 2026. Loan-to-value (“LTV”), FICO, and debt service coverage (“DSC”) ratios are based on weighted averages for portfolios where data are available. LTV represents average LTV based on most recent appraisal against updated loan balance. Totals may not foot due to rounding. ■ Portfolio average loan size of $465,000 ■ 2Q26 average loan size of $377,000 ■ Total delinquencies of 1.52% ■ Annualized net charge-off (recovery) rate of 0.00% ■ Portfolio average FICO of 760 and LTV of 60% ■ 2Q26 average FICO of 762 and LTV of 64% Non-owner Occupied CRE ■ Portfolio average loan size of $1.8 million ■ 2Q26 average loan size of $1.5 million ■ Total delinquencies of 0.66% ■ Annualized net charge-off (recovery) rate of 0.00% ■ Portfolio average LTV of 49% and DSC of 1.82 ■ 2Q26 average LTV of 56% and DSC of 1.51 Commercial & Industrial ■ Portfolio average loan size of $821,000 ■ 2Q26 average loan size of $977,000 ■ Total delinquencies of 0.97% ■ Annualized net charge-off (recovery) rate of 0.53% Multifamily ■ Portfolio average loan size of $2.3 million ■ 2Q26 average loan size of $1.5 million ■ Total delinquencies of 0.17% ■ Annualized net charge-off (recovery) rate of 0.00% ■ Portfolio average LTV of 54% and DSC of 1.57 ■ 2Q26 average LTV of 43% and DSC of 2.00 Owner Occupied CRE ■ Portfolio average loan size of $1.2 million ■ 2Q26 average loan size of $3.0 million ■ Total delinquencies of 0.91% ■ Annualized net charge-off (recovery) rate of 0.02% ■ Portfolio average LTV of 56% ■ 2Q26 average LTV of 79% Lease & Equipment Finance (FinPac) ■ Portfolio average loan & lease size of $41,000 ■ 2Q26 average loan & lease size of $54,000 ■ Total delinquencies of 2.96% ■ Annualized net charge-off (recovery) rate of 3.76% ■ Portfolio average yield: ~10% Mortgage 23
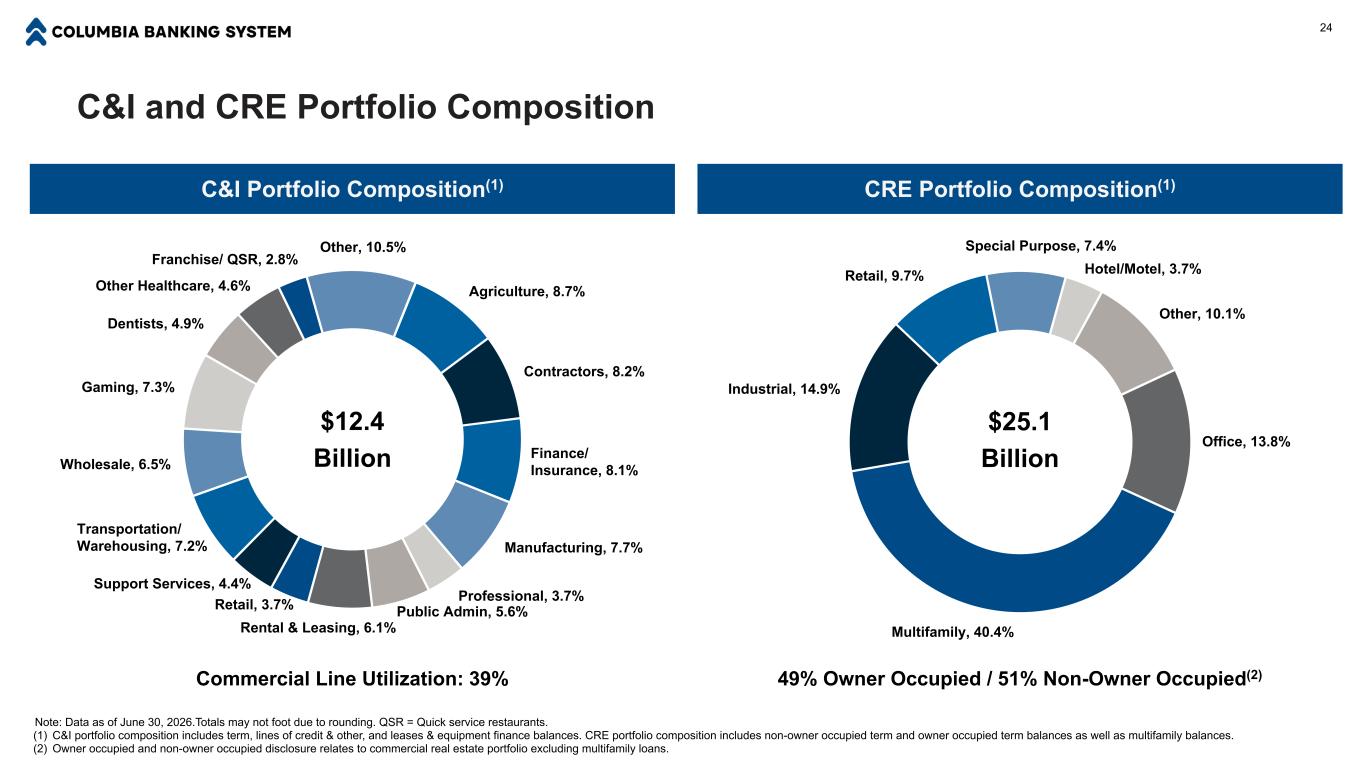
C&I and CRE Portfolio Composition Agriculture, 8.7% Contractors, 8.2% Finance/ Insurance, 8.1% Manufacturing, 7.7% Professional, 3.7% Public Admin, 5.6% Rental & Leasing, 6.1% Retail, 3.7% Support Services, 4.4% Transportation/ Warehousing, 7.2% Wholesale, 6.5% Gaming, 7.3% Dentists, 4.9% Other Healthcare, 4.6% Franchise/ QSR, 2.8% Other, 10.5% Office, 13.8% Multifamily, 40.4% Industrial, 14.9% Retail, 9.7% Special Purpose, 7.4% Hotel/Motel, 3.7% Other, 10.1% CRE Portfolio Composition(1)C&I Portfolio Composition(1) Note: Data as of June 30, 2026.Totals may not foot due to rounding. QSR = Quick service restaurants. (1) C&I portfolio composition includes term, lines of credit & other, and leases & equipment finance balances. CRE portfolio composition includes non-owner occupied term and owner occupied term balances as well as multifamily balances. (2) Owner occupied and non-owner occupied disclosure relates to commercial real estate portfolio excluding multifamily loans. 49% Owner Occupied / 51% Non-Owner Occupied(2)Commercial Line Utilization: 39% 24 $12.4 Billion $25.1 Billion
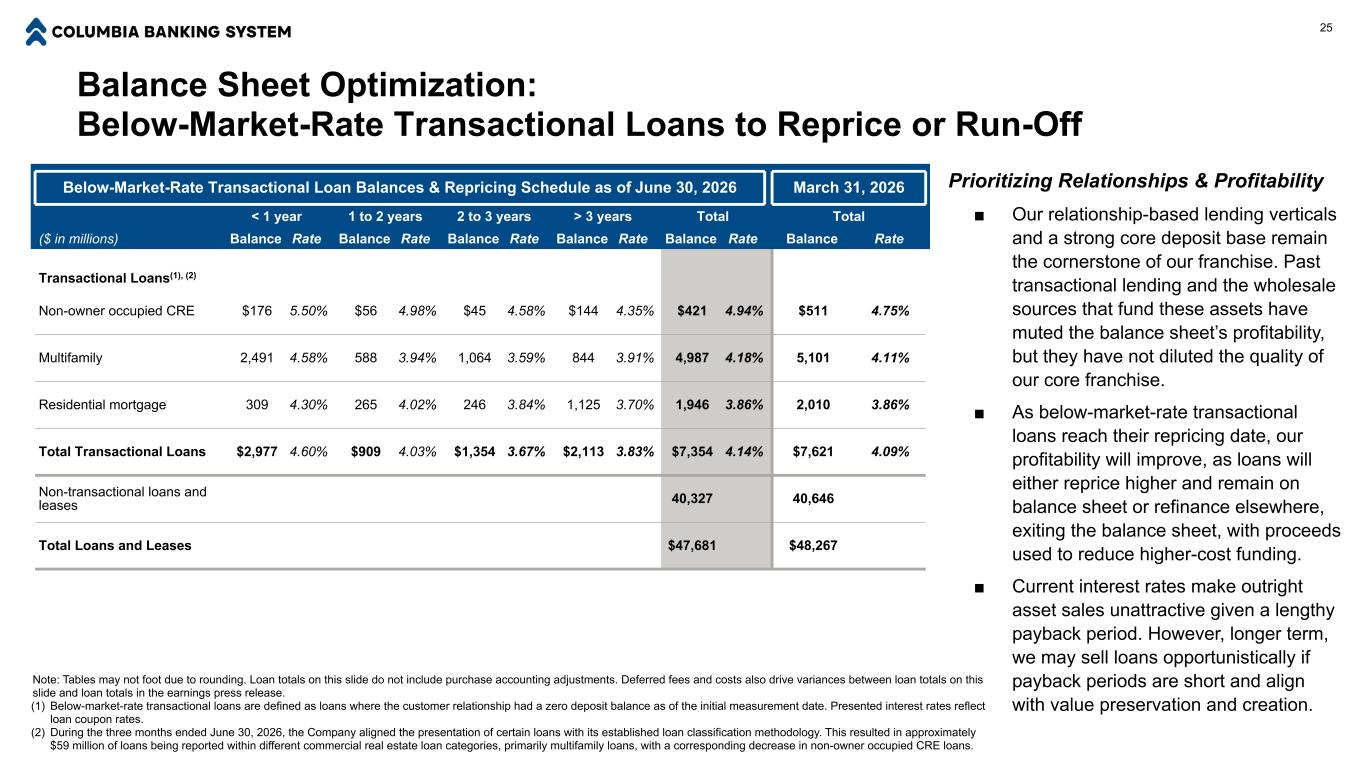
Balance Sheet Optimization: Below-Market-Rate Transactional Loans to Reprice or Run-Off 25 Below-Market-Rate Transactional Loan Balances & Repricing Schedule as of June 30, 2026 March 31, 2026 < 1 year 1 to 2 years 2 to 3 years > 3 years Total Total ($ in millions) Balance Rate Balance Rate Balance Rate Balance Rate Balance Rate Balance Rate Transactional Loans(1), (2) Non-owner occupied CRE $176 5.50% $56 4.98% $45 4.58% $144 4.35% $421 4.94% $511 4.75% Multifamily 2,491 4.58% 588 3.94% 1,064 3.59% 844 3.91% 4,987 4.18% 5,101 4.11% Residential mortgage 309 4.30% 265 4.02% 246 3.84% 1,125 3.70% 1,946 3.86% 2,010 3.86% Total Transactional Loans $2,977 4.60% $909 4.03% $1,354 3.67% $2,113 3.83% $7,354 4.14% $7,621 4.09% Non-transactional loans and leases 40,327 40,646 Total Loans and Leases $47,681 $48,267 Prioritizing Relationships & Profitability ■ Our relationship-based lending verticals and a strong core deposit base remain the cornerstone of our franchise. Past transactional lending and the wholesale sources that fund these assets have muted the balance sheet’s profitability, but they have not diluted the quality of our core franchise. ■ As below-market-rate transactional loans reach their repricing date, our profitability will improve, as loans will either reprice higher and remain on balance sheet or refinance elsewhere, exiting the balance sheet, with proceeds used to reduce higher-cost funding. ■ Current interest rates make outright asset sales unattractive given a lengthy payback period. However, longer term, we may sell loans opportunistically if payback periods are short and align with value preservation and creation. Note: Tables may not foot due to rounding. Loan totals on this slide do not include purchase accounting adjustments. Deferred fees and costs also drive variances between loan totals on this slide and loan totals in the earnings press release. (1) Below-market-rate transactional loans are defined as loans where the customer relationship had a zero deposit balance as of the initial measurement date. Presented interest rates reflect loan coupon rates. (2) During the three months ended June 30, 2026, the Company aligned the presentation of certain loans with its established loan classification methodology. This resulted in approximately $59 million of loans being reported within different commercial real estate loan categories, primarily multifamily loans, with a corresponding decrease in non-owner occupied CRE loans.
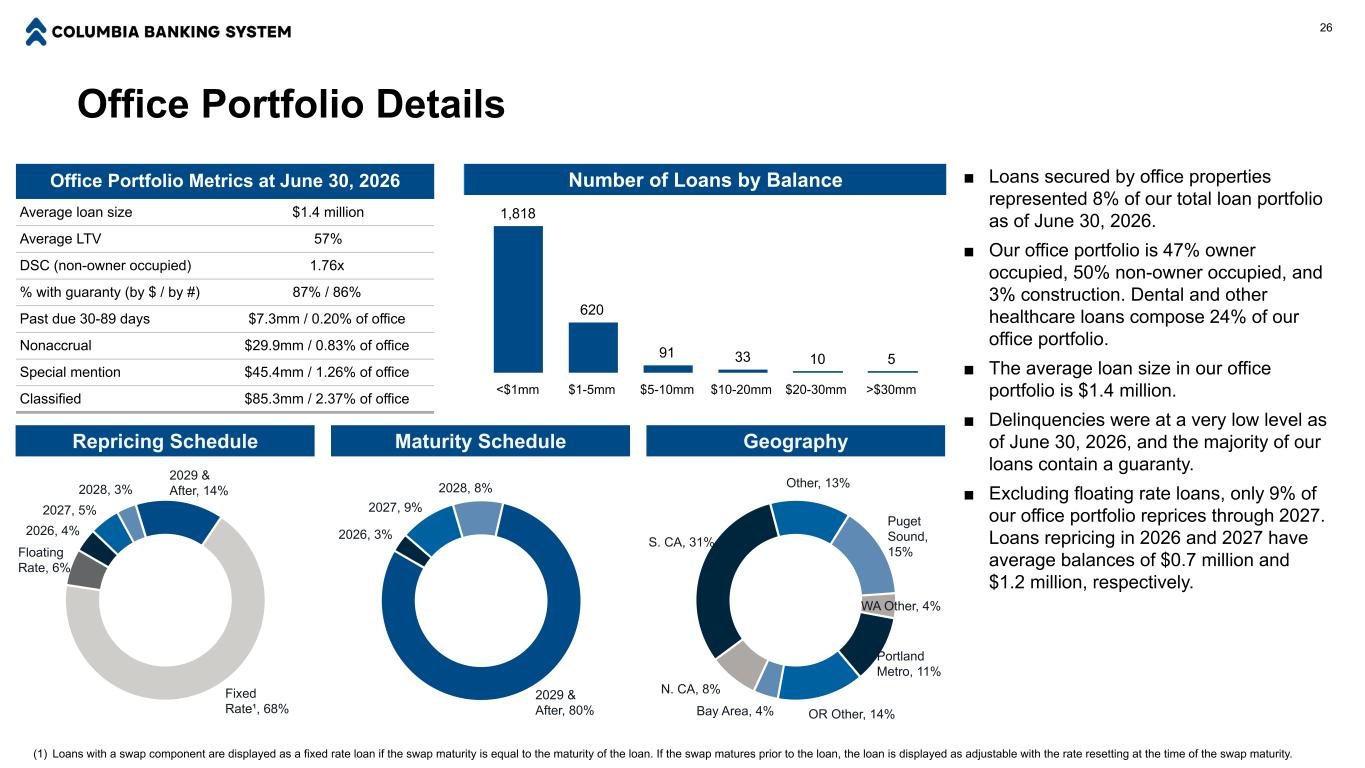
Office Portfolio Details Puget Sound, 15% WA Other, 4% Portland Metro, 11% OR Other, 14%Bay Area, 4% N. CA, 8% S. CA, 31% Other, 13% Office Portfolio Metrics at June 30, 2026 Average loan size $1.4 million Average LTV 57% DSC (non-owner occupied) 1.76x % with guaranty (by $ / by #) 87% / 86% Past due 30-89 days $7.3mm / 0.20% of office Nonaccrual $29.9mm / 0.83% of office Special mention $45.4mm / 1.26% of office Classified $85.3mm / 2.37% of office Number of Loans by Balance Geography 26 ■ Loans secured by office properties represented 8% of our total loan portfolio as of June 30, 2026. ■ Our office portfolio is 47% owner occupied, 50% non-owner occupied, and 3% construction. Dental and other healthcare loans compose 24% of our office portfolio. ■ The average loan size in our office portfolio is $1.4 million. ■ Delinquencies were at a very low level as of June 30, 2026, and the majority of our loans contain a guaranty. ■ Excluding floating rate loans, only 9% of our office portfolio reprices through 2027. Loans repricing in 2026 and 2027 have average balances of $0.7 million and $1.2 million, respectively. 1,746 441 71 38 7 6 <$1mm $1-5mm $5-10mm $10-20mm $20-30mm >$30mm 2026, 4% 2027, 5% 2028, 3% 2029 & After, 14% Fixed Rate¹, 68% Floating Rate, 6% Repricing Schedule (1) Loans with a swap component are displayed as a fixed rate loan if the swap maturity is equal to the maturity of the loan. If the swap matures prior to the loan, the loan is displayed as adjustable with the rate resetting at the time of the swap maturity. 2026, 3% 2027, 9% 2028, 8% 2029 & After, 80% Maturity Schedule , 19 8 9 6 7 1,818 620 9 3 10 5
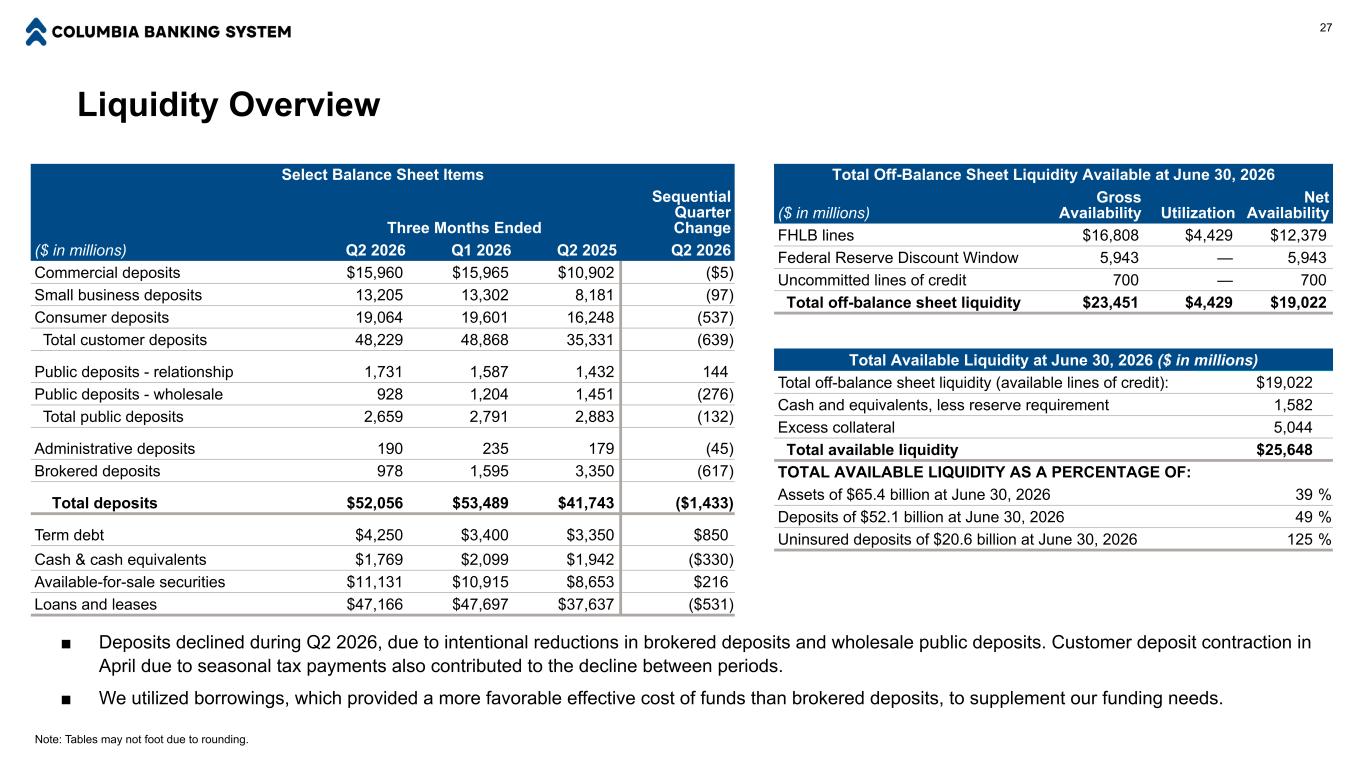
Liquidity Overview Total Available Liquidity at June 30, 2026 ($ in millions) Total off-balance sheet liquidity (available lines of credit): $19,022 Cash and equivalents, less reserve requirement 1,582 Excess collateral 5,044 Total available liquidity $25,648 TOTAL AVAILABLE LIQUIDITY AS A PERCENTAGE OF: Assets of $65.4 billion at June 30, 2026 39 % Deposits of $52.1 billion at June 30, 2026 49 % Uninsured deposits of $20.6 billion at June 30, 2026 125 % Total Off-Balance Sheet Liquidity Available at June 30, 2026 ($ in millions) Gross Availability Utilization Net Availability FHLB lines $16,808 $4,429 $12,379 Federal Reserve Discount Window 5,943 — 5,943 Uncommitted lines of credit 700 — 700 Total off-balance sheet liquidity $23,451 $4,429 $19,022 27 ■ Deposits declined during Q2 2026, due to intentional reductions in brokered deposits and wholesale public deposits. Customer deposit contraction in April due to seasonal tax payments also contributed to the decline between periods. ■ We utilized borrowings, which provided a more favorable effective cost of funds than brokered deposits, to supplement our funding needs. Select Balance Sheet Items Three Months Ended Sequential Quarter Change ($ in millions) Q2 2026 Q1 2026 Q2 2025 Q2 2026 Commercial deposits $15,960 $15,965 $10,902 ($5) Small business deposits 13,205 13,302 8,181 (97) Consumer deposits 19,064 19,601 16,248 (537) Total customer deposits 48,229 48,868 35,331 (639) Public deposits - relationship 1,731 1,587 1,432 144 Public deposits - wholesale 928 1,204 1,451 (276) Total public deposits 2,659 2,791 2,883 (132) Administrative deposits 190 235 179 (45) Brokered deposits 978 1,595 3,350 (617) Total deposits $52,056 $53,489 $41,743 ($1,433) Term debt $4,250 $3,400 $3,350 $850 Cash & cash equivalents $1,769 $2,099 $1,942 ($330) Available-for-sale securities $11,131 $10,915 $8,653 $216 Loans and leases $47,166 $47,697 $37,637 ($531) Note: Tables may not foot due to rounding.
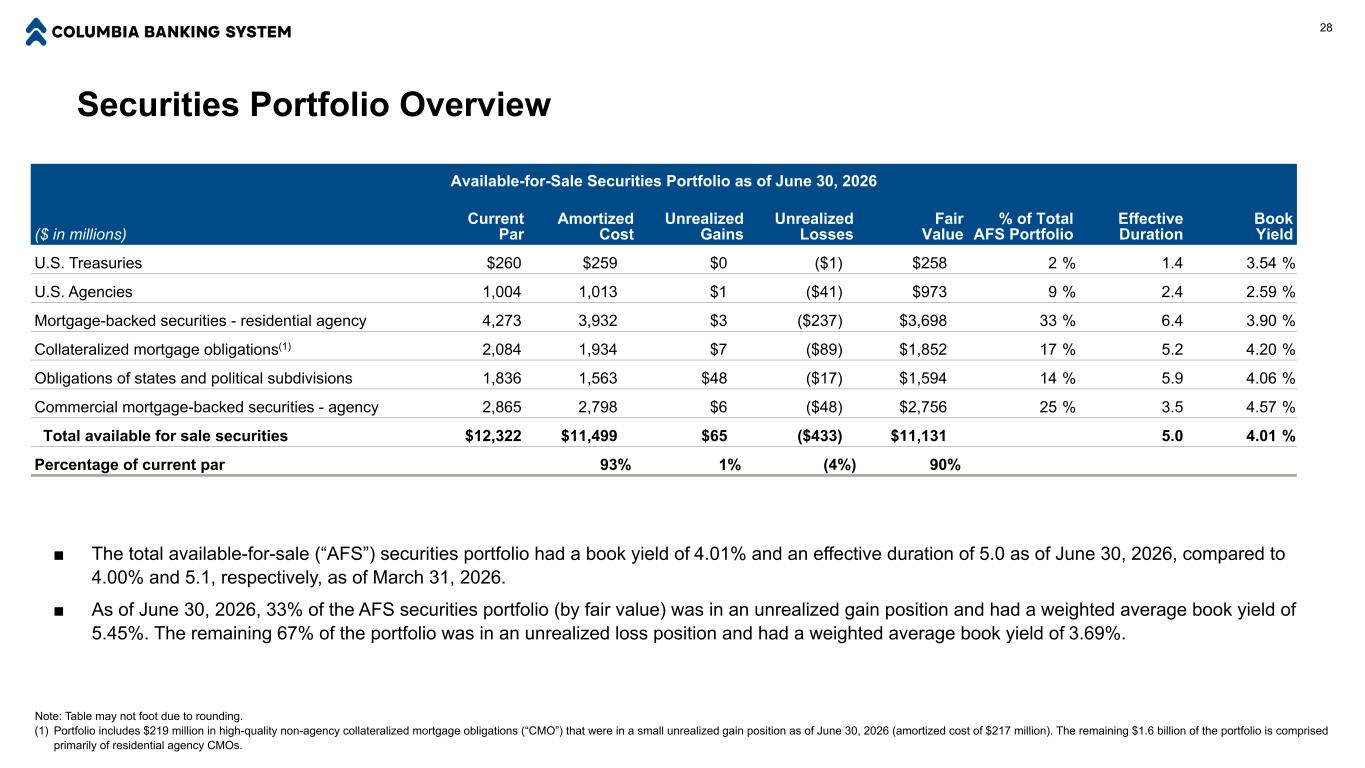
Available-for-Sale Securities Portfolio as of June 30, 2026 ($ in millions) Current Par Amortized Cost Unrealized Gains Unrealized Losses Fair Value % of Total AFS Portfolio Effective Duration Book Yield U.S. Treasuries $260 $259 $0 ($1) $258 2 % 1.4 3.54 % U.S. Agencies 1,004 1,013 $1 ($41) $973 9 % 2.4 2.59 % Mortgage-backed securities - residential agency 4,273 3,932 $3 ($237) $3,698 33 % 6.4 3.90 % Collateralized mortgage obligations(1) 2,084 1,934 $7 ($89) $1,852 17 % 5.2 4.20 % Obligations of states and political subdivisions 1,836 1,563 $48 ($17) $1,594 14 % 5.9 4.06 % Commercial mortgage-backed securities - agency 2,865 2,798 $6 ($48) $2,756 25 % 3.5 4.57 % Total available for sale securities $12,322 $11,499 $65 ($433) $11,131 5.0 4.01 % Percentage of current par 93% 1% (4%) 90% 28 Securities Portfolio Overview Note: Table may not foot due to rounding. (1) Portfolio includes $219 million in high-quality non-agency collateralized mortgage obligations (“CMO”) that were in a small unrealized gain position as of June 30, 2026 (amortized cost of $217 million). The remaining $1.6 billion of the portfolio is comprised primarily of residential agency CMOs. ■ The total available-for-sale (“AFS”) securities portfolio had a book yield of 4.01% and an effective duration of 5.0 as of June 30, 2026, compared to 4.00% and 5.1, respectively, as of March 31, 2026. ■ As of June 30, 2026, 33% of the AFS securities portfolio (by fair value) was in an unrealized gain position and had a weighted average book yield of 5.45%. The remaining 67% of the portfolio was in an unrealized loss position and had a weighted average book yield of 3.69%.
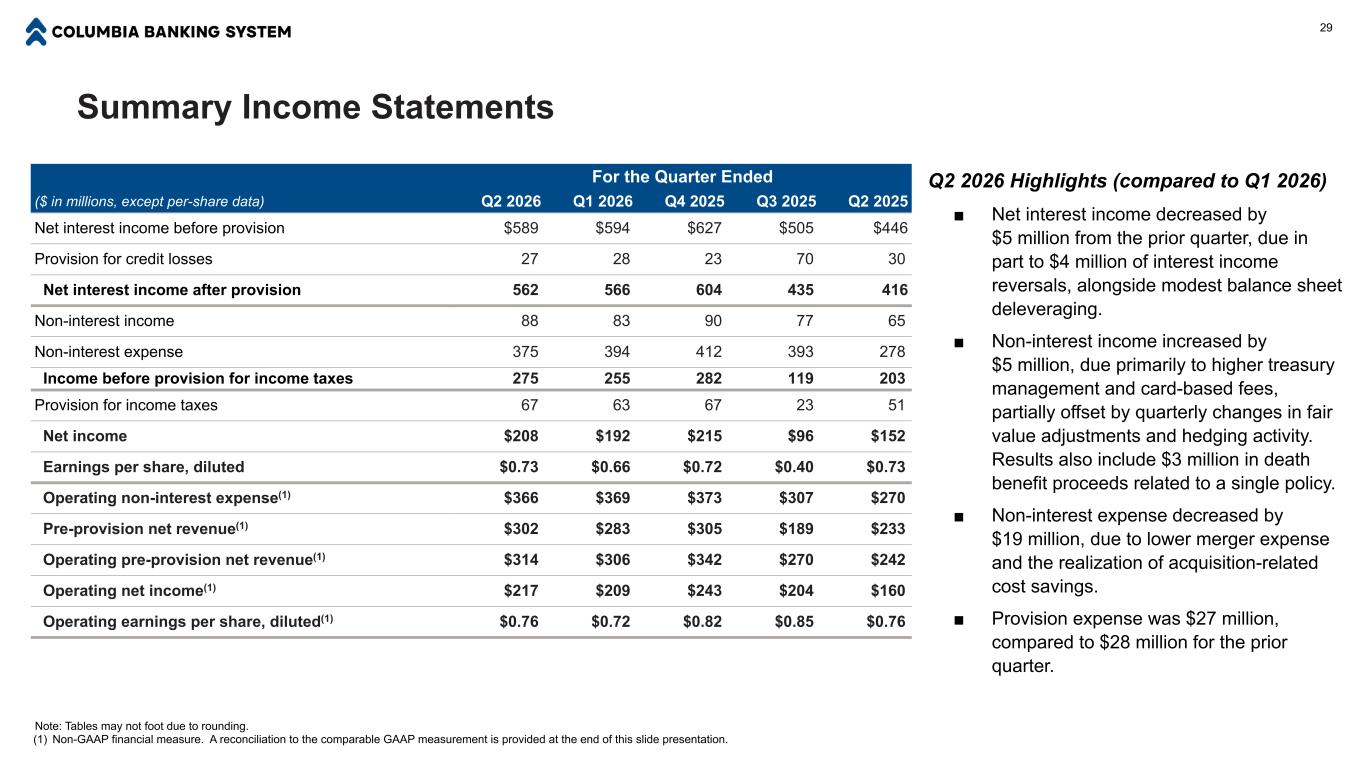
Summary Income Statements Note: Tables may not foot due to rounding. (1) Non-GAAP financial measure. A reconciliation to the comparable GAAP measurement is provided at the end of this slide presentation. For the Quarter Ended ($ in millions, except per-share data) Q2 2026 Q1 2026 Q4 2025 Q3 2025 Q2 2025 Net interest income before provision $589 $594 $627 $505 $446 Provision for credit losses 27 28 23 70 30 Net interest income after provision 562 566 604 435 416 Non-interest income 88 83 90 77 65 Non-interest expense 375 394 412 393 278 Income before provision for income taxes 275 255 282 119 203 Provision for income taxes 67 63 67 23 51 Net income $208 $192 $215 $96 $152 Earnings per share, diluted $0.73 $0.66 $0.72 $0.40 $0.73 Operating non-interest expense(1) $366 $369 $373 $307 $270 Pre-provision net revenue(1) $302 $283 $305 $189 $233 Operating pre-provision net revenue(1) $314 $306 $342 $270 $242 Operating net income(1) $217 $209 $243 $204 $160 Operating earnings per share, diluted(1) $0.76 $0.72 $0.82 $0.85 $0.76 29 Q2 2026 Highlights (compared to Q1 2026) ■ Net interest income decreased by $5 million from the prior quarter, due in part to $4 million of interest income reversals, alongside modest balance sheet deleveraging. ■ Non-interest income increased by $5 million, due primarily to higher treasury management and card-based fees, partially offset by quarterly changes in fair value adjustments and hedging activity. Results also include $3 million in death benefit proceeds related to a single policy. ■ Non-interest expense decreased by $19 million, due to lower merger expense and the realization of acquisition-related cost savings. ■ Provision expense was $27 million, compared to $28 million for the prior quarter.
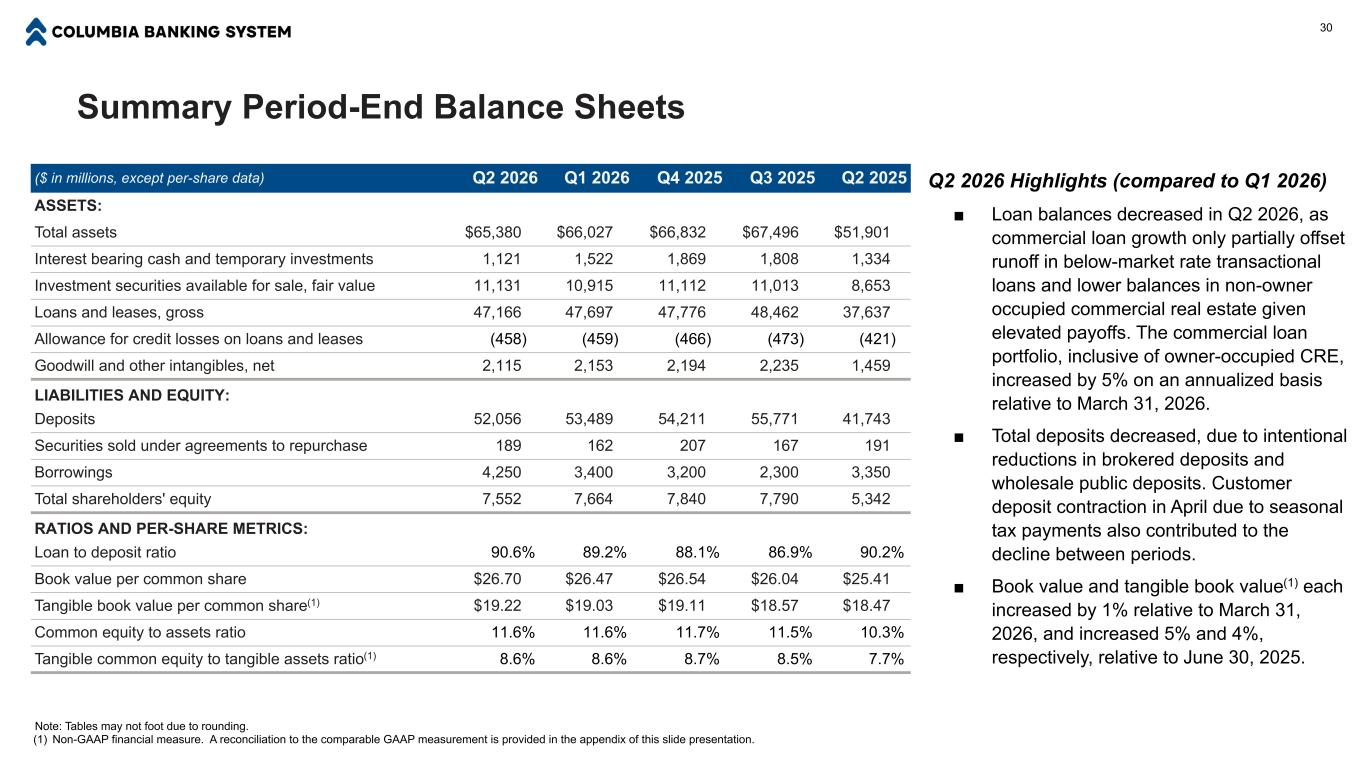
Summary Period-End Balance Sheets Note: Tables may not foot due to rounding. (1) Non-GAAP financial measure. A reconciliation to the comparable GAAP measurement is provided in the appendix of this slide presentation. ($ in millions, except per-share data) Q2 2026 Q1 2026 Q4 2025 Q3 2025 Q2 2025 ASSETS: Total assets $65,380 $66,027 $66,832 $67,496 $51,901 Interest bearing cash and temporary investments 1,121 1,522 1,869 1,808 1,334 Investment securities available for sale, fair value 11,131 10,915 11,112 11,013 8,653 Loans and leases, gross 47,166 47,697 47,776 48,462 37,637 Allowance for credit losses on loans and leases (458) (459) (466) (473) (421) Goodwill and other intangibles, net 2,115 2,153 2,194 2,235 1,459 LIABILITIES AND EQUITY: Deposits 52,056 53,489 54,211 55,771 41,743 Securities sold under agreements to repurchase 189 162 207 167 191 Borrowings 4,250 3,400 3,200 2,300 3,350 Total shareholders' equity 7,552 7,664 7,840 7,790 5,342 RATIOS AND PER-SHARE METRICS: Loan to deposit ratio 90.6% 89.2% 88.1% 86.9% 90.2% Book value per common share $26.70 $26.47 $26.54 $26.04 $25.41 Tangible book value per common share(1) $19.22 $19.03 $19.11 $18.57 $18.47 Common equity to assets ratio 11.6% 11.6% 11.7% 11.5% 10.3% Tangible common equity to tangible assets ratio(1) 8.6% 8.6% 8.7% 8.5% 7.7% 30 Q2 2026 Highlights (compared to Q1 2026) ■ Loan balances decreased in Q2 2026, as commercial loan growth only partially offset runoff in below-market rate transactional loans and lower balances in non-owner occupied commercial real estate given elevated payoffs. The commercial loan portfolio, inclusive of owner-occupied CRE, increased by 5% on an annualized basis relative to March 31, 2026. ■ Total deposits decreased, due to intentional reductions in brokered deposits and wholesale public deposits. Customer deposit contraction in April due to seasonal tax payments also contributed to the decline between periods. ■ Book value and tangible book value(1) each increased by 1% relative to March 31, 2026, and increased 5% and 4%, respectively, relative to June 30, 2025.
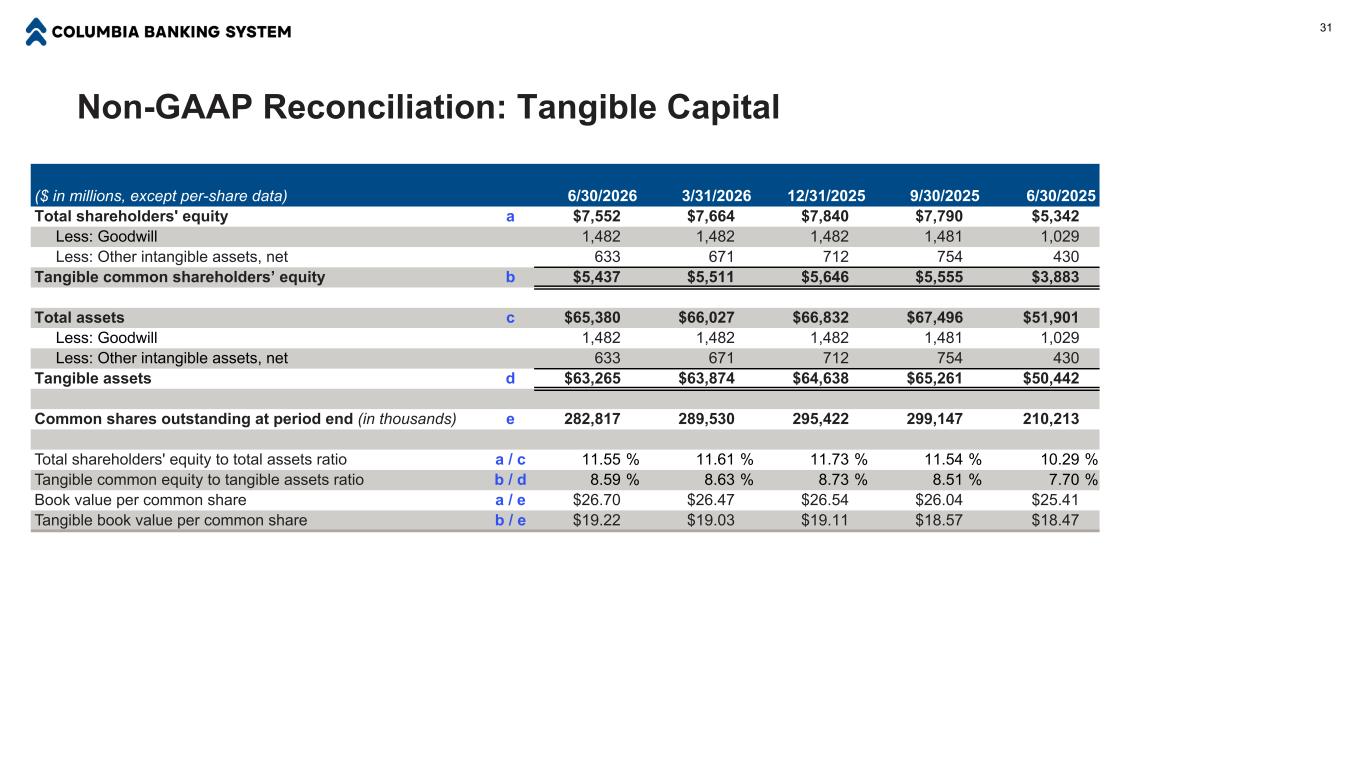
Non-GAAP Reconciliation: Tangible Capital ($ in millions, except per-share data) 6/30/2026 3/31/2026 12/31/2025 9/30/2025 6/30/2025 Total shareholders' equity a $7,552 $7,664 $7,840 $7,790 $5,342 Less: Goodwill 1,482 1,482 1,482 1,481 1,029 Less: Other intangible assets, net 633 671 712 754 430 Tangible common shareholders’ equity b $5,437 $5,511 $5,646 $5,555 $3,883 Total assets c $65,380 $66,027 $66,832 $67,496 $51,901 Less: Goodwill 1,482 1,482 1,482 1,481 1,029 Less: Other intangible assets, net 633 671 712 754 430 Tangible assets d $63,265 $63,874 $64,638 $65,261 $50,442 Common shares outstanding at period end (in thousands) e 282,817 289,530 295,422 299,147 210,213 Total shareholders' equity to total assets ratio a / c 11.55 % 11.61 % 11.73 % 11.54 % 10.29 % Tangible common equity to tangible assets ratio b / d 8.59 % 8.63 % 8.73 % 8.51 % 7.70 % Book value per common share a / e $26.70 $26.47 $26.54 $26.04 $25.41 Tangible book value per common share b / e $19.22 $19.03 $19.11 $18.57 $18.47 31
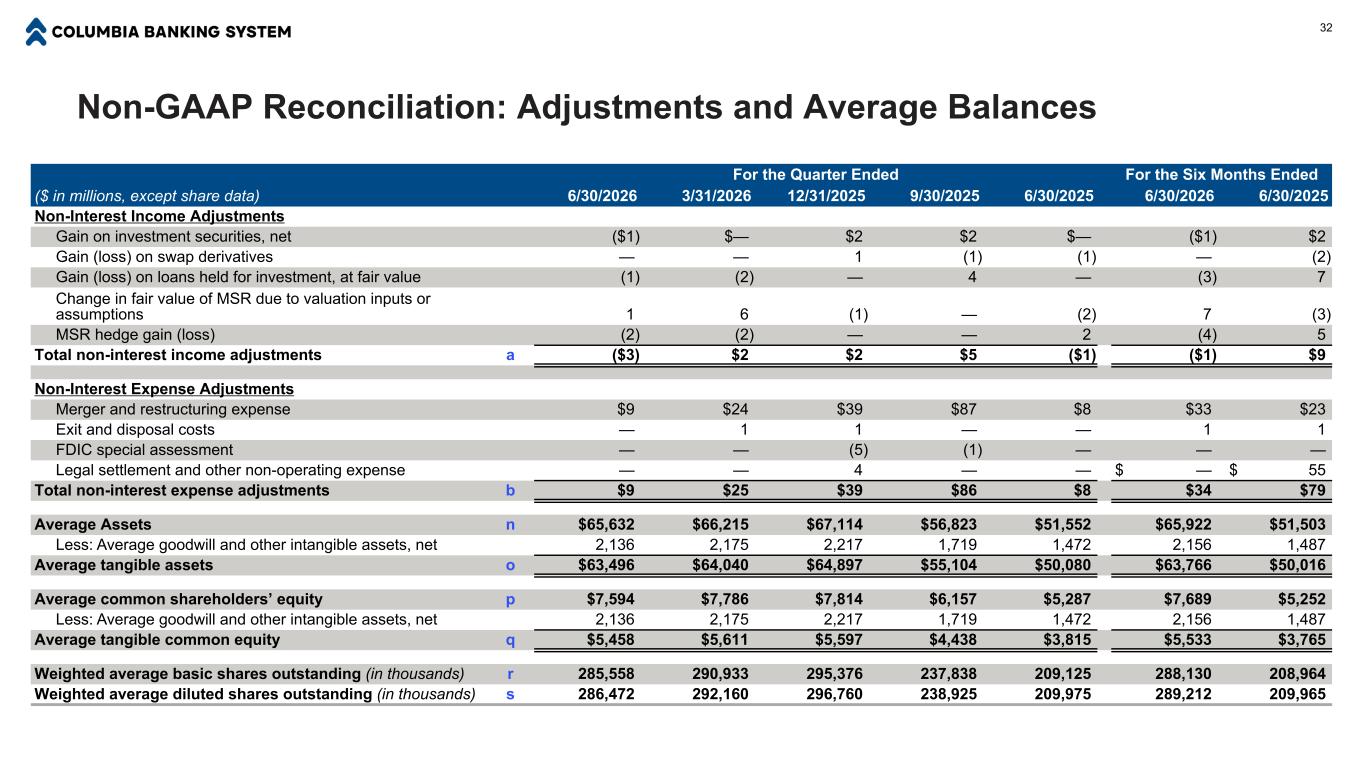
Non-GAAP Reconciliation: Adjustments and Average Balances For the Quarter Ended For the Six Months Ended ($ in millions, except share data) 6/30/2026 3/31/2026 12/31/2025 9/30/2025 6/30/2025 6/30/2026 6/30/2025 Non-Interest Income Adjustments Gain on investment securities, net ($1) $— $2 $2 $— ($1) $2 Gain (loss) on swap derivatives — — 1 (1) (1) — (2) Gain (loss) on loans held for investment, at fair value (1) (2) — 4 — (3) 7 Change in fair value of MSR due to valuation inputs or assumptions 1 6 (1) — (2) 7 (3) MSR hedge gain (loss) (2) (2) — — 2 (4) 5 Total non-interest income adjustments a ($3) $2 $2 $5 ($1) ($1) $9 Non-Interest Expense Adjustments Merger and restructuring expense $9 $24 $39 $87 $8 $33 $23 Exit and disposal costs — 1 1 — — 1 1 FDIC special assessment — — (5) (1) — — — Legal settlement and other non-operating expense — — 4 — — $ — $ 55 Total non-interest expense adjustments b $9 $25 $39 $86 $8 $34 $79 Average Assets n $65,632 $66,215 $67,114 $56,823 $51,552 $65,922 $51,503 Less: Average goodwill and other intangible assets, net 2,136 2,175 2,217 1,719 1,472 2,156 1,487 Average tangible assets o $63,496 $64,040 $64,897 $55,104 $50,080 $63,766 $50,016 Average common shareholders’ equity p $7,594 $7,786 $7,814 $6,157 $5,287 $7,689 $5,252 Less: Average goodwill and other intangible assets, net 2,136 2,175 2,217 1,719 1,472 2,156 1,487 Average tangible common equity q $5,458 $5,611 $5,597 $4,438 $3,815 $5,533 $3,765 Weighted average basic shares outstanding (in thousands) r 285,558 290,933 295,376 237,838 209,125 288,130 208,964 Weighted average diluted shares outstanding (in thousands) s 286,472 292,160 296,760 238,925 209,975 289,212 209,965 32
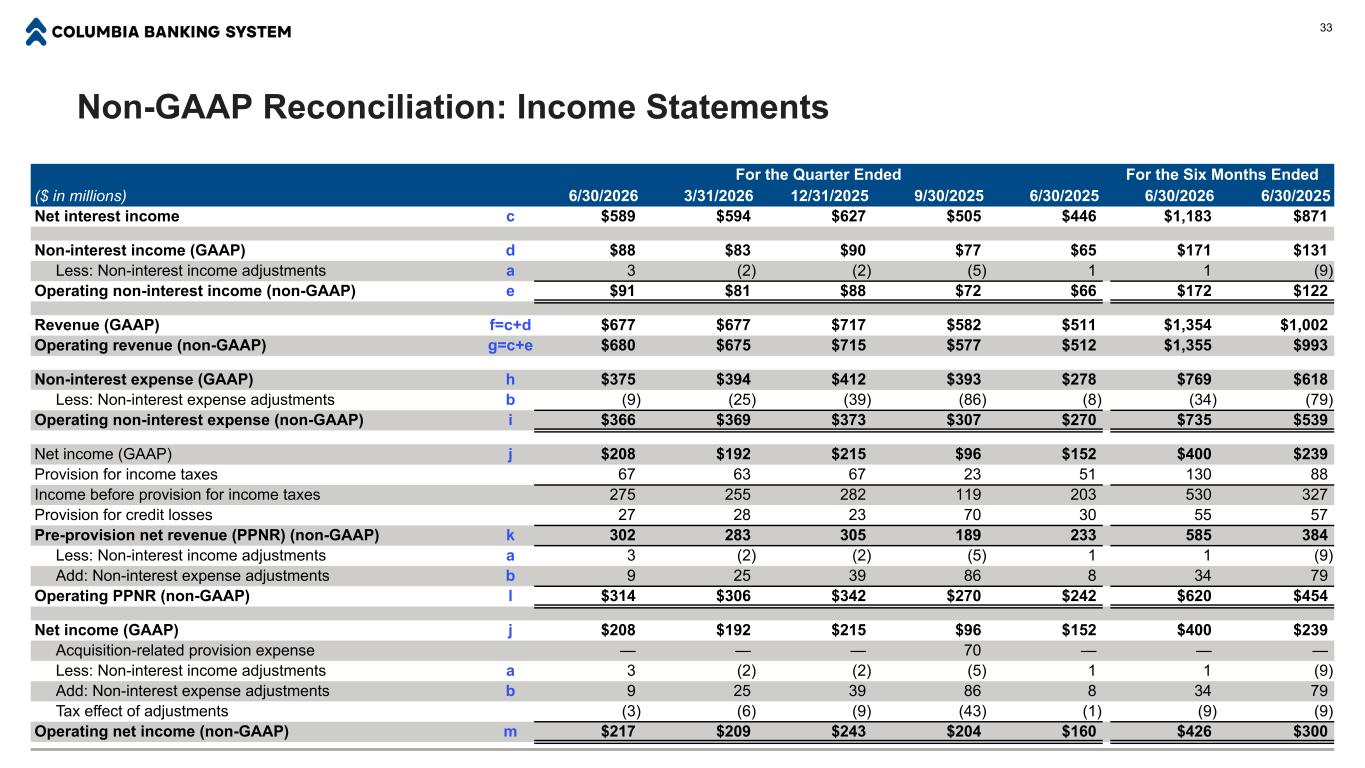
Non-GAAP Reconciliation: Income Statements For the Quarter Ended For the Six Months Ended ($ in millions) 6/30/2026 3/31/2026 12/31/2025 9/30/2025 6/30/2025 6/30/2026 6/30/2025 Net interest income c $589 $594 $627 $505 $446 $1,183 $871 Non-interest income (GAAP) d $88 $83 $90 $77 $65 $171 $131 Less: Non-interest income adjustments a 3 (2) (2) (5) 1 1 (9) Operating non-interest income (non-GAAP) e $91 $81 $88 $72 $66 $172 $122 Revenue (GAAP) f=c+d $677 $677 $717 $582 $511 $1,354 $1,002 Operating revenue (non-GAAP) g=c+e $680 $675 $715 $577 $512 $1,355 $993 Non-interest expense (GAAP) h $375 $394 $412 $393 $278 $769 $618 Less: Non-interest expense adjustments b (9) (25) (39) (86) (8) (34) (79) Operating non-interest expense (non-GAAP) i $366 $369 $373 $307 $270 $735 $539 Net income (GAAP) j $208 $192 $215 $96 $152 $400 $239 Provision for income taxes 67 63 67 23 51 130 88 Income before provision for income taxes 275 255 282 119 203 530 327 Provision for credit losses 27 28 23 70 30 55 57 Pre-provision net revenue (PPNR) (non-GAAP) k 302 283 305 189 233 585 384 Less: Non-interest income adjustments a 3 (2) (2) (5) 1 1 (9) Add: Non-interest expense adjustments b 9 25 39 86 8 34 79 Operating PPNR (non-GAAP) l $314 $306 $342 $270 $242 $620 $454 Net income (GAAP) j $208 $192 $215 $96 $152 $400 $239 Acquisition-related provision expense — — — 70 — — — Less: Non-interest income adjustments a 3 (2) (2) (5) 1 1 (9) Add: Non-interest expense adjustments b 9 25 39 86 8 34 79 Tax effect of adjustments (3) (6) (9) (43) (1) (9) (9) Operating net income (non-GAAP) m $217 $209 $243 $204 $160 $426 $300 33
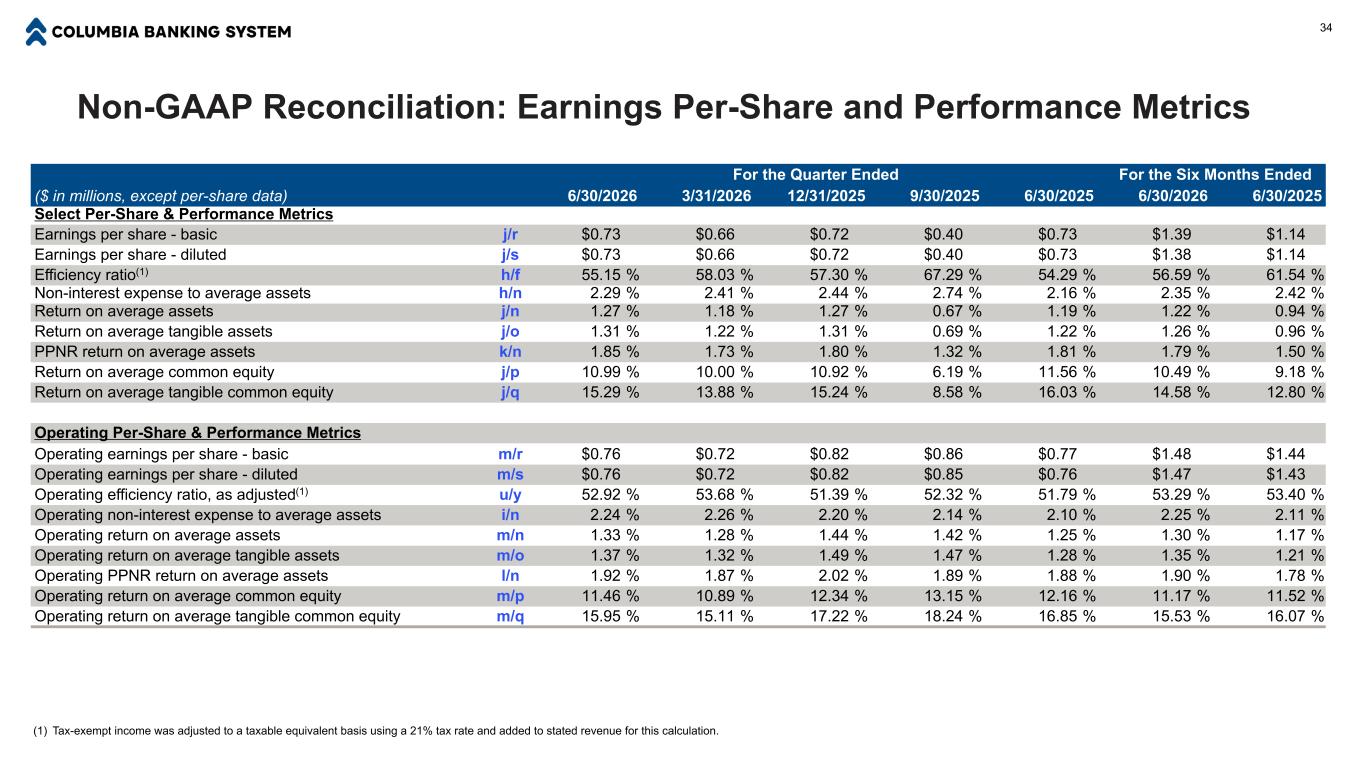
Non-GAAP Reconciliation: Earnings Per-Share and Performance Metrics For the Quarter Ended For the Six Months Ended ($ in millions, except per-share data) 6/30/2026 3/31/2026 12/31/2025 9/30/2025 6/30/2025 6/30/2026 6/30/2025 Select Per-Share & Performance Metrics Earnings per share - basic j/r $0.73 $0.66 $0.72 $0.40 $0.73 $1.39 $1.14 Earnings per share - diluted j/s $0.73 $0.66 $0.72 $0.40 $0.73 $1.38 $1.14 Efficiency ratio(1) h/f 55.15 % 58.03 % 57.30 % 67.29 % 54.29 % 56.59 % 61.54 % Non-interest expense to average assets h/n 2.29 % 2.41 % 2.44 % 2.74 % 2.16 % 2.35 % 2.42 % Return on average assets j/n 1.27 % 1.18 % 1.27 % 0.67 % 1.19 % 1.22 % 0.94 % Return on average tangible assets j/o 1.31 % 1.22 % 1.31 % 0.69 % 1.22 % 1.26 % 0.96 % PPNR return on average assets k/n 1.85 % 1.73 % 1.80 % 1.32 % 1.81 % 1.79 % 1.50 % Return on average common equity j/p 10.99 % 10.00 % 10.92 % 6.19 % 11.56 % 10.49 % 9.18 % Return on average tangible common equity j/q 15.29 % 13.88 % 15.24 % 8.58 % 16.03 % 14.58 % 12.80 % Operating Per-Share & Performance Metrics Operating earnings per share - basic m/r $0.76 $0.72 $0.82 $0.86 $0.77 $1.48 $1.44 Operating earnings per share - diluted m/s $0.76 $0.72 $0.82 $0.85 $0.76 $1.47 $1.43 Operating efficiency ratio, as adjusted(1) u/y 52.92 % 53.68 % 51.39 % 52.32 % 51.79 % 53.29 % 53.40 % Operating non-interest expense to average assets i/n 2.24 % 2.26 % 2.20 % 2.14 % 2.10 % 2.25 % 2.11 % Operating return on average assets m/n 1.33 % 1.28 % 1.44 % 1.42 % 1.25 % 1.30 % 1.17 % Operating return on average tangible assets m/o 1.37 % 1.32 % 1.49 % 1.47 % 1.28 % 1.35 % 1.21 % Operating PPNR return on average assets l/n 1.92 % 1.87 % 2.02 % 1.89 % 1.88 % 1.90 % 1.78 % Operating return on average common equity m/p 11.46 % 10.89 % 12.34 % 13.15 % 12.16 % 11.17 % 11.52 % Operating return on average tangible common equity m/q 15.95 % 15.11 % 17.22 % 18.24 % 16.85 % 15.53 % 16.07 % (1) Tax-exempt income was adjusted to a taxable equivalent basis using a 21% tax rate and added to stated revenue for this calculation. 34
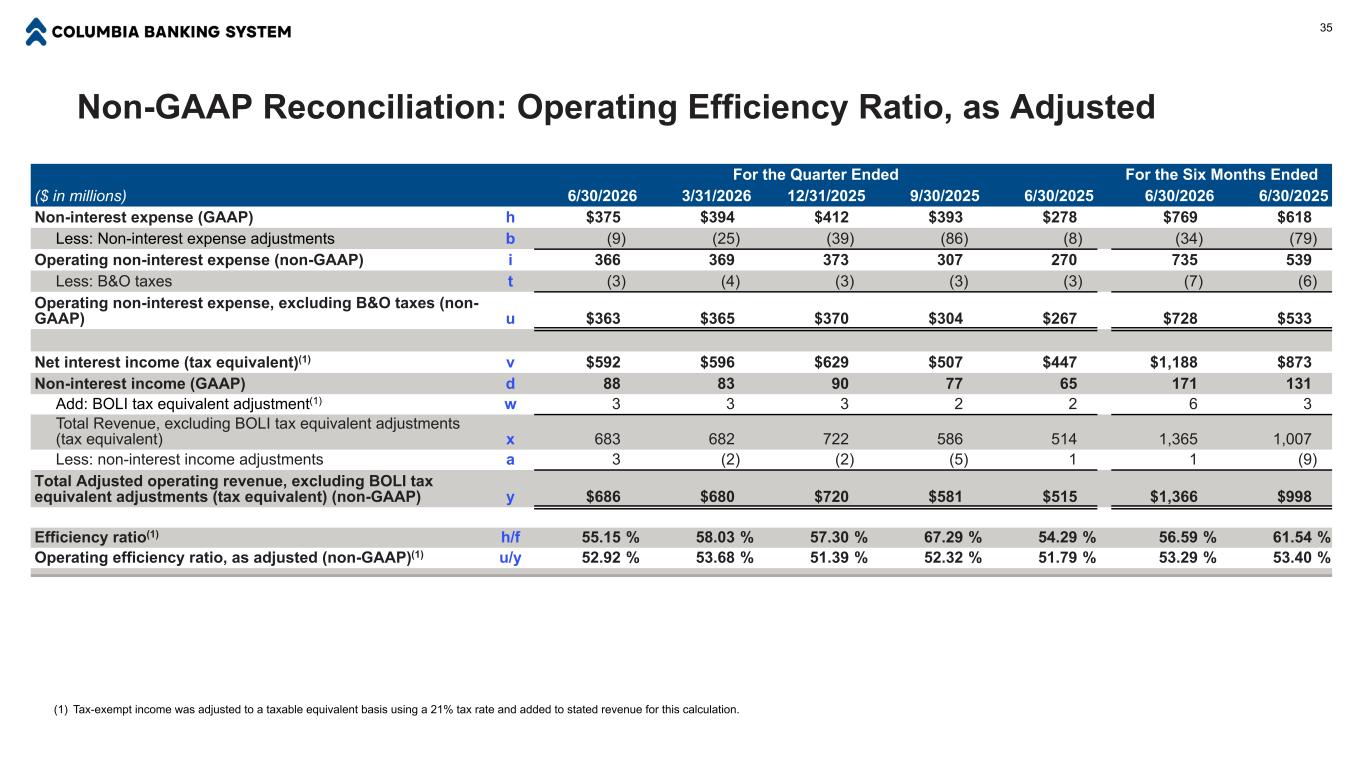
Non-GAAP Reconciliation: Operating Efficiency Ratio, as Adjusted 35 For the Quarter Ended For the Six Months Ended ($ in millions) 6/30/2026 3/31/2026 12/31/2025 9/30/2025 6/30/2025 6/30/2026 6/30/2025 Non-interest expense (GAAP) h $375 $394 $412 $393 $278 $769 $618 Less: Non-interest expense adjustments b (9) (25) (39) (86) (8) (34) (79) Operating non-interest expense (non-GAAP) i 366 369 373 307 270 735 539 Less: B&O taxes t (3) (4) (3) (3) (3) (7) (6) Operating non-interest expense, excluding B&O taxes (non- GAAP) u $363 $365 $370 $304 $267 $728 $533 Net interest income (tax equivalent)(1) v $592 $596 $629 $507 $447 $1,188 $873 Non-interest income (GAAP) d 88 83 90 77 65 171 131 Add: BOLI tax equivalent adjustment(1) w 3 3 3 2 2 6 3 Total Revenue, excluding BOLI tax equivalent adjustments (tax equivalent) x 683 682 722 586 514 1,365 1,007 Less: non-interest income adjustments a 3 (2) (2) (5) 1 1 (9) Total Adjusted operating revenue, excluding BOLI tax equivalent adjustments (tax equivalent) (non-GAAP) y $686 $680 $720 $581 $515 $1,366 $998 Efficiency ratio(1) h/f 55.15 % 58.03 % 57.30 % 67.29 % 54.29 % 56.59 % 61.54 % Operating efficiency ratio, as adjusted (non-GAAP)(1) u/y 52.92 % 53.68 % 51.39 % 52.32 % 51.79 % 53.29 % 53.40 % (1) Tax-exempt income was adjusted to a taxable equivalent basis using a 21% tax rate and added to stated revenue for this calculation.