Pay vs Performance Disclosure - USD ($)
Mar. 28, 2026
Mar. 29, 2025
Mar. 30, 2024
Mar. 25, 2023
Mar. 26, 2022
PAY VERSUS PERFORMANCE
The following table sets forth the compensation for our principal executive officer (the “PEO”) and the average compensation for our other NEOs (“non-PEO NEOs”), both as reported in the Summary Compensation Table in this proxy statement and with certain adjustments to reflect the “compensation actually paid” to such individuals, as defined under the SEC’s pay versus performance disclosure rules, for each of the past five fiscal years. For further information concerning our pay-for-performance philosophy and how we align executive compensation with our financial performance, refer to the Compensation Discussion and Analysis section in this proxy statement.
Fiscal Year | Summary Compensation Table Total for PEO(1) | Compensation “Actually Paid” to PEO(2) | Average Summary Compensation Table Total for non-PEO NEOs(3) | Average Compensation “Actually Paid” to non- PEO NEOs(4) | Value of Initial Fixed $100 Investment Based On: | Net Income(7) | Company Selected Measure: Adjusted EBITDA(8) | |||||||||||||||||
Company TSR(5) | Peer Group TSR(6) | |||||||||||||||||||||||
2026 | $5,862,200 | $4,736,089 | $1,454,512 | $1,326,496 | $149.65 | $85.97 | $5,376 | $48,739 | ||||||||||||||||
2025 | $1,815,360 | $103,862 | $668,872 | $225,781 | $151.69 | $87.72 | $14,515 | $39,733 | ||||||||||||||||
2024 | $2,440,460 | $2,206,568 | $838,329 | $826,706 | $227.04 | $109.58 | $13,647 | $38,613 | ||||||||||||||||
2023 | $1,444,134 | $1,422,311 | $603,803 | $600,973 | $182.13 | $105.15 | $10,688 | $30,421 | ||||||||||||||||
2022 | $1,353,485 | $1,512,100 | $597,959 | $498,629 | $165.32 | $117.53 | $11,380 | $26,307 | ||||||||||||||||
(1) | Reflects compensation for Lee D. Rudow, our former CEO, for the applicable fiscal year as reported in the Summary Compensation Table for the applicable year. |
(2) | The dollar amounts reported in this column represent the amount of “compensation actually paid,” or CAP, to the PEO in the applicable fiscal year, as computed in accordance with the SEC’s pay versus performance disclosure rules. The dollar amounts do not necessarily reflect the actual amount of compensation earned by or paid to the PEO during the applicable fiscal year. The following table provides additional information as to the amounts deducted from and added to the Summary Compensation Table Total for the PEO pursuant to the SEC’s rules to determine CAP to the PEO: |
Fiscal 2026 | |||
Summary Compensation Table Total for PEO | $5,862,200 | ||
Adjustments for stock awards and option awards | |||
(Deduct): Aggregate value for stock awards and option awards included in Summary Compensation Table Total for the covered fiscal year | $(4,613,932) | ||
Add: Fair value at year end of awards granted during the covered fiscal year that were outstanding and unvested at the covered fiscal year end | 3,891,504 | ||
Add (Deduct): Year-over-year change in fair value at covered fiscal year end of awards granted in any prior fiscal year that were outstanding and unvested at the covered fiscal year end | (435,080) | ||
Add: Vesting date fair value of awards granted and vested during the covered fiscal year | 297,190 | ||
Add (Deduct): Change as of the vesting date (from the end of the prior fiscal year) in fair value of awards granted in any prior fiscal year for which vesting conditions were satisfied during the covered fiscal year | (265,793) | ||
(Deduct): Fair value at end of prior fiscal year of awards granted in any prior fiscal year that failed to meet the applicable vesting conditions during the covered fiscal year | — | ||
Add: Change in incremental fair value of awards modified during the covered fiscal year | — | ||
Add: Dividends or other earnings paid on awards in the covered fiscal year prior to vesting if not otherwise included in the Summary Compensation Table Total for the covered fiscal year | — | ||
Compensation “Actually Paid” to PEO | $4,736,089 | ||
(3) | Reflects the average compensation for the non-PEO NEOs in each applicable fiscal year based on compensation amounts reported in the Summary Compensation Table for the applicable fiscal year. The following table shows the executives who are included as non-PEO NEOs. |
Executive | 2022 | 2023 | 2024 | 2025 | 2026 | ||||||||||
Thomas L. Barbato | X | X | X | X | |||||||||||
Theresa A. Conroy | X | X | X | X | |||||||||||
Michael J. Haddad | X | X | |||||||||||||
Michael W. West | X | X | |||||||||||||
Mark A. Doheny | X | X | X | ||||||||||||
James M. Jenkins | X | X | X | ||||||||||||
(4) | The dollar amounts reported in this column represent the average amount of CAP to the non-PEO NEOs in the applicable fiscal year, as computed in accordance with the SEC’s pay versus performance disclosure rules. The dollar amounts do not necessarily reflect the actual average amount of compensation earned by or paid to the non-PEO NEOs during the applicable fiscal year. The following table provides additional information as to the amounts deducted from and added to the Average Summary Compensation Table Total for non-PEO NEOs pursuant to the SEC’s rules to determine Average CAP to non-PEO NEOs: |
Fiscal 2026 | |||
Summary Compensation Table Total for non-PEO NEOs | $1,454,512 | ||
Adjustments for stock awards and option awards | |||
(Deduct): Aggregate value for stock awards and option awards included in Summary Compensation Table Total for the covered fiscal year | $(998,983) | ||
Add: Fair value at year end of awards granted during the covered fiscal year that were outstanding and unvested at the covered fiscal year end | 1,088,661 | ||
Add (Deduct): Year-over-year change in fair value at covered fiscal year end of awards granted in any prior fiscal year that were outstanding and unvested at the covered fiscal year end | (166,747) | ||
Add: Vesting date fair value of awards granted and vested during the covered fiscal year | — | ||
Add (Deduct): Change as of the vesting date (from the end of the prior fiscal year) in fair value of awards granted in any prior fiscal year for which vesting conditions were satisfied during the covered fiscal year | (50,947) | ||
(Deduct): Fair value at end of prior fiscal year of awards granted in any prior fiscal year that failed to meet the applicable vesting conditions during the covered fiscal year | — | ||
Add: Change in incremental fair value of awards modified during the covered fiscal year | — | ||
Add: Dividends or other earnings paid on awards in the covered fiscal year prior to vesting if not otherwise included in the Summary Compensation Table Total for the covered fiscal year | — | ||
Compensation “Actually Paid” to non-PEO NEOs | $1,326,496 | ||
(5) | Total Shareholder Return, or TSR, reflects the cumulative return of a $100 investment from the beginning of fiscal 2022 through the end of each of the fiscal years in the table, calculated in accordance with Item 201(e) of Regulation S-K. |
(6) | The index used for this purpose is the S&P Composite 1500 Life Sciences Tools & Services Industry Index. |
(7) | Reported in thousands. Reflects Net Income as reported in the Company’s Consolidated Statements of Operations and Comprehensive Income included in the Company’s annual report on Form 10-K for the applicable fiscal year. |
(8) | Reported in thousands. Adjusted EBITDA is a non-GAAP measure. Refer to Appendix A of this proxy statement for our definition of Adjusted EBITDA and a reconciliation of Adjusted EBITDA to the most directly comparable U.S. GAAP measure. |
(1) | Reflects compensation for Lee D. Rudow, our former CEO, for the applicable fiscal year as reported in the Summary Compensation Table for the applicable year. |
(3) | Reflects the average compensation for the non-PEO NEOs in each applicable fiscal year based on compensation amounts reported in the Summary Compensation Table for the applicable fiscal year. The following table shows the executives who are included as non-PEO NEOs. |
Executive | 2022 | 2023 | 2024 | 2025 | 2026 | ||||||||||
Thomas L. Barbato | X | X | X | X | |||||||||||
Theresa A. Conroy | X | X | X | X | |||||||||||
Michael J. Haddad | X | X | |||||||||||||
Michael W. West | X | X | |||||||||||||
Mark A. Doheny | X | X | X | ||||||||||||
James M. Jenkins | X | X | X | ||||||||||||
(6) | The index used for this purpose is the S&P Composite 1500 Life Sciences Tools & Services Industry Index. |
(2) | The dollar amounts reported in this column represent the amount of “compensation actually paid,” or CAP, to the PEO in the applicable fiscal year, as computed in accordance with the SEC’s pay versus performance disclosure rules. The dollar amounts do not necessarily reflect the actual amount of compensation earned by or paid to the PEO during the applicable fiscal year. The following table provides additional information as to the amounts deducted from and added to the Summary Compensation Table Total for the PEO pursuant to the SEC’s rules to determine CAP to the PEO: |
Fiscal 2026 | |||
Summary Compensation Table Total for PEO | $5,862,200 | ||
Adjustments for stock awards and option awards | |||
(Deduct): Aggregate value for stock awards and option awards included in Summary Compensation Table Total for the covered fiscal year | $(4,613,932) | ||
Add: Fair value at year end of awards granted during the covered fiscal year that were outstanding and unvested at the covered fiscal year end | 3,891,504 | ||
Add (Deduct): Year-over-year change in fair value at covered fiscal year end of awards granted in any prior fiscal year that were outstanding and unvested at the covered fiscal year end | (435,080) | ||
Add: Vesting date fair value of awards granted and vested during the covered fiscal year | 297,190 | ||
Add (Deduct): Change as of the vesting date (from the end of the prior fiscal year) in fair value of awards granted in any prior fiscal year for which vesting conditions were satisfied during the covered fiscal year | (265,793) | ||
(Deduct): Fair value at end of prior fiscal year of awards granted in any prior fiscal year that failed to meet the applicable vesting conditions during the covered fiscal year | — | ||
Add: Change in incremental fair value of awards modified during the covered fiscal year | — | ||
Add: Dividends or other earnings paid on awards in the covered fiscal year prior to vesting if not otherwise included in the Summary Compensation Table Total for the covered fiscal year | — | ||
Compensation “Actually Paid” to PEO | $4,736,089 | ||
(4) | The dollar amounts reported in this column represent the average amount of CAP to the non-PEO NEOs in the applicable fiscal year, as computed in accordance with the SEC’s pay versus performance disclosure rules. The dollar amounts do not necessarily reflect the actual average amount of compensation earned by or paid to the non-PEO NEOs during the applicable fiscal year. The following table provides additional information as to the amounts deducted from and added to the Average Summary Compensation Table Total for non-PEO NEOs pursuant to the SEC’s rules to determine Average CAP to non-PEO NEOs: |
Fiscal 2026 | |||
Summary Compensation Table Total for non-PEO NEOs | $1,454,512 | ||
Adjustments for stock awards and option awards | |||
(Deduct): Aggregate value for stock awards and option awards included in Summary Compensation Table Total for the covered fiscal year | $(998,983) | ||
Add: Fair value at year end of awards granted during the covered fiscal year that were outstanding and unvested at the covered fiscal year end | 1,088,661 | ||
Add (Deduct): Year-over-year change in fair value at covered fiscal year end of awards granted in any prior fiscal year that were outstanding and unvested at the covered fiscal year end | (166,747) | ||
Add: Vesting date fair value of awards granted and vested during the covered fiscal year | — | ||
Add (Deduct): Change as of the vesting date (from the end of the prior fiscal year) in fair value of awards granted in any prior fiscal year for which vesting conditions were satisfied during the covered fiscal year | (50,947) | ||
(Deduct): Fair value at end of prior fiscal year of awards granted in any prior fiscal year that failed to meet the applicable vesting conditions during the covered fiscal year | — | ||
Add: Change in incremental fair value of awards modified during the covered fiscal year | — | ||
Add: Dividends or other earnings paid on awards in the covered fiscal year prior to vesting if not otherwise included in the Summary Compensation Table Total for the covered fiscal year | — | ||
Compensation “Actually Paid” to non-PEO NEOs | $1,326,496 | ||
CAP and TSR
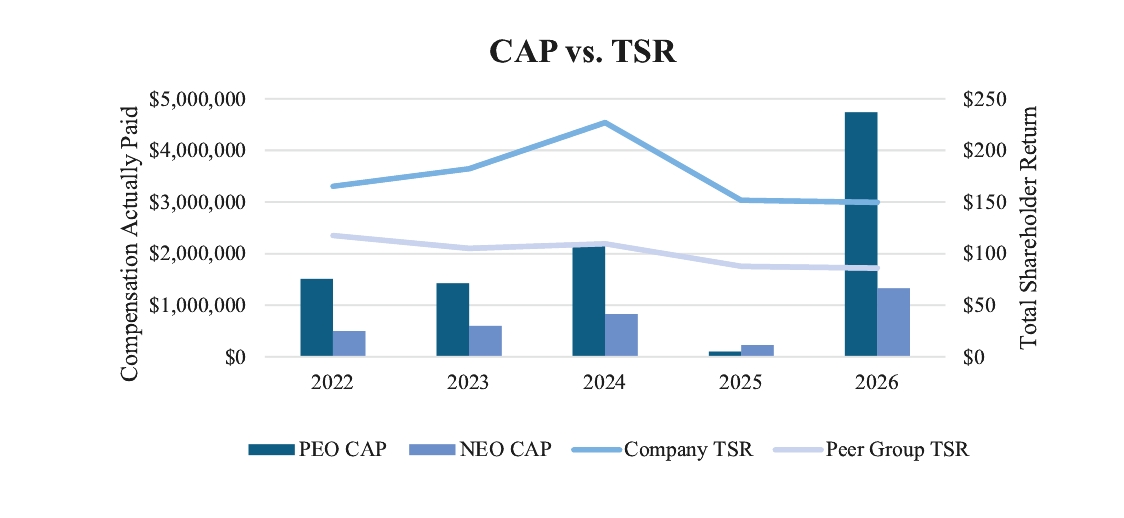
As demonstrated by the following table, with the exception of fiscal 2026, the amount of compensation actually paid to the PEO and the average amount of compensation actually paid to the Company’s NEOs as a group (excluding the PEO) is generally aligned with the Company’s cumulative TSR. In fiscal 2026, the Company entered into the Transition Agreement, which was designed to facilitate a smooth transition of the duties of CEO and President to a successor in advance of Mr. Rudow’s retirement. Of the target fiscal 2026 compensation under the Transition Agreement, approximately 80% is at-risk and performance-based, consistent with the Company’s compensation philosophy of aligning the interests of its officers with those of its shareholders. The table also compares the Company’s cumulative TSR to the TSR of the S&P Composite 1500 Life Sciences Tools & Services Industry Index. The alignment of CAP with the Company’s cumulative TSR over the period presented is because a significant portion of the compensation actually paid to our NEOs is comprised of equity awards. As described in more detail in the section “Compensation Discussion and Analysis – Elements of Executive Compensation,” the Company’s executive compensation program is primarily performance-based, for both short-term incentives (annual cash bonuses) and long-term incentives (equity awards).
CAP and Net Income
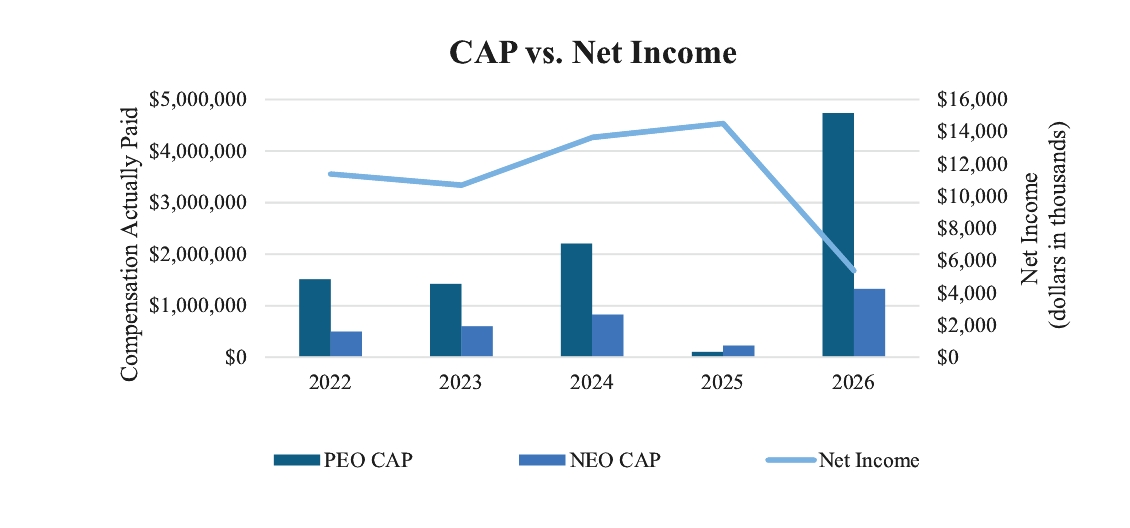
As demonstrated by the following table, the amount of compensation actually paid to the PEO and the average amount of compensation actually paid to the Company’s NEOs as a group (excluding the PEO) is aligned with the Company’s net income from fiscal 2022 to 2024. During fiscal 2025, while net income increased over fiscal 2024, compensation actually paid decreased primarily due to the significant decrease in the Company’s stock price. In fiscal 2026, net income decreased because of higher relative costs related to acquisitions, the CEO transition, and continued investments in technology, while PEO CAP increased for the reasons described above under CAP and TSR.
CAP and Adjusted EBITDA
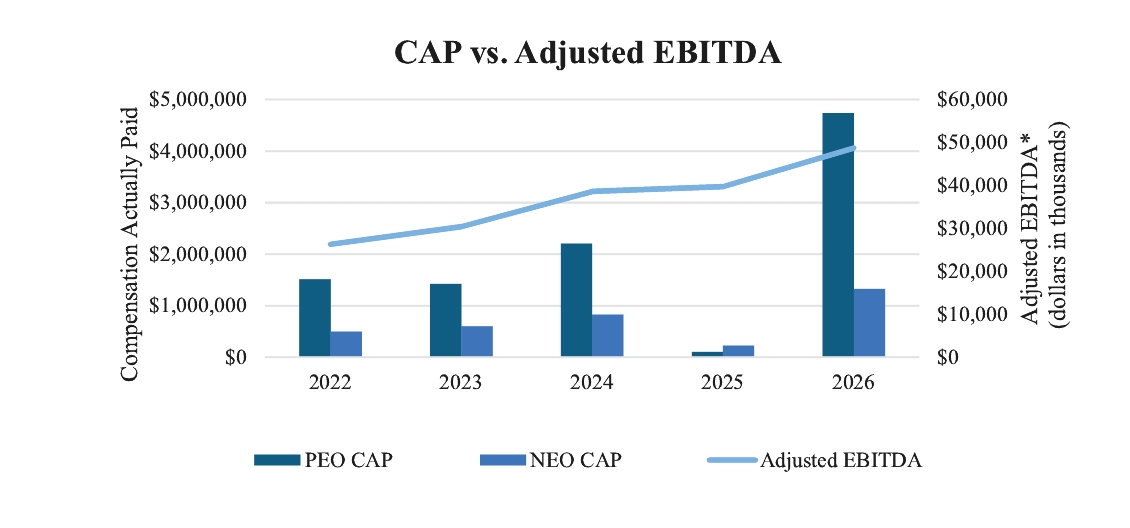
As demonstrated by the following table, the amount of compensation actually paid to the PEO and the average amount of compensation actually paid to the Company’s NEOs as a group (excluding the PEO) is aligned with the Company’s Adjusted EBITDA. As described in more detail in the section “Compensation Discussion and Analysis – Elements of Executive Compensation,” the Company uses Adjusted EBITDA as one of the base corporate objectives to determine performance-based cash incentive compensation and equity award vesting. Refer to Appendix A of this proxy statement for our definition of Adjusted EBITDA and a reconciliation of Adjusted EBITDA to the most directly comparable U.S. GAAP measure. However, in fiscal 2025, although Adjusted EBITDA increased over prior years, compensation actually paid to the PEO and NEOs decreased primarily due to the significant decrease in the Company’s stock price.
CAP and TSR
As demonstrated by the following table, with the exception of fiscal 2026, the amount of compensation actually paid to the PEO and the average amount of compensation actually paid to the Company’s NEOs as a group (excluding the PEO) is generally aligned with the Company’s cumulative TSR. In fiscal 2026, the Company entered into the Transition Agreement, which was designed to facilitate a smooth transition of the duties of CEO and President to a successor in advance of Mr. Rudow’s retirement. Of the target fiscal 2026 compensation under the Transition Agreement, approximately 80% is at-risk and performance-based, consistent with the Company’s compensation philosophy of aligning the interests of its officers with those of its shareholders. The table also compares the Company’s cumulative TSR to the TSR of the S&P Composite 1500 Life Sciences Tools & Services Industry Index. The alignment of CAP with the Company’s cumulative TSR over the period presented is because a significant portion of the compensation actually paid to our NEOs is comprised of equity awards. As described in more detail in the section “Compensation Discussion and Analysis – Elements of Executive Compensation,” the Company’s executive compensation program is primarily performance-based, for both short-term incentives (annual cash bonuses) and long-term incentives (equity awards).
Financial Performance Measures
As discussed in the CD&A, our executive compensation program and compensation decisions reflect the guiding principle of aligning long-term performance with shareholder interests. The metrics used within our incentive plans are selected to support these objectives. The following lists the most important financial performance measures used by the Company during the most recently completed fiscal year. These measures are not listed in order of importance.
• | Adjusted EBITDA |
• | Service Segment Gross Profit |
Non-Financial Performance Measure
As discussed in the CD&A, the Board’s assessment of corporate performance was also considered in setting pay-for-performance compensation for fiscal 2026.
In accordance with Item 402(v) of Regulation S-K, the Company is providing the following graphs with respect to the relationships between information presented in the Pay Versus Performance table.
(8) | Reported in thousands. Adjusted EBITDA is a non-GAAP measure. Refer to Appendix A of this proxy statement for our definition of Adjusted EBITDA and a reconciliation of Adjusted EBITDA to the most directly comparable U.S. GAAP measure. |