Shareholder Report
Sep. 30, 2025
USD ($)
$ / shares
WHAT WERE THE FUND COSTS FOR THE PAST YEAR? (based on a hypothetical $10,000 investment)
|
Fund Name
|
Costs of a $10,000 investment
|
Costs paid as a percentage of a $10,000 investment
|
|
Themes China Generative Artificial Intelligence ETF
|
$10*
|
0.39%**
|
HOW DID THE FUND PERFORM LAST YEAR AND WHAT AFFECTED ITS PERFORMANCE?
The Themes China Generative Artificial Intelligence ETF (DRGN) seeks to track the BITA China Generative AI Select Index (BCGAIS), which derive significant revenue from Generative AI-related activities. These activities include AI model training and provision, generative AI application software, AI infrastructure and hardware, physical AI applications, and general AI application software.
China’s AI sector has accelerated sharply in 2025, driven by strong government support, rapid advances in model development, and expanding commercial adoption across industries. Major Chinese tech firms are investing heavily in large-language models, AI-driven cloud services, and enterprise automation tools, while startups are emerging in fields such as AI-generated content, robotics, and chip design. Beijing’s national AI strategy—emphasizing domestic innovation, data sovereignty, and semiconductor independence—has created a robust ecosystem that integrates AI into manufacturing, healthcare, and consumer platforms. Despite ongoing U.S.–China tech tensions, China’s AI landscape continues to expand rapidly, positioning the country as a global leader in the commercialization and application of generative AI technologies.
The top contributor and detractor to DRGN’s performance included Kuaishou Technology, which contributed by 1.09% and Bairong, which detracted by 0.18% versus the index for the period ending 9/30/2025.
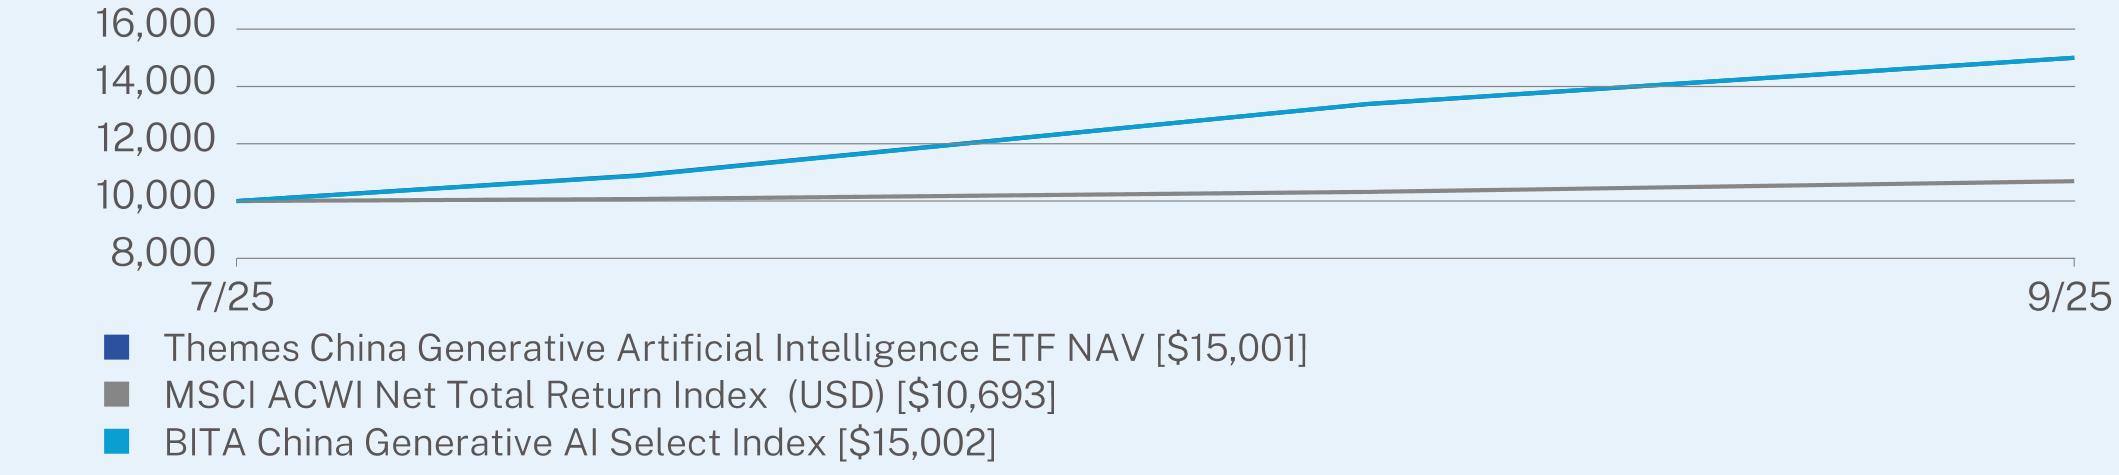
TOTAL RETURN (%)
|
|
Since Inception
(07/14/2025) |
|
Themes China Generative Artificial Intelligence ETF NAV
|
50.05
|
|
MSCI ACWI Net Total Return Index (USD)
|
6.93
|
|
BITA China Generative AI Select Index
|
50.02
|
Visit www.themesetfs.com/etfs/DRGN for more recent performance information.
KEY FUND STATISTICS (as of September 30, 2025)
|
Net Assets
|
$23,626,352
|
|
Number of Holdings
|
24
|
|
Net Advisory Fee
|
$3,778
|
|
Portfolio Turnover
|
16%
|
WHAT DID THE FUND INVEST IN? (as of September 30, 2025)
|
Top 10 Issuers
|
(%)
|
|
Montage Technology Co. Ltd.
|
7.9%
|
|
Baidu, Inc.
|
7.4%
|
|
Foxconn Industrial Internet Co. Ltd.
|
6.8%
|
|
Kuaishou Technology
|
6.6%
|
|
SenseTime Group, Inc.
|
6.3%
|
|
Cambricon Technologies Corp. Ltd.
|
5.9%
|
|
Xiaomi Corp.
|
5.8%
|
|
Iflytek Co. Ltd.
|
4.8%
|
|
Zhejiang Dahua Technology Co. Ltd.
|
4.7%
|
|
IEIT Systems Co. Ltd.
|
4.7%
|
|
Top Sectors
|
(%)
|
|
Technology
|
67.3%
|
|
Communications
|
23.1%
|
|
Consumer Discretionary
|
5.2%
|
|
Industrials
|
3.2%
|
|
Financials
|
0.5%
|
|
Cash & Other
|
0.7%
|
WHAT WERE THE FUND COSTS FOR THE PAST YEAR? (based on a hypothetical $10,000 investment)
|
Fund Name
|
Costs of a $10,000 investment
|
Costs paid as a percentage of a $10,000 investment
|
|
Themes Cloud Computing ETF
|
$41
|
0.36%
|
HOW DID THE FUND PERFORM LAST YEAR AND WHAT AFFECTED ITS PERFORMANCE?
The Themes Cloud Computing ETF (CLOD), launched on December 15, 2023, seeks to track the Solactive Cloud Computing Index (SOLCLOUN), which identifies the largest 50 companies by market capitalization that derive their revenues from: (1) Digital Security, (2) E-Commerce, (3) Infrastructure, (4) Data Infrastructure, (5) Data Architecture, (6) Internet Infrastructure, and (7)Data Support. CLOD seeks to provide investment results that correspond generally to the price and yield performance, before fees and expenses, of the SOLCLOUN Index.
Cloud-computing focused ETFs are benefiting greatly in 2025 as enterprises accelerate digital infrastructure investment and AI-driven workloads proliferate. Global public-cloud spending is projected at approximately $723 billion this year, up from about $595 billion in 2024.Companies across sectors — from e-commerce and entertainment to manufacturing and enterprise software — are scaling remote work platforms, data lakes, and generative-AI services. At the same time, cloud providers face rising costs: capex to expand data-centers, operational expenses, and supply-chain constraints for specialized hardware remain headwinds.
The top contributor and detractor to CLOD’s performance was Alphabet Inc, adding 0.92% to relative returns, while the top detractor was Applovin Corp., which reduced performance by 1.00% versus the index for the period ending 9/30/2025.
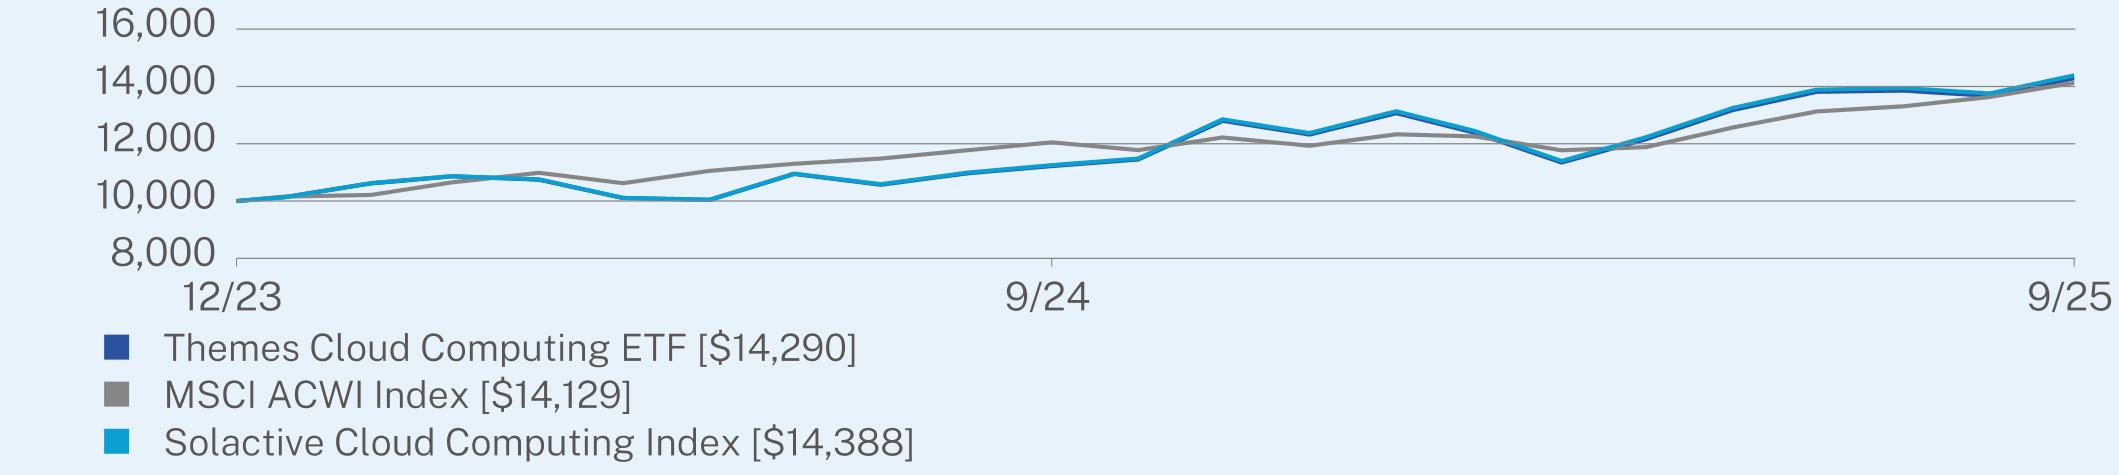
ANNUAL AVERAGE TOTAL RETURN (%)
|
|
1 Year
|
Since Inception
(12/15/2023) |
|
Themes Cloud Computing ETF
|
27.35
|
21.97
|
|
MSCI ACWI Index
|
17.27
|
21.21
|
|
Solactive Cloud Computing Index
|
27.86
|
22.44
|
Visit www.themesetfs.com/etfs/CLOD for more recent performance information.
KEY FUND STATISTICS (as of September 30, 2025)
|
Net Assets
|
$1,429,026
|
|
Number of Holdings
|
50
|
|
Net Advisory Fee
|
$5,088
|
|
Portfolio Turnover
|
15%
|
WHAT DID THE FUND INVEST IN? (as of September 30, 2025)
|
Top 10 Issuers
|
(%)
|
|
AppLovin Corp.
|
6.4%
|
|
Alphabet, Inc.
|
6.1%
|
|
Oracle Corp.
|
5.3%
|
|
Microsoft Corp.
|
4.6%
|
|
Palo Alto Networks, Inc.
|
4.4%
|
|
Amazon.com, Inc.
|
4.4%
|
|
Crowdstrike Holdings, Inc.
|
4.3%
|
|
Adobe, Inc.
|
4.2%
|
|
ServiceNow, Inc.
|
4.0%
|
|
MercadoLibre, Inc.
|
3.9%
|
|
Top Sectors
|
(%)
|
|
Technology
|
73.6%
|
|
Communications
|
17.1%
|
|
Consumer Discretionary
|
8.3%
|
|
Industrials
|
0.8%
|
|
Cash & Other
|
0.2%
|
WHAT WERE THE FUND COSTS FOR THE PAST YEAR? (based on a hypothetical $10,000 investment)
|
Fund Name
|
Costs of a $10,000 investment
|
Costs paid as a percentage of a $10,000 investment
|
|
Themes Copper Miners ETF
|
$44
|
0.38%
|
HOW DID THE FUND PERFORM LAST YEAR AND WHAT AFFECTED ITS PERFORMANCE?
The Themes Copper Miners ETF (COPA), launched September 24, 2024 seeks to track the BITA Global Copper Mining Select Index (BGCMSI), which identifies companies that derive their revenues from copper mining, explorations, refining, and royalties. COPA seeks to provide investment results that correspond generally to the price and yield performance, before fees and expenses, of the BGCMSI Index.
Copper-mining ETFs have seen strong performance, underpinned by a resurgence in copper demand tied to the global clean-energy transition. With copper trading around US $4.40–$5.00 per lb. this year, the metal has rebounded from earlier lows. As key components in electric vehicles, solar and wind energy systems, and grid infrastructure, copper’s industrial importance is being amplified by climate-tech investments. At the same time, the International Energy Agency projects a sizeable future supply shortfall — warning that copper supply will fall 30 % short of demand by 2035 if new mining and recycling investment doesn’t ramp up. These twin forces — robust demand for clean-tech and a tightening supply backdrop — have positioned copper miners and related ETFs to benefit from structural shifts in energy, transportation and infrastructure.
The top contributor and detractor to COPA’s performance attribution included Nittetsu Mining Co LTD, which contributed by 0.29% and Jinchuan Group International, which detracted by 0.44% versus the index for the period ending 9/30/2025.
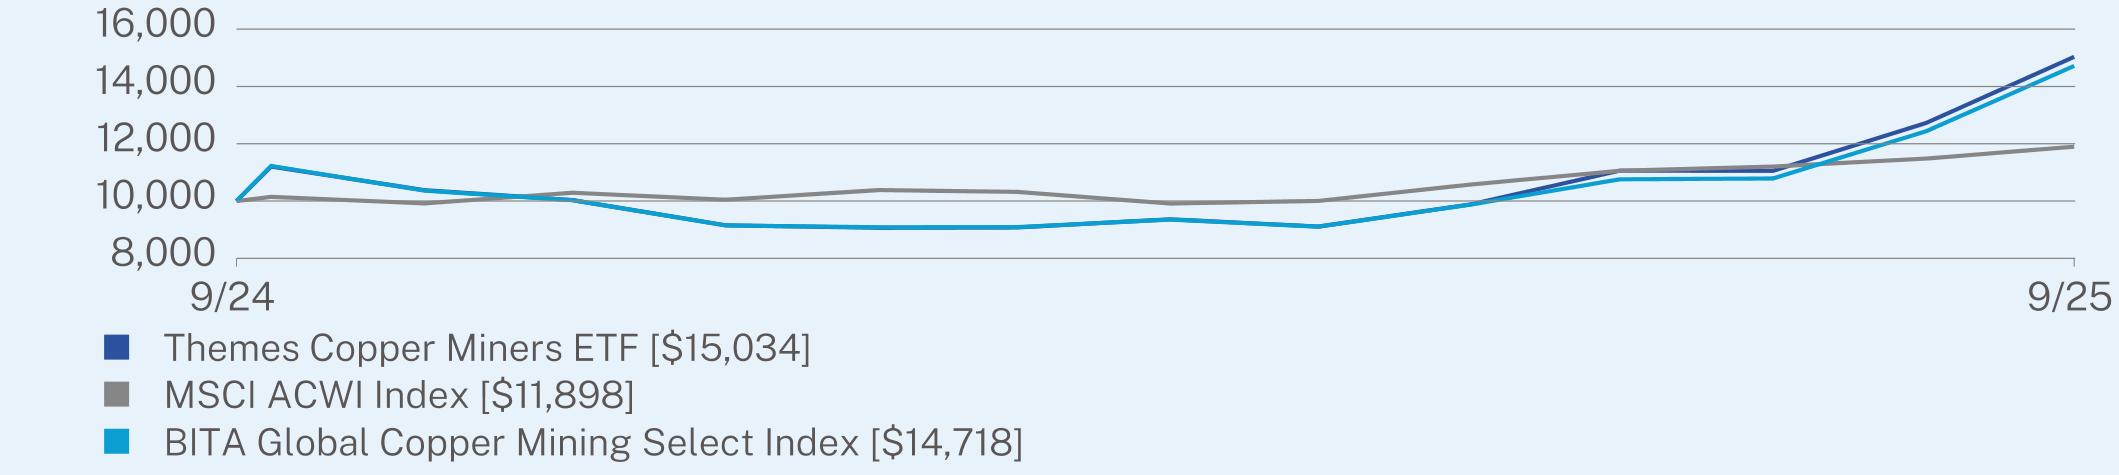
ANNUAL AVERAGE TOTAL RETURN (%)
|
|
1 Year
|
Since Inception
(9/24/2024) |
|
Themes Copper Miners ETF
|
33.24
|
49.19
|
|
MSCI ACWI Index
|
17.27
|
18.59
|
|
BITA Global Copper Mining Select Index
|
31.10
|
46.11
|
Visit www.themesetfs.com/etfs/COPA for more recent performance information.
KEY FUND STATISTICS (as of September 30, 2025)
|
Net Assets
|
$1,106,012
|
|
Number of Holdings
|
55
|
|
Net Advisory Fee
|
$2,420
|
|
Portfolio Turnover
|
42%
|
WHAT DID THE FUND INVEST IN? (as of September 30, 2025)
|
Top 10 Issuers
|
(%)
|
|
Freeport-McMoRan, Inc.
|
6.7%
|
|
Jiangxi Copper Co. Ltd.
|
5.9%
|
|
First Quantum Minerals Ltd.
|
4.7%
|
|
Antofagasta PLC
|
4.0%
|
|
Ivanhoe Mines Ltd.
|
4.0%
|
|
Teck Resources Ltd.
|
4.0%
|
|
Lundin Mining Corp.
|
3.8%
|
|
Capstone Copper Corp.
|
3.5%
|
|
China Nonferrous Mining Corp. Ltd.
|
3.5%
|
|
Glencore PLC
|
3.4%
|
|
Top Sectors
|
(%)
|
|
Materials
|
97.9%
|
|
Industrials
|
1.8%
|
|
Cash & Other
|
0.3%
|
WHAT WERE THE FUND COSTS FOR THE PAST YEAR? (based on a hypothetical $10,000 investment)
|
Fund Name
|
Costs of a $10,000 investment
|
Costs paid as a percentage of a $10,000 investment
|
|
Themes Cybersecurity ETF
|
$40
|
0.36%
|
HOW DID THE FUND PERFORM LAST YEAR AND WHAT AFFECTED ITS PERFORMANCE?
The Themes Cybersecurity ETF (SPAM), launched on December 8, 2023, seeks to track the Solactive Cybersecurity Index (SOCYBERN), which identifies the largest 35 companies by market capitalization in digital security software. SPAM seeks to provide investment results that correspond generally to the price and yield performance, before fees and expenses, of the SOCYBERN Index.
Cybersecurity ETFs have posted strong gains in 2025 as demand for advanced digital protection continues to surge worldwide. Global information-security spending is expected to reach around $212 billion, up roughly 15% from 2024, driven by rising threats linked to cloud adoption, AI integration, and remote-work expansion. High-profile ransomware and infrastructure attacks have prompted both corporate and government entities to boost cybersecurity budgets, while the rapid growth of AI-powered defense tools has created new opportunities for the sector. Because cybersecurity remains an essential business priority regardless of economic cycles, ETFs in this space have demonstrated resilience.
The top contributor and detractor of SPAM’s performance was Nebius Group NV, adding 2.91% to relative returns, while the top detractor was Rapid7, Inc., which reduced performance by 0.56% versus the index for the period ending 9/30/2025.
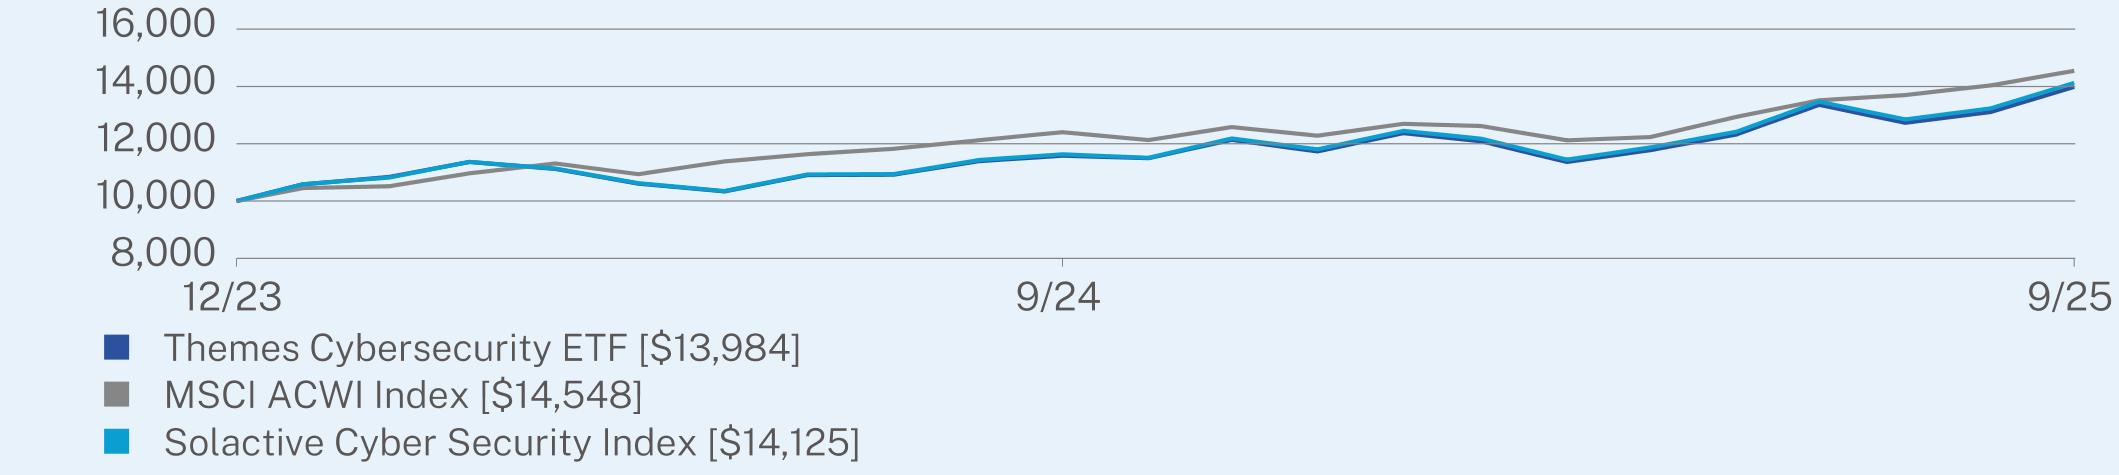
ANNUAL AVERAGE TOTAL RETURN (%)
|
|
1 Year
|
Since Inception
(12/8/2023) |
|
Themes Cybersecurity ETF
|
20.73
|
20.28
|
|
MSCI ACWI Index
|
17.27
|
22.92
|
|
Solactive Cyber Security Index
|
21.45
|
20.94
|
Visit www.themesetfs.com/etfs/SPAM for more recent performance information.
KEY FUND STATISTICS (as of September 30, 2025)
|
Net Assets
|
$2,095,046
|
|
Number of Holdings
|
36
|
|
Net Advisory Fee
|
$6,468
|
|
Portfolio Turnover
|
38%
|
WHAT DID THE FUND INVEST IN? (as of September 30, 2025)
|
Top 10 Issuers
|
(%)
|
|
Nebius Group NV
|
10.5%
|
|
NEXTDC Ltd.
|
5.4%
|
|
CyberArk Software Ltd.
|
5.1%
|
|
Varonis Systems, Inc.
|
4.6%
|
|
CACI International, Inc.
|
4.4%
|
|
Palo Alto Networks, Inc.
|
4.2%
|
|
Crowdstrike Holdings, Inc.
|
4.1%
|
|
SentinelOne, Inc.
|
4.1%
|
|
Zscaler, Inc.
|
4.1%
|
|
Akamai Technologies, Inc.
|
4.0%
|
|
Top Sectors
|
(%)
|
|
Technology
|
90.1%
|
|
Communications
|
6.7%
|
|
Industrials
|
2.9%
|
|
Cash & Other
|
0.3%
|
WHAT WERE THE FUND COSTS FOR THE PAST YEAR? (based on a hypothetical $10,000 investment)
|
Fund Name
|
Costs of a $10,000 investment
|
Costs paid as a percentage of a $10,000 investment
|
|
Themes Generative Artificial Intelligence ETF
|
$43
|
0.35%
|
HOW DID THE FUND PERFORM LAST YEAR AND WHAT AFFECTED ITS PERFORMANCE?
The Themes Generative Artificial Intelligence ETF (WISE), launched on December 8, 2023, seeks to track the Solactive Generative Artificial Intelligence Index (SOLGAIN), which includes companies deriving revenue from one or more of the following areas: (1) Artificial Intelligence, (2) Data Analytics & Big Data, (3) Natural Language Processing, and (4) AI-Driven Services. WISE seeks to provide investment results that correspond generally to the price and yield performance, before fees and expenses, of the SOLGAIN Index.
AI-focused ETFs have remained in the spotlight throughout 2025, driven by the rapid adoption of artificial intelligence across healthcare, finance, manufacturing, and infrastructure. Companies developing and deploying AI technologies—such as cloud providers, semiconductor manufacturers, enterprise software firms, and automation companies—continue to benefit from robust demand. Significant capital investments in AI infrastructure, generative model development, and research are reinforcing investor confidence and driving inflows into dedicated AI strategies. As a result, many AI-themed ETFs have outperformed broader equity indices year to date.
For WISE, the top contributor to performance was Pagaya Technologies, adding 4.72% to relative returns, while the top detractor was SoundHound AI Inc., which reduced performance by 3.51% versus the index for the period ending 9/30/2025.
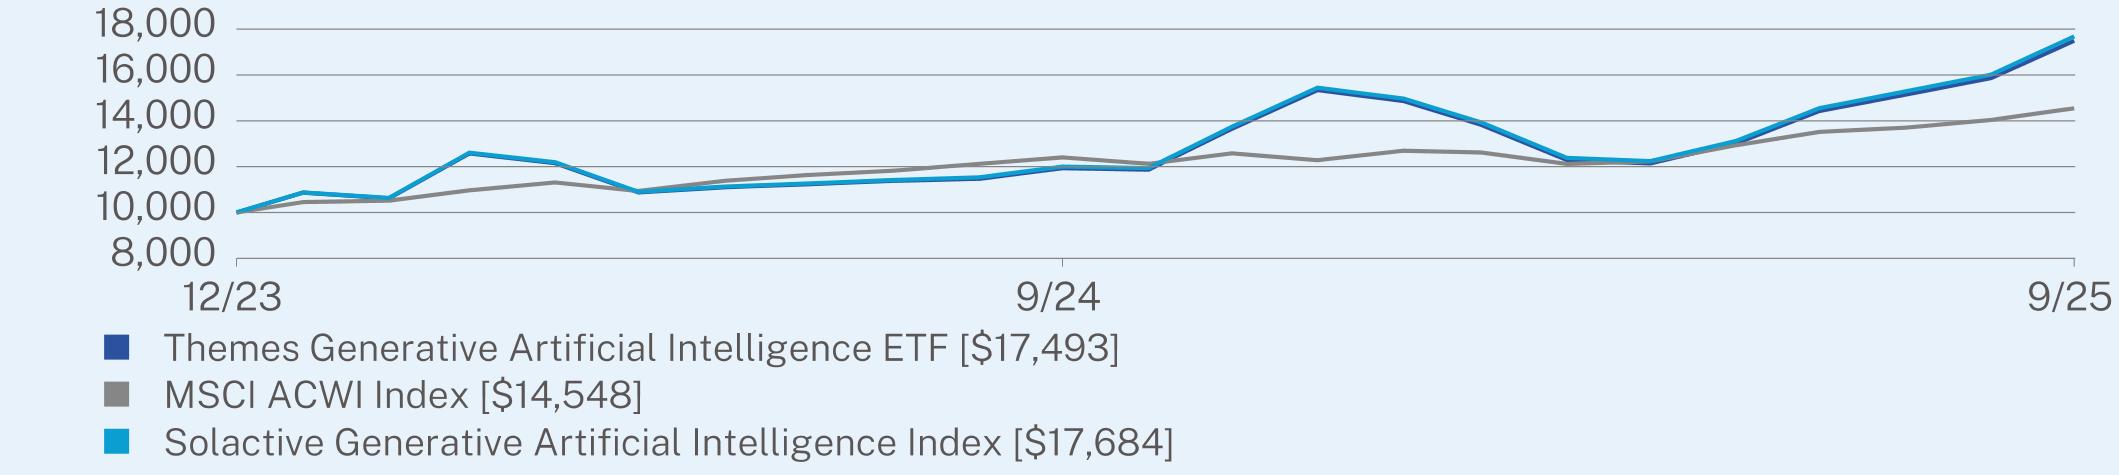
ANNUAL AVERAGE TOTAL RETURN (%)
|
|
1 Year
|
Since Inception
(12/8/2023) |
|
Themes Generative Artificial Intelligence ETF
|
46.57
|
36.05
|
|
MSCI ACWI Index
|
17.27
|
22.92
|
|
Solactive Generative Artificial Intelligence Index
|
47.35
|
36.87
|
Visit www.themesetfs.com/etfs/WISE for more recent performance information.
KEY FUND STATISTICS (as of September 30, 2025)
|
Net Assets
|
$40,234,441
|
|
Number of Holdings
|
41
|
|
Net Advisory Fee
|
$88,912
|
|
Portfolio Turnover
|
74%
|
WHAT DID THE FUND INVEST IN? (as of September 30, 2025)
|
Top 10 Issuers
|
(%)
|
|
Veritone, Inc.
|
7.0%
|
|
Apple, Inc.
|
4.8%
|
|
NVIDIA Corp.
|
4.4%
|
|
Gorilla Technology Group, Inc.
|
4.3%
|
|
SoundHound AI, Inc.
|
4.1%
|
|
Bairong, Inc.
|
3.9%
|
|
Beijing Fourth Paradigm Technology Co. Ltd.
|
3.8%
|
|
Advanced Micro Devices, Inc.
|
3.8%
|
|
Microsoft Corp.
|
3.7%
|
|
Broadcom, Inc.
|
3.7%
|
|
Top Sectors
|
(%)
|
|
Technology
|
87.2%
|
|
Consumer Discretionary
|
4.7%
|
|
Financials
|
3.9%
|
|
Communications
|
2.9%
|
|
Health Care
|
1.2%
|
|
Cash & Other
|
0.1%
|
WHAT WERE THE FUND COSTS FOR THE PAST YEAR? (based on a hypothetical $10,000 investment)
|
Fund Name
|
Costs of a $10,000 investment
|
Costs paid as a percentage of a $10,000 investment
|
|
Themes Global Systemically Important Banks ETF
|
$45
|
0.35%
|
HOW DID THE FUND PERFORM LAST YEAR AND WHAT AFFECTED ITS PERFORMANCE?
The Themes Global Systemically Important Banks ETF (GSIB), launched December 15, 2023, actively invests in traded global banks that have been identified as “systemically important” by the Financial Stability Board and the Basel Committee on Banking Supervision. A bank is deemed “systemically important” due to its size, interconnectedness, financial infrastructure, complexity, and cross jurisdictional activity.
Global Systemically Important Banks - focused ETFs have delivered strong results this year, driven by a combination of expanded net interest income from elevated interest rates and a rebound in investment banking activity. Large global banks are benefiting from the wider spread between what they pay on deposits and what they earn on loans, and many are seeing improved fee income from increased mergers & acquisitions, equity underwriting, and capital markets transactions. Coupled with regulatory stability and their dominant competitive position, this has reinforced profitability for many of these institutions.
The top contributors to GSIB’s performance was Banco Santander SA, Duetsche Bank AG and Societe Generale SA which returned 133.90%, 113.55% and 112.15% respectively. There were no retractors in the period ending 9/30/2025.
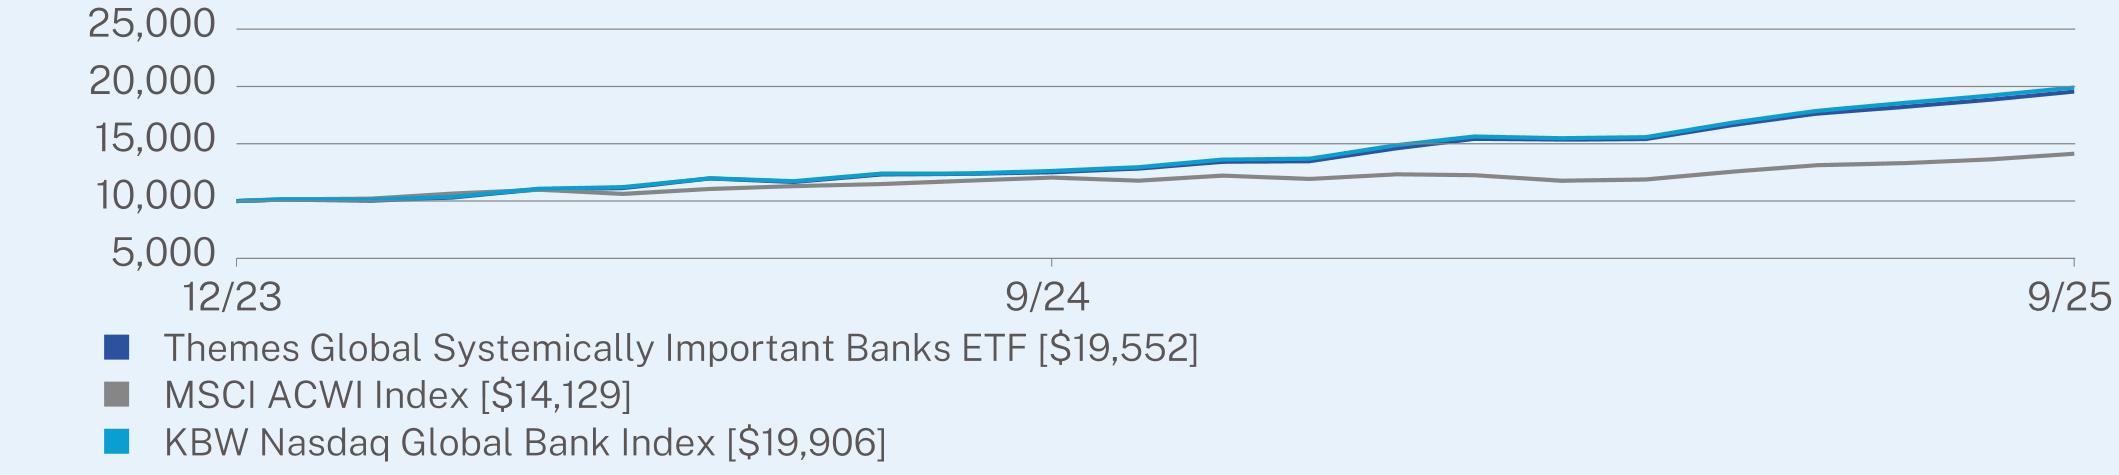
ANNUAL AVERAGE TOTAL RETURN (%)
|
|
1 Year
|
Since Inception
(12/15/2023) |
|
Themes Global Systemically Important Banks ETF
|
56.30
|
45.22
|
|
MSCI ACWI Index
|
17.27
|
21.21
|
|
KBW Nasdaq Global Bank Index
|
57.64
|
46.68
|
Visit www.themesetfs.com/etfs/GSIB for more recent performance information.
KEY FUND STATISTICS (as of September 30, 2025)
|
Net Assets
|
$20,192,713
|
|
Number of Holdings
|
29
|
|
Net Advisory Fee
|
$27,610
|
|
Portfolio Turnover
|
11%
|
WHAT DID THE FUND INVEST IN? (as of September 30, 2025)
|
Top 10 Issuers
|
(%)
|
|
HSBC Holdings PLC
|
3.6%
|
|
Banco Santander SA
|
3.6%
|
|
ING Groep NV
|
3.6%
|
|
Standard Chartered PLC
|
3.6%
|
|
Barclays PLC
|
3.6%
|
|
State Street Corp.
|
3.6%
|
|
BNP Paribas SA
|
3.6%
|
|
Toronto-Dominion Bank
|
3.6%
|
|
UBS Group AG
|
3.6%
|
|
Agricultural Bank of China Ltd.
|
3.6%
|
|
Top Sectors
|
(%)
|
|
Financials
|
99.7%
|
|
Cash & Other
|
0.3%
|
WHAT WERE THE FUND COSTS FOR THE PAST YEAR? (based on a hypothetical $10,000 investment)
|
Fund Name
|
Costs of a $10,000 investment
|
Costs paid as a percentage of a $10,000 investment
|
|
Themes Gold Miners ETF
|
$55
|
0.35%
|
HOW DID THE FUND PERFORM LAST YEAR AND WHAT AFFECTED ITS PERFORMANCE?
The Themes Gold Miners ETF (AUMI), launched December 13, 2023, seeks to track the Solactive Global Pure Gold Miners Index (SOLGLPGM), which identifies the largest companies by market capitalization that derive their revenues from gold mining. AUMI seeks to provide investment results that corresponds generally to the price and yield performance, before fees and expenses, of the SOLGLPGM Index.
Many gold-mining ETFs delivered outstanding returns this year, propelled by a surge in the gold price which recently topped $4,000 per ounce, a new milestone. The rally is driven by elevated geopolitical tensions, a weaker U.S. dollar, inflationary pressures and strong safe-haven demand — all amplifying gold’s appeal. Central-bank purchases of bullion and robust investor flows into gold-backed ETFs have further strengthened the metal’s up-trend. As a result, mining companies are enjoying improved profitability and many gold-mining ETFs are reaping the benefits of rising revenues and margins.
The top contributor to AUMI’s performance attribution of the underlying included Gold Fields Ltd, which contributed by 2.57%, there were no detractors versus the index for the period ending 9/30/2025.
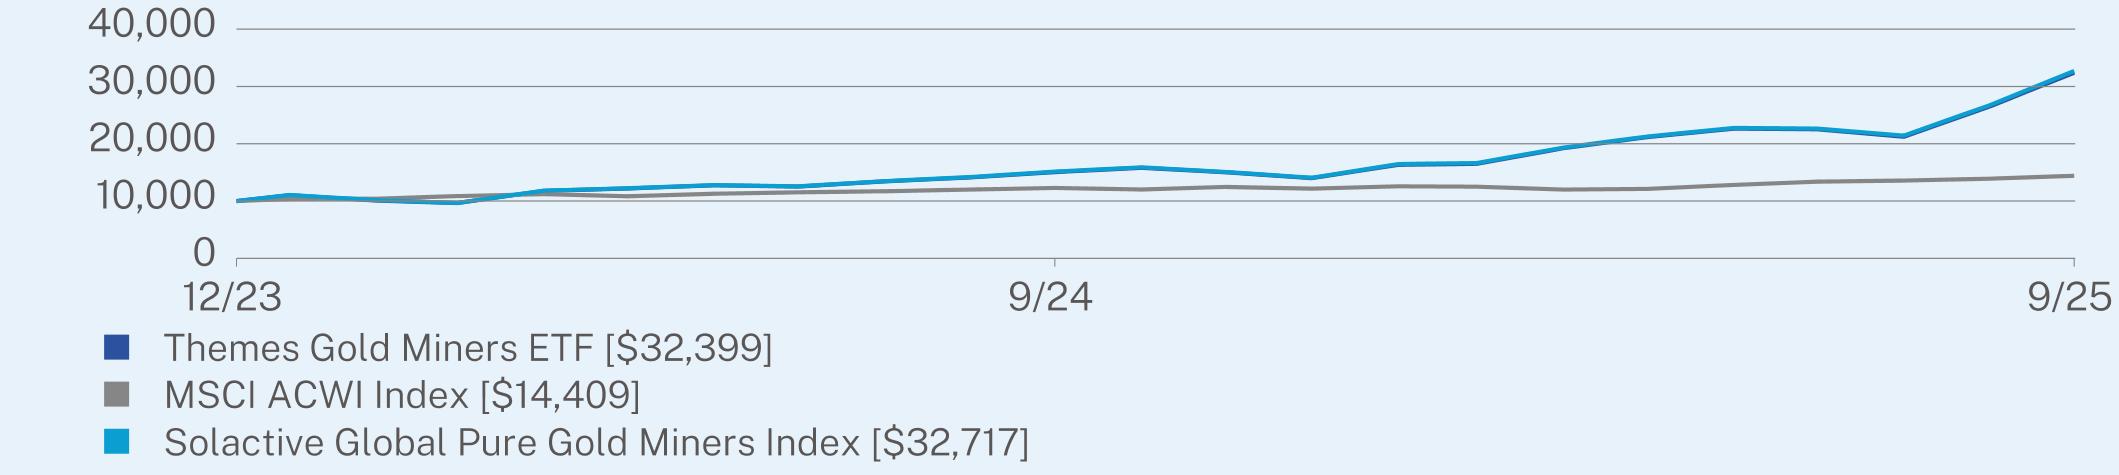
ANNUAL AVERAGE TOTAL RETURN (%)
|
|
1 Year
|
Since Inception
(12/13/2023) |
|
Themes Gold Miners ETF
|
115.31
|
91.95
|
|
MSCI ACWI Index
|
17.27
|
22.46
|
|
Solactive Global Pure Gold Miners Index
|
116.09
|
93.00
|
Visit www.themesetfs.com/etfs/AUMI for more recent performance information.
KEY FUND STATISTICS (as of September 30, 2025)
|
Net Assets
|
$18,287,588
|
|
Number of Holdings
|
27
|
|
Net Advisory Fee
|
$24,411
|
|
Portfolio Turnover
|
29%
|
WHAT DID THE FUND INVEST IN? (as of September 30, 2025)
|
Top 10 Issuers
|
(%)
|
|
IAMGOLD Corp.
|
5.5%
|
|
Zhaojin Mining Industry Co. Ltd.
|
5.4%
|
|
Equinox Gold Corp.
|
5.2%
|
|
Gold Fields Ltd.
|
5.1%
|
|
Northern Star Resources Ltd.
|
5.1%
|
|
Anglogold Ashanti PLC
|
4.8%
|
|
Kinross Gold Corp.
|
4.7%
|
|
B2Gold Corp.
|
4.7%
|
|
Endeavour Mining PLC
|
4.6%
|
|
Agnico Eagle Mines Ltd.
|
4.6%
|
|
Top Sectors
|
(%)
|
|
Materials
|
99.7%
|
|
Cash & Other
|
0.3%
|
WHAT WERE THE FUND COSTS FOR THE PAST YEAR? (based on a hypothetical $10,000 investment)
|
Fund Name
|
Costs of a $10,000 investment
|
Costs paid as a percentage of a $10,000 investment
|
|
Themes Humanoid Robotics ETF
|
$45
|
0.37%
|
HOW DID THE FUND PERFORM LAST YEAR AND WHAT AFFECTED ITS PERFORMANCE?
The Themes Robotics & Automation ETF (BOTT), launched April 22, 2024, underwent a strategy and name change in August of 2025 to Themes Humanoid Robotics ETF (BOTT). Before the strategy and name change, BOTT tracked the Solactive Industrial Robotics & Automation Index (SOLIROBO), which identified the largest 30 companies with a positive total return over the past 12 months in the following industry groups: (1) Factory Automation Equipment, (2) General/Processor/Specialized Semiconductors, (3) Industrial Machine Parts and Support Equipment, and (4) Programmable Logic and ASIC Semiconductors.
After its strategy change BOTT now seeks to track the Solactive Global Humanoid Robotics Index (SOLGHRBN), which represents companies active across the humanoid robotics value chain, including service robotics and AI-driven automation technologies. It includes firms developing humanoid and service robots designed for human interaction, industrial and autonomous robots for manufacturing and logistics, assistive and wearable robotics for mobility and healthcare, as well as companies providing AI, cognitive computing, and advanced hardware technologies that power next-generation robotic systems. BOTT seeks to provide investment results that correspond generally to the price and yield performance, before fees and expenses, of the SOLGHRBN Index.
The robotics and automation sector continues to gain momentum in 2025 as demand accelerates for AI-enabled machines, advanced automation in healthcare, manufacturing and logistics, and smart robotics in general. The global advanced robotics market is projected to reach about US $53.7 billion this year, poised for a compound annual growth rate of approximately 20% through 2034. While high-profile companies delivering robotic-assisted surgery systems, autonomous logistics platforms and AI chips continue to thrive, the industry is still managing headwinds such as component shortages, geopolitical trade restrictions and supply-chain disruptions. Nonetheless, labor-shortage pressures, rising wage costs and a global push toward factory modernization underpin strong long-term prospects for automation.
The top contributor and detractor to BOTT’s performance attribution before its strategy change included Hesai Group, which contributed by 0.64% and Richtech Robotics Inc, which detracted 0.91% versus the index for the period ending 8/15/2025. The top contributor and detractor to BOTT’s performance attribution after its strategy change included Flex LTD, which contributed by 0.24% and Williams-Sonoma, which detracted 0.21% versus the index for the period ending 9/30/2025.
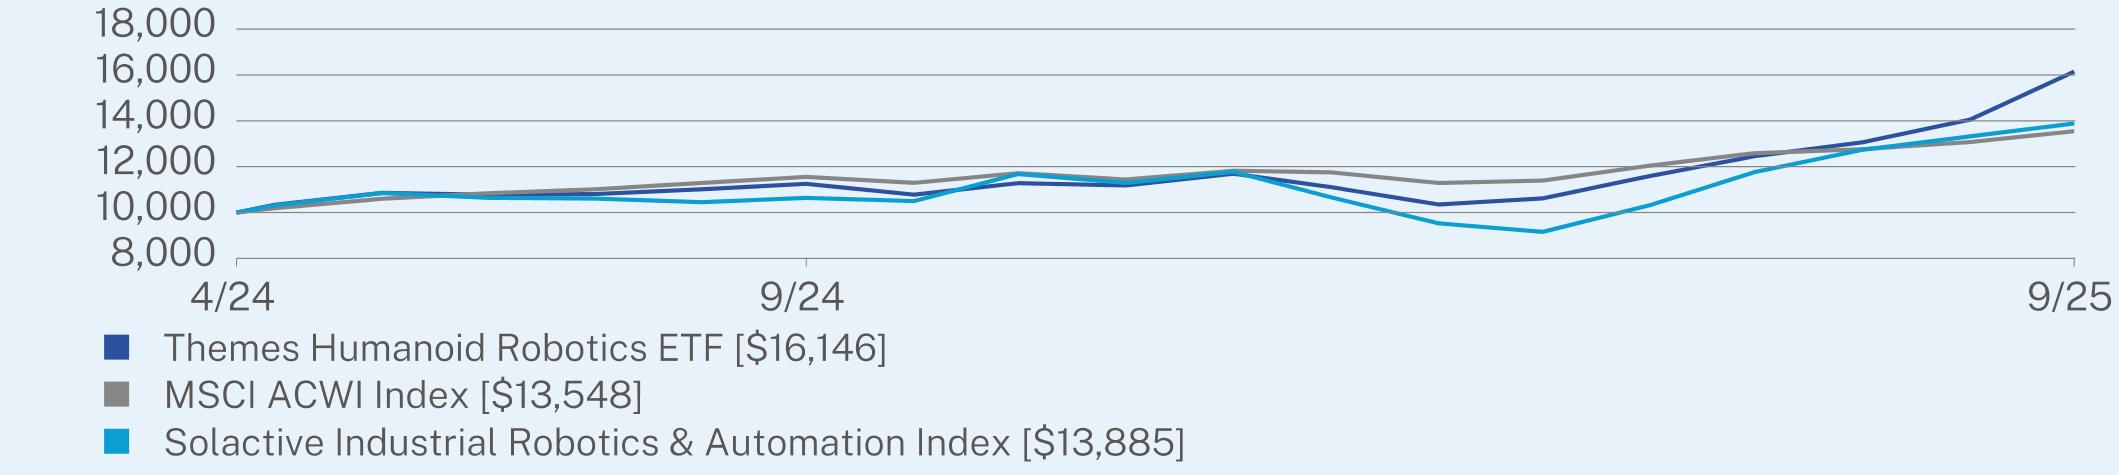
ANNUAL AVERAGE TOTAL RETURN (%)
|
|
1 Year
|
Since Inception
(4/22/2024) |
|
Themes Humanoid Robotics ETF
|
43.51
|
39.17
|
|
MSCI ACWI Index
|
17.27
|
23.31
|
|
Solactive Industrial Robotics & Automation Index
|
30.51
|
25.42
|
Visit www.themesetfs.com/etfs/BOTT for more recent performance information.
KEY FUND STATISTICS (as of September 30, 2025)
|
Net Assets
|
$5,555,989
|
|
Number of Holdings
|
31
|
|
Net Advisory Fee
|
$2,946
|
|
Portfolio Turnover
|
197%
|
WHAT DID THE FUND INVEST IN? (as of September 30, 2025)
|
Top 10 Issuers
|
(%)
|
|
Richtech Robotics, Inc.
|
7.8%
|
|
UBTech Robotics Corp. Ltd.
|
7.0%
|
|
Ecovacs Robotics Co. Ltd.
|
6.5%
|
|
Tesla, Inc.
|
5.2%
|
|
Teradyne, Inc.
|
4.6%
|
|
Hesai Group
|
4.2%
|
|
Neuromeka Co. Ltd.
|
4.0%
|
|
NVIDIA Corp.
|
3.9%
|
|
Rainbow Robotics
|
3.9%
|
|
EFORT Intelligent Robot Co. Ltd.
|
3.8%
|
|
Top Sectors
|
(%)
|
|
Industrials
|
70.8%
|
|
Consumer Discretionary
|
14.5%
|
|
Technology
|
10.6%
|
|
Communications
|
3.7%
|
|
Cash & Other
|
0.4%
|
WHAT WERE THE FUND COSTS FOR THE PAST YEAR? (based on a hypothetical $10,000 investment)
|
Fund Name
|
Costs of a $10,000 investment
|
Costs paid as a percentage of a $10,000 investment
|
|
Themes Lithium & Battery Metal Miners ETF
|
$44
|
0.38%
|
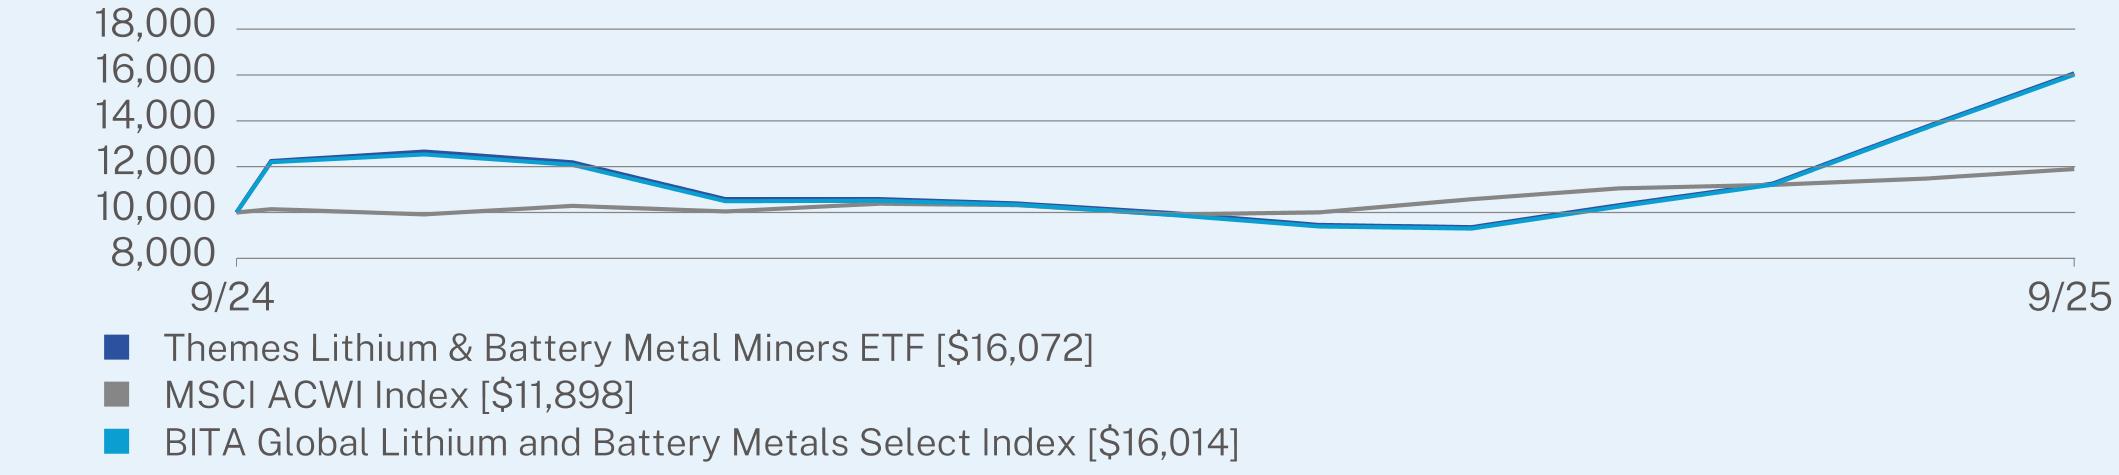
HOW DID THE FUND PERFORM LAST YEAR AND WHAT AFFECTED ITS PERFORMANCE?
The Themes Lithium & Battery Metal Miners ETF (LIMI), launched September 24, 2024 seeks to track the BITA Global Lithium and Battery Metals Index (BGLISI), which identifies companies that derive their revenues from lithium and battery metals mining, explorations, refining, and royalties. LIMI seeks to provide investment results that correspond generally to the price and yield performance, before fees and expenses, of the BGLISI Index.
Lithium-mining ETFs have shown renewed strength in 2025, supported by a rebound in lithium demand as global electric-vehicle (EV) production accelerates and energy-storage projects expand. After a period of price normalization in 2024, lithium prices have stabilized around $20,000–$25,000 per ton, reflecting a healthier balance between supply and demand. Government incentives for EV manufacturing in the U.S., Europe, and Asia—combined with major investments in battery recycling and next-generation solid-state technologies—have reinforced long-term demand for the metal. Although new supply from Australia and South America has eased some market tightness, continued growth in renewable energy storage keeps lithium a central pillar of the clean-energy transition. As a result, lithium-focused ETFs remain well-positioned to benefit from the ongoing global shift toward electrification and decarbonization.
The top contributor and detractor to LIMI’s performance attribution included Ganzhou Teng Yuan, which contributed by 0.24% and Arcadium Lithium, which detracted by 1.34% versus the index for the period ending 9/30/2025.
ANNUAL AVERAGE TOTAL RETURN (%)
|
|
1 Year
|
Since Inception
(9/24/2024) |
|
Themes Lithium & Battery Metal Miners ETF
|
31.27
|
59.29
|
|
MSCI ACWI Index
|
17.27
|
18.59
|
|
BITA Global Lithium and Battery Metals Select Index
|
31.32
|
58.73
|
Visit www.themesetfs.com/etfs/LIMI for more recent performance information.
KEY FUND STATISTICS (as of September 30, 2025)
|
Net Assets
|
$374,090
|
|
Number of Holdings
|
39
|
|
Net Advisory Fee
|
$2,088
|
|
Portfolio Turnover
|
127%
|
WHAT DID THE FUND INVEST IN? (as of September 30, 2025)
|
Top 10 Issuers
|
(%)
|
|
Mineral Resources Ltd.
|
6.1%
|
|
IGO Ltd.
|
5.9%
|
|
Liontown Resources Ltd.
|
5.8%
|
|
Pilbara Minerals Ltd.
|
5.8%
|
|
AMG Critical Materials NV
|
5.6%
|
|
Albemarle Corp.
|
5.5%
|
|
Lithium Americas Corp.
|
4.5%
|
|
Vulcan Energy Resources Ltd.
|
3.9%
|
|
Guangzhou Tinci Materials Technology Co. Ltd.
|
3.7%
|
|
Ganfeng Lithium Group Co. Ltd.
|
3.4%
|
|
Top Sectors
|
(%)
|
|
Materials
|
99.5%
|
|
Cash & Other
|
0.5%
|
WHAT WERE THE FUND COSTS FOR THE PAST YEAR? (based on a hypothetical $10,000 investment)
|
Fund Name
|
Costs of a $10,000 investment
|
Costs paid as a percentage of a $10,000 investment
|
|
Themes Natural Monopoly ETF
|
$38
|
0.36%
|
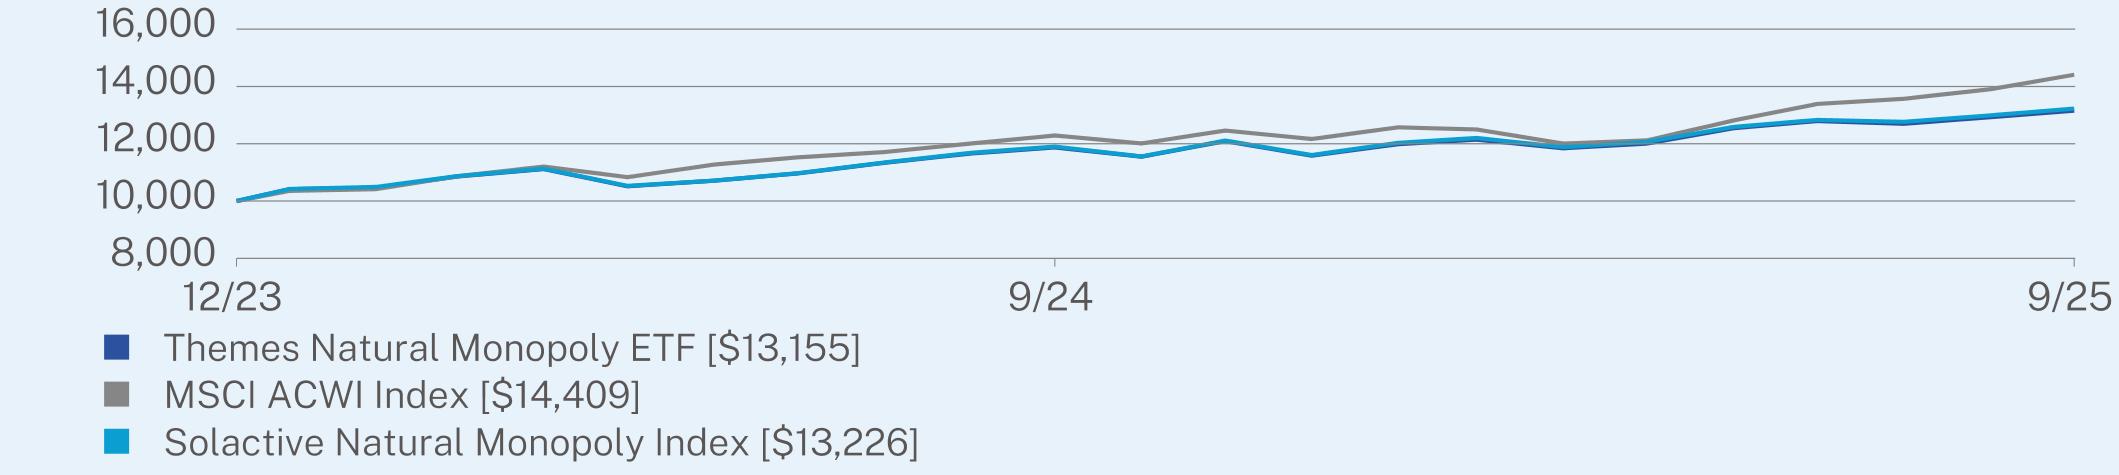
HOW DID THE FUND PERFORM LAST YEAR AND WHAT AFFECTED ITS PERFORMANCE?
The Themes Natural Monopoly ETF (CZAR), launched December 13, 2023, seeks to track the Solactive Natural Monopoly Index (SOLNMONN), which identifies the top 5 companies within 19 different sectors that have: (1) High Sales, (2) Stable Profitability, (3) Stable Return on Equity, (4) Operational Efficiency, and (5) Reinvestment of Profits. CZAR seeks to provide investment results that correspond generally to the price and yield performance, before fees and expenses, of the SOLNMONN Index.
Natural-monopoly ETFs have posted solid performance this year as investors gravitate toward sectors offering stable, income-generating cash flows amid market turbulence. Industries such as utilities, railroads, pipelines, and certain telecoms benefit from high infrastructure costs and economies of scale that limit competition and support steady earnings. However, these sectors are also facing headwinds in 2025, including elevated regulatory scrutiny, rising capital-expenditure needs, and sensitivity to interest-rate movements—all of which can pressure valuations and limit near-term growth.
The top contributor and detractor to CZAR’s performance Broadcom Inc, adding 1.29% to relative returns, while the top detractor was Adobe Inc., which reduced performance by 1.09% versus the index for the period ending 9/30/2025.
ANNUAL AVERAGE TOTAL RETURN (%)
|
|
1 Year
|
Since Inception
(12/13/2023) |
|
Themes Natural Monopoly ETF
|
10.82
|
16.43
|
|
MSCI ACWI Index
|
17.27
|
22.46
|
|
Solactive Natural Monopoly Index
|
11.13
|
16.77
|
Visit www.themesetfs.com/etfs/CZAR for more recent performance information.
KEY FUND STATISTICS (as of September 30, 2025)
|
Net Assets
|
$1,629,205
|
|
Number of Holdings
|
96
|
|
Net Advisory Fee
|
$5,328
|
|
Portfolio Turnover
|
84%
|
WHAT DID THE FUND INVEST IN? (as of September 30, 2025)
|
Top 10 Issuers
|
(%)
|
|
Amphenol Corp.
|
4.5%
|
|
Broadcom, Inc.
|
4.3%
|
|
Blackrock, Inc.
|
3.9%
|
|
BAE Systems PLC
|
3.8%
|
|
Autodesk, Inc.
|
3.6%
|
|
Mastercard, Inc.
|
3.6%
|
|
Cisco Systems, Inc.
|
3.5%
|
|
Aon PLC
|
3.5%
|
|
Meta Platforms, Inc.
|
3.5%
|
|
Arthur J Gallagher & Co.
|
3.4%
|
|
Top Sectors
|
(%)
|
|
Industrials
|
21.2%
|
|
Technology
|
20.9%
|
|
Financials
|
18.6%
|
|
Health Care
|
9.6%
|
|
Consumer Staples
|
7.7%
|
|
Communications
|
7.5%
|
|
Consumer Discretionary
|
5.5%
|
|
Materials
|
3.4%
|
|
Energy
|
2.7%
|
|
Cash & Other
|
2.9%
|
WHAT WERE THE FUND COSTS FOR THE PAST YEAR? (based on a hypothetical $10,000 investment)
|
Fund Name
|
Costs of a $10,000 investment
|
Costs paid as a percentage of a $10,000 investment
|
|
Themes Silver Miners ETF
|
$53
|
0.37%
|
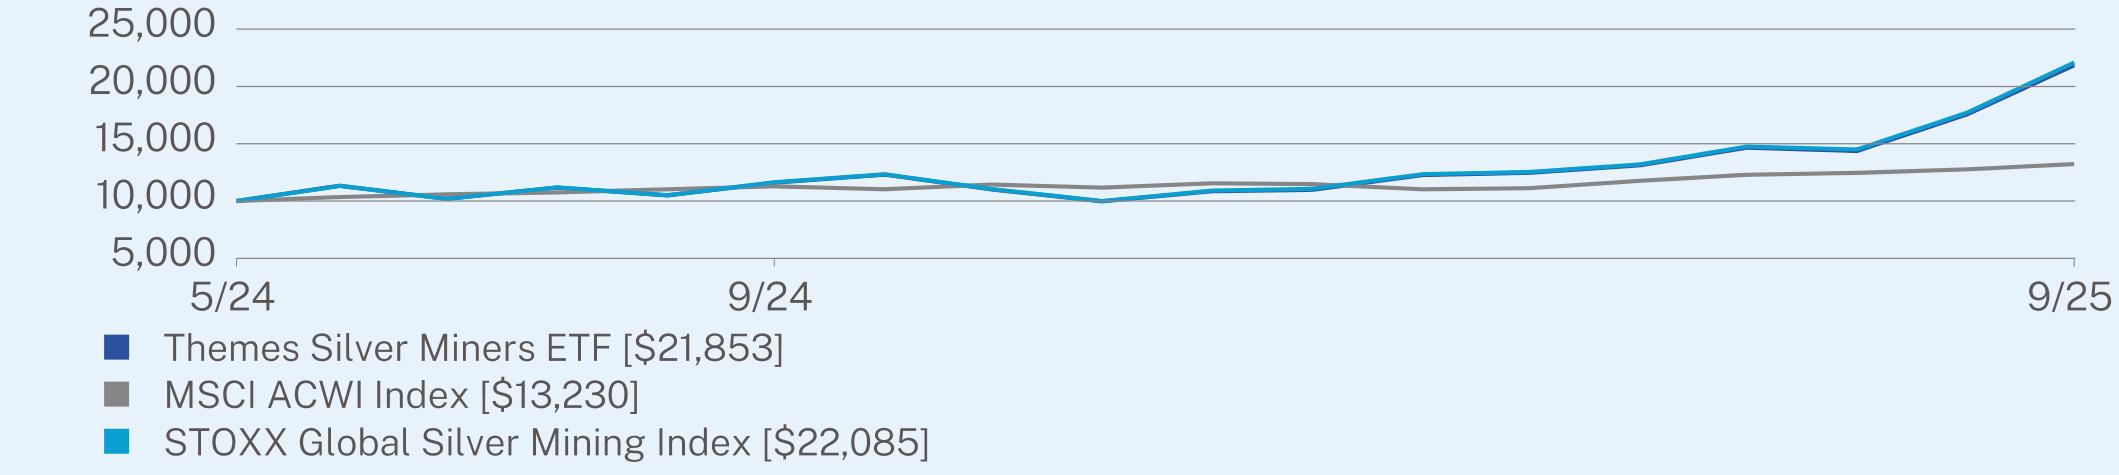
HOW DID THE FUND PERFORM LAST YEAR AND WHAT AFFECTED ITS PERFORMANCE?
The Themes Silver Miners ETF (AGMI), launched May 03, 2023, seeks to track the STOXX Global Silver Miners Index (STXSILVV), which identifies companies that derive their revenues from silver mining. AGMI seeks to provide investment results that correspond generally to the price and yield performance, before fees and expenses, of the STXSILVV Index.
Silver-mining ETFs have delivered impressive performance in 2025, supported by a sharp rise in silver prices, which recently climbed above $31 per ounce, reaching multi-year highs. The rally has been fueled by surging industrial demand—particularly from the renewable-energy and electronics sectors, where silver remains essential for solar panels, electric vehicles, and semiconductors. Inflation concerns, a weaker U.S. dollar, and persistent market volatility have further boosted investor appetite for precious metals as a hedge, allowing silver to outperform many commodities. This combination of robust industrial use and renewed safe-haven demand has driven strong profitability among silver producers.
The top contributor and detractor to AGMI’s performance attribution included Wheaton Precious Metals Corp, which contributed by 1.35%, there were no detractors for this fund versus the index for the period ending 9/30/2025.
ANNUAL AVERAGE TOTAL RETURN (%)
|
|
1 Year
|
Since Inception
(5/3/2024) |
|
Themes Silver Miners ETF
|
88.37
|
73.84
|
|
MSCI ACWI Index
|
17.27
|
21.89
|
|
STOXX Global Silver Mining Index
|
89.76
|
75.15
|
Visit www.themesetfs.com/etfs/AGMI for more recent performance information.
KEY FUND STATISTICS (as of September 30, 2025)
|
Net Assets
|
$3,757,637
|
|
Number of Holdings
|
38
|
|
Net Advisory Fee
|
$2,897
|
|
Portfolio Turnover
|
124%
|
WHAT DID THE FUND INVEST IN? (as of September 30, 2025)
|
Top 10 Issuers
|
(%)
|
|
Fresnillo PLC
|
9.7%
|
|
Newmont Corp.
|
9.6%
|
|
Industrias Penoles SAB de CV
|
9.4%
|
|
First Majestic Silver Corp.
|
6.2%
|
|
Wheaton Precious Metals Corp.
|
5.9%
|
|
Endeavour Silver Corp.
|
5.2%
|
|
Discovery Silver Corp.
|
4.6%
|
|
Zijin Mining Group Co. Ltd.
|
4.5%
|
|
Pan American Silver Corp.
|
4.3%
|
|
Triple Flag Precious Metals Corp.
|
3.8%
|
|
Top Sectors
|
(%)
|
|
Materials
|
99.5%
|
|
Cash & Other
|
0.5%
|
WHAT WERE THE FUND COSTS FOR THE PAST YEAR? (based on a hypothetical $10,000 investment)
|
Fund Name
|
Costs of a $10,000 investment
|
Costs paid as a percentage of a $10,000 investment
|
|
Themes Transatlantic Defense ETF
|
$44*
|
0.35%**
|
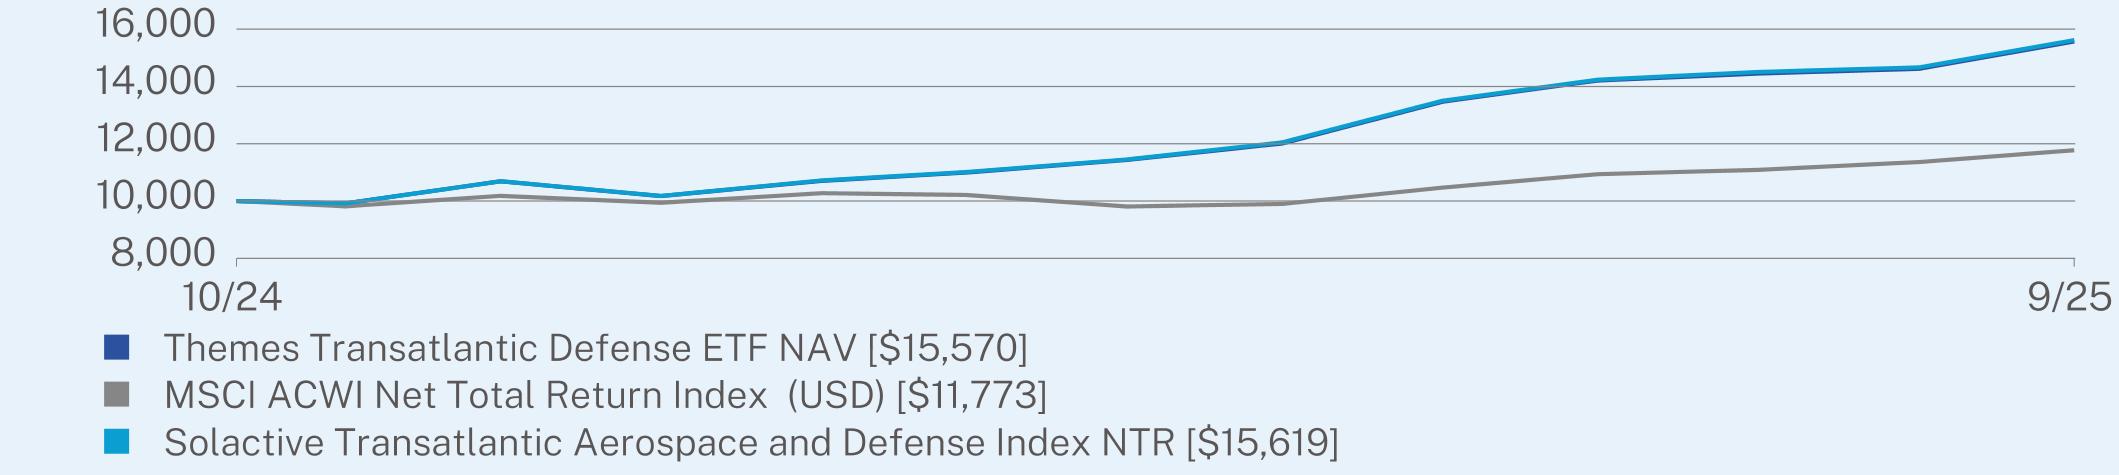
HOW DID THE FUND PERFORM LAST YEAR AND WHAT AFFECTED ITS PERFORMANCE?
The Themes Transatlantic Defense ETF (NATO), launched October 11, 2024 seeks to track the Solactive Transatlantic Aerospace and Defense Index (SOLNATON), which represents companies engaged in the aerospace and defense industry and headquartered in countries that are members of the North Atlantic Treaty Organization (NATO). The index identifies firms involved in defense technology, aerospace manufacturing, cybersecurity, and military support systems—sectors that play a critical role in global security and allied defense cooperation. NATO seeks to provide investment results that correspond generally to the price and yield performance, before fees and expenses, of the SOLNATON Index.
Aerospace and defense ETFs have gained momentum in 2025 as heightened geopolitical tensions and increased defense spending among NATO member nations drive demand for advanced military and security technologies. Governments are boosting budgets for modernization, missile defense, and aerospace innovation, while companies supplying critical equipment and technology benefit from multi-year procurement programs. The continued commitment to collective defense and innovation within the North Atlantic Treaty Organization has strengthened earnings visibility across the sector benefiting defense-focused ETFs.
The top contributor and detractor to NATO’s performance attribution included Axon Enterprise Inc, which contributed by 0.24% and Aselsan Elektronik Sanayi, which detracted by 0.16% versus the index for the period ending 9/30/2025.
TOTAL RETURN (%)
|
|
Since Inception
(10/10/2024) |
|
Themes Transatlantic Defense ETF NAV
|
55.70
|
|
MSCI ACWI Net Total Return Index (USD)
|
17.73
|
|
Solactive Transatlantic Aerospace and Defense Index NTR
|
56.19
|
Visit https://themesetfs.com/etfs/NATO for more recent performance information.
KEY FUND STATISTICS (as of September 30, 2025)
|
Net Assets
|
$57,171,370
|
|
Number of Holdings
|
71
|
|
Net Advisory Fee
|
$66,931
|
|
Portfolio Turnover
|
20%
|
WHAT DID THE FUND INVEST IN? (as of September 30, 2025)
|
Top 10 Issuers
|
(%)
|
|
GE Aerospace
|
8.8%
|
|
RTX Corp.
|
8.5%
|
|
Boeing Co.
|
7.0%
|
|
Airbus SE
|
6.2%
|
|
Honeywell International, Inc.
|
6.2%
|
|
Safran SA
|
5.6%
|
|
Rolls-Royce Holdings PLC
|
5.0%
|
|
Lockheed Martin Corp.
|
4.5%
|
|
Rheinmetall AG
|
4.4%
|
|
Northrop Grumman Corp.
|
4.2%
|
|
Top Sectors
|
(%)
|
|
Industrials
|
97.7%
|
|
Technology
|
1.8%
|
|
Consumer Discretionary
|
0.1%
|
|
Cash & Other
|
0.4%
|
WHAT WERE THE FUND COSTS FOR THE PAST YEAR? (based on a hypothetical $10,000 investment)
|
Fund Name
|
Costs of a $10,000 investment
|
Costs paid as a percentage of a $10,000 investment
|
|
Themes Uranium & Nuclear ETF
|
$46
|
0.35%
|
HOW DID THE FUND PERFORM LAST YEAR AND WHAT AFFECTED ITS PERFORMANCE?
The Themes Uranium & Nuclear ETF (URAN), launched September 24, 2024 seeks to track the BITA Global Uranium and Nuclear Select Index (BGUNSI), which identifies companies that derive their revenues from uranium mining, explorations, refining, processing, and royalties, as well as nuclear energy, equipment, technology, and infrastructure. URAN seeks to provide investment results that correspond generally to the price and yield performance, before fees and expenses, of the BGUNSI Index.
Uranium- and nuclear-energy ETFs have surged as global demand for clean, dependable power mounts. With uranium spot prices climbing from around US $70–80 per pound to highs near US $83 per pound, supply constraints and heightened geopolitical tensions have added fuel to the advance. Countries including the U.S. and China are ramping up nuclear-capacity investment and accelerating deployment of small-modular reactors (SMRs), bolstering the appeal of nuclear as a strategic energy vector. As a result, nuclear- and uranium-mining companies are posting stronger earnings, and related ETFs are benefiting.
The top contributor and detractor to URAN’s performance attribution included Chengdu Guoguang Electric, which contributed by 1.97% and CGN Power Co LTD, which detracted by 0.66% versus the index for the period ending 9/30/2025.
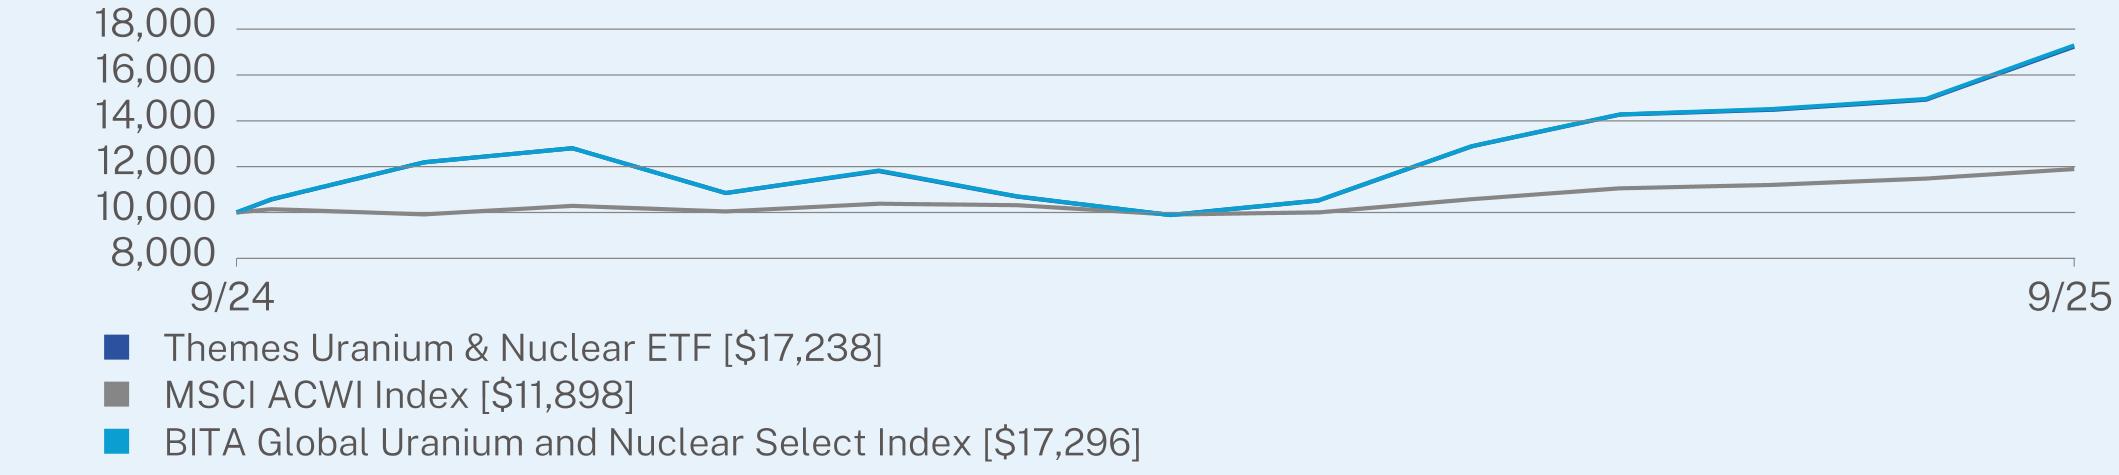
ANNUAL AVERAGE TOTAL RETURN (%)
|
|
1 Year
|
Since Inception
(9/24/2024) |
|
Themes Uranium & Nuclear ETF
|
63.20
|
70.63
|
|
MSCI ACWI Index
|
17.27
|
18.59
|
|
BITA Global Uranium and Nuclear Select Index
|
63.51
|
71.19
|
Visit www.themesetfs.com/etfs/URAN for more recent performance information.
KEY FUND STATISTICS (as of September 30, 2025)
|
Net Assets
|
$20,452,223
|
|
Number of Holdings
|
42
|
|
Net Advisory Fee
|
$25,642
|
|
Portfolio Turnover
|
52%
|
WHAT DID THE FUND INVEST IN? (as of September 30, 2025)
|
Top 10 Issuers
|
(%)
|
|
Constellation Energy Corp.
|
8.6%
|
|
Cameco Corp.
|
7.7%
|
|
Oklo, Inc.
|
4.9%
|
|
Silex Systems Ltd.
|
3.9%
|
|
Lightbridge Corp.
|
3.6%
|
|
American Electric Power Co., Inc.
|
3.4%
|
|
Duke Energy Corp.
|
3.4%
|
|
PG&E Corp.
|
3.2%
|
|
Centrus Energy Corp.
|
3.2%
|
|
NexGen Energy Ltd.
|
3.1%
|
|
Top Sectors
|
(%)
|
|
Materials
|
46.3%
|
|
Utilities
|
34.9%
|
|
Industrials
|
14.3%
|
|
Technology
|
3.9%
|
|
Cash & Other
|
0.6%
|
WHAT WERE THE FUND COSTS FOR THE PAST YEAR? (based on a hypothetical $10,000 investment)
|
Fund Name
|
Costs of a $10,000 investment
|
Costs paid as a percentage of a $10,000 investment
|
|
Themes US Cash Flow Champions ETF
|
$32
|
0.30%
|
HOW DID THE FUND PERFORM LAST YEAR AND WHAT AFFECTED ITS PERFORMANCE?
The Themes US Cash Flow Champions ETF (LGCF), launched on December 13, 2023, seeks to track the Solactive US Cash Flow Champions Index (SOLUCFCT), which identifies the top 75 large/mid capitalization companies with the highest 3 years of positive cash flow yield. LGCF seeks to provide investment results that correspond generally to the price and yield performance, before fees and expenses, of the SOLUCFCT Index.
U.S. Cash-Flow ETFs have gained traction this year as investors favor companies generating strong, stable cash flows amid ongoing economic volatility. With persistent inflation and rising input costs, firms that reliably convert earnings into cash and maintain solid balance sheets remain attractive. Signals from the Federal Reserve that a pause in rate hikes may be approaching have also supported sentiment toward businesses with lower leverage and reduced interest-rate sensitivity. Still, elevated costs and uneven demand trends have pressured some cash-flow-focused companies, creating pockets of performance dispersion. Even so, the emphasis on U.S.-based firms with strong free-cash-flow profiles continues to offer relative stability in an uncertain global environment.
The top contributor and detractor of LGCF’s performance was Applovin Corp, adding 1.28% to relative returns, while the top detractor was Bristol-Myers Squibb., which reduced performance by 0.72% versus the index for the period ending 9/30/2025.
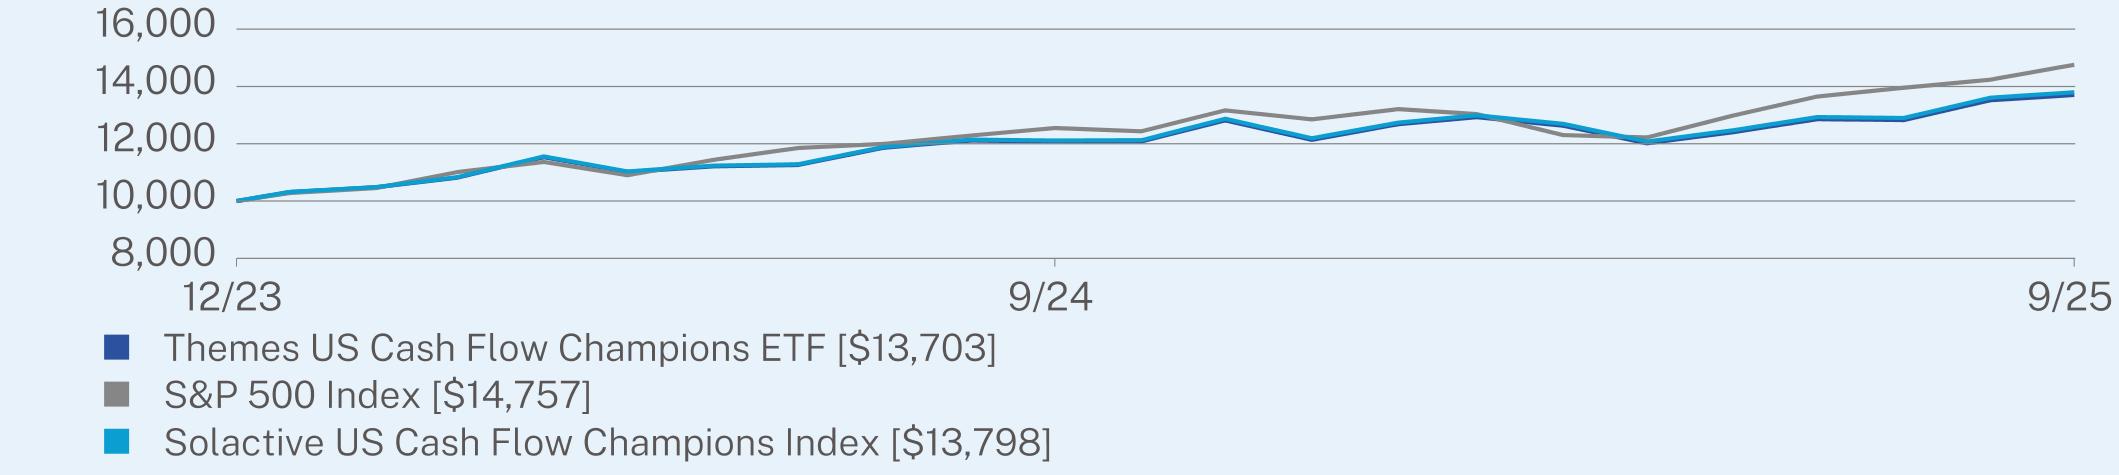
ANNUAL AVERAGE TOTAL RETURN (%)
|
|
1 Year
|
Since Inception
(12/13/2023) |
|
Themes US Cash Flow Champions ETF
|
13.44
|
19.10
|
|
S&P 500 Index
|
17.60
|
24.09
|
|
Solactive US Cash Flow Champions Index
|
13.91
|
19.55
|
Visit www.themesetfs.com/etfs/LGCF for more recent performance information.
KEY FUND STATISTICS (as of September 30, 2025)
|
Net Assets
|
$2,708,733
|
|
Number of Holdings
|
76
|
|
Net Advisory Fee
|
$6,002
|
|
Portfolio Turnover
|
20%
|
WHAT DID THE FUND INVEST IN? (as of September 30, 2025)
|
Top 10 Issuers
|
(%)
|
|
AbbVie, Inc.
|
5.8%
|
|
JPMorgan Chase & Co.
|
5.1%
|
|
Chevron Corp.
|
5.0%
|
|
Wells Fargo & Co.
|
4.9%
|
|
Exxon Mobil Corp.
|
4.9%
|
|
Uber Technologies, Inc.
|
3.9%
|
|
American Express Co.
|
3.6%
|
|
AppLovin Corp.
|
3.6%
|
|
Progressive Corp.
|
2.8%
|
|
Pfizer, Inc.
|
2.8%
|
|
Top Sectors
|
(%)
|
|
Financials
|
39.1%
|
|
Energy
|
20.2%
|
|
Health Care
|
18.3%
|
|
Communications
|
9.5%
|
|
Consumer Discretionary
|
4.4%
|
|
Consumer Staples
|
2.8%
|
|
Technology
|
2.4%
|
|
Industrials
|
1.4%
|
|
Materials
|
0.8%
|
|
Cash & Other
|
1.1%
|
WHAT WERE THE FUND COSTS FOR THE PAST YEAR? (based on a hypothetical $10,000 investment)
|
Fund Name
|
Costs of a $10,000 investment
|
Costs paid as a percentage of a $10,000 investment
|
|
Themes US Infrastructure ETF
|
$33
|
0.31%
|
HOW DID THE FUND PERFORM LAST YEAR AND WHAT AFFECTED ITS PERFORMANCE?
The Themes US Infrastructure ETF (HWAY) launched September 12, 2024, seeks to track the Solactive United States Infrastructure Index (SOLUSIST), which identifies US infrastructure companies that derive their revenues from either: (1) Building Materials & Equipment, (2) Construction, (3) Logistics or (4) Engineering Services. HWAY seeks to provide investment results that correspond generally to the price and yield performance, before fees and expenses, of the SOLUSIST Index.
U.S. infrastructure ETFs have continued to build momentum in 2025, supported by a steady rollout of federal and state spending tied to the Infrastructure Investment and Jobs Act and the Inflation Reduction Act. These programs are channeling hundreds of billions of dollars into projects spanning transportation, renewable energy, broadband expansion, and water systems, creating sustained demand for construction, engineering, and materials companies. Private-sector participation—particularly in clean energy and advanced manufacturing—has further amplified growth across the infrastructure value chain. As the U.S. prioritizes modernization, energy transition, and climate resilience, infrastructure-focused ETFs have benefited from strong earnings in industrial and utility holdings. However, performance has been limited at times by project delays, rising construction and labor costs, and higher interest rates, which have pressured margins for capital-intensive companies and introduced volatility into the sector’s overall returns.
The top contributor and detractor to HWAY’s performance attribution included Caterpillar Inc, which contributed by.03% and Norfolk Southern Corp, which detracted by.04% versus the index for the period ending 9/30/2025.
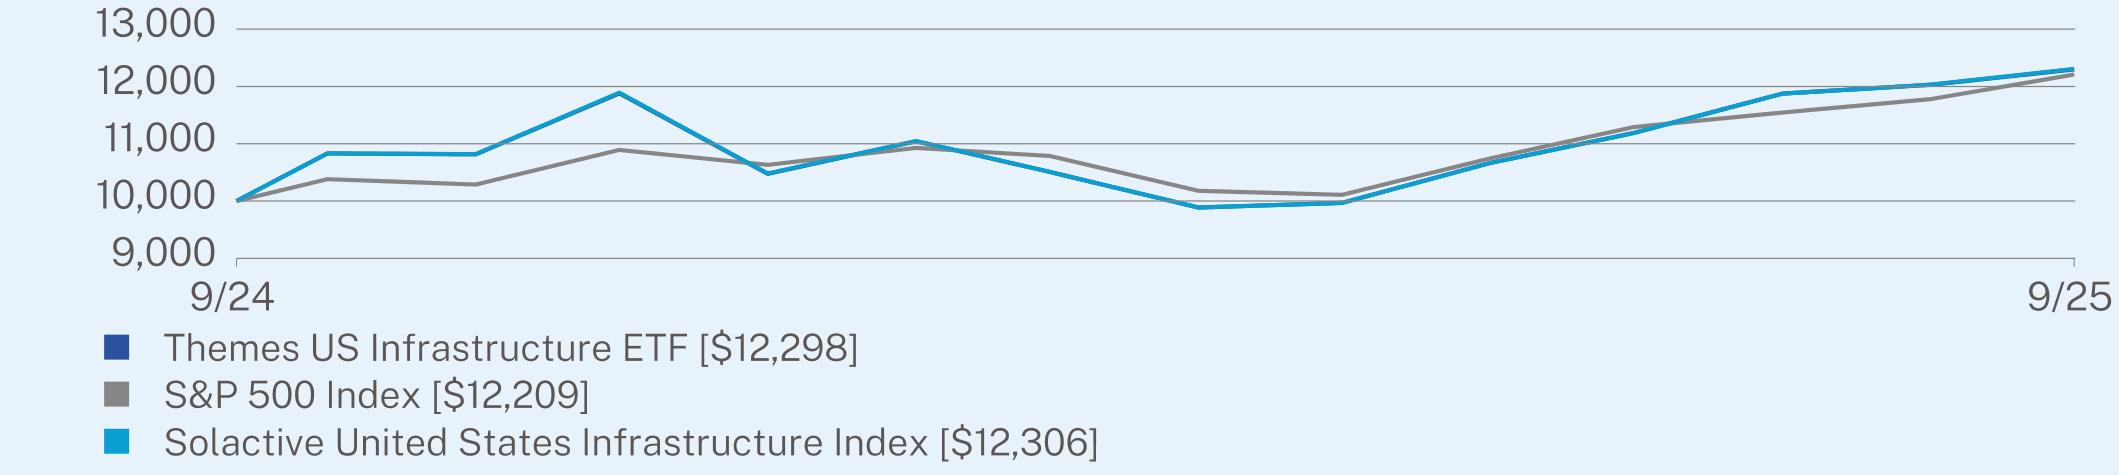
ANNUAL AVERAGE TOTAL RETURN (%)
|
|
1 Year
|
Since Inception
(9/12/2024) |
|
Themes US Infrastructure ETF
|
13.54
|
21.73
|
|
S&P 500 Index
|
17.60
|
20.89
|
|
Solactive United States Infrastructure Index
|
13.60
|
21.80
|
Visit www.themesetfs.com/etfs/HWAY for more recent performance information.
KEY FUND STATISTICS (as of September 30, 2025)
|
Net Assets
|
$1,227,184
|
|
Number of Holdings
|
97
|
|
Net Advisory Fee
|
$3,110
|
|
Portfolio Turnover
|
10%
|
WHAT DID THE FUND INVEST IN? (as of September 30, 2025)
|
Top 10 Issuers
|
(%)
|
|
Caterpillar, Inc.
|
5.9%
|
|
CRH PLC
|
4.8%
|
|
Norfolk Southern Corp.
|
4.7%
|
|
Emerson Electric Co.
|
4.5%
|
|
CSX Corp.
|
4.4%
|
|
United Rentals, Inc.
|
4.4%
|
|
Quanta Services, Inc.
|
4.2%
|
|
Fastenal Co.
|
3.9%
|
|
Union Pacific Corp.
|
3.8%
|
|
Deere & Co.
|
3.8%
|
|
Top Sectors
|
(%)
|
|
Industrials
|
74.3%
|
|
Materials
|
22.4%
|
|
Consumer Discretionary
|
2.4%
|
|
Utilities
|
0.3%
|
|
Energy
|
0.1%
|
|
Technology
|
0.0%
|
|
Cash & Other
|
0.5%
|
WHAT WERE THE FUND COSTS FOR THE PAST YEAR? (based on a hypothetical $10,000 investment)
|
Fund Name
|
Costs of a $10,000 investment
|
Costs paid as a percentage of a $10,000 investment
|
|
Themes US R&D Champions ETF
|
$32
|
0.31%
|
HOW DID THE FUND PERFORM LAST YEAR AND WHAT AFFECTED ITS PERFORMANCE?
The Themes US R&D Champions ETF (USRD) was launched December 13, 2023, seeks to track the Solactive US R&D Champions Index (SOLURDCT), which identifies 50 profitable R&D companies with (1) 3 years of Increasing R&D Spending, (2) 3 years of Positive Return on Equity (ROE), and (3) Positive Profit Margins. USRD seeks to provide investment results that correspond generally to the price and yield performance, before fees and expenses, of the SOLURDCT Index.
U.S. R&D-themed ETFs continue to perform well in 2025 as companies with strong research and development investment maintain a competitive edge and drive long-term growth. Firms ramping up R&D in areas like AI, biotech, and advanced manufacturing are viewed as innovation leaders, supported in part by federal incentives under programs such as the CHIPS and Science Act. U.S. equities more broadly have remained resilient, backed by solid earnings and steady growth in technology and healthcare. However, R&D-focused companies also face challenges, including rising development costs, longer commercialization timelines, and increased competition for technical talent, which can pressure margins and create performance dispersion within the sector.
The top contributor and detractor of USRD’s performance was Lam Research Corp, adding 1.24% to relative returns, while the top detractor was Trade Desk Inc., which reduced performance by 1.82% versus the index for the period ending 9/30/2025.
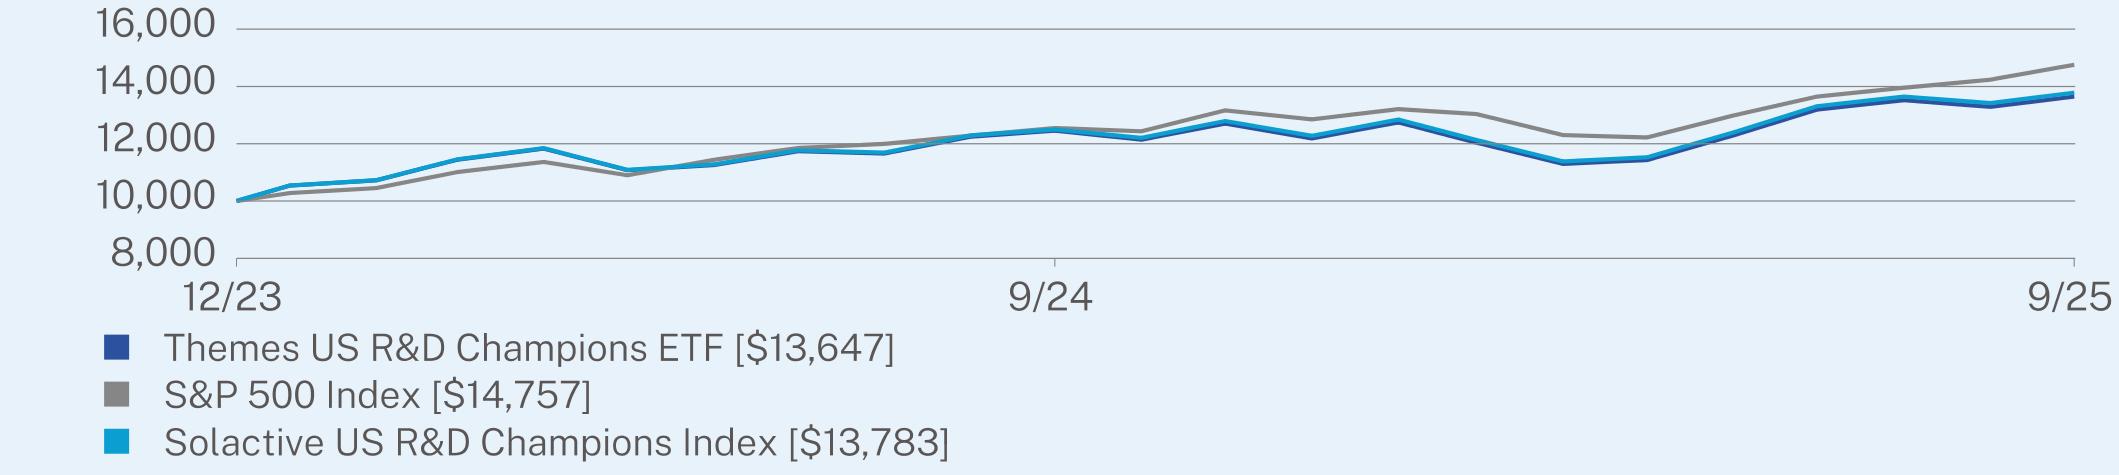
ANNUAL AVERAGE TOTAL RETURN (%)
|
|
1 Year
|
Since Inception
(12/13/2023) |
|
Themes US R&D Champions ETF
|
9.56
|
18.82
|
|
S&P 500 Index
|
17.60
|
24.09
|
|
Solactive US R&D Champions Index
|
10.28
|
19.48
|
Visit www.themesetfs.com/etfs/USRD for more recent performance information.
KEY FUND STATISTICS (as of September 30, 2025)
|
Net Assets
|
$999,738
|
|
Number of Holdings
|
51
|
|
Net Advisory Fee
|
$3,071
|
|
Portfolio Turnover
|
56%
|
WHAT DID THE FUND INVEST IN? (as of September 30, 2025)
|
Top 10 Issuers
|
(%)
|
|
Tesla, Inc.
|
2.8%
|
|
Lam Research Corp.
|
2.8%
|
|
Electronic Arts, Inc.
|
2.6%
|
|
Alphabet, Inc.
|
2.6%
|
|
Apple, Inc.
|
2.4%
|
|
Arista Networks, Inc.
|
2.3%
|
|
Applied Materials, Inc.
|
2.3%
|
|
QUALCOMM, Inc.
|
2.2%
|
|
Broadcom, Inc.
|
2.2%
|
|
Johnson & Johnson
|
2.2%
|
|
Top Sectors
|
(%)
|
|
Technology
|
50.7%
|
|
Health Care
|
17.8%
|
|
Communications
|
10.0%
|
|
Industrials
|
9.6%
|
|
Consumer Discretionary
|
4.7%
|
|
Consumer Staples
|
3.4%
|
|
Materials
|
1.8%
|
|
Real Estate
|
1.8%
|
|
Cash & Other
|
0.2%
|
WHAT WERE THE FUND COSTS FOR THE PAST YEAR? (based on a hypothetical $10,000 investment)
|
Fund Name
|
Costs of a $10,000 investment
|
Costs paid as a percentage of a $10,000 investment
|
|
Themes US Small Cap Cash Flow Champions ETF
|
$31
|
0.30%
|
HOW DID THE FUND PERFORM LAST YEAR AND WHAT AFFECTED ITS PERFORMANCE?
The Themes US Small Cap Cash Flow Champions ETF (SMCF), launched on December 13, 2023, seeks to track the Solactive US Small Cap Cash Flow Champions Index (SOLSUCCT), which identifies the top small capitalization companies with the highest 3 years of positive cash flow yield. SMCF seeks to provide investment results that correspond generally to the price and yield performance, before fees and expenses, of the SOLSUCCT Index.
U.S. small-cap cash-flow ETFs have seen encouraging performance this year as macro conditions lean in favor of agile, cash-generating companies. With the Federal Reserve signaling a pause in rate hikes and borrowing costs stabilizing, small-cap firms that rely on financing to fuel growth are benefiting, supported by steady consumer spending and improving conditions among regional banks. Small caps still faced meaningful headwinds in 2025, including elevated wage costs, lingering supply-chain pressures, and tighter credit standards than those available to larger firms. Their limited pricing power also makes it harder to absorb rising input costs, contributing to periods of volatility.
The top contributor and detractor of SMCF’s performance to the attribution of the underlying included Flex LTD, which contributed by.24% and Williams-Sonoma, which detracted.21% versus the index for the period ending 9/30/2025.
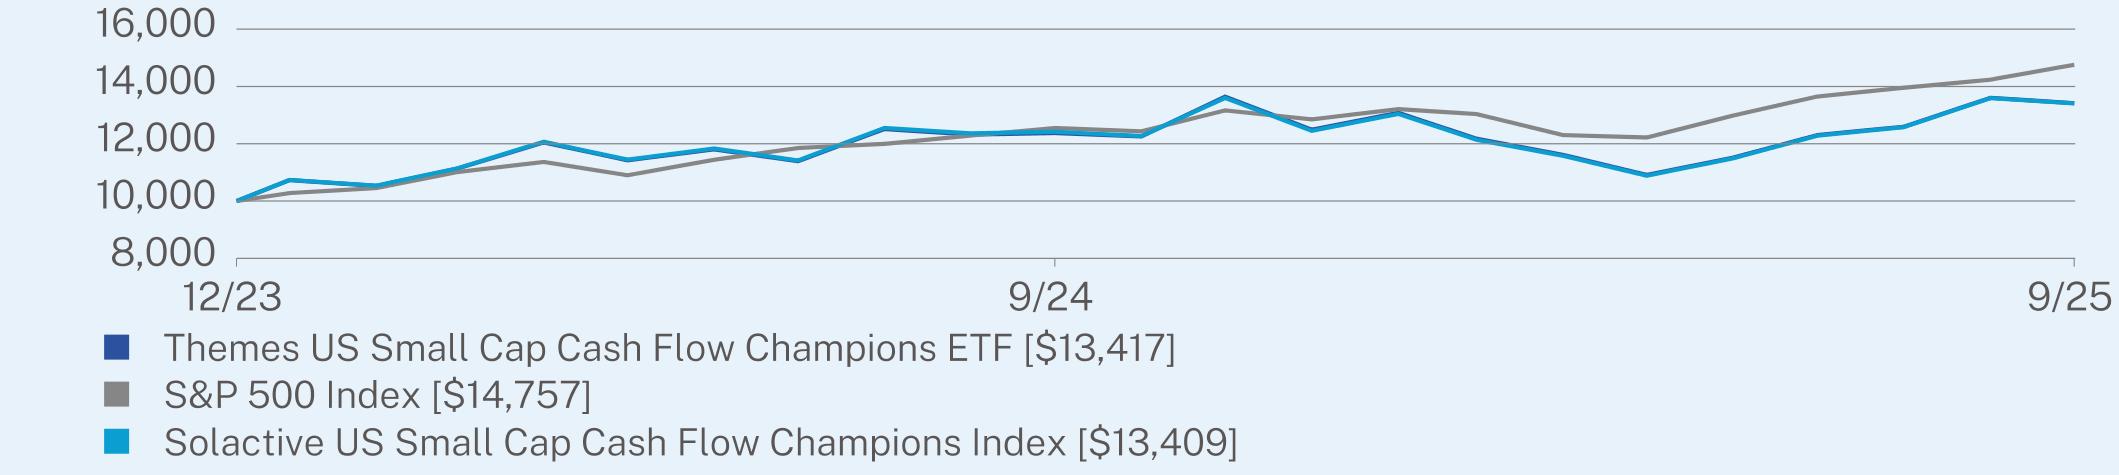
ANNUAL AVERAGE TOTAL RETURN (%)
|
|
1 Year
|
Since Inception
(12/13/2023) |
|
Themes US Small Cap Cash Flow Champions ETF
|
8.43
|
17.71
|
|
S&P 500 Index
|
17.60
|
24.09
|
|
Solactive US Small Cap Cash Flow Champions Index
|
7.97
|
17.67
|
Visit www.themesetfs.com/etfs/SMCF for more recent performance information.
KEY FUND STATISTICS (as of September 30, 2025)
|
Net Assets
|
$4,333,927
|
|
Number of Holdings
|
75
|
|
Net Advisory Fee
|
$10,454
|
|
Portfolio Turnover
|
42%
|
WHAT DID THE FUND INVEST IN? (as of September 30, 2025)
|
Top 10 Issuers
|
(%)
|
|
East West Bancorp, Inc.
|
4.7%
|
|
Toll Brothers, Inc.
|
4.4%
|
|
Builders FirstSource, Inc.
|
4.3%
|
|
Reinsurance Group of America, Inc.
|
4.1%
|
|
Mueller Industries, Inc.
|
3.7%
|
|
Old Republic International Corp.
|
3.3%
|
|
Sterling Infrastructure, Inc.
|
3.2%
|
|
APA Corp.
|
2.8%
|
|
UMB Financial Corp.
|
2.6%
|
|
HF Sinclair Corp.
|
2.6%
|
|
Top Sectors
|
(%)
|
|
Financials
|
48.2%
|
|
Energy
|
17.4%
|
|
Consumer Discretionary
|
13.2%
|
|
Industrials
|
9.9%
|
|
Materials
|
4.6%
|
|
Technology
|
1.8%
|
|
Consumer Staples
|
1.7%
|
|
Health Care
|
1.5%
|
|
Communications
|
1.4%
|
|
Cash & Other
|
0.3%
|
| [1] |
|
||
| [2] |
|
||
| [3] |
|
||
| [4] |
|