www.cassinfo.com | ©2026 Cass Information Systems | Earnings Supplement Second Quarter 2026
www.cassinfo.com | ©2026 Cass Information Systems | Forward-Looking Information All statements other than statements of historical fact included in this presentation, including without limitation the Company’s future prospects and performance, the business strategy and the plans and objectives of the Company's management for future operations, are forward-looking statements within the meaning of the Private Securities Litigation Reform Act of 1995. When used in this release, words such as “estimate,” “could,” “should,” “would,” “likely,” “may,” “will,” “plan,” “intend,” “believes,” “expects,” “anticipates,” “projected,” and variations of these terms and similar expressions. Although the Company believes that the expectations reflected in the forward-looking statements are reasonable, the Company cannot guarantee future results, levels of activity, performance, or achievements. Actual results or business conditions may differ materially from those projected or suggested in forward-looking statements as a result of various factors including, but not limited to, those described below and in Part I, Item 1A, “Risk Factors” of our most recent Annual Report. Actual results could differ materially from those contemplated by the forward-looking statements as a result of certain factors, including but not limited to general economic, market or business conditions unrelated to the Company’s operating performance, including inflation, changes in interest rates, changes in energy prices, supply chain disruptions, financial institution disruptions, geopolitical conflicts, public health emergencies and declines in consumer confidence and discretionary spending; the Company’s ability to compete with its competitors and increase market share; the Company’s ability to maintain compliance with rules and regulations applicable to our business operations and industry; increased regulatory examination scrutiny or new regulatory requirements; whether the Company’s customers continue to utilize its payment processing and related services; unfavorable developments concerning customer credit quality; risk associated with lending concentrations including, but not limited to, faith- based ministries and franchise restaurants; liquidity risk; and risks associated with cyber-attacks and data breaches. Readers are cautioned not to place undue reliance on these forward-looking statements. Any forward-looking statement made by the Company in this release speaks only as of the date of this release. Unless required by law, the Company does not undertake to release publicly any revisions to these forward-looking statements to reflect future events or circumstances or to reflect the occurrence of unanticipated events. If the Company updates one or more forward-looking statements, no inference should be drawn that the Company will make additional updates with respect to those or other forward-looking statements. 2
www.cassinfo.com | ©2026 Cass Information Systems | • Record net income and diluted earnings per share of $10.6 million and $0.81, respectively. • Adjusted net income and adjusted diluted earnings per share from continuing operations of $9.2 million and $0.71, increases of 18.1% and 22.4% compared to 2Q2025. • Increase in net interest margin to 4.00%, compared to 3.78% in 2Q2025 • Increase in transportation dollar volumes of 7.4%, compared to 2Q2025. • Decrease in personnel expense of 2.4%, compared to 2Q2025. • Continued strong asset quality with no loan charge-offs and an allowance for credit losses to loans ratio of 1.30%. In addition, reduced nonperforming loans by $5.3 million, or 76.4%, compared to December 31, 2025. • Received a bad debt recovery of $1.8 million. • Repurchased 65,557 shares of Company stock at a weighted average price of $46.23. Q2 2026 Financial Highlights 3
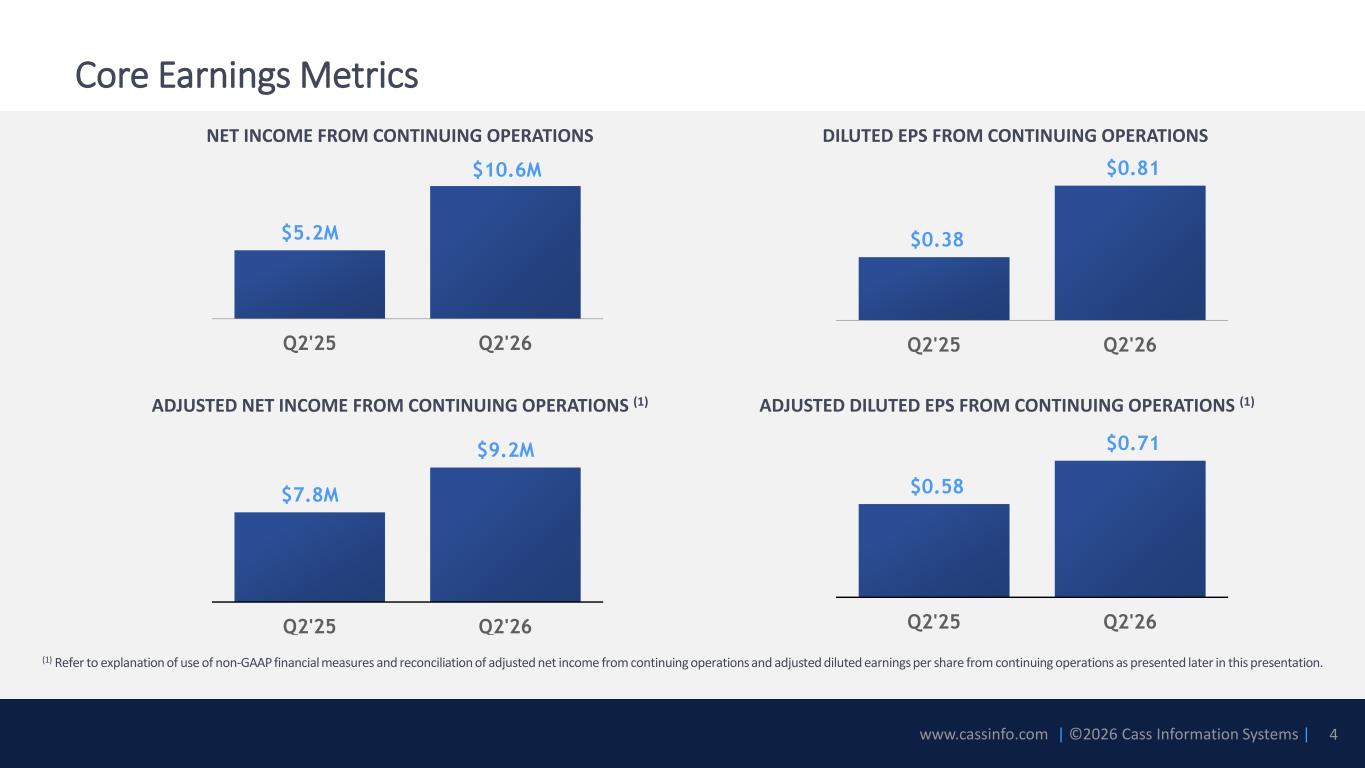
www.cassinfo.com | ©2026 Cass Information Systems | Core Earnings Metrics $7.8M $9.2M Q2'25 Q2'26 $0.58 $0.71 Q2'25 Q2'26 ADJUSTED NET INCOME FROM CONTINUING OPERATIONS (1) ADJUSTED DILUTED EPS FROM CONTINUING OPERATIONS (1) (1) Refer to explanation of use of non-GAAP financial measures and reconciliation of adjusted net income from continuing operations and adjusted diluted earnings per share from continuing operations as presented later in this presentation. $5.2M $10.6M Q2'25 Q2'26 NET INCOME FROM CONTINUING OPERATIONS $0.38 $0.81 Q2'25 Q2'26 DILUTED EPS FROM CONTINUING OPERATIONS 4
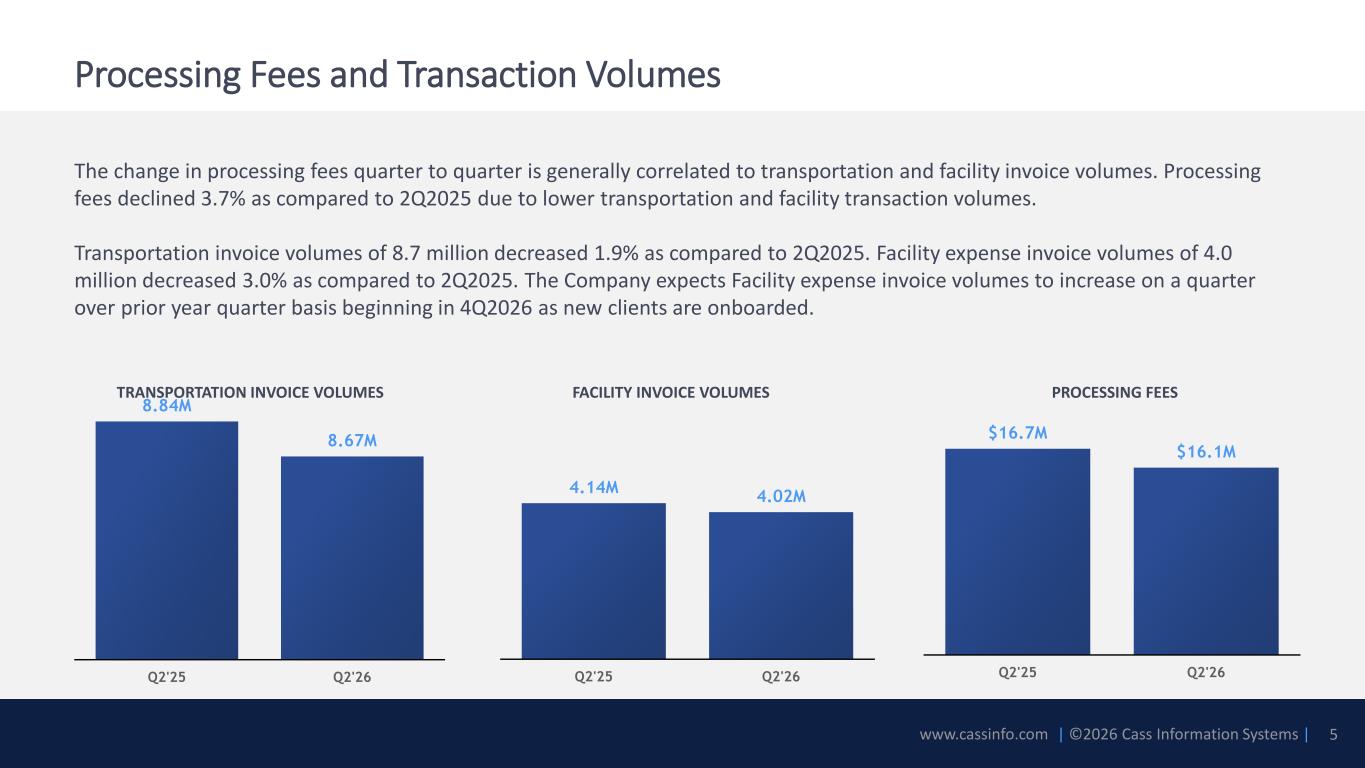
www.cassinfo.com | ©2026 Cass Information Systems | The change in processing fees quarter to quarter is generally correlated to transportation and facility invoice volumes. Processing fees declined 3.7% as compared to 2Q2025 due to lower transportation and facility transaction volumes. Transportation invoice volumes of 8.7 million decreased 1.9% as compared to 2Q2025. Facility expense invoice volumes of 4.0 million decreased 3.0% as compared to 2Q2025. The Company expects Facility expense invoice volumes to increase on a quarter over prior year quarter basis beginning in 4Q2026 as new clients are onboarded. 8.84M 8.67M Q2'25 Q2'26 4.14M 4.02M Q2'25 Q2'26 $16.7M $16.1M Q2'25 Q2'26 Processing Fees and Transaction Volumes TRANSPORTATION INVOICE VOLUMES FACILITY INVOICE VOLUMES PROCESSING FEES 5
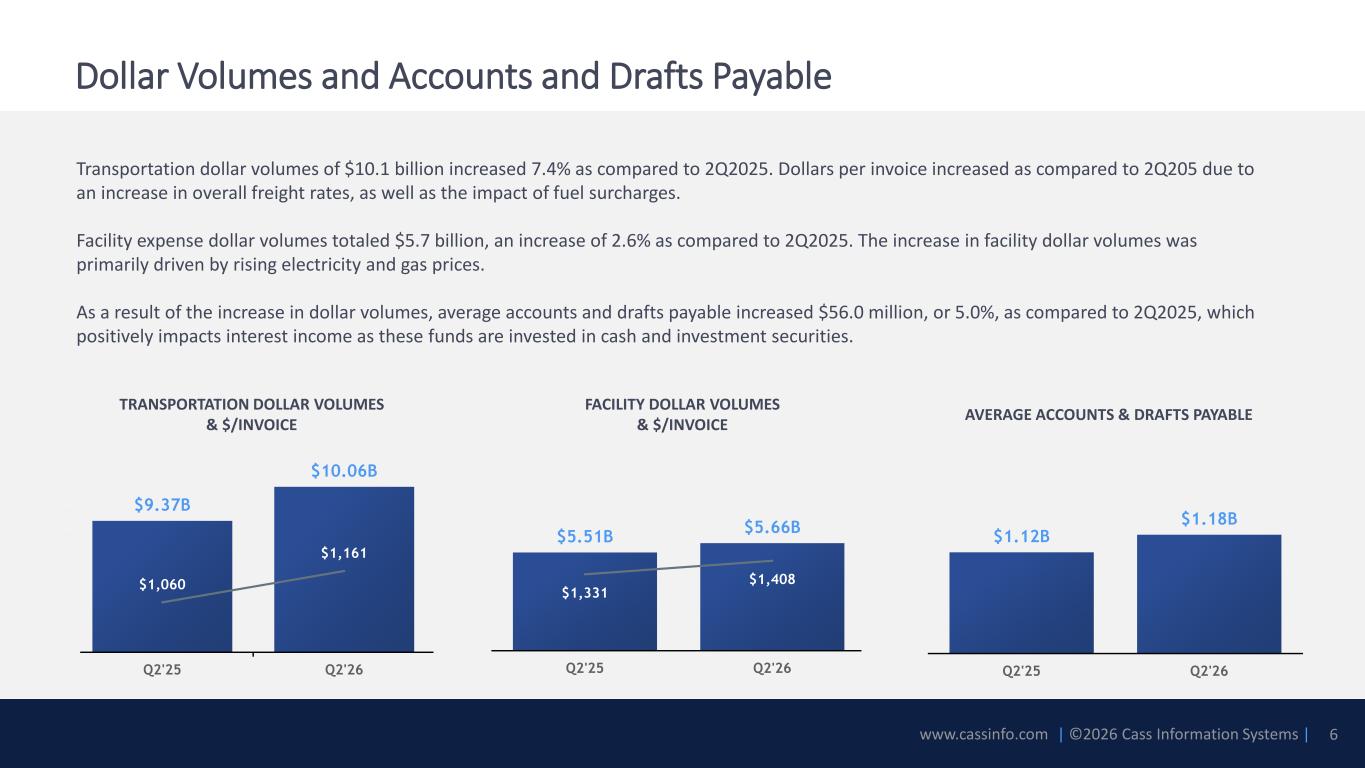
www.cassinfo.com | ©2026 Cass Information Systems | $5.51B $5.66B $1,331 $1,408 900 1100 1300 1500 1700 1900 Q2'25 Q2'26 $9.37B $10.06B $1,060 $1,161 900 1000 1100 1200 1300 1400 1500 6.7E+09 7.2E+09 7.7E+09 8.2E+09 8.7E+09 9.2E+09 9.7E+09 1.02E+10 Q2'25 Q2'26 $1.12B $1.18B Q2'25 Q2'26 Transportation dollar volumes of $10.1 billion increased 7.4% as compared to 2Q2025. Dollars per invoice increased as compared to 2Q205 due to an increase in overall freight rates, as well as the impact of fuel surcharges. Facility expense dollar volumes totaled $5.7 billion, an increase of 2.6% as compared to 2Q2025. The increase in facility dollar volumes was primarily driven by rising electricity and gas prices. As a result of the increase in dollar volumes, average accounts and drafts payable increased $56.0 million, or 5.0%, as compared to 2Q2025, which positively impacts interest income as these funds are invested in cash and investment securities. Dollar Volumes and Accounts and Drafts Payable TRANSPORTATION DOLLAR VOLUMES & $/INVOICE FACILITY DOLLAR VOLUMES & $/INVOICE 6 AVERAGE ACCOUNTS & DRAFTS PAYABLE
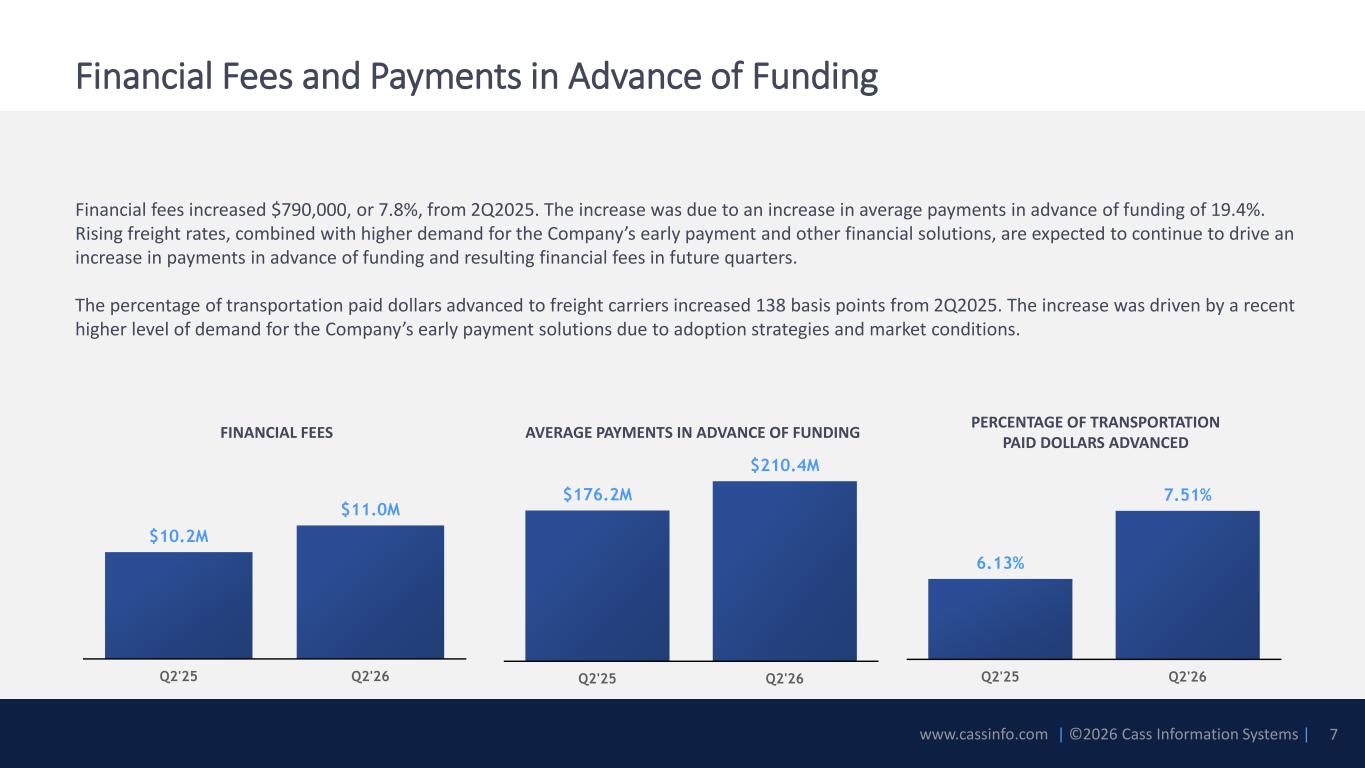
www.cassinfo.com | ©2026 Cass Information Systems | Financial Fees and Payments in Advance of Funding Financial fees increased $790,000, or 7.8%, from 2Q2025. The increase was due to an increase in average payments in advance of funding of 19.4%. Rising freight rates, combined with higher demand for the Company’s early payment and other financial solutions, are expected to continue to drive an increase in payments in advance of funding and resulting financial fees in future quarters. The percentage of transportation paid dollars advanced to freight carriers increased 138 basis points from 2Q2025. The increase was driven by a recent higher level of demand for the Company’s early payment solutions due to adoption strategies and market conditions. $176.2M $210.4M Q2'25 Q2'26 $10.2M $11.0M Q2'25 Q2'26 AVERAGE PAYMENTS IN ADVANCE OF FUNDINGFINANCIAL FEES 7 6.13% 7.51% Q2'25 Q2'26 PERCENTAGE OF TRANSPORTATION PAID DOLLARS ADVANCED
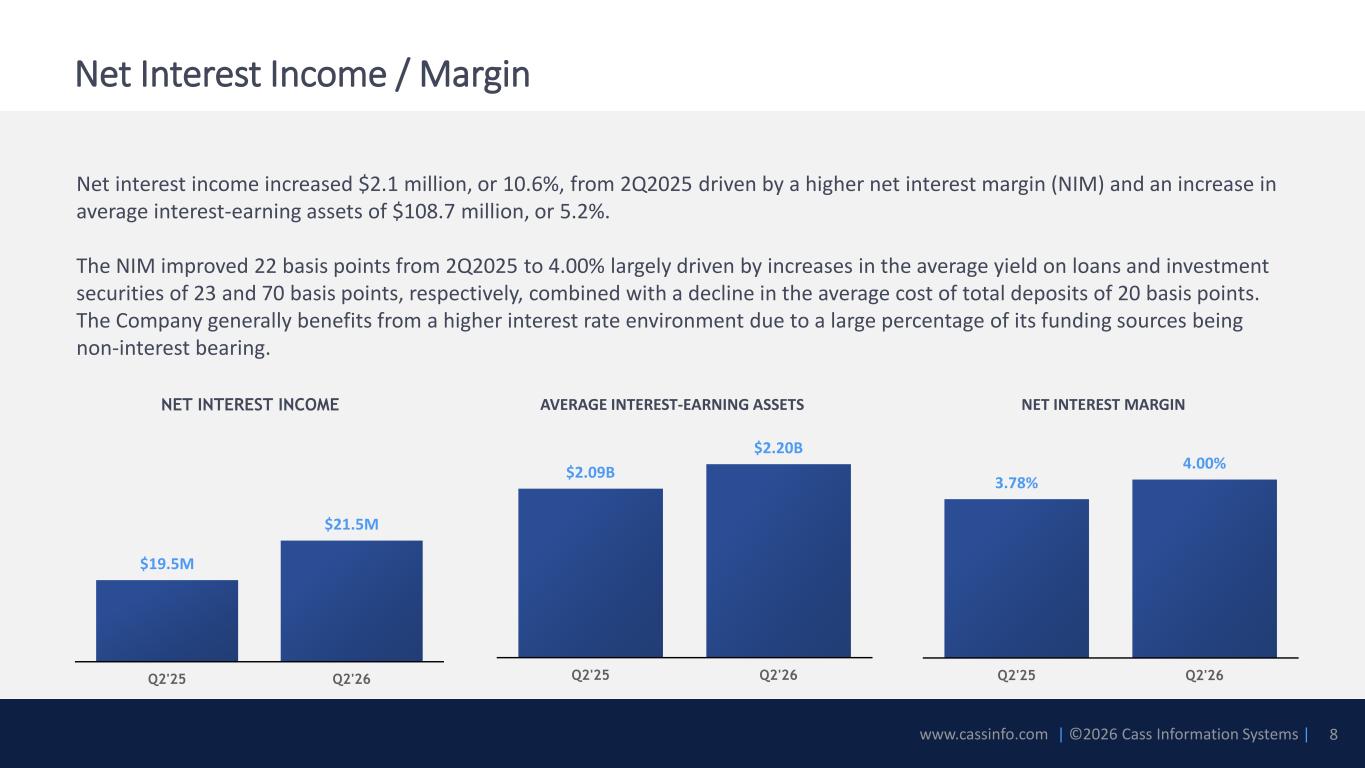
www.cassinfo.com | ©2026 Cass Information Systems | Net interest income increased $2.1 million, or 10.6%, from 2Q2025 driven by a higher net interest margin (NIM) and an increase in average interest-earning assets of $108.7 million, or 5.2%. The NIM improved 22 basis points from 2Q2025 to 4.00% largely driven by increases in the average yield on loans and investment securities of 23 and 70 basis points, respectively, combined with a decline in the average cost of total deposits of 20 basis points. The Company generally benefits from a higher interest rate environment due to a large percentage of its funding sources being non-interest bearing. Net Interest Income / Margin NET INTEREST INCOME AVERAGE INTEREST-EARNING ASSETS NET INTEREST MARGIN $19.5M $21.5M Q2'25 Q2'26 $2.09B $2.20B Q2'25 Q2'26 3.78% 4.00% Q2'25 Q2'26 8
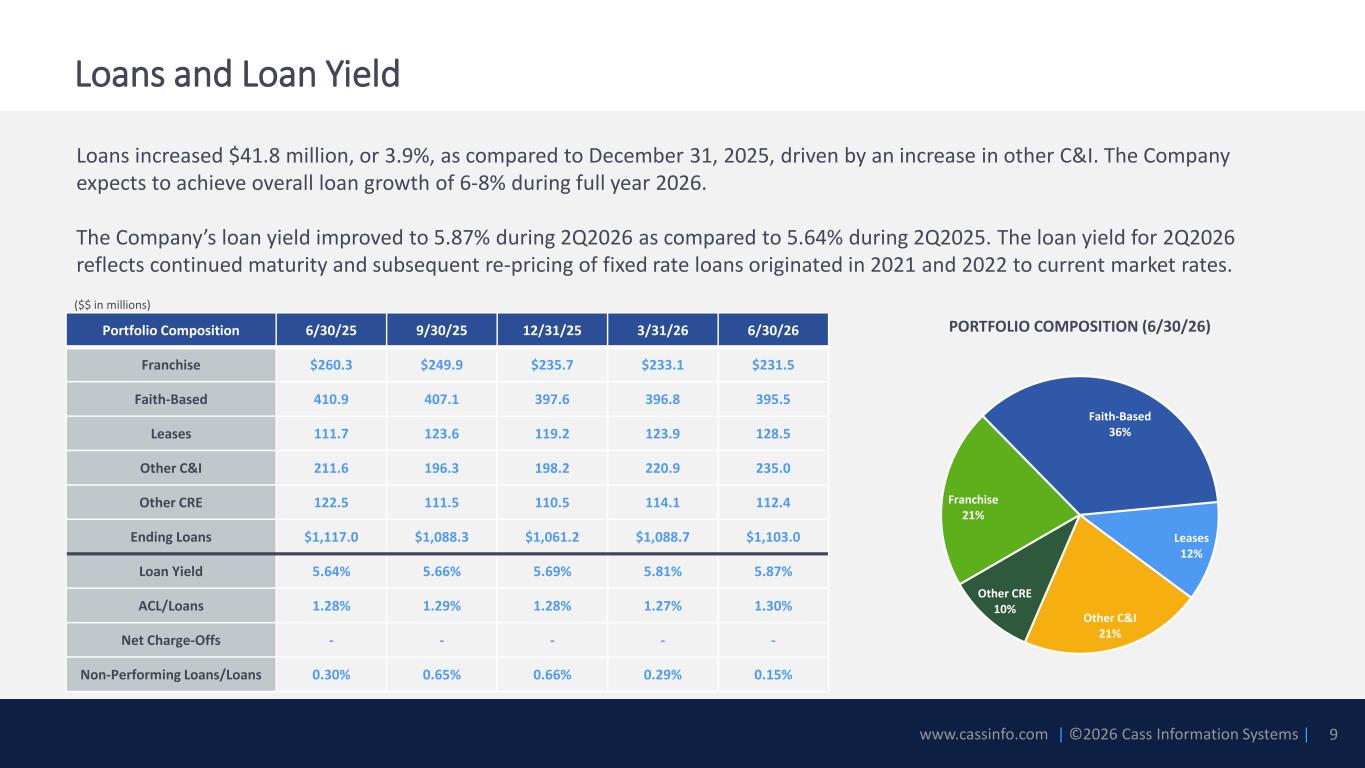
www.cassinfo.com | ©2026 Cass Information Systems | Loans increased $41.8 million, or 3.9%, as compared to December 31, 2025, driven by an increase in other C&I. The Company expects to achieve overall loan growth of 6-8% during full year 2026. The Company’s loan yield improved to 5.87% during 2Q2026 as compared to 5.64% during 2Q2025. The loan yield for 2Q2026 reflects continued maturity and subsequent re-pricing of fixed rate loans originated in 2021 and 2022 to current market rates. Loans and Loan Yield 9 Portfolio Composition 6/30/25 9/30/25 12/31/25 3/31/26 6/30/26 Franchise $260.3 $249.9 $235.7 $233.1 $231.5 Faith-Based 410.9 407.1 397.6 396.8 395.5 Leases 111.7 123.6 119.2 123.9 128.5 Other C&I 211.6 196.3 198.2 220.9 235.0 Other CRE 122.5 111.5 110.5 114.1 112.4 Ending Loans $1,117.0 $1,088.3 $1,061.2 $1,088.7 $1,103.0 Loan Yield 5.64% 5.66% 5.69% 5.81% 5.87% ACL/Loans 1.28% 1.29% 1.28% 1.27% 1.30% Net Charge-Offs - - - - - Non-Performing Loans/Loans 0.30% 0.65% 0.66% 0.29% 0.15% Franchise 21% Faith-Based 36% Leases 12% Other C&I 21% Other CRE 10% PORTFOLIO COMPOSITION (6/30/26) ($$ in millions)
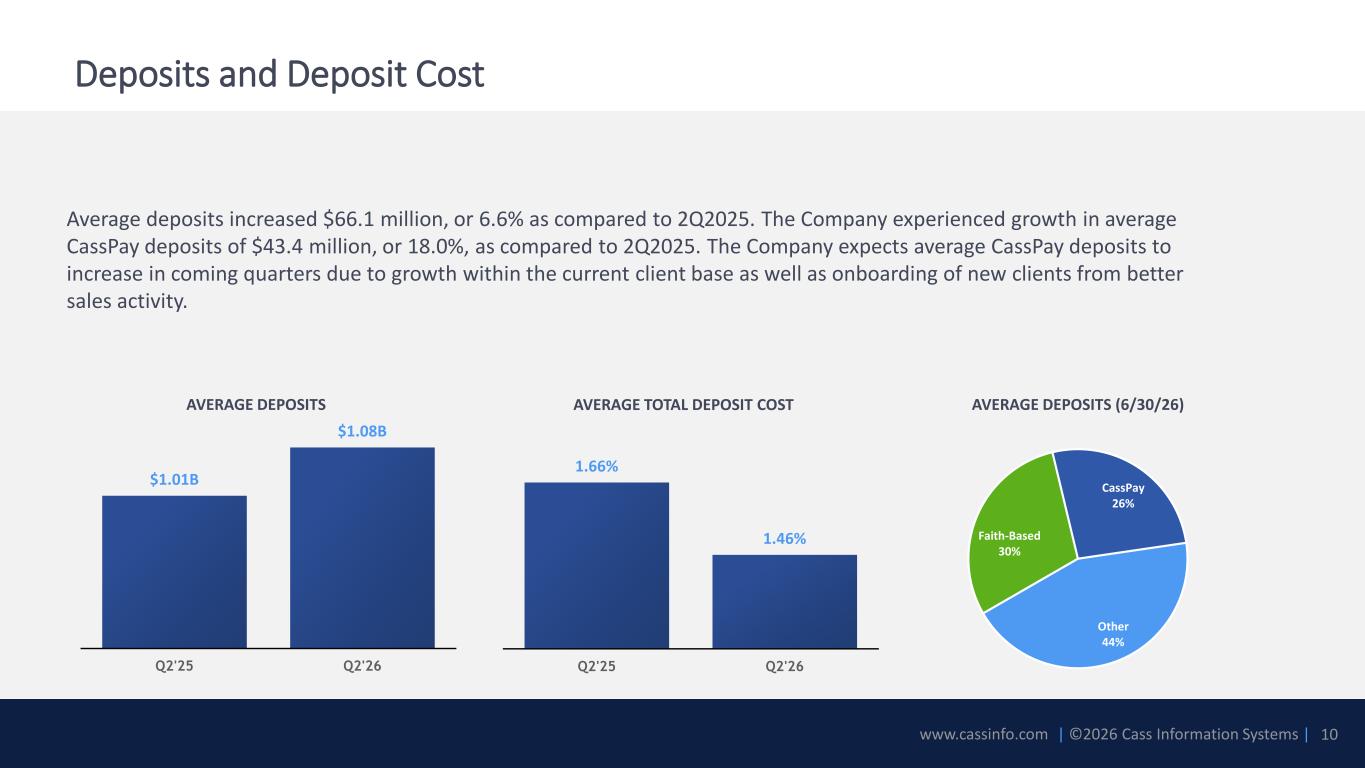
www.cassinfo.com | ©2026 Cass Information Systems | Average deposits increased $66.1 million, or 6.6% as compared to 2Q2025. The Company experienced growth in average CassPay deposits of $43.4 million, or 18.0%, as compared to 2Q2025. The Company expects average CassPay deposits to increase in coming quarters due to growth within the current client base as well as onboarding of new clients from better sales activity. Deposits and Deposit Cost 10 AVERAGE DEPOSITS AVERAGE TOTAL DEPOSIT COST $1.01B $1.08B Q2'25 Q2'26 1.66% 1.46% Q2'25 Q2'26 AVERAGE DEPOSITS (6/30/26) Faith-Based 30% CassPay 26% Other 44%
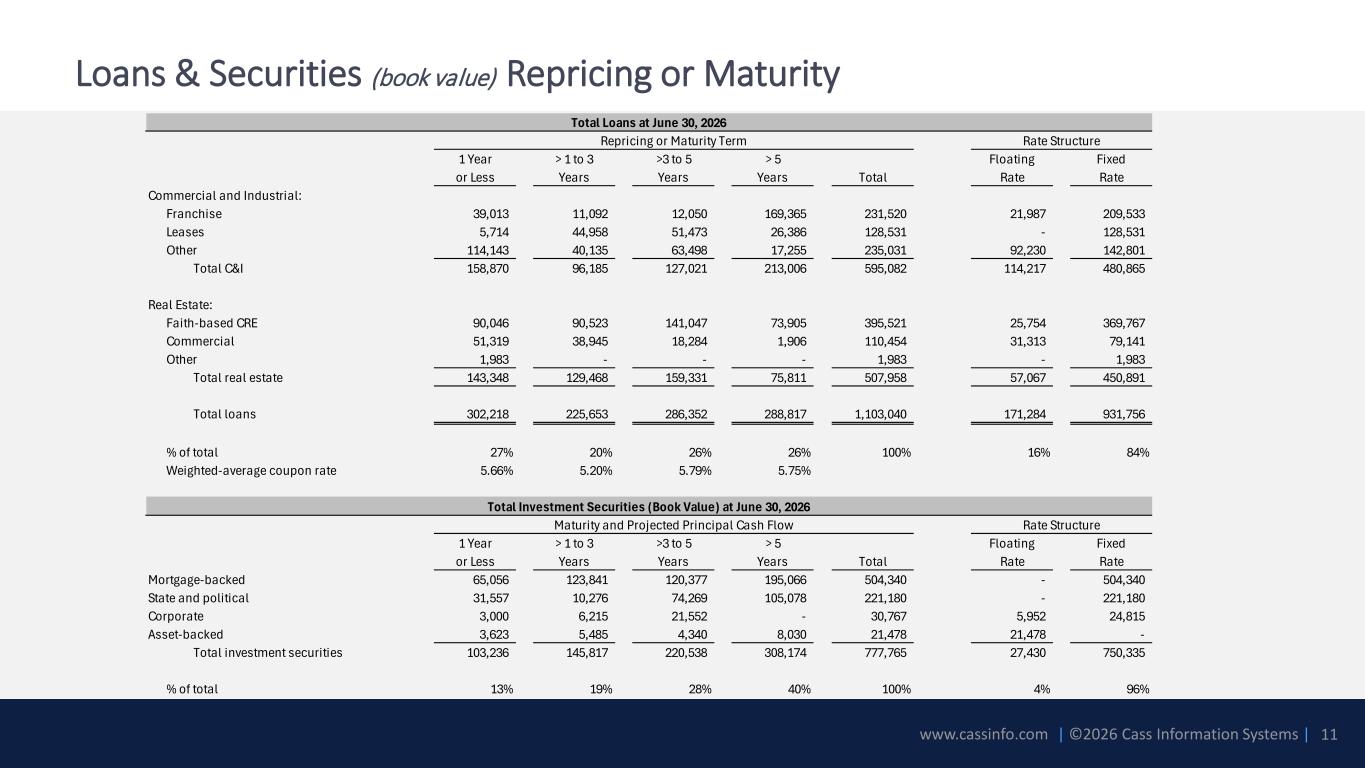
www.cassinfo.com | ©2026 Cass Information Systems | Loans & Securities (book value) Repricing or Maturity 11 1 Year > 1 to 3 >3 to 5 > 5 Floating Fixed or Less Years Years Years Total Rate Rate Commercial and Industrial: Franchise 39,013 11,092 12,050 169,365 231,520 21,987 209,533 Leases 5,714 44,958 51,473 26,386 128,531 - 128,531 Other 114,143 40,135 63,498 17,255 235,031 92,230 142,801 Total C&I 158,870 96,185 127,021 213,006 595,082 114,217 480,865 Real Estate: Faith-based CRE 90,046 90,523 141,047 73,905 395,521 25,754 369,767 Commercial 51,319 38,945 18,284 1,906 110,454 31,313 79,141 Other 1,983 - - - 1,983 - 1,983 Total real estate 143,348 129,468 159,331 75,811 507,958 57,067 450,891 Total loans 302,218 225,653 286,352 288,817 1,103,040 171,284 931,756 % of total 27% 20% 26% 26% 100% 16% 84% Weighted-average coupon rate 5.66% 5.20% 5.79% 5.75% 1 Year > 1 to 3 >3 to 5 > 5 Floating Fixed or Less Years Years Years Total Rate Rate Mortgage-backed 65,056 123,841 120,377 195,066 504,340 - 504,340 State and political 31,557 10,276 74,269 105,078 221,180 - 221,180 Corporate 3,000 6,215 21,552 - 30,767 5,952 24,815 Asset-backed 3,623 5,485 4,340 8,030 21,478 21,478 - Total investment securities 103,236 145,817 220,538 308,174 777,765 27,430 750,335 % of total 13% 19% 28% 40% 100% 4% 96% Total Loans at June 30, 2026 Repricing or Maturity Term Rate Structure Total Investment Securities (Book Value) at June 30, 2026 Maturity and Projected Principal Cash Flow Rate Structure
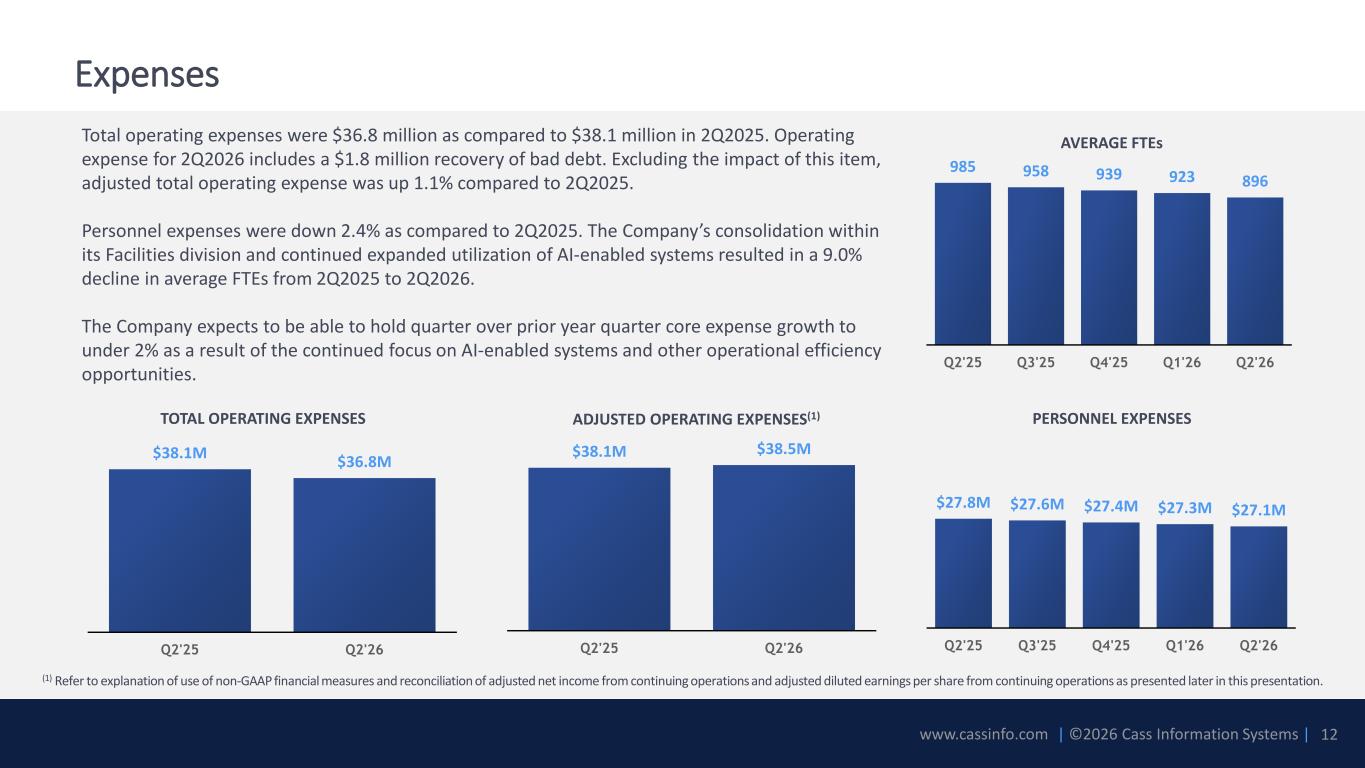
www.cassinfo.com | ©2026 Cass Information Systems | $27.8M $27.6M $27.4M $27.3M $27.1M Q2'25 Q3'25 Q4'25 Q1'26 Q2'26 $38.1M $36.8M Q2'25 Q2'26 $38.1M $38.5M Q2'25 Q2'26 Total operating expenses were $36.8 million as compared to $38.1 million in 2Q2025. Operating expense for 2Q2026 includes a $1.8 million recovery of bad debt. Excluding the impact of this item, adjusted total operating expense was up 1.1% compared to 2Q2025. Personnel expenses were down 2.4% as compared to 2Q2025. The Company’s consolidation within its Facilities division and continued expanded utilization of AI-enabled systems resulted in a 9.0% decline in average FTEs from 2Q2025 to 2Q2026. The Company expects to be able to hold quarter over prior year quarter core expense growth to under 2% as a result of the continued focus on AI-enabled systems and other operational efficiency opportunities. Expenses PERSONNEL EXPENSES 12 ADJUSTED OPERATING EXPENSES(1)TOTAL OPERATING EXPENSES (1) Refer to explanation of use of non-GAAP financial measures and reconciliation of adjusted net income from continuing operations and adjusted diluted earnings per share from continuing operations as presented later in this presentation. AVERAGE FTEs 985 958 939 923 896 Q2'25 Q3'25 Q4'25 Q1'26 Q2'26
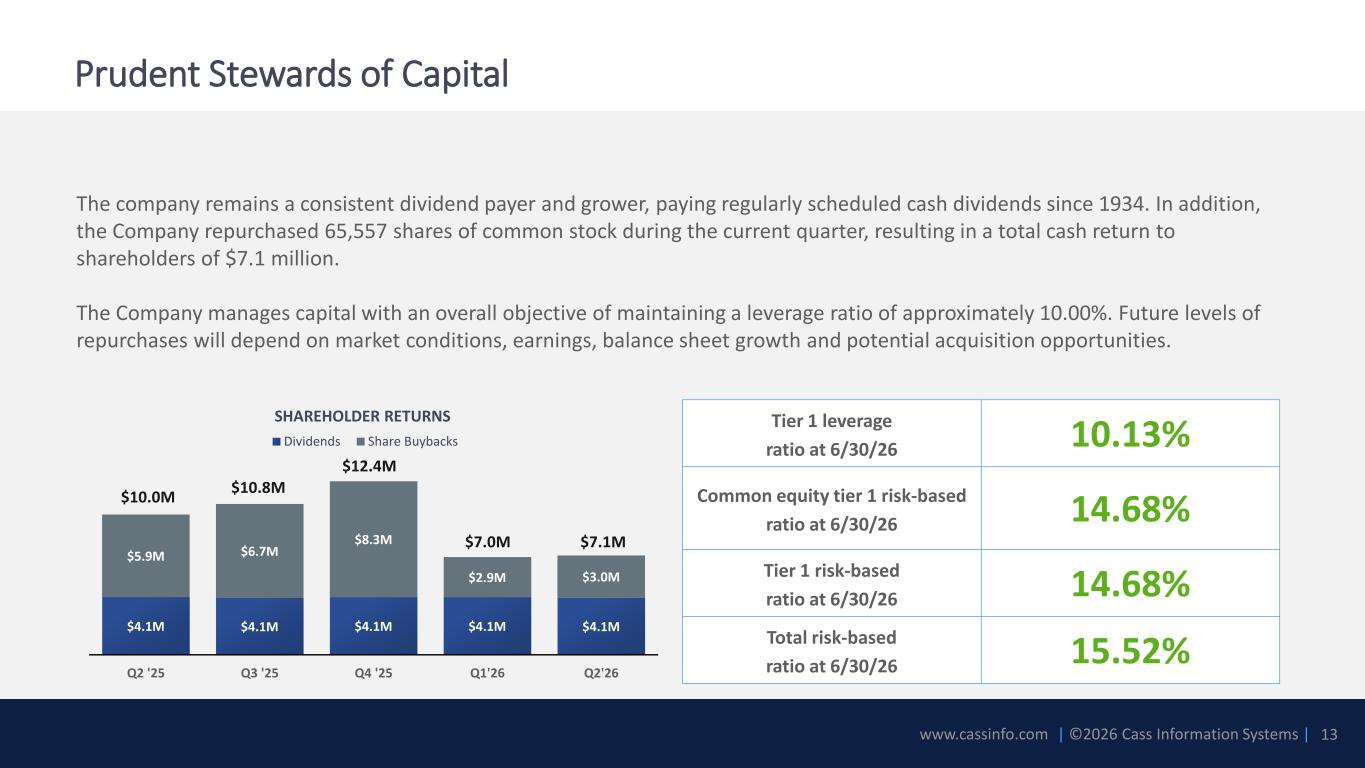
www.cassinfo.com | ©2026 Cass Information Systems | The company remains a consistent dividend payer and grower, paying regularly scheduled cash dividends since 1934. In addition, the Company repurchased 65,557 shares of common stock during the current quarter, resulting in a total cash return to shareholders of $7.1 million. The Company manages capital with an overall objective of maintaining a leverage ratio of approximately 10.00%. Future levels of repurchases will depend on market conditions, earnings, balance sheet growth and potential acquisition opportunities. Prudent Stewards of Capital SHAREHOLDER RETURNS 13 $4.1M $4.1M $4.1M $4.1M $4.1M $5.9M $6.7M $8.3M $2.9M $3.0M Q2 '25 Q3 '25 Q4 '25 Q1'26 Q2'26 Dividends Share Buybacks Tier 1 leverage ratio at 6/30/26 10.13% Common equity tier 1 risk-based ratio at 6/30/26 14.68% Tier 1 risk-based ratio at 6/30/26 14.68% Total risk-based ratio at 6/30/26 15.52% $12.4M $10.8M$10.0M $7.1M$7.0M
www.cassinfo.com | ©2026 Cass Information Systems | Compelling Opportunities for Future Earnings Growth and Value Creation Driving efficiency and improved results in data ingestion and client relations functions through AI. Net interest income and margin growth as fixed rate interest-earning assets reprice in higher interest rate environment. Net interest income growth as a result of the impact of higher contract freight rates and fuel surcharges in Transportation and higher overall energy prices in Facilities. Non-interest bearing deposit and related net interest income growth as a result of recent sales activity and growth within CassPay client base. Development of full product suite in Transportation with respect to freight audit and payment and supply chain finance provides a competitive advantage. Highly efficient Bank with growth opportunities in all niche business lines Strong capital levels support growth initiatives and/or return to shareholders 14

www.cassinfo.com | ©2026 Cass Information Systems | Appendix 15
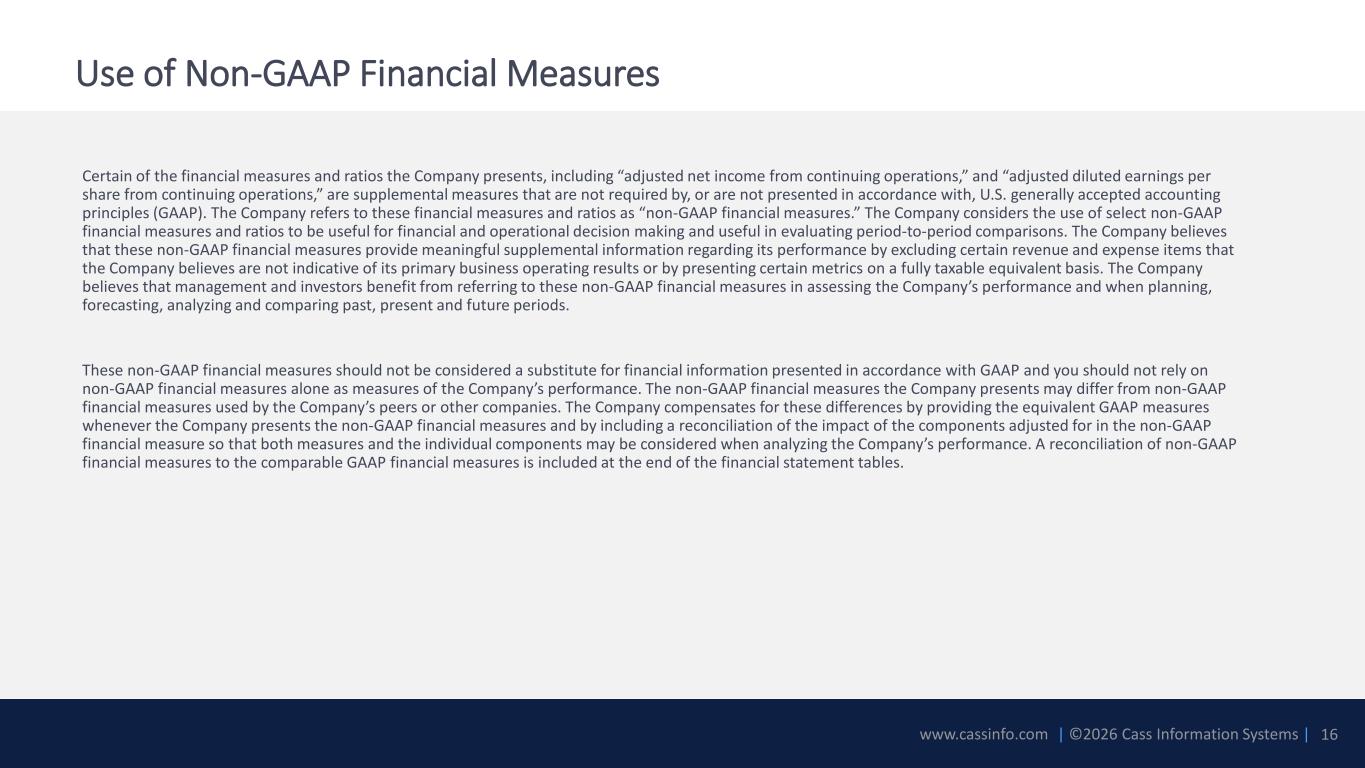
www.cassinfo.com | ©2026 Cass Information Systems | Use of Non-GAAP Financial Measures Certain of the financial measures and ratios the Company presents, including “adjusted net income from continuing operations,” and “adjusted diluted earnings per share from continuing operations,” are supplemental measures that are not required by, or are not presented in accordance with, U.S. generally accepted accounting principles (GAAP). The Company refers to these financial measures and ratios as “non-GAAP financial measures.” The Company considers the use of select non-GAAP financial measures and ratios to be useful for financial and operational decision making and useful in evaluating period-to-period comparisons. The Company believes that these non-GAAP financial measures provide meaningful supplemental information regarding its performance by excluding certain revenue and expense items that the Company believes are not indicative of its primary business operating results or by presenting certain metrics on a fully taxable equivalent basis. The Company believes that management and investors benefit from referring to these non-GAAP financial measures in assessing the Company’s performance and when planning, forecasting, analyzing and comparing past, present and future periods. These non-GAAP financial measures should not be considered a substitute for financial information presented in accordance with GAAP and you should not rely on non-GAAP financial measures alone as measures of the Company’s performance. The non-GAAP financial measures the Company presents may differ from non-GAAP financial measures used by the Company’s peers or other companies. The Company compensates for these differences by providing the equivalent GAAP measures whenever the Company presents the non-GAAP financial measures and by including a reconciliation of the impact of the components adjusted for in the non-GAAP financial measure so that both measures and the individual components may be considered when analyzing the Company’s performance. A reconciliation of non-GAAP financial measures to the comparable GAAP financial measures is included at the end of the financial statement tables. 16
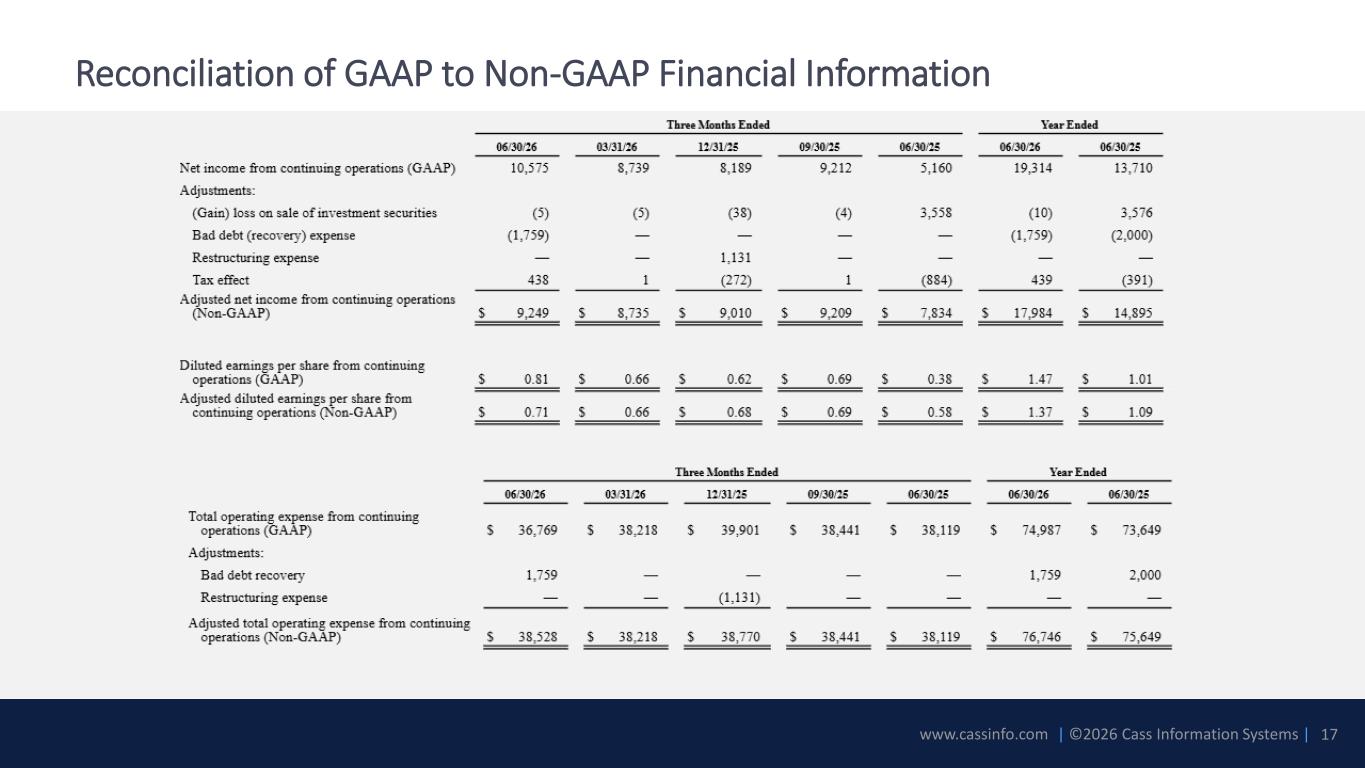
www.cassinfo.com | ©2026 Cass Information Systems | Reconciliation of GAAP to Non-GAAP Financial Information 17