Forward Looking Statements Forward Looking Statements Certain information contained in this Presentation (together with oral statements made in connection herewith, this “Presentation”) may include “forward-looking statements” within the meaning of the “safe harbor” provisions of the United States Private Securities Litigation Reform Act of 1995. These forward-looking statements relate to future operations of Eagle Financial Services, Inc. (the “Company,” “we,” “us,” or “our”) and are generally identified by the use of words such as “estimate,” “plan,” “project,” “forecast,” “intend,” “will,” “expect,” “believe,” “seek,” “anticipate,” “target,” or other similar expressions that predict or indicate future events or trends or that are not statements of historical matters. These forward-looking statements include, but are not limited to, statements regarding estimates and forecasts of operating and financial measures or metrics and projections of growth, the results of the proposed balance sheet restructuring, market opportunity and market share. Although the Company believes that its expectations with respect to the forward-looking statements are based upon reliable assumptions within the bounds of its knowledge of its business and operations, there can be no assurance that actual results, performance or achievements of the Company will not differ materially from any future results, performance or achievements expressed or implied by such forward-looking statements. These forward-looking statements are not intended to serve forward-looking must not be relied on by any prospective or current investor as, a guarantee, an assurance, a prediction or a definitive statement of fact or probability. Actual events and circumstances are difficult or impossible to predict, are beyond the control of the Company and will differ from assumptions. These forward-looking statements are subject to forward-looking risks and uncertainties. Factors that could have a material adverse effect on the operations and forward-looking of the Company forward-looking are not limited to those factors identified in the Company’s Annual Report on Form 10-K for the year ended December 31, 2025, subsequent quarterly reports on Form 10-Q, other filings with the U.S. Securities and Exchange Commission (the “SEC”) and the prospectus supplement and accompanying base prospectus. If any of these risks or uncertainties materialize or our assumptions prove incorrect, actual results could differ materially from the results implied by these forward-looking statements. There may be additional risks that the Company is not aware of or that the Company currently believes are immaterial that could also cause actual results to differ from those contained in the forward-looking statements. In addition, forward-looking statements reflect the Company’s expectations, plans or forecasts of future events and views as of the date of this Presentation. The Company anticipates that subsequent events and developments may cause its assessments to change; however, the Company has no obligation to update these forward-looking statements, unless required by law. Accordingly, you are cautioned not to place undue reliance upon any such forward-looking statements in this Presentation when deciding whether to make any investment in the Company. Any forward-looking statements in this Presentation speak only as of the date on which it is made and the Company undertakes no obligation to update or revise any forward-looking statements to reflect events or circumstances after the date on which the statement is made or to reflect the occurrence of unanticipated events, except as required by law. Although all information included in this Presentation was obtained from sources believed to be reliable and in good faith, no representation or warranty, express or implied, is made as to its accuracy or completeness. This Presentation contains preliminary information only, is subject to change at any time and is not, and should not be assumed to be, complete or to constitute all the information necessary to adequately make an informed decision regarding your investment in the Company. All forward-looking statements, express or implied, herein are qualified in their entirety by this cautionary statement. Use of Unaudited Pro Forma and Non-GAAP Financial Measures Annualized, pro forma, projected, and estimated financial information included in this Presentation are used for illustrative purposes only, are not forecasts and may not necessarily reflect actual financial results the Company may achieve. This Presentation includes certain non-GAAP measures, which provide meaningful supplemental information regarding the Company’s operational performance and to enhance investors’ overall understanding of such financial performance. These non-GAAP measures are provided in addition to, and not as substitutes for, measures of our financial performance determined in accordance with GAAP. Our calculation of these non-GAAP measures may not be comparable to similarly titled measures of other companies due to potential differences between companies in the method of calculation. As a result, the use of these non-GAAP measures has limitations and should not be considered superior to, in isolation from, or as a substitute for, related non-GAAP measures. Reconciliation of these non-GAAP financial measures to the most directly comparable GAAP financial measures can be found at the end of this Presentation. Preliminary Financial Information as of June 30, 2026 Numbers contained in this Presentation as of and for the three-month period ended March 31, 2026, are preliminary and unaudited, and remain subject to further review, change and finalization. Such reviews and subsequent information could result in material changes in accounting estimates and other financial information, particularly with respect to material estimates and assumptions used in preparing this preliminary information. As of the date of this Presentation, our independent registered public accounting form, Yount, Hyde & Barbour, P.C., has not completed its review procedures with respect to this preliminary financial information. Industry and Market Data This Presentation includes statistical and other industry and market data that we obtained from government reports and other third-party sources. Our internal data, estimates and forecasts are based on information obtained from government reports, trade and business organizations and other contacts in the markets in which we operate and our management’s understanding of industry conditions. Although we believe that this information (including the industry publications and third-party research, surveys and studies) is accurate and reliable, we have not independently verified such information, and no representations or warranties are made by us of our affiliates as to the accuracy of any such statements or projections. In addition, estimates, forecasts, and assumptions are necessarily subject to a high degree of uncertainty and risk due to a variety of factors. Forward-looking information obtained from these sources is subject to the same qualifications and the additional uncertainties regarding the other forward-looking statements in this Presentation. These and other factors could cause our results to differ materially from those expressed in our estimates and beliefs and in the estimates prepared by independent parties. Trademarks and Trade Names The Company owns or has rights to various trademarks, service marks and trade names that it uses in connection with the operation of its business. Solely for convenience, the trademarks, service marks and trade names referred to in this Presentation may appear without the ®, TM or SM symbols, but such references are not intended to indicate, in any way, that the Company will not assert, to the fullest extent under applicable law, its rights to these trademarks, service marks and trade names under applicable law. Other service marks, trademarks and trade names referred to in this Presentation, if any, are the property of their respective owners.
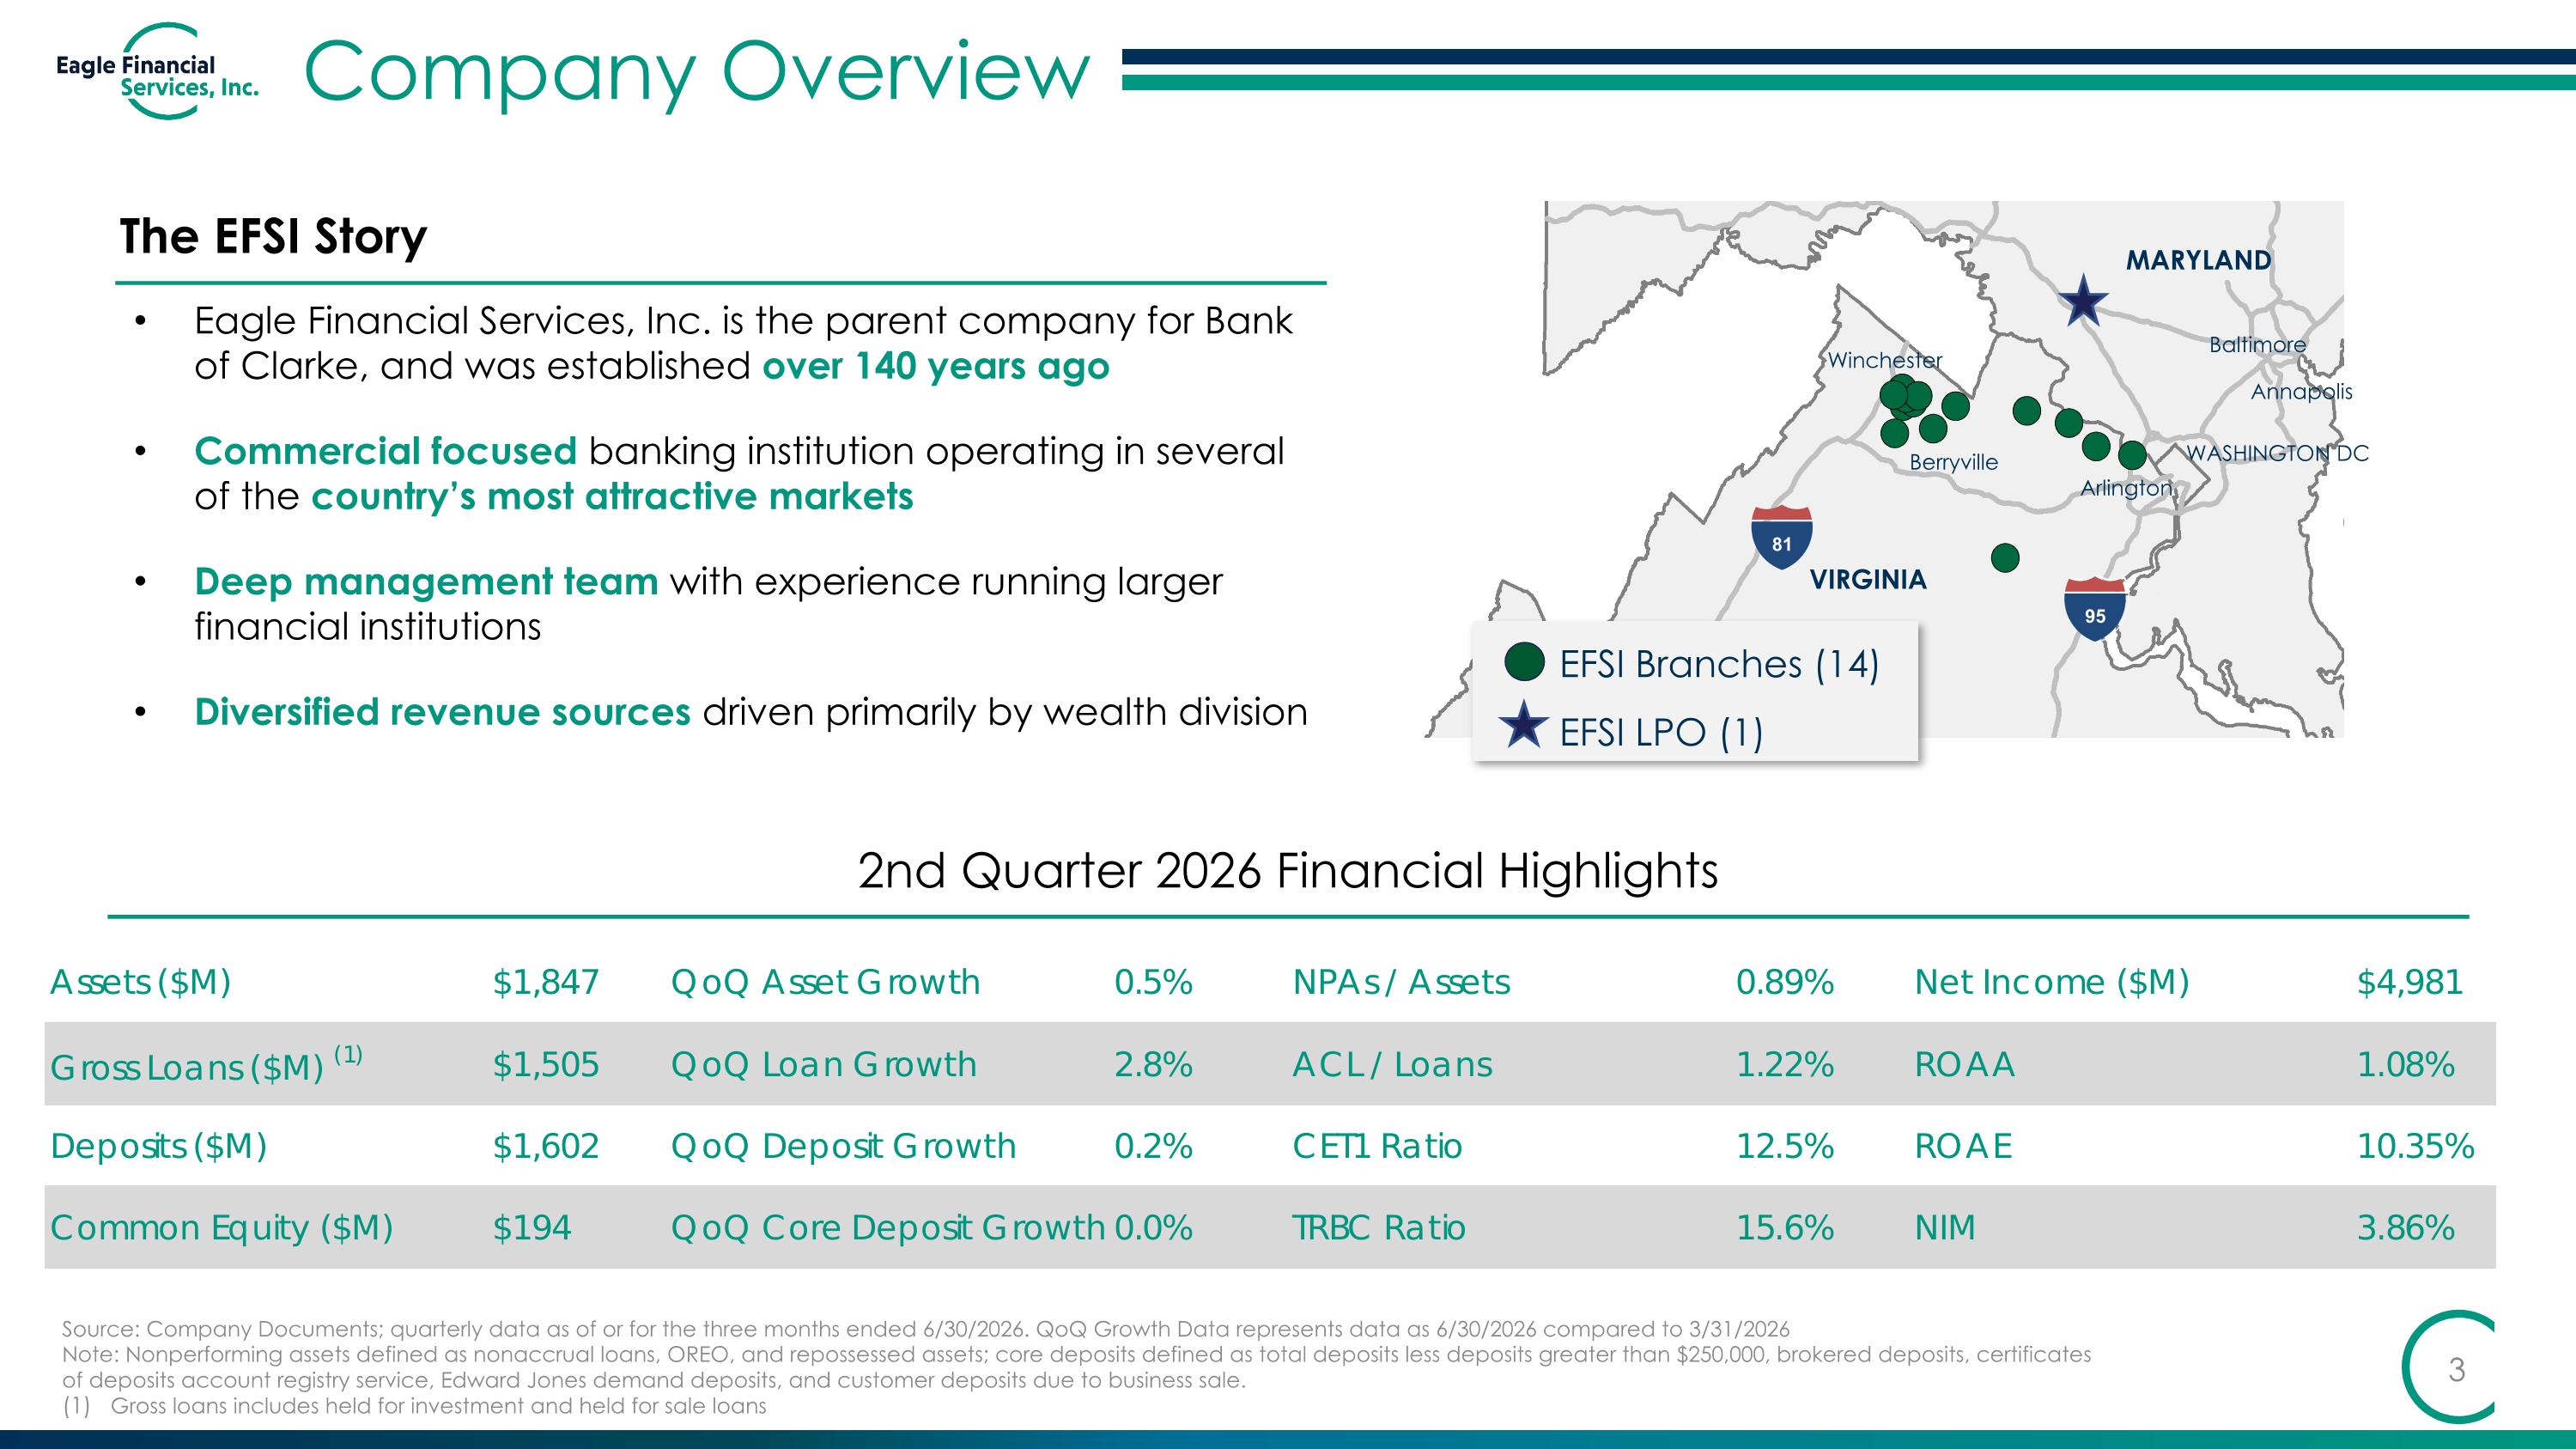
Company Overview The EFSI Story 2nd Quarter 2026 Financial Highlights WASHINGTON DC Arlington Annapolis Baltimore MARYLAND 95 81 EFSI Branches (14) EFSI LPO (1) VIRGINIA Berryville Winchester Eagle Financial Services, Inc. is the parent company for Bank of Clarke, and was established over 140 years ago Commercial focused banking institution operating in several of the country’s most attractive markets Deep management team with experience running larger financial institutions Diversified revenue sources driven primarily by wealth division Source: Company Documents; quarterly data as of or for the three months ended 6/30/2026. QoQ Growth Data represents data as 6/30/2026 compared to 3/31/2026 Note: Nonperforming assets defined as nonaccrual loans, OREO, and repossessed assets; core deposits defined as total deposits less deposits greater than $250,000, brokered deposits, certificates of deposits account registry service, Edward Jones demand deposits, and customer deposits due to business sale. Gross loans includes held for investment and held for sale loans
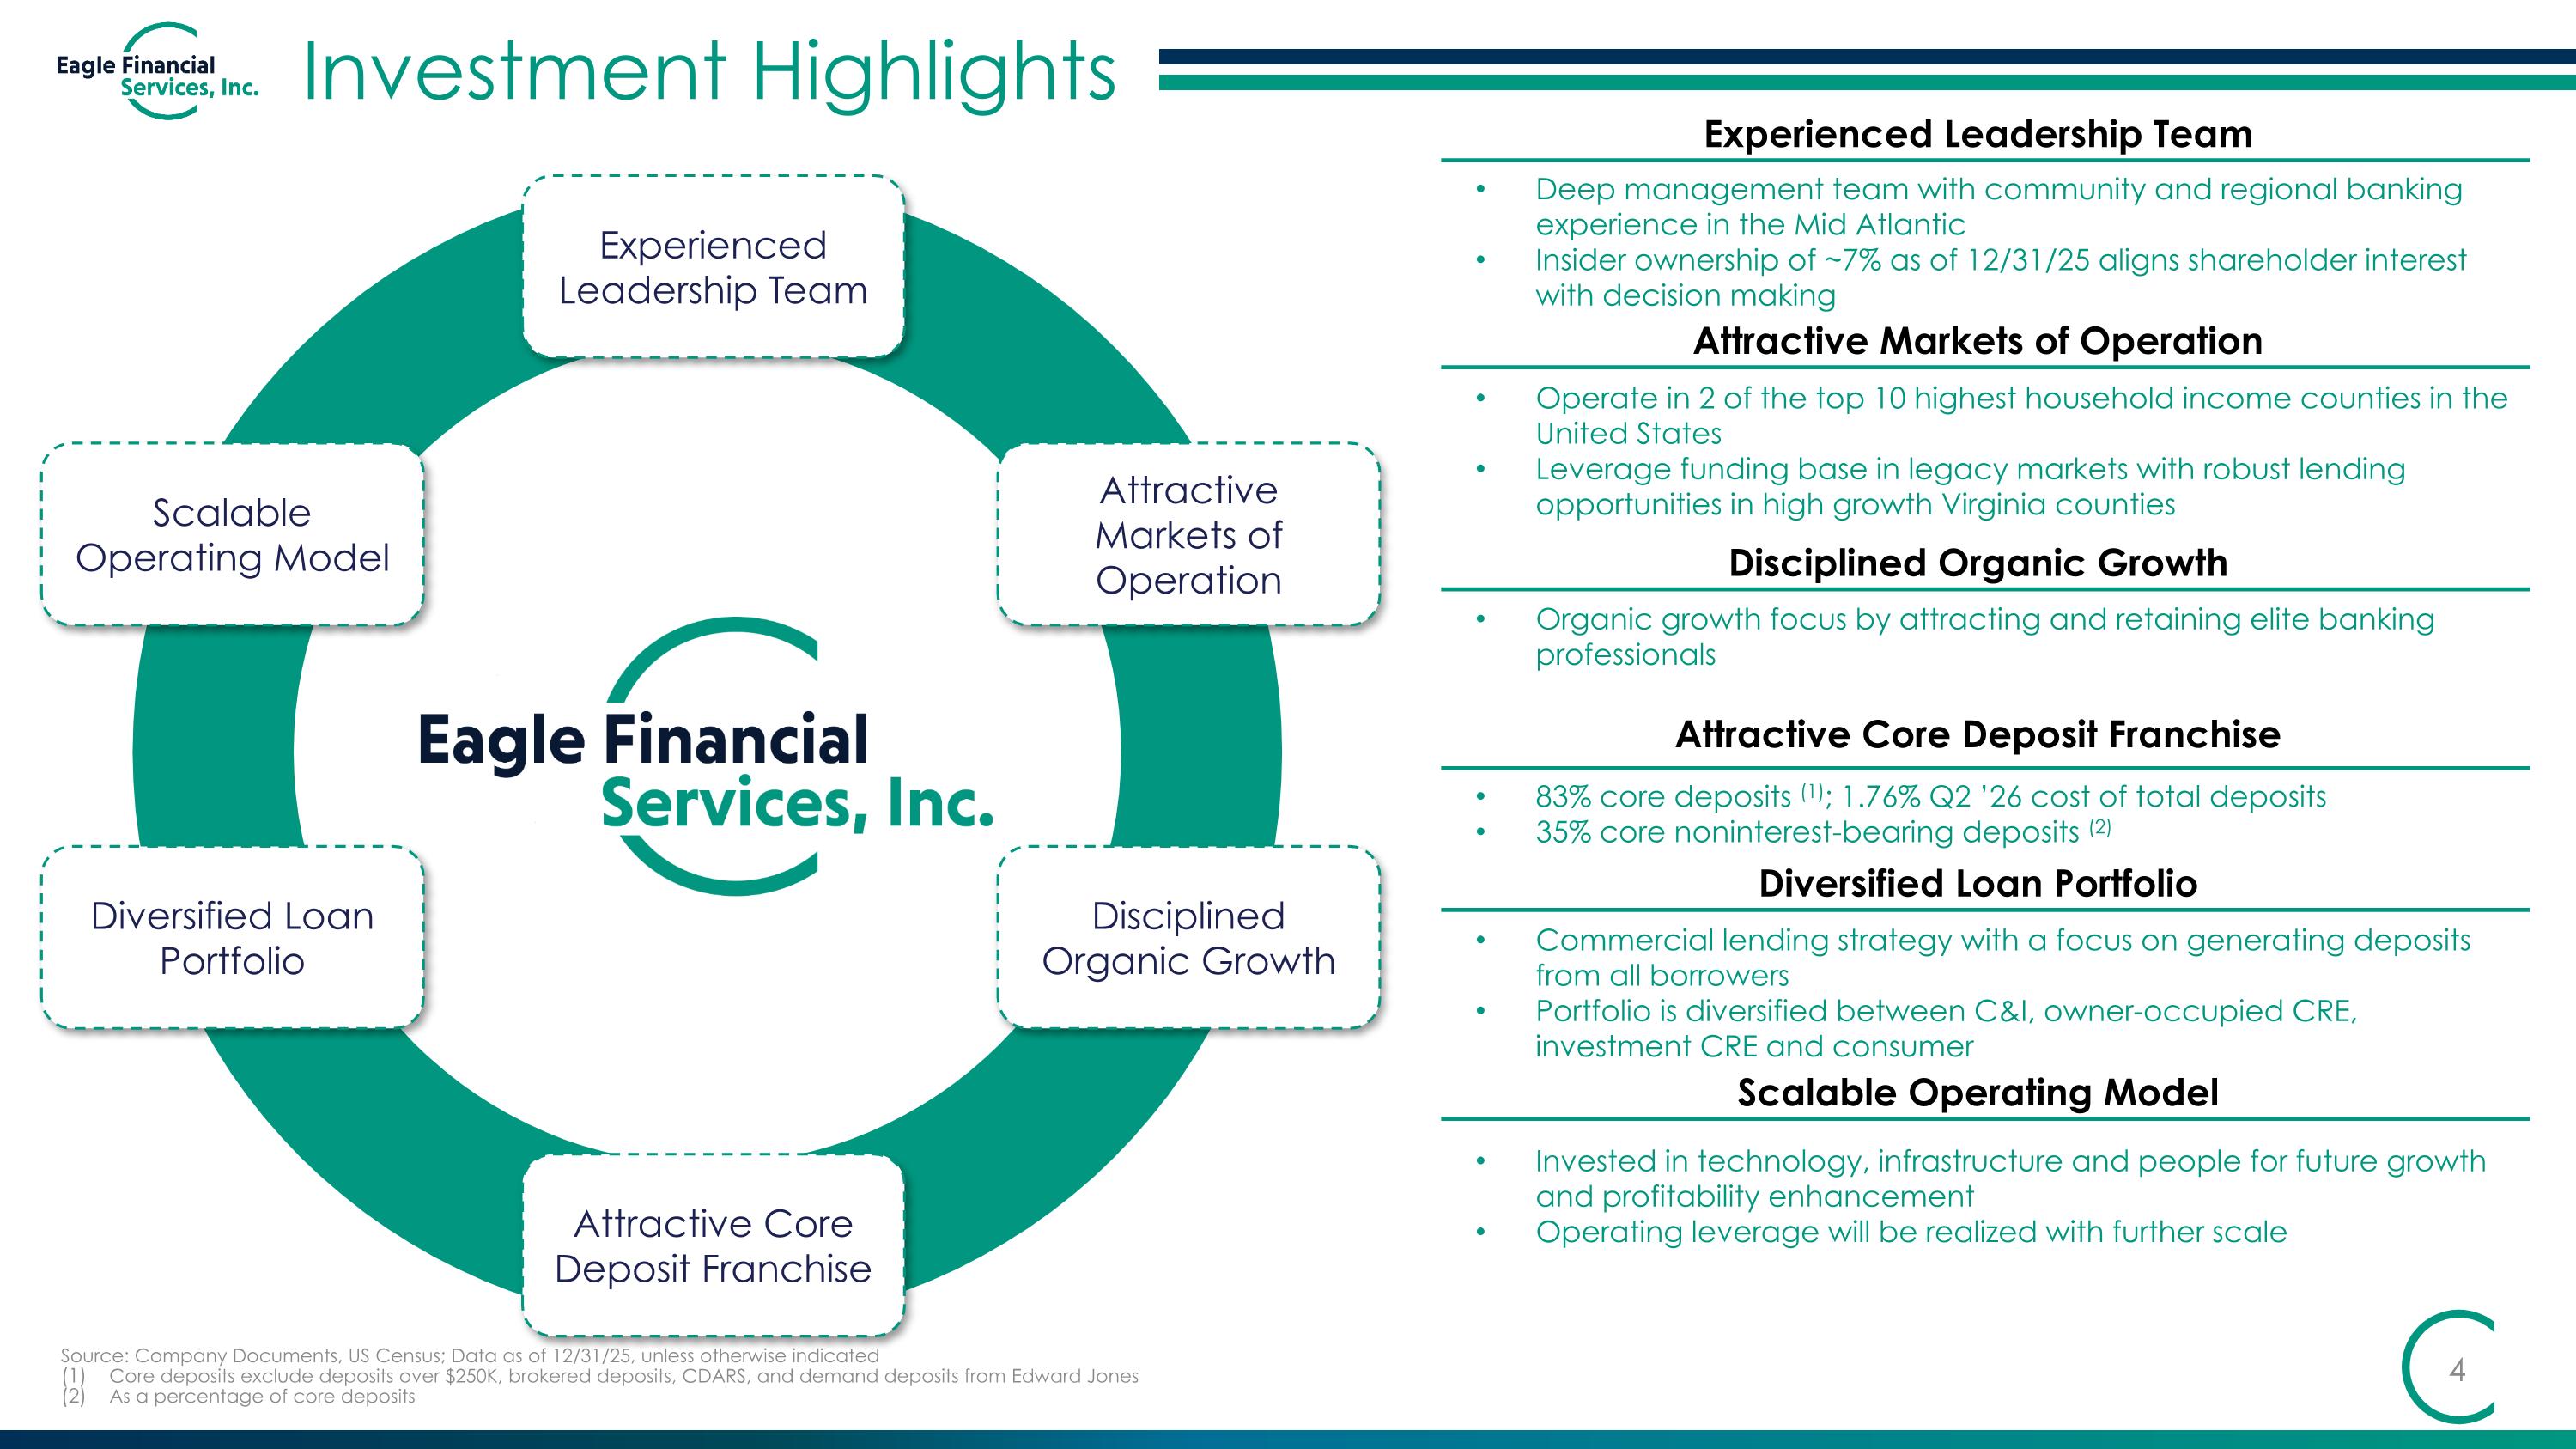
Experienced Leadership Team Attractive Markets of Operation Deep management team with community and regional banking experience in the Mid Atlantic Insider ownership of ~7% as of 12/31/25 aligns shareholder interest with decision making Operate in 2 of the top 10 highest household income counties in the United States Leverage funding base in legacy markets with robust lending opportunities in high growth Virginia counties Disciplined Organic Growth Organic growth focus by attracting and retaining elite banking professionals Investment Highlights Experienced Leadership Team Attractive Markets of Operation Disciplined Organic Growth Diversified Loan Portfolio Scalable Operating Model Attractive Core Deposit Franchise Diversified Loan Portfolio Scalable Operating Model Attractive Core Deposit Franchise 83% core deposits (1); 1.76% Q2 ’26 cost of total deposits 35% core noninterest-bearing deposits (2) Commercial lending strategy with a focus on generating deposits from all borrowers Portfolio is diversified between C&I, owner-occupied CRE, investment CRE and consumer Invested in technology, infrastructure and people for future growth and profitability enhancement Operating leverage will be realized with further scale Source: Company Documents, US Census; Data as of 12/31/25, unless otherwise indicated Core deposits exclude deposits over $250K, brokered deposits, CDARS, and demand deposits from Edward Jones As a percentage of core deposits
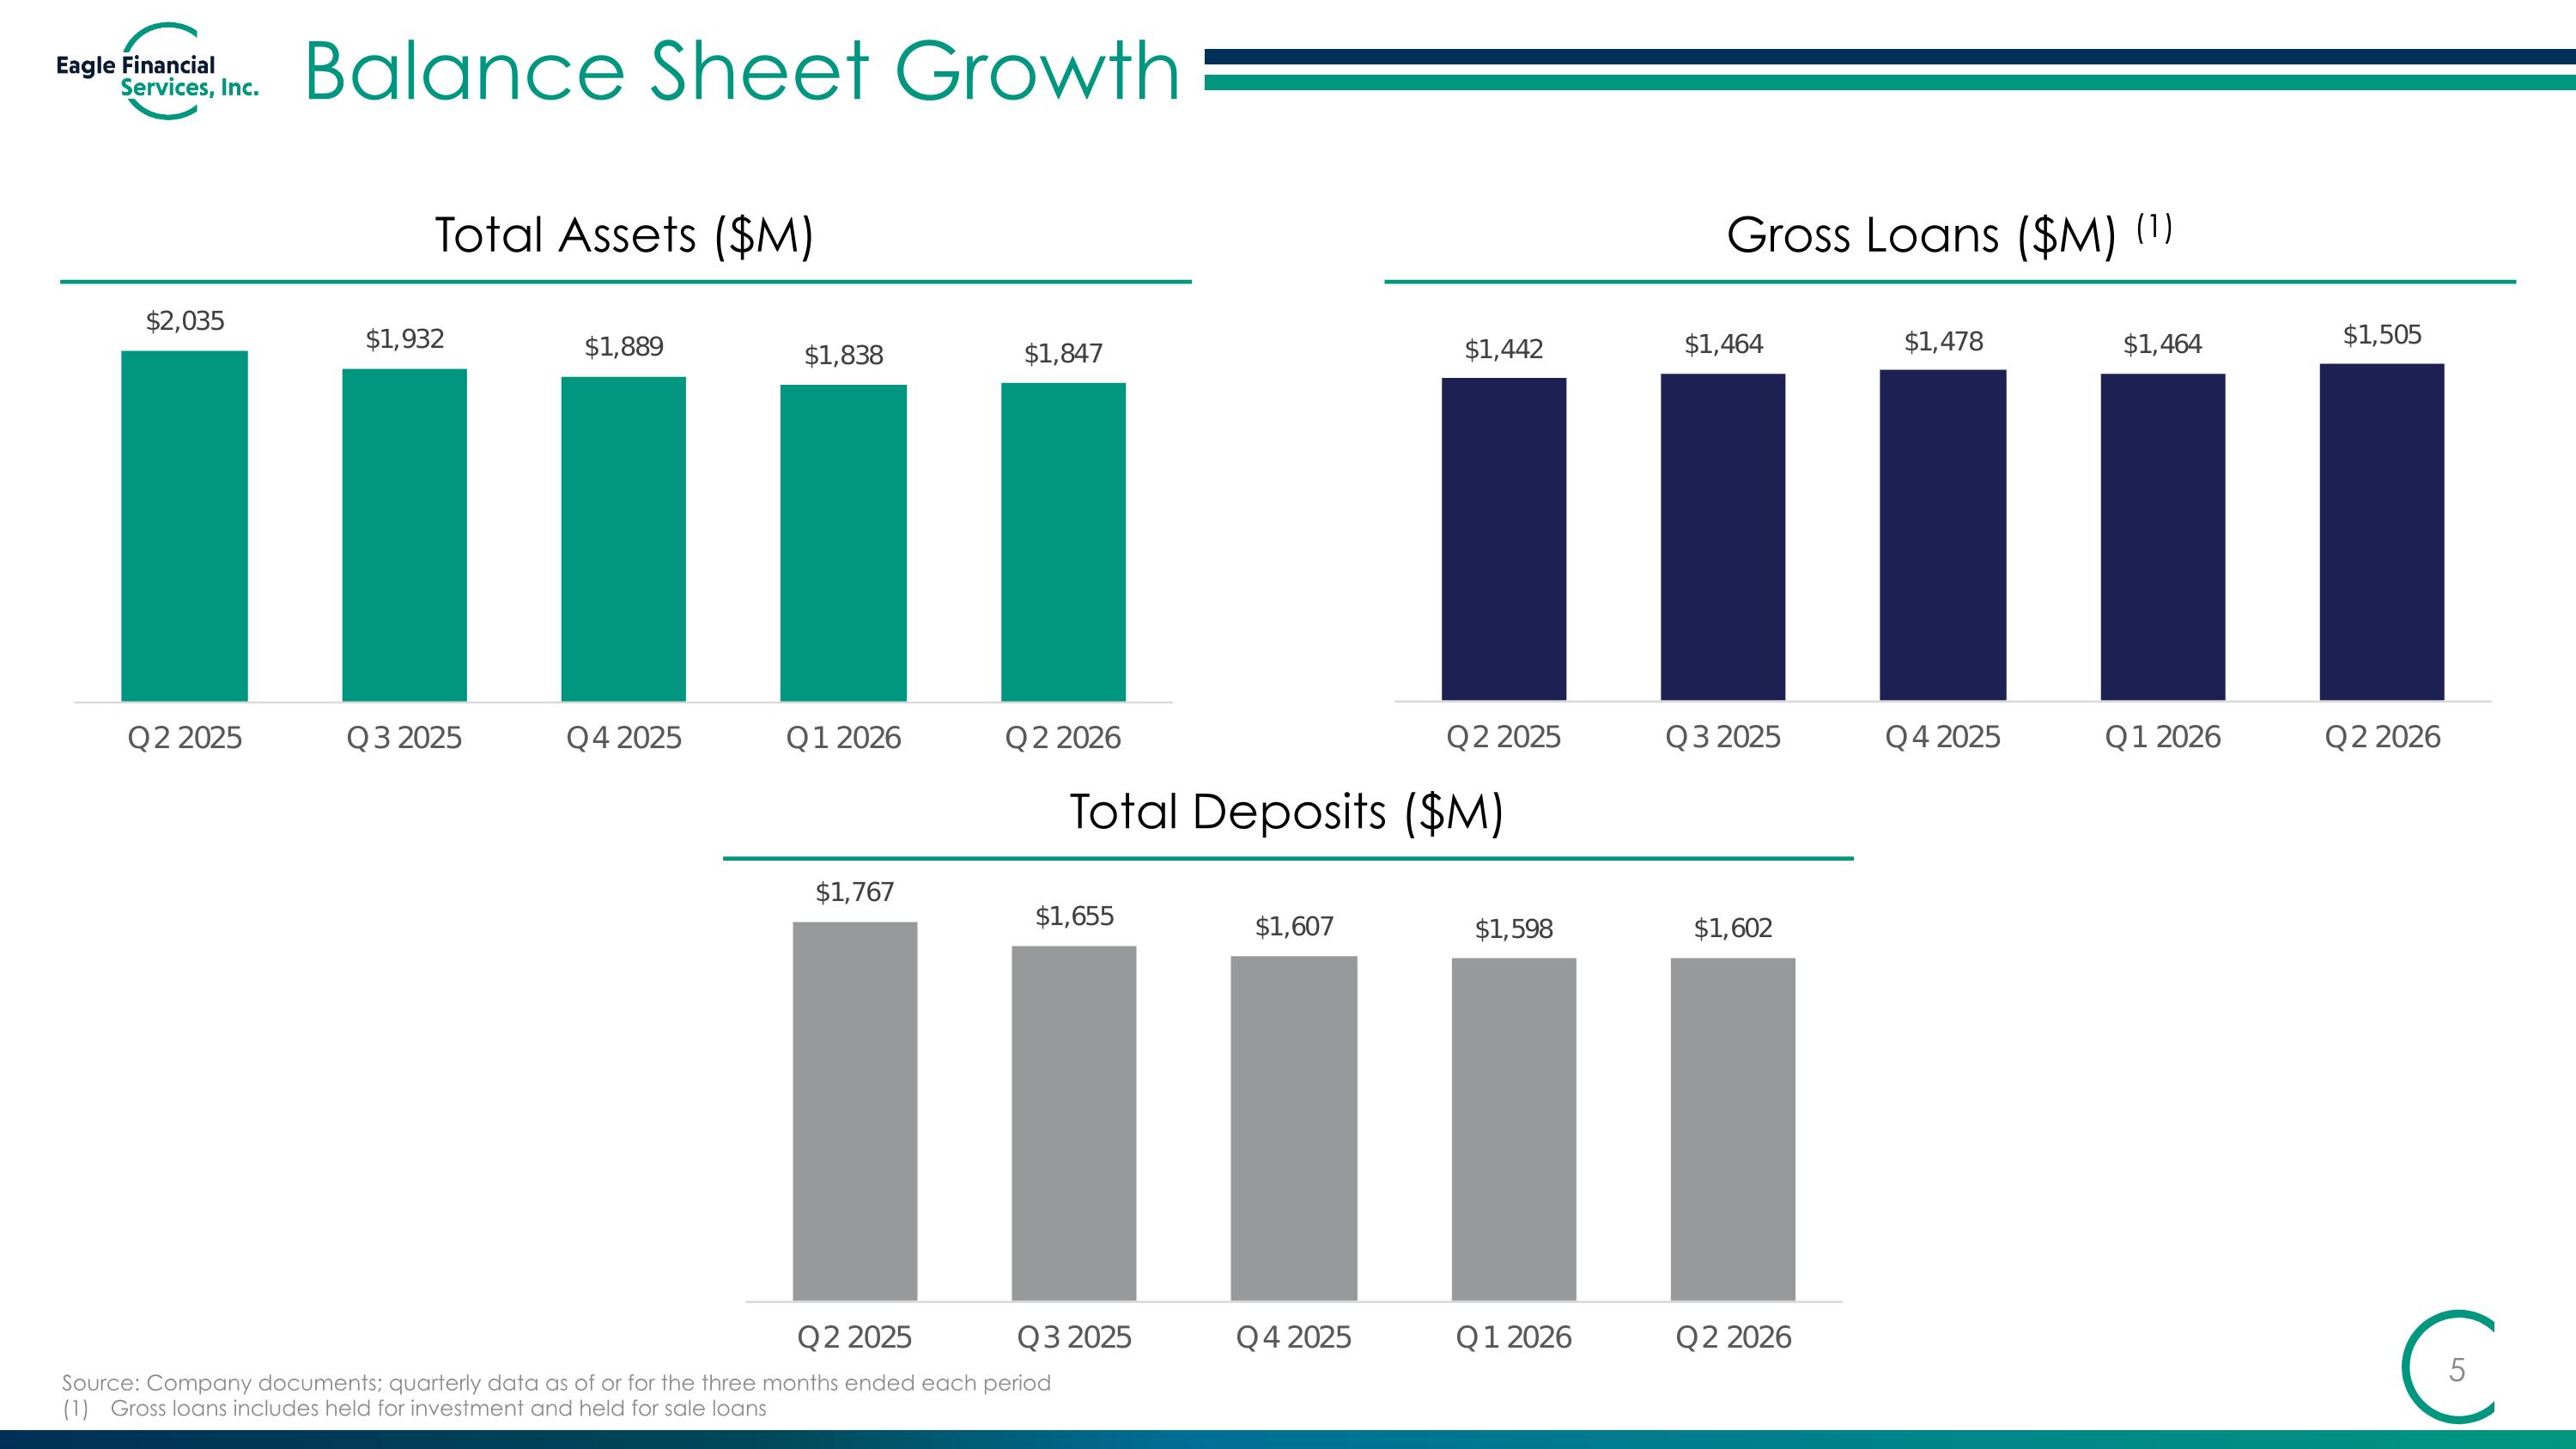
Gross Loans ($M) (1) Balance Sheet Growth Total Assets ($M) Total Deposits ($M) Source: Company documents; quarterly data as of or for the three months ended each period (1) Gross loans includes held for investment and held for sale loans
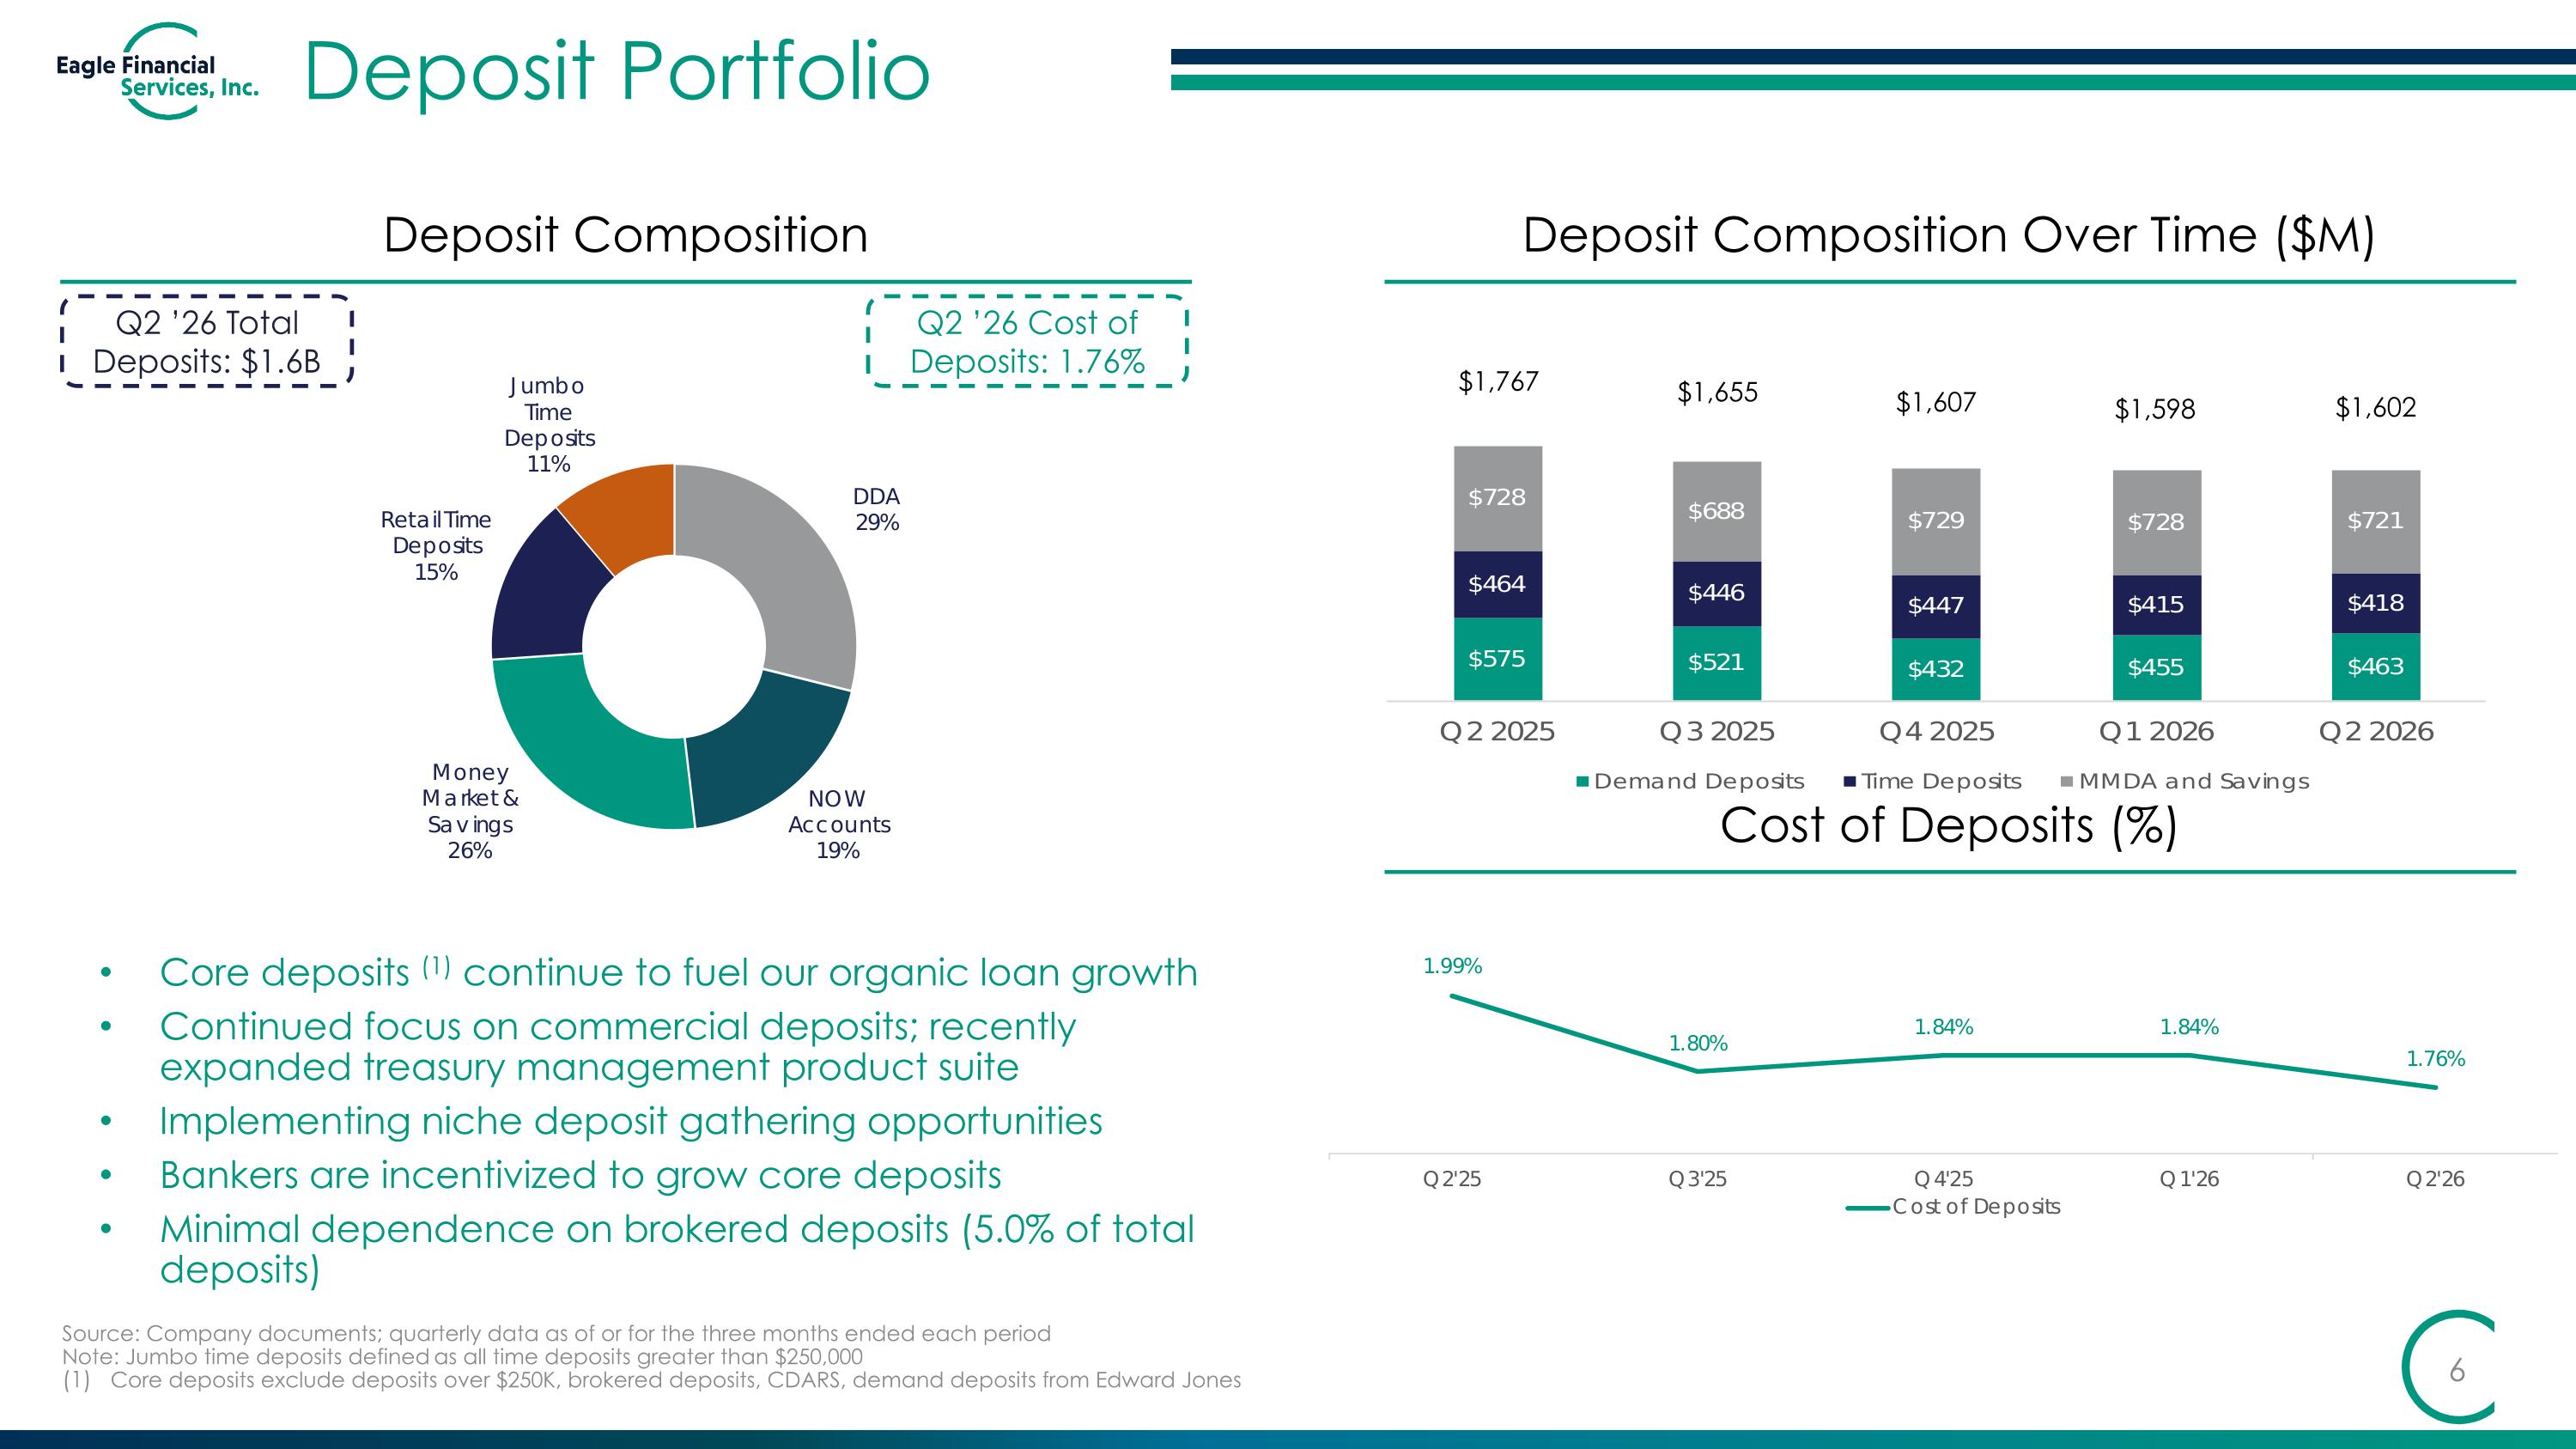
Deposit Portfolio Cost of Deposits (%) Deposit Composition Over Time ($M) Deposit Composition Core deposits (1) continue to fuel our organic loan growth Continued focus on commercial deposits; recently expanded treasury management product suite Implementing niche deposit gathering opportunities Bankers are incentivized to grow core deposits Minimal dependence on brokered deposits (5.0% of total deposits) Source: Company documents; quarterly data as of or for the three months ended each period Note: Jumbo time deposits defined as all time deposits greater than $250,000 Core deposits exclude deposits over $250K, brokered deposits, CDARS, demand deposits from Edward Jones $1,655 $1,598 $1,602 Q2 ’26 Cost of Deposits: 1.76% Q2 ’26 Total Deposits: $1.6B $1,767 $1,607
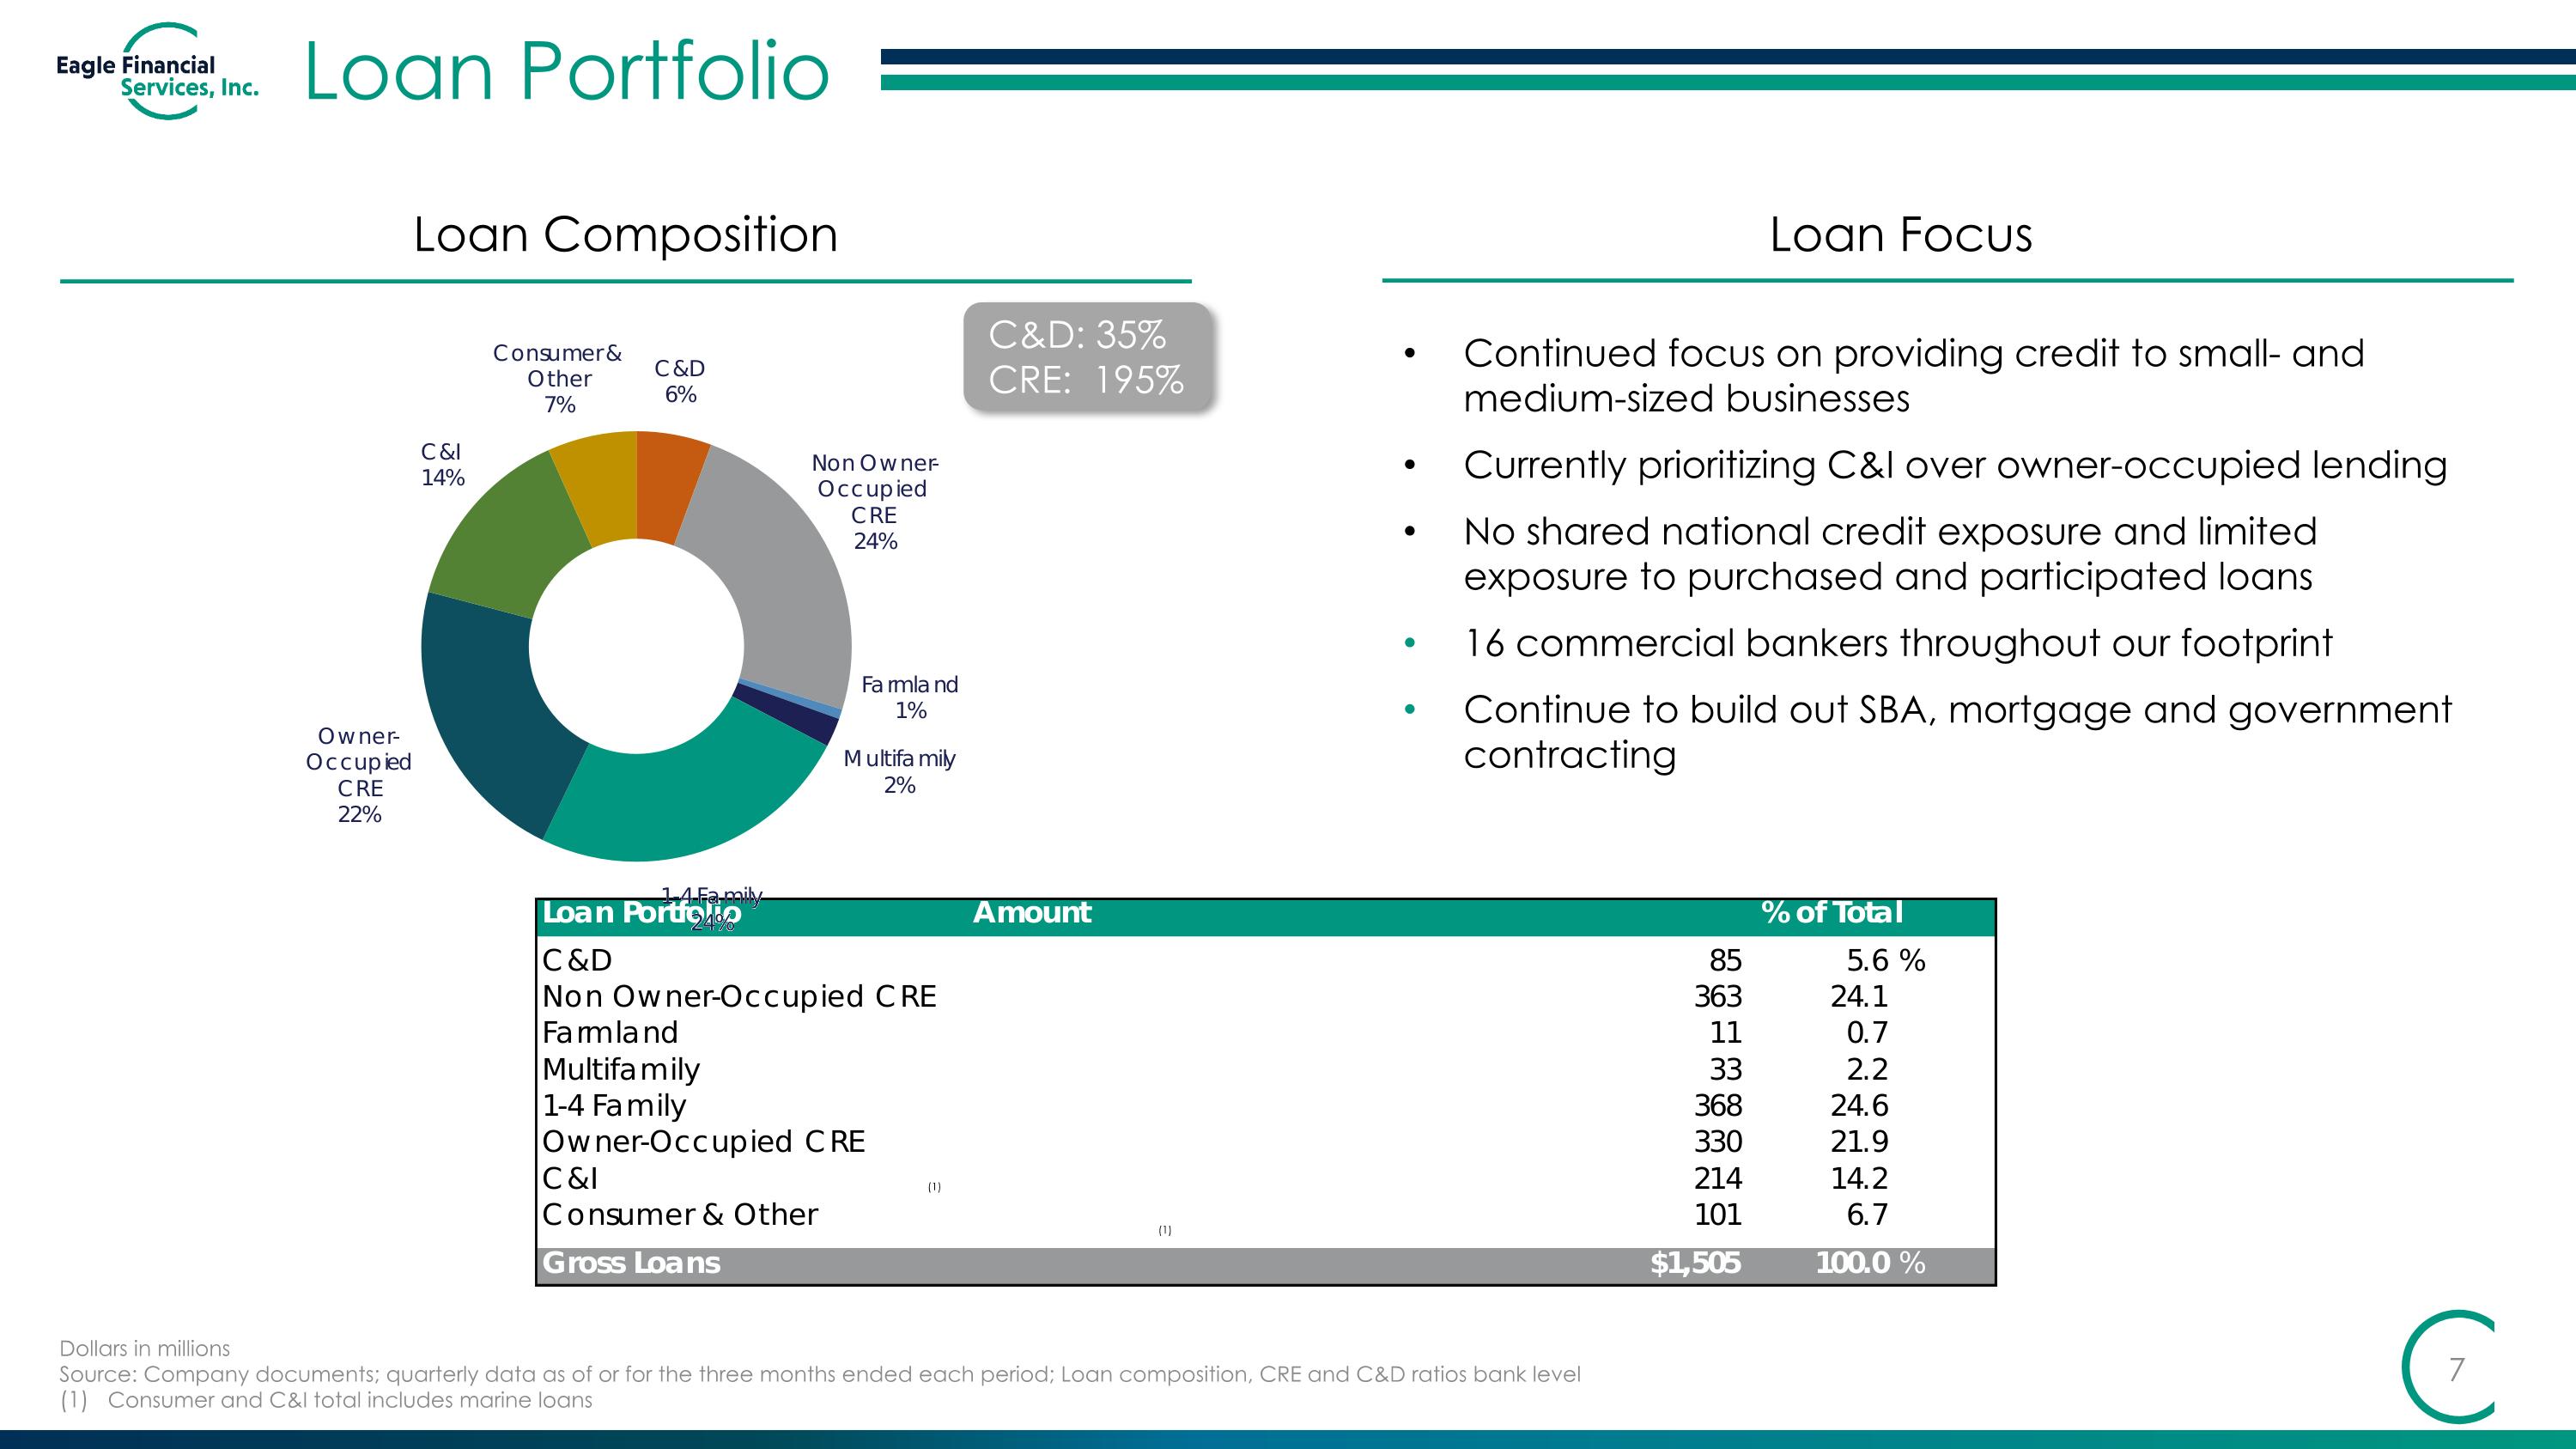
Loan Portfolio Loan Composition C&D: 35% CRE: 195% Continued focus on providing credit to small- and medium-sized businesses Currently prioritizing C&I over owner-occupied lending No shared national credit exposure and limited exposure to purchased and participated loans 16 commercial bankers throughout our footprint Continue to build out SBA, mortgage and government contracting Loan Focus Dollars in millions Source: Company documents; quarterly data as of or for the three months ended each period; Loan composition, CRE and C&D ratios bank level Consumer and C&I total includes marine loans (1) (1) (1)
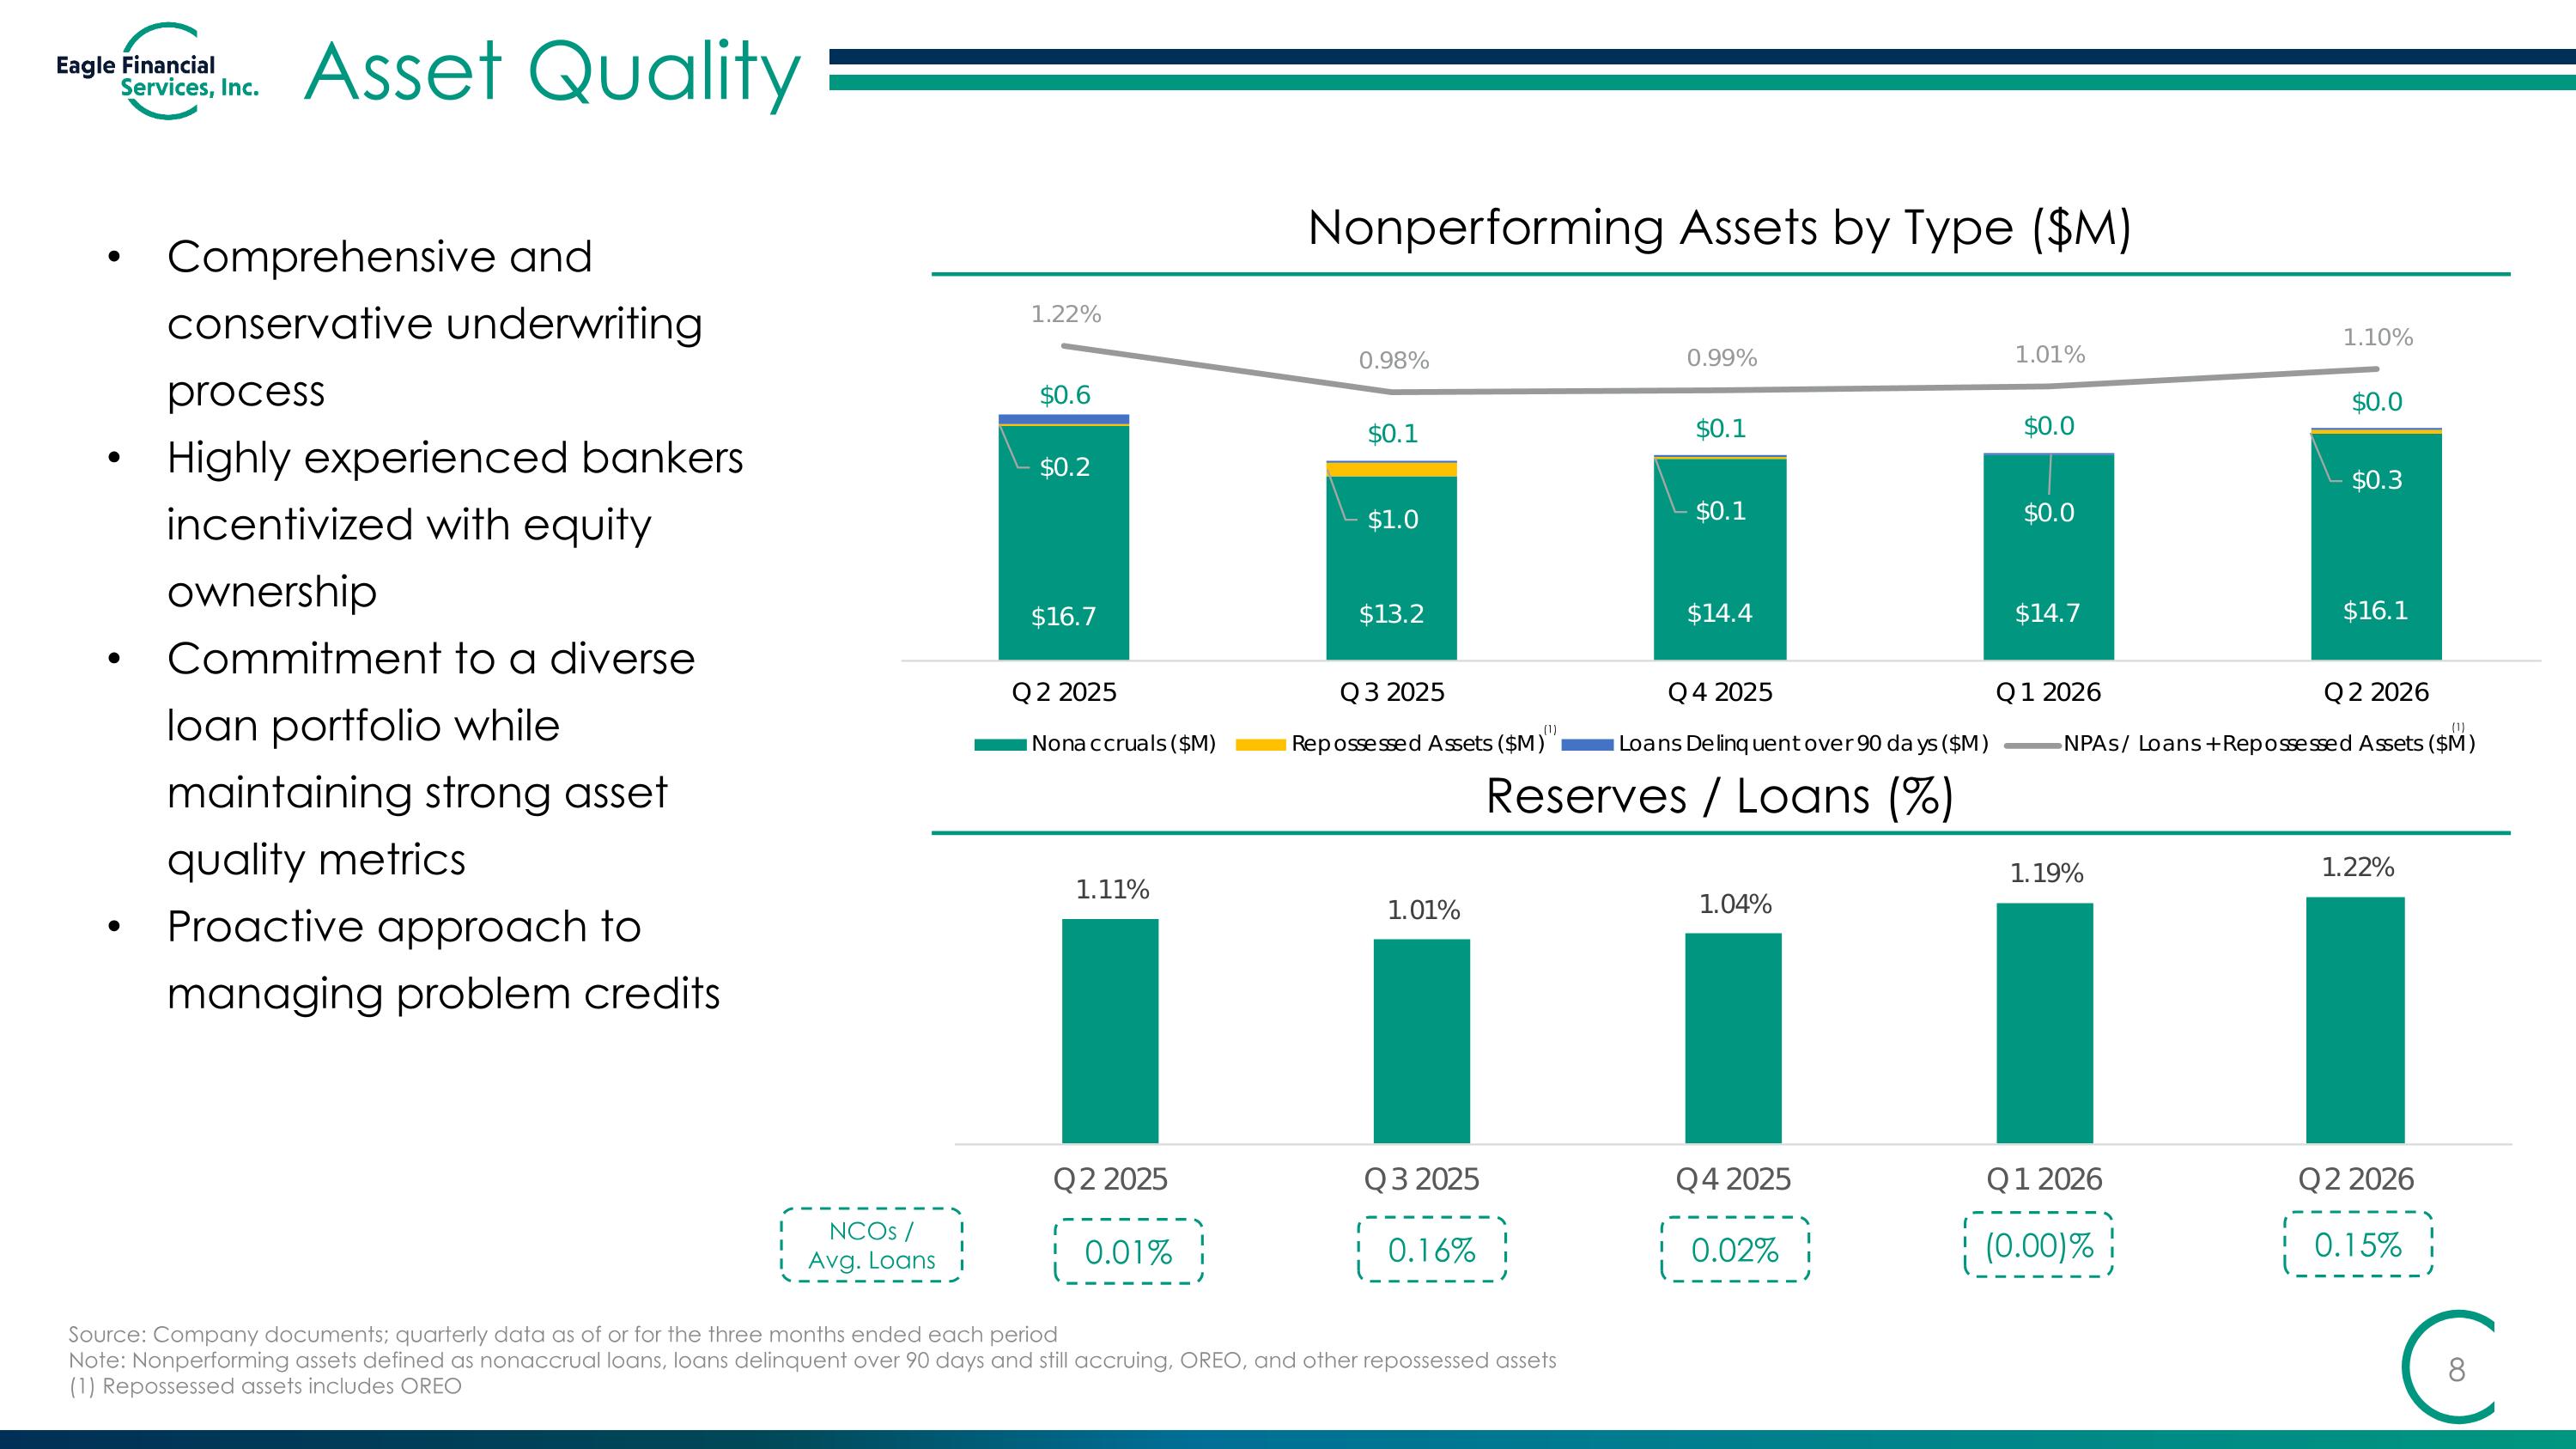
Asset Quality Nonperforming Assets by Type ($M) Reserves / Loans (%) 0.02% (0.00)% 0.15% Comprehensive and conservative underwriting process Highly experienced bankers incentivized with equity ownership Commitment to a diverse loan portfolio while maintaining strong asset quality metrics Proactive approach to managing problem credits Source: Company documents; quarterly data as of or for the three months ended each period Note: Nonperforming assets defined as nonaccrual loans, loans delinquent over 90 days and still accruing, OREO, and other repossessed assets (1) Repossessed assets includes OREO NCOs / Avg. Loans 0.01% 0.16% (1) (1)
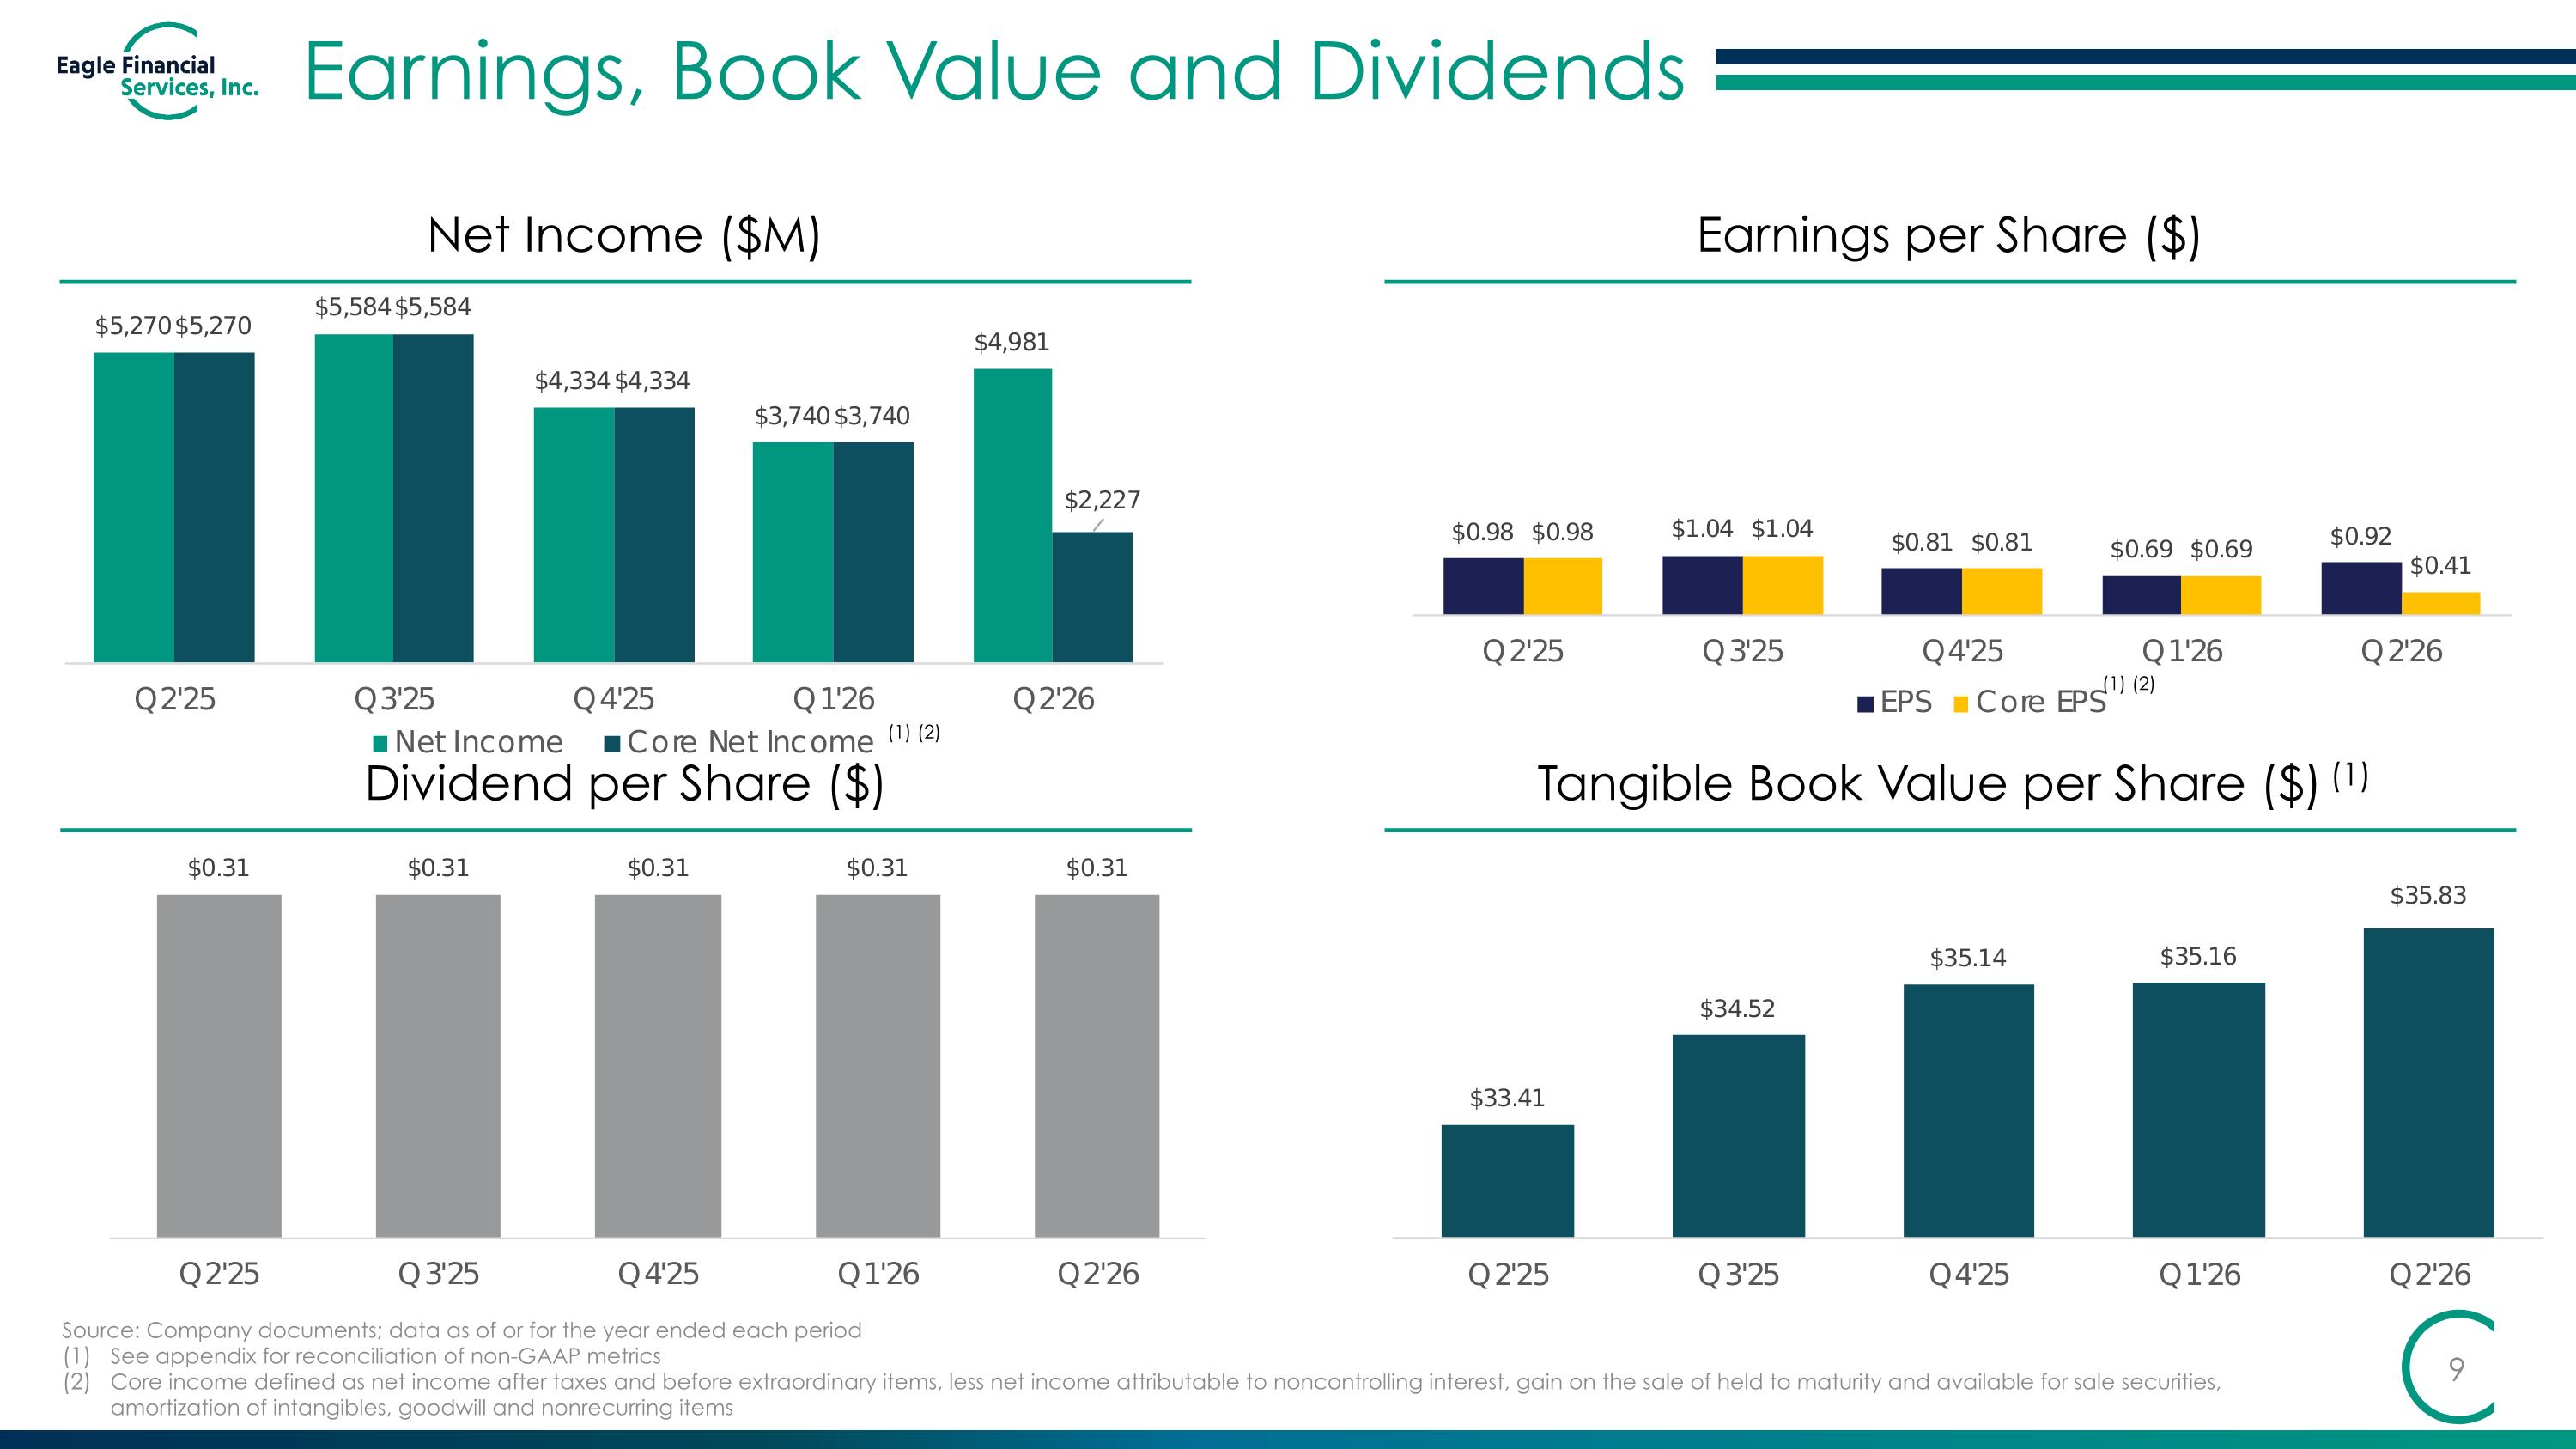
Earnings, Book Value and Dividends Earnings per Share ($) Net Income ($M) Dividend per Share ($) Tangible Book Value per Share ($)(1) Source: Company documents; data as of or for the year ended each period See appendix for reconciliation of non-GAAP metrics Core income defined as net income after taxes and before extraordinary items, less net income attributable to noncontrolling interest, gain on the sale of held to maturity and available for sale securities, amortization of intangibles, goodwill and nonrecurring items (1) (2) (1) (2)
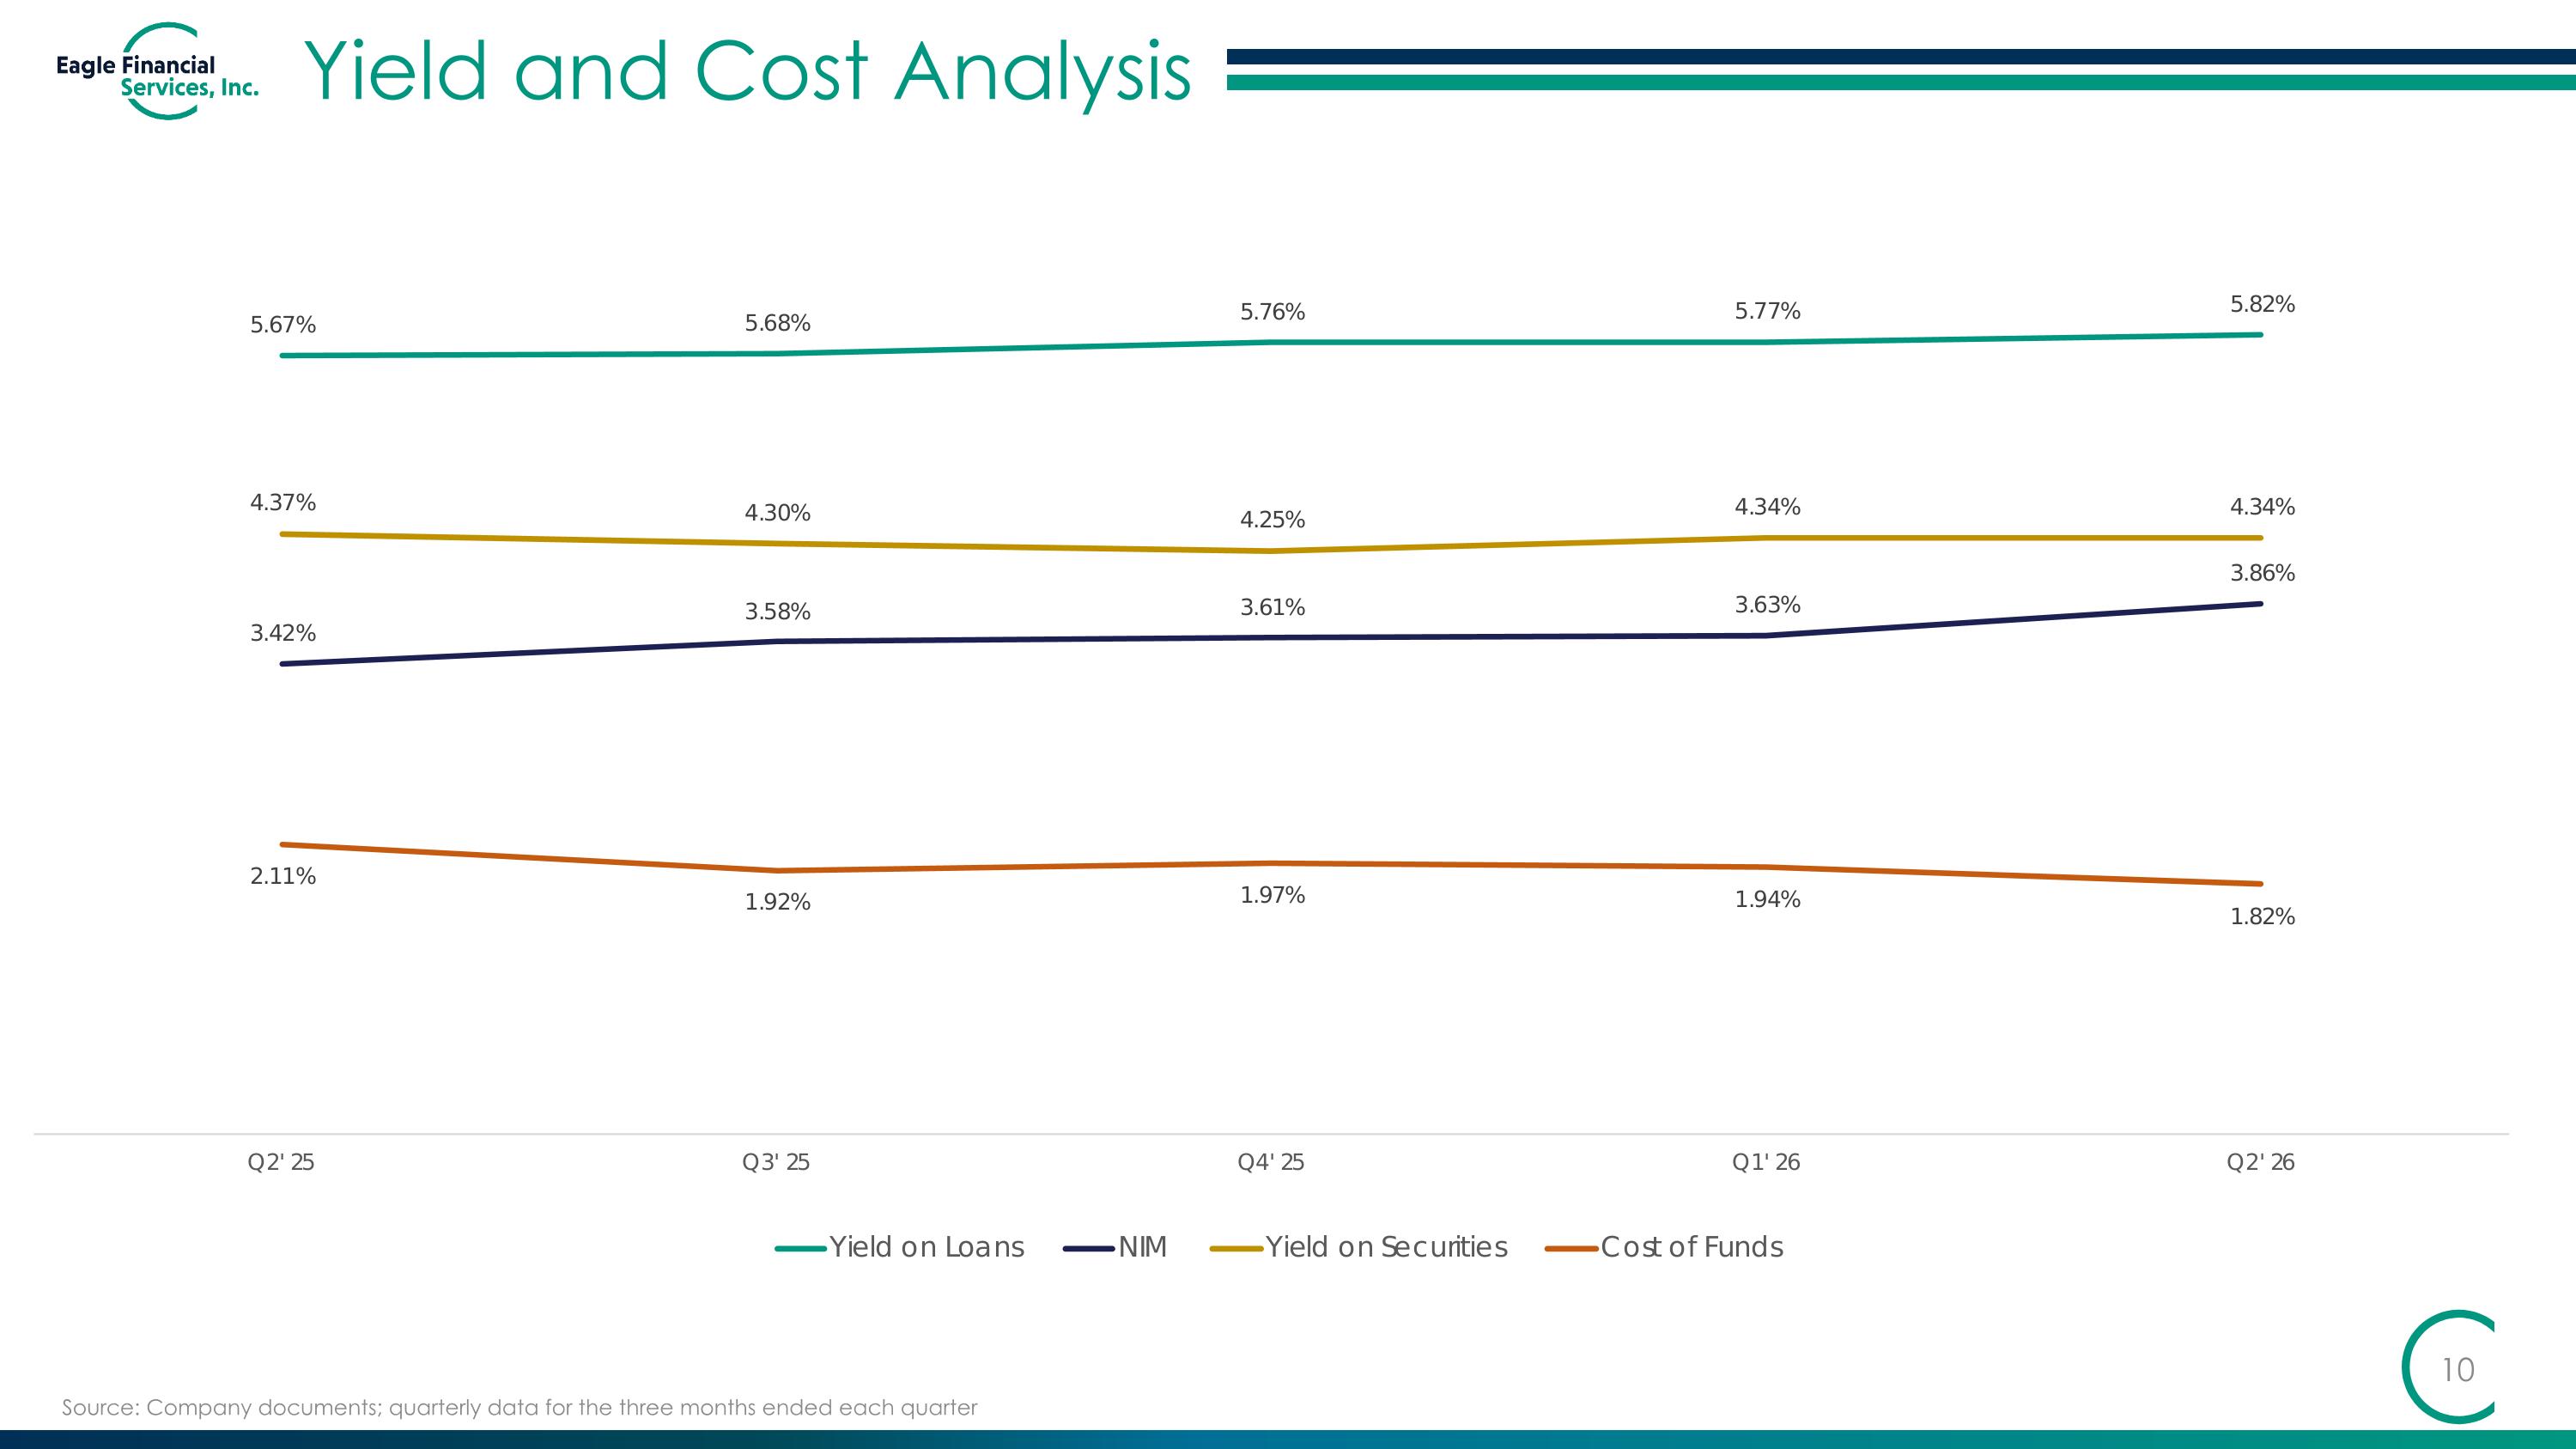
Yield and Cost Analysis Source: Company documents; quarterly data for the three months ended each quarter
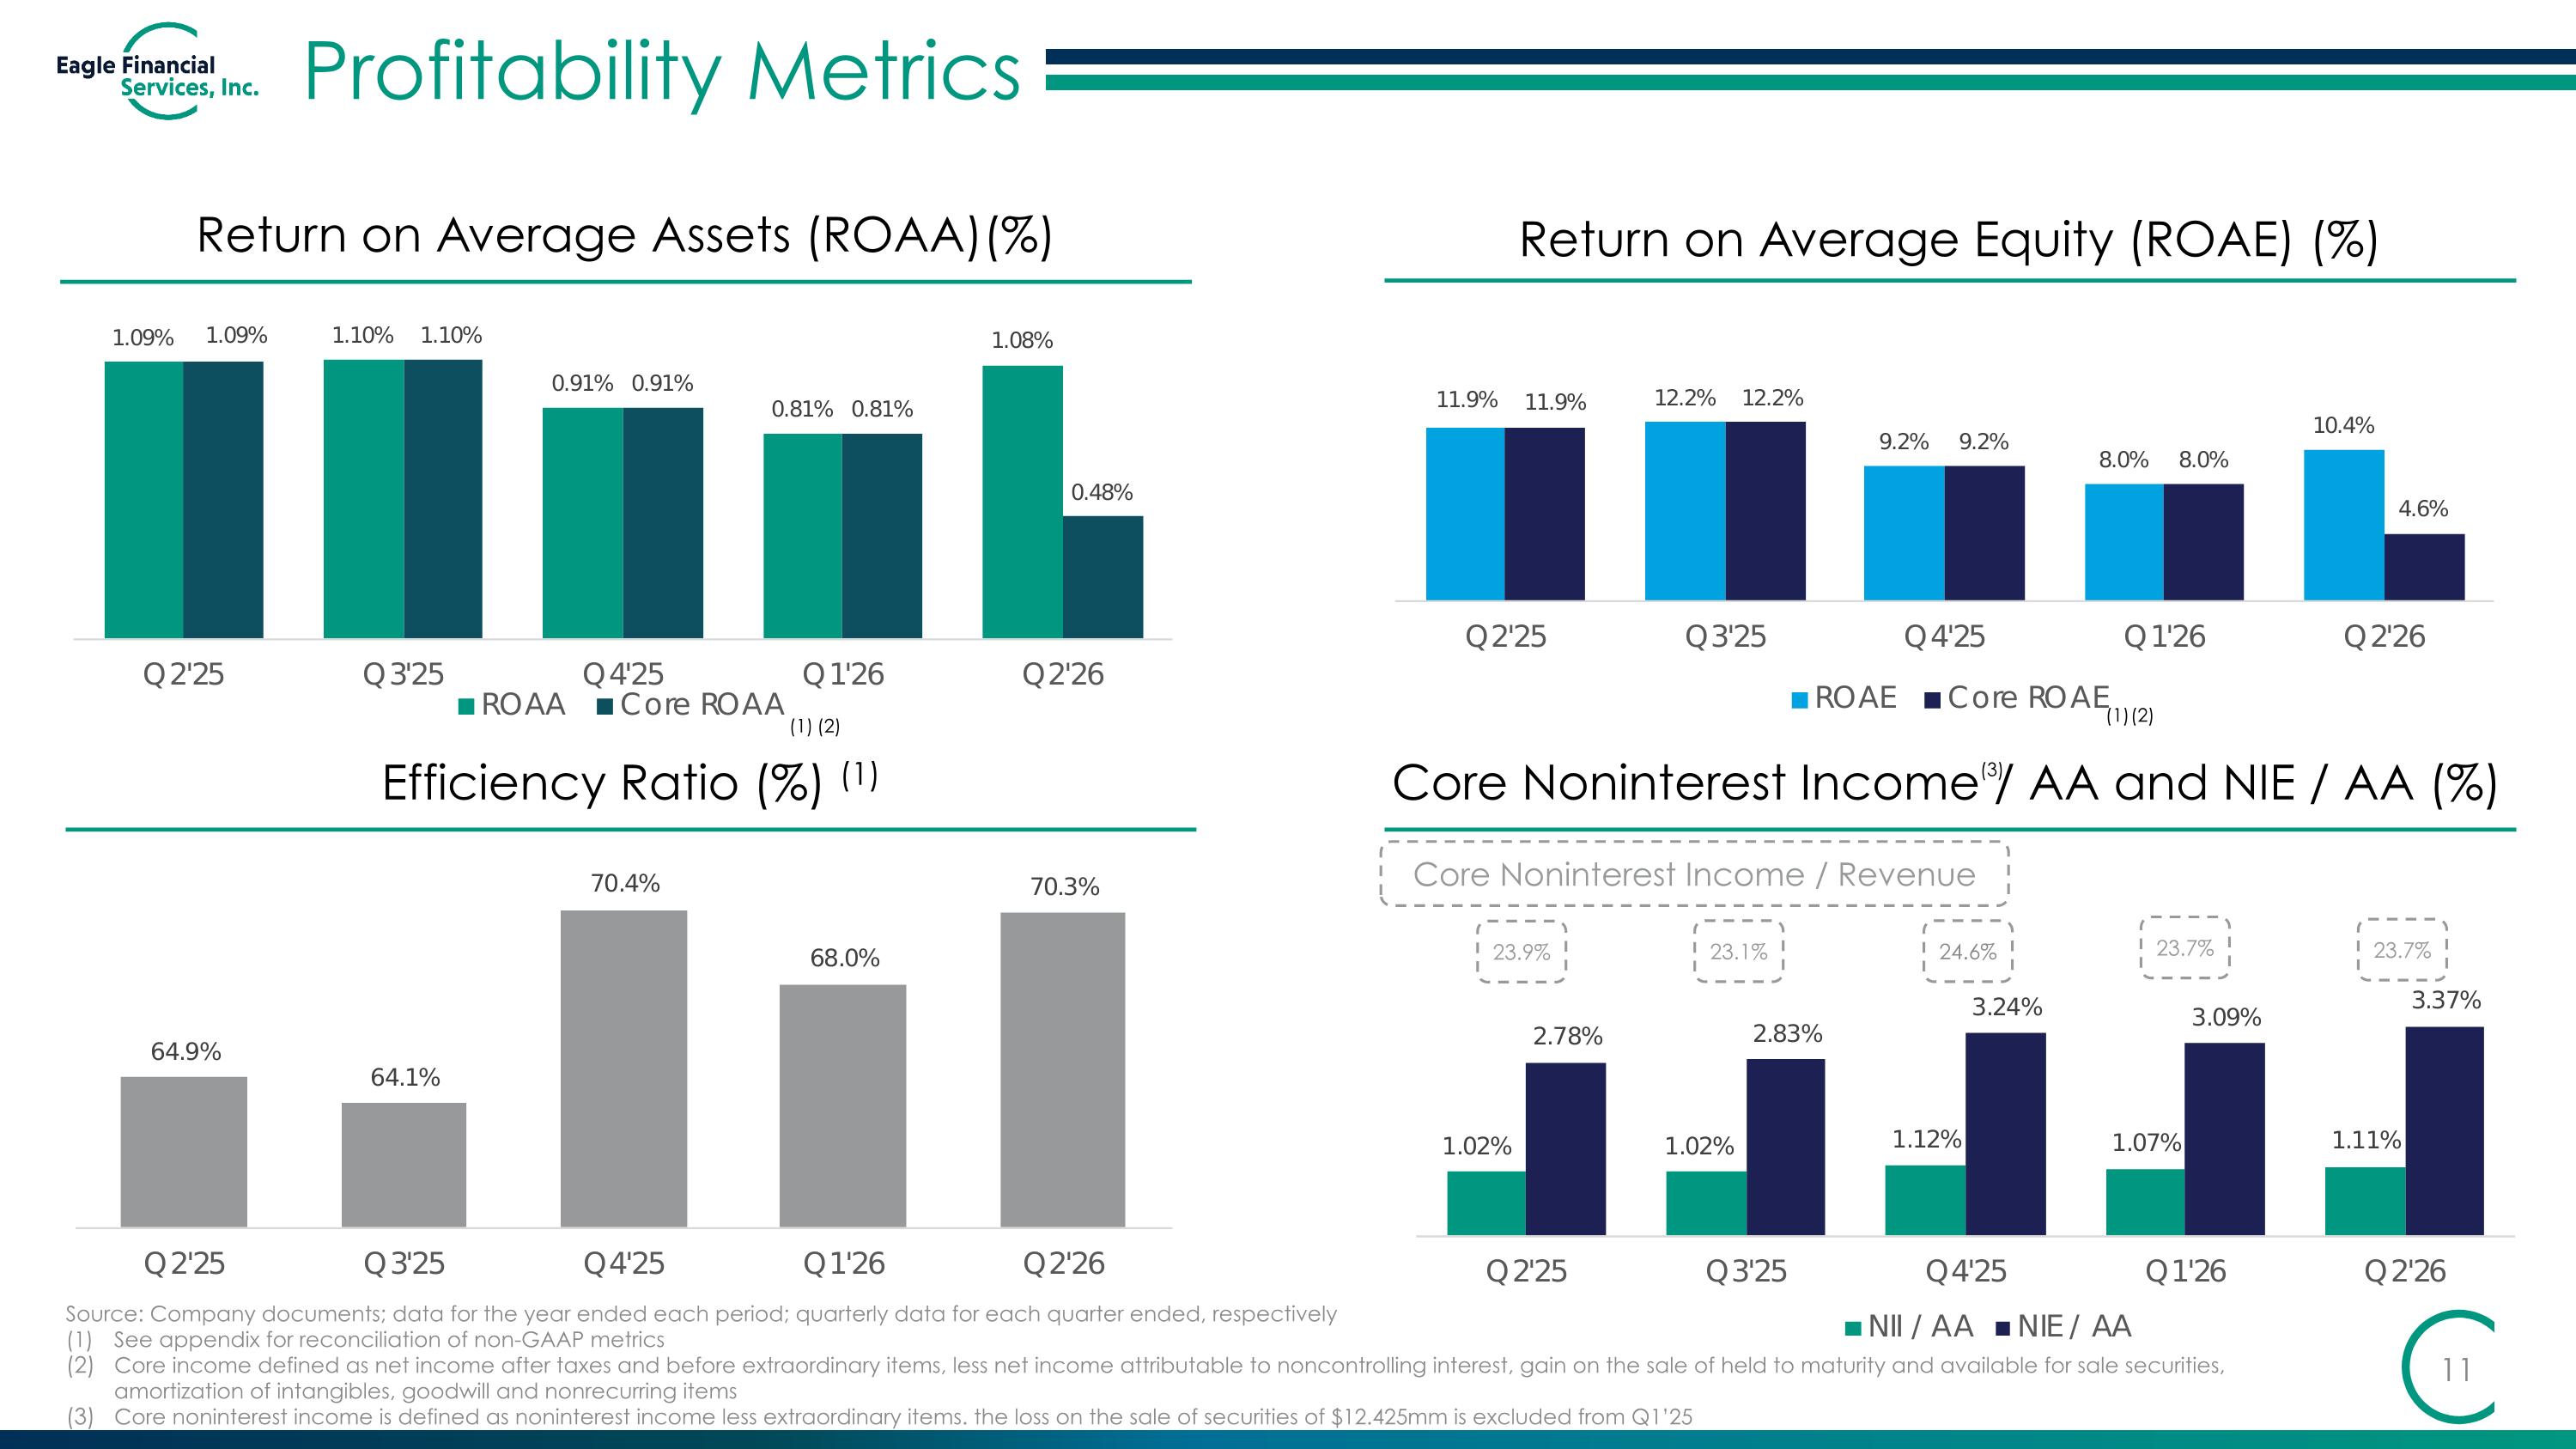
Profitability Metrics Return on Average Assets (ROAA)(%) Core Noninterest Income / AA and NIE / AA (%) Return on Average Equity (ROAE) (%) Efficiency Ratio (%) (1) Core Noninterest Income / Revenue Source: Company documents; data for the year ended each period; quarterly data for each quarter ended, respectively (1) See appendix for reconciliation of non-GAAP metrics Core income defined as net income after taxes and before extraordinary items, less net income attributable to noncontrolling interest, gain on the sale of held to maturity and available for sale securities, amortization of intangibles, goodwill and nonrecurring items Core noninterest income is defined as noninterest income less extraordinary items. the loss on the sale of securities of $12.425mm is excluded from Q1’25 (1) (1) (2) (2) 23.9% 23.7% 23.7% 23.1% 24.6% (3)
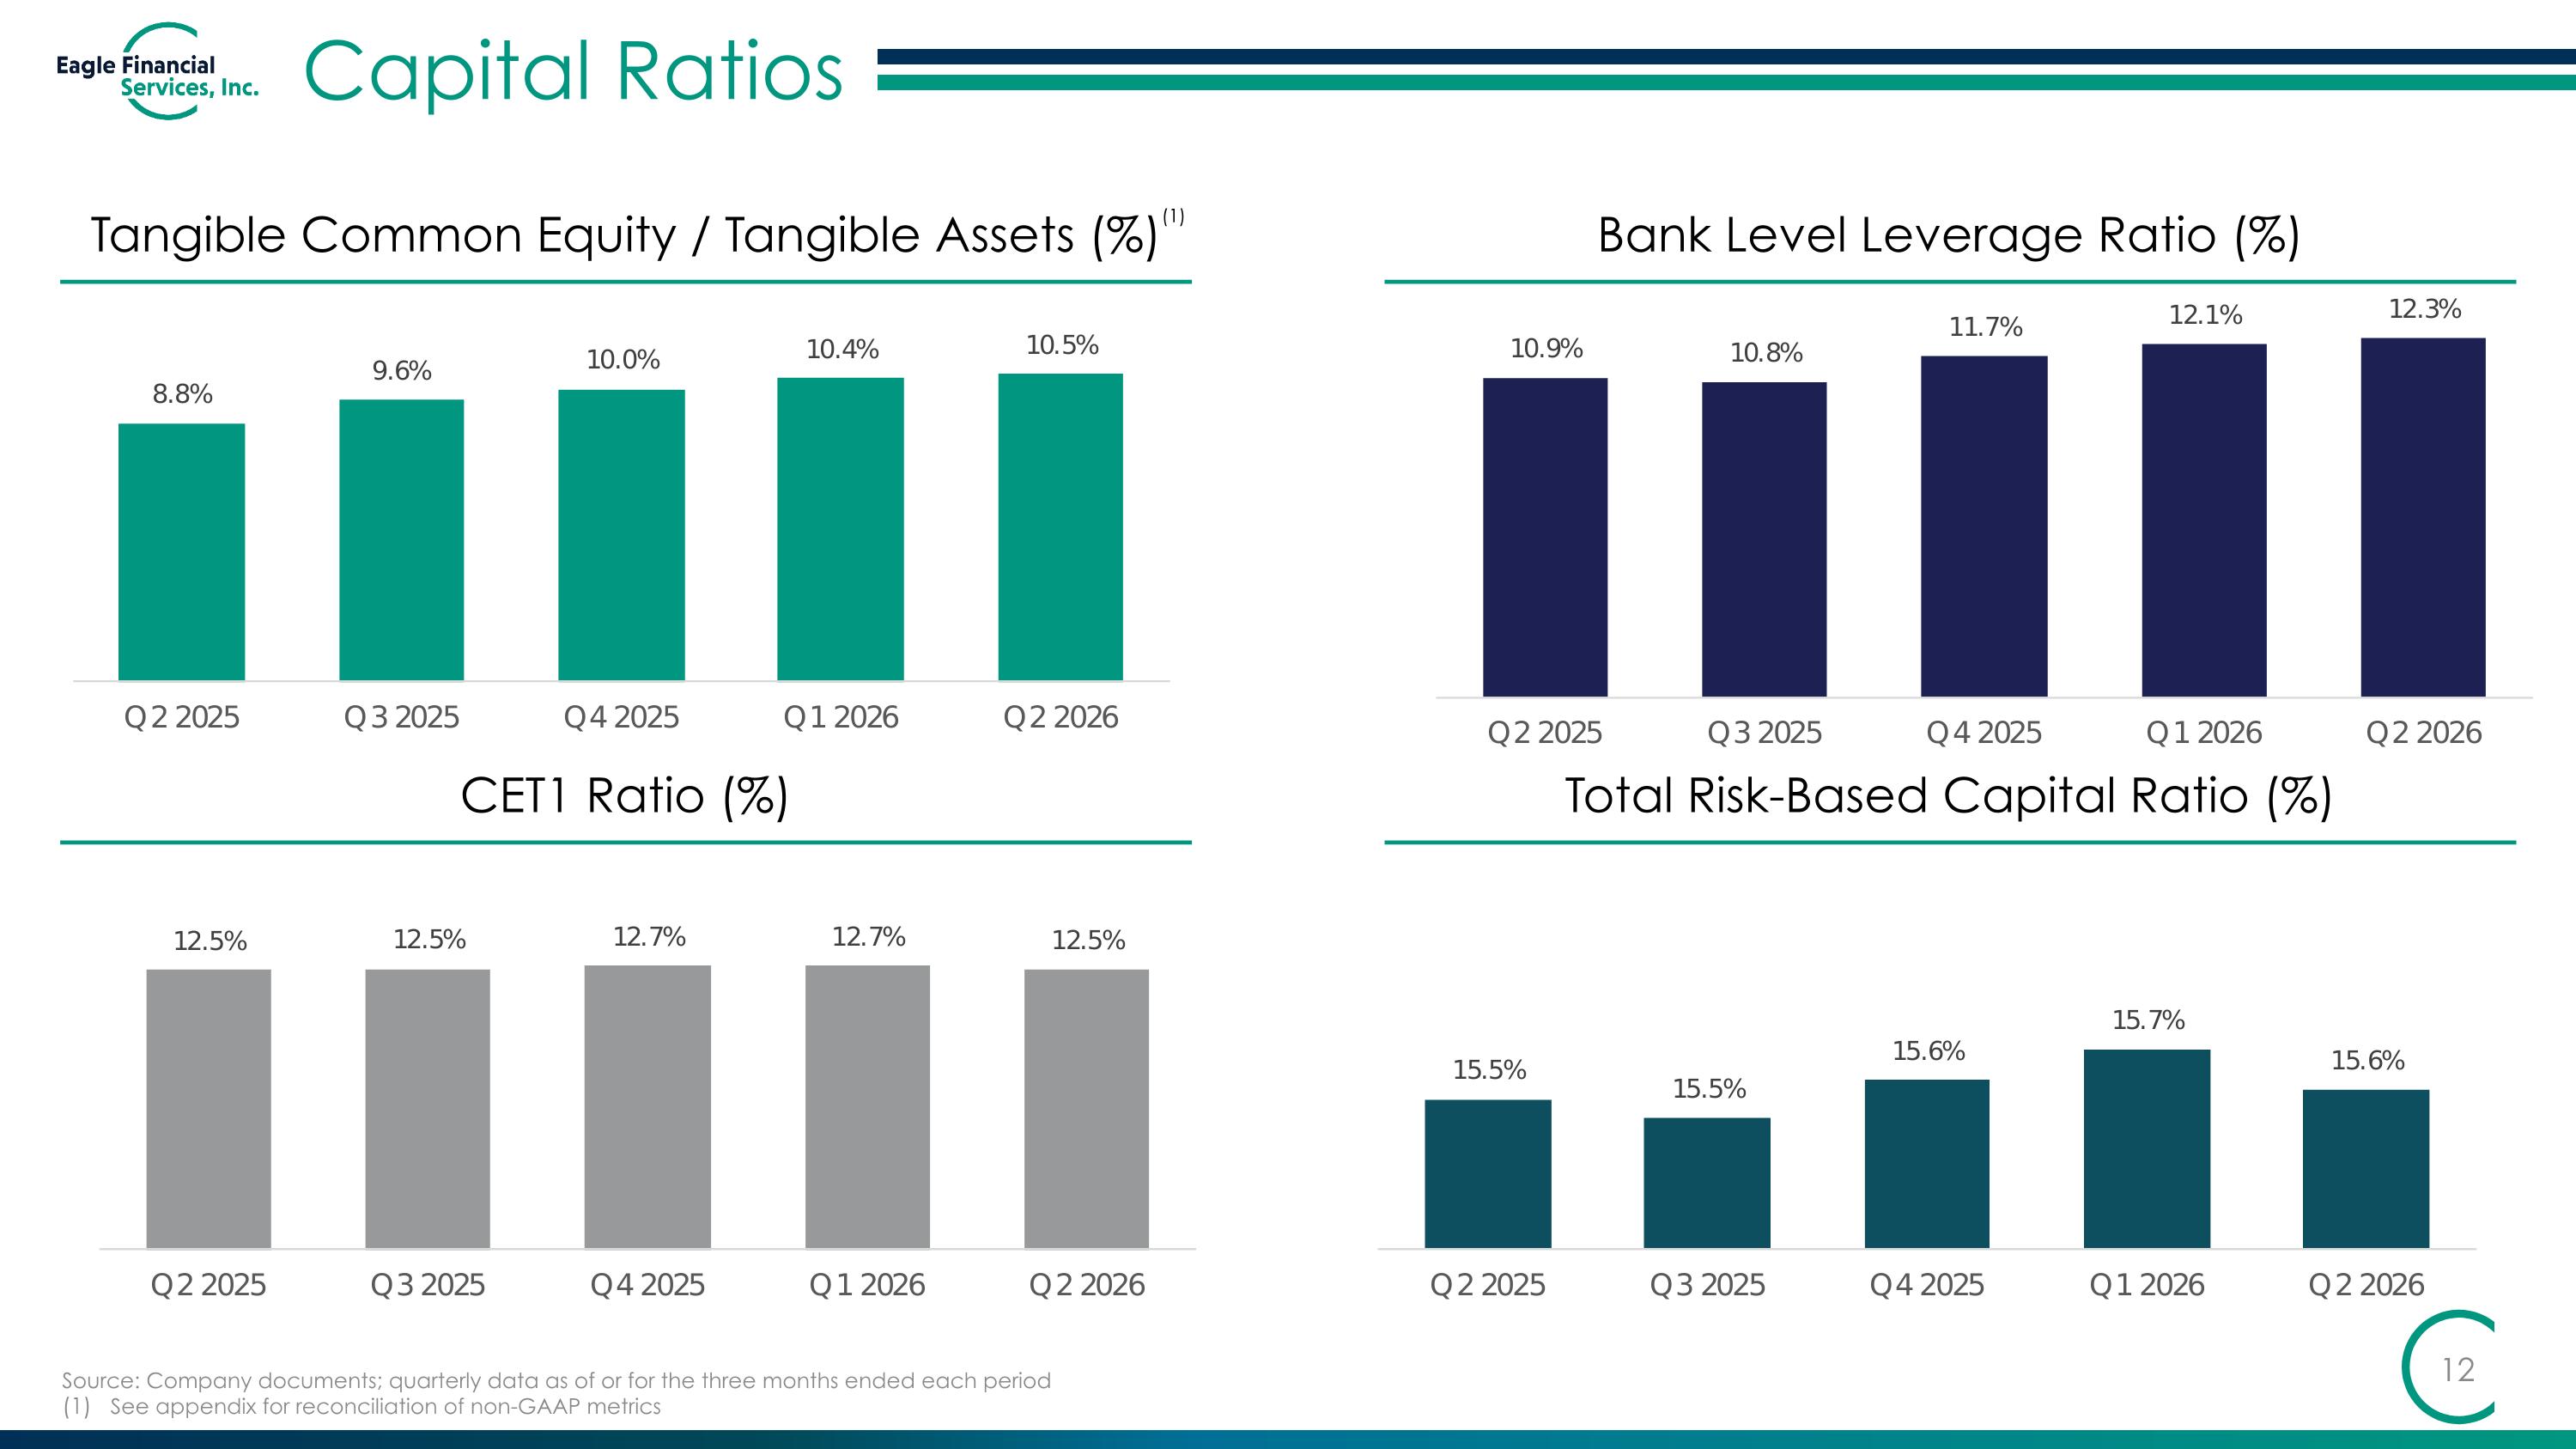
Bank Level Leverage Ratio (%) Tangible Common Equity / Tangible Assets (%) Capital Ratios CET1 Ratio (%) Total Risk-Based Capital Ratio (%) Source: Company documents; quarterly data as of or for the three months ended each period See appendix for reconciliation of non-GAAP metrics (1) Pro Forma (2) 8.4% Pro Forma (2) 10.4% Pro Forma (2) 11.5% Pro Forma (2) 14.4%
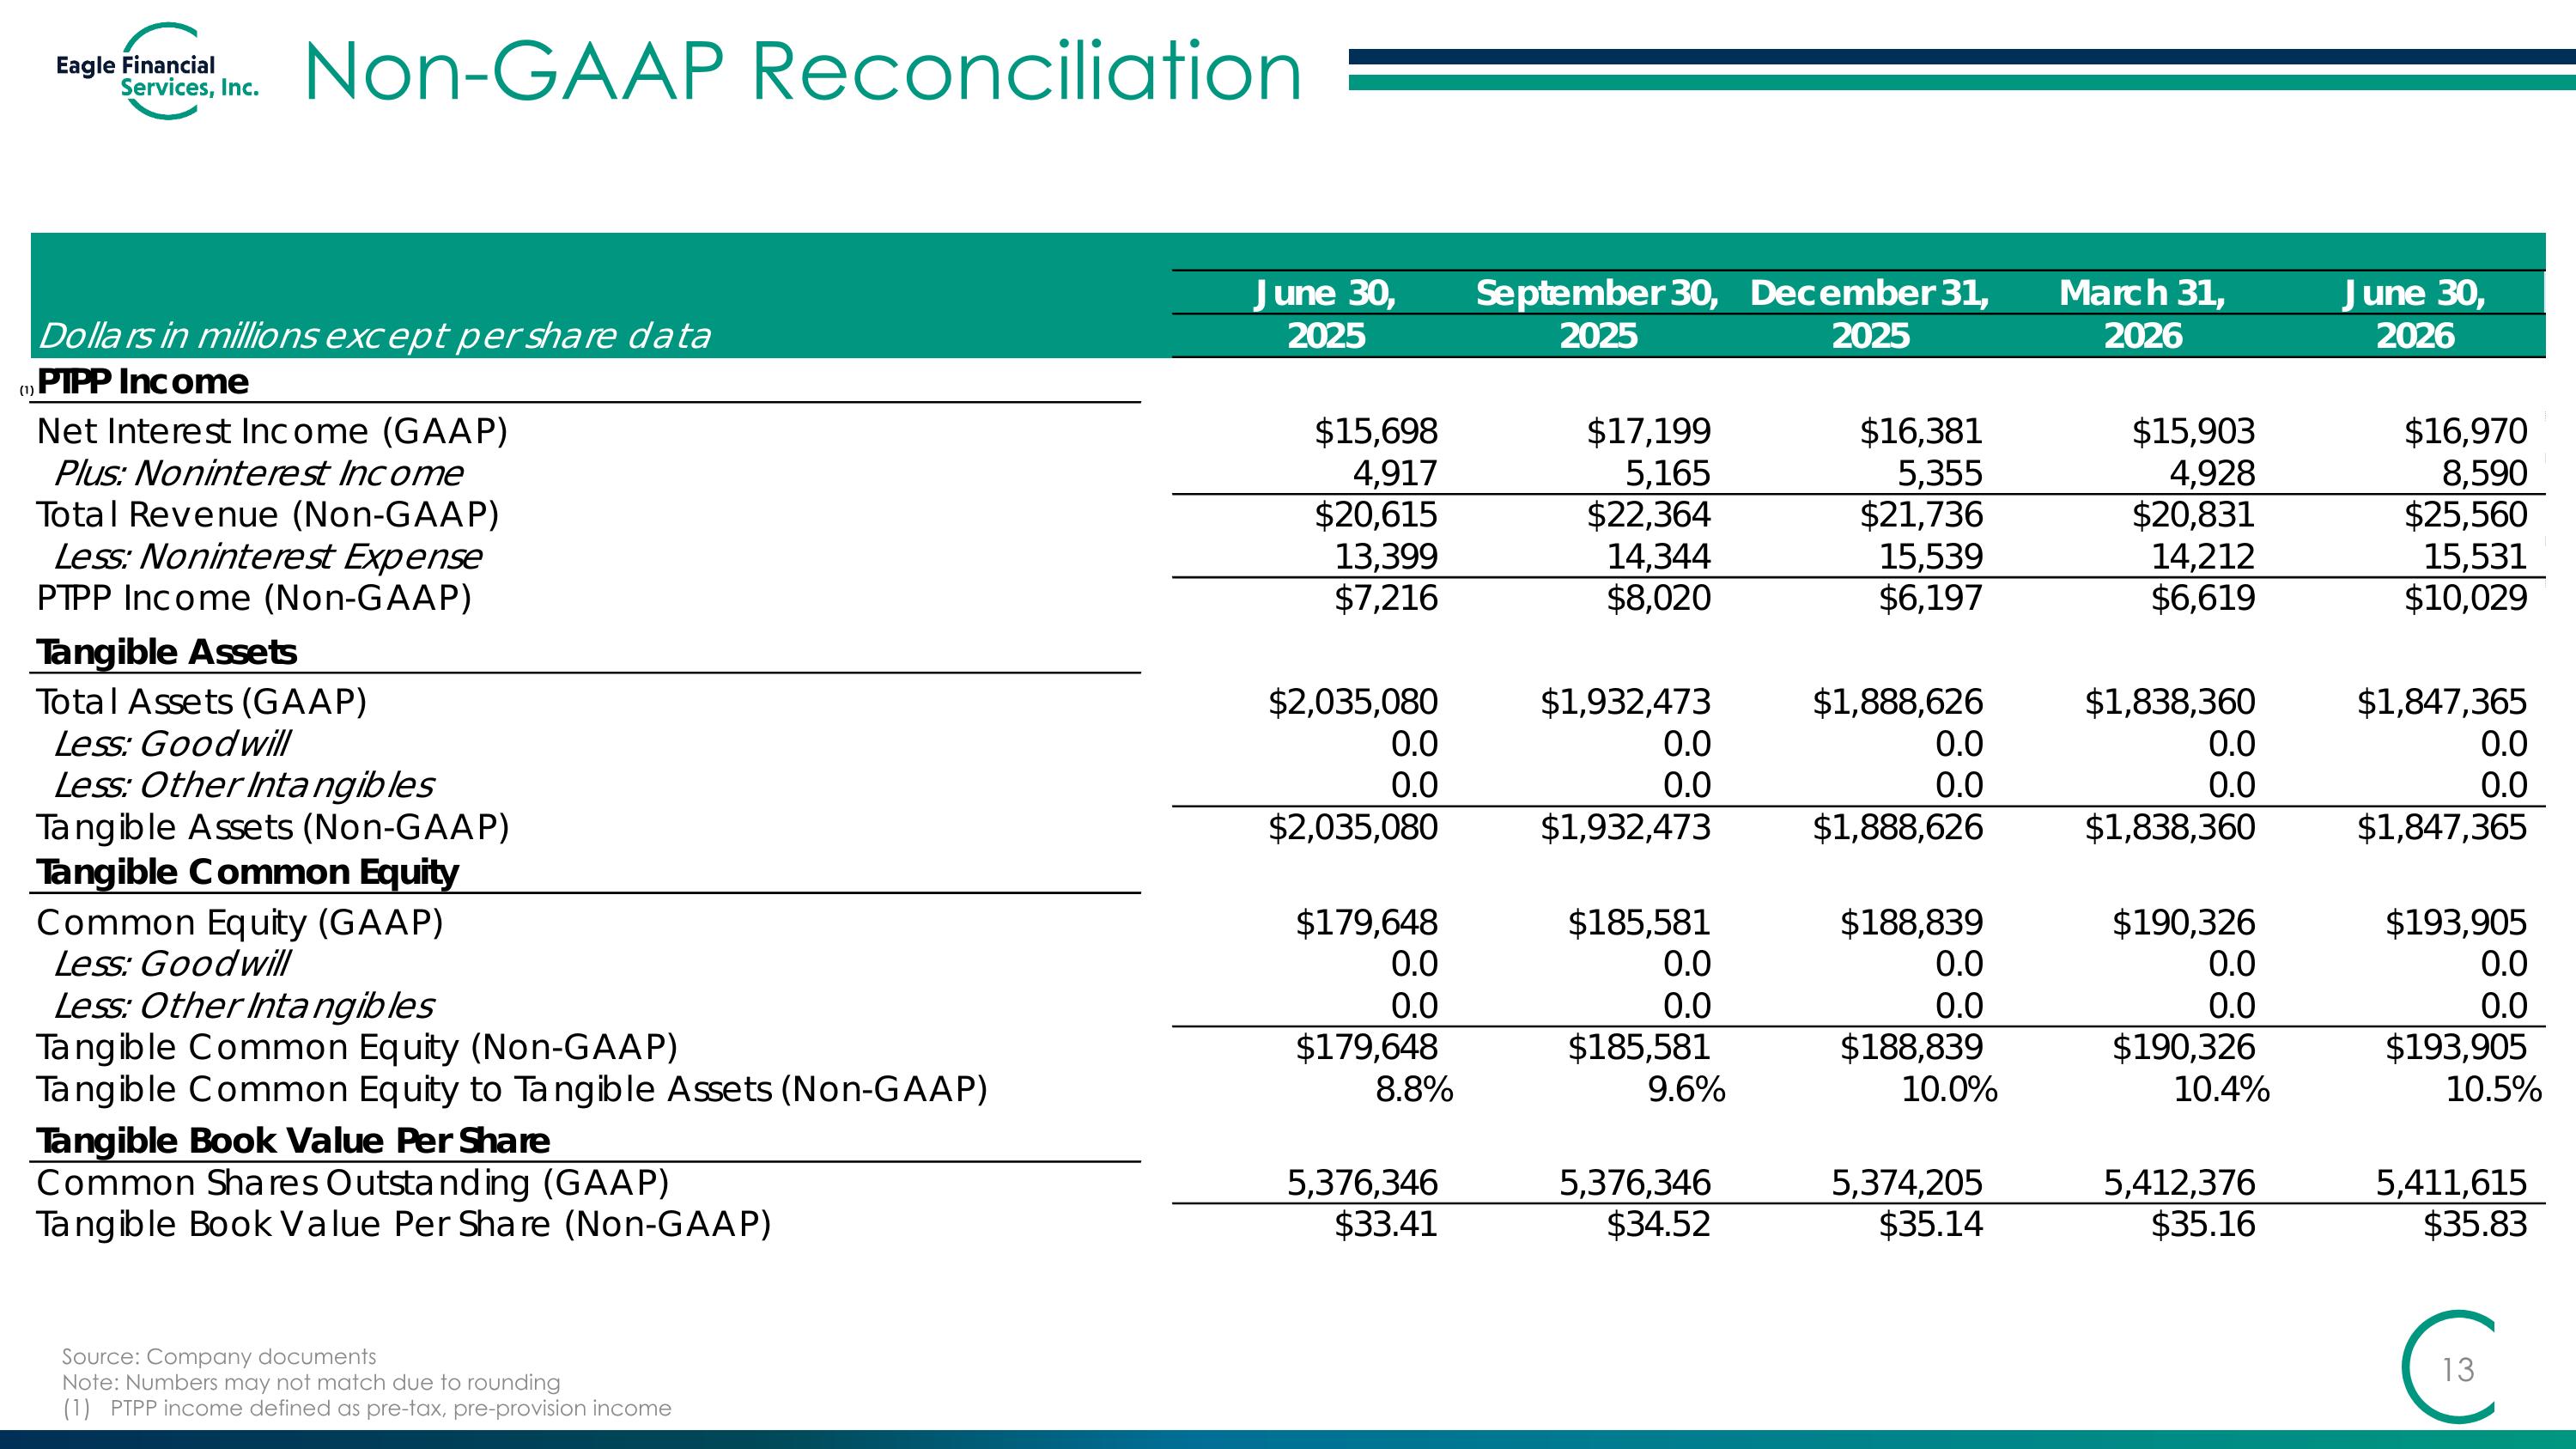
Non-GAAP Reconciliation Source: Company documents Note: Numbers may not match due to rounding PTPP income defined as pre-tax, pre-provision income (1)
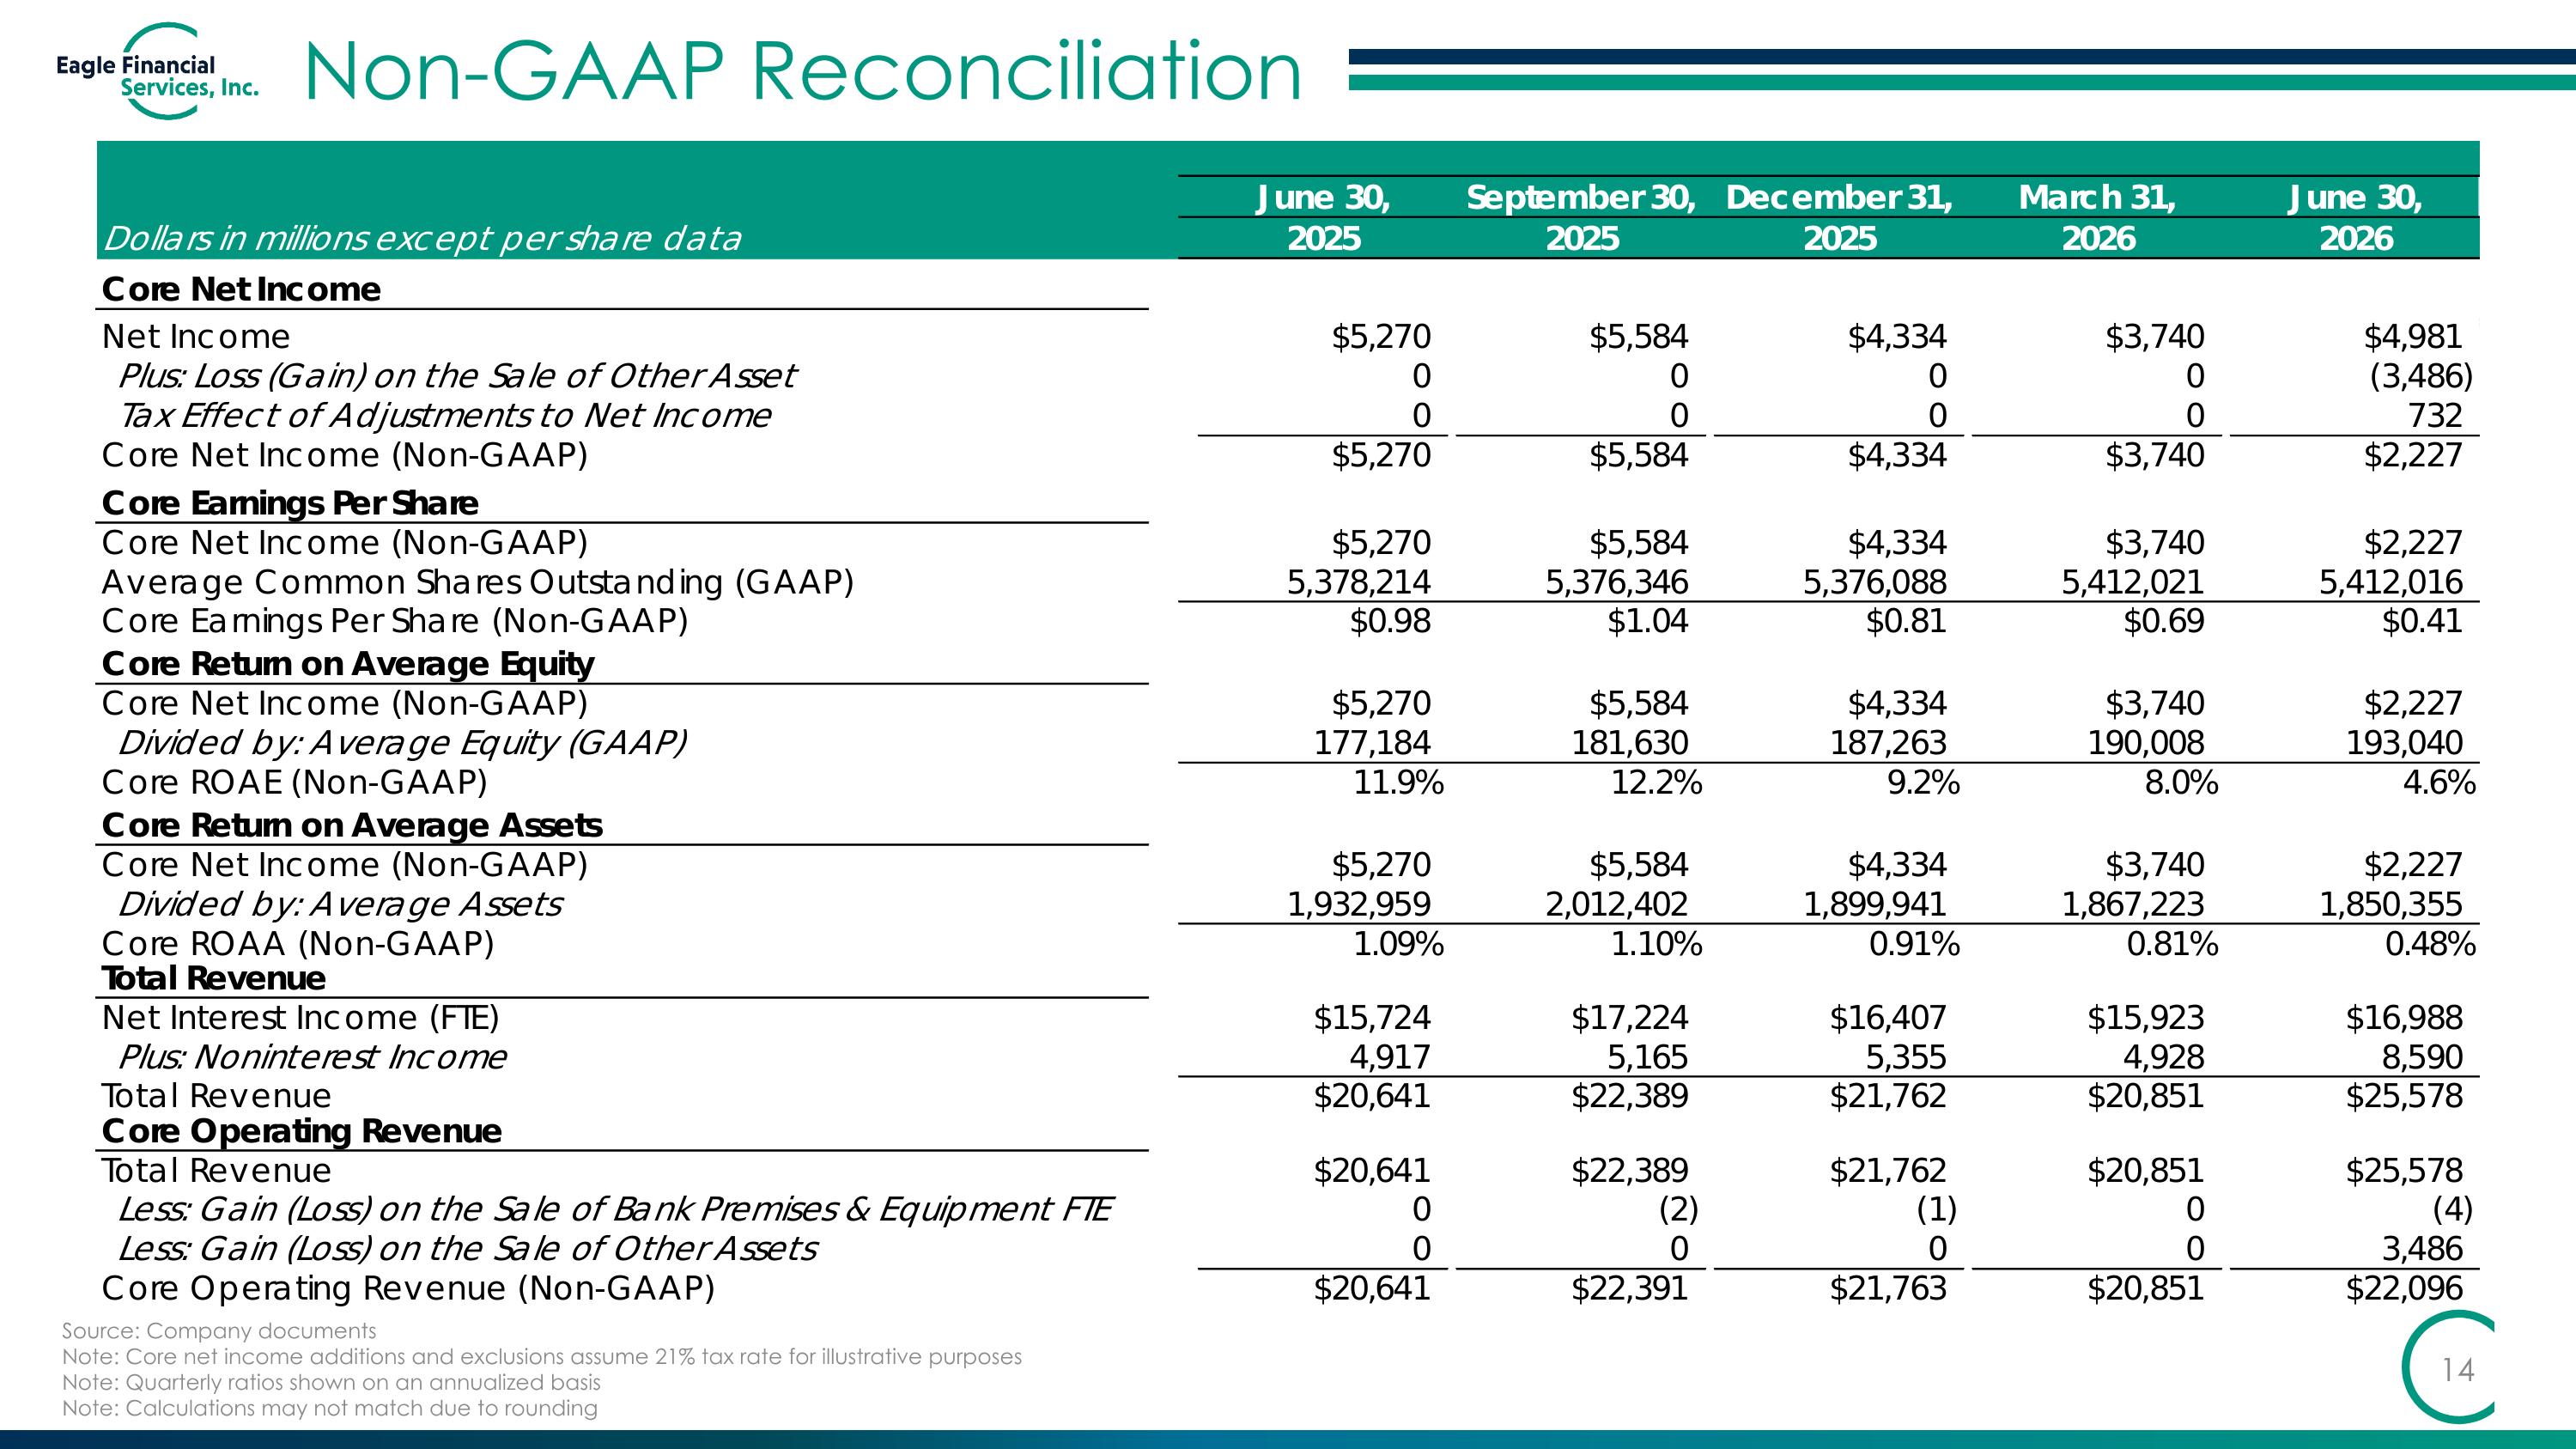
Non-GAAP Reconciliation Source: Company documents Note: Core net income additions and exclusions assume 21% tax rate for illustrative purposes Note: Quarterly ratios shown on an annualized basis Note: Calculations may not match due to rounding