Exhibit 99.2
| Ensuring our Clients and Our Institution Succeed Boldly Listed as ESQ Esquire Financial Holdings, Inc. (Financial Holding Company for Esquire Bank, N.A.) 2Q 2026 Investor Presentation Exhibit 99.2 |

| Forward Looking Disclosure This presentation includes “forward-looking statements” within the meaning of the Private Securities Litigation Reform Act of 1995 relating to future results of the Company. Forward-looking statements are subject to many risks and uncertainties, including, but not limited to: changes in business plans as circumstances warrant; changes in general economic, business and political conditions, including changes in the financial markets; the ability to complete, or any delays in completing, the pending merger between the Company and Signature; any failure to realize the anticipated benefits of the transaction when expected or at all; certain restrictions during the pendency of the transaction that may impact the Company’s ability to pursue, certain business opportunities or strategic transactions; the possibility that the transaction may be more expensive to complete than anticipated, including as a result of unexpected factors or events, diversion of management’s attention from ongoing business operations and opportunities; potential adverse reactions or changes to business or employee relationships, including those resulting from the completion of the merger and integration of the companies and other risks detailed in the “Cautionary Note Regarding Forward-Looking Statements,” “Risk Factors” and other sections of the Company’s Annual Report on Form 10-K and Quarterly Reports on Form 10-Q as filed with the Securities and Exchange Commission. The forward-looking statements included in this press release are not a guarantee of future events, and that actual events may differ materially from those made in or suggested by the forward-looking statements. Forward-looking statements generally can be identified by the use of forward-looking terminology such as “may,” “might,” “should,” “could,” “predict,” “potential,” “believe,” “expect,” “attribute,” “continue,” “will,” “anticipate,” “seek,” “estimate,” “intend,” “plan,” “projection,” “goal,” “target,” “aim,” “would,” “annualized” and “outlook,” or similar terminology. Any forward-looking statements presented herein are made only as of the date of this press release, and the Company does not undertake any obligation to update or revise any forward-looking statements to reflect changes in assumptions, the occurrence of unanticipated events, or otherwise, except as may be required by law.The forward-looking statements speak as of the date of this presentation. The delivery of this presentation shall not, under any circumstances, create any implication there has been no change in the affairs of the Company after the date hereof. This presentation includes industry and market data that we obtained from periodic industry publications, third-party studies and surveys. Industry publications and surveys generally state that the information contained therein has been obtained from sources believed to be reliable. Although we believe the industry and market data to be reliable as of the date of this presentation, this information could prove to be inaccurate. Industry and market data could be wrong because of the method by which sources obtained their data and because information cannot always be verified with complete certainty due to the limits on the availability and reliability of raw data, the voluntary nature of the data gathering process and other limitations and uncertainties. In addition, we do not know all of the assumptions regarding general economic conditions or growth that were used in preparing the forecasts from the sources relied upon or cited herein. This presentation contains financial information determined by methods other than in accordance with accounting principles generally accepted in the United States of America (“GAAP”). We believe that these non-GAAP financial measures provide information that is important to investors and that is useful in understanding our financial position, results and ratios. However, these non-GAAP financial measures are supplemental and are not a substitute for an analysis based on GAAP measures. As other companies may use different calculations for this measure, this presentation may not be comparable to other similarly titled measures by other companies. These disclosures should not be viewed as a substitute for operating results determined in accordance with GAAP, nor are they necessarily comparable to non-GAAP performance measures that may be presented by other companies. A reconciliation of the non-GAAP measures used in this presentation to the most directly comparable GAAP measures is provided in the Appendix to this presentation. 2 |
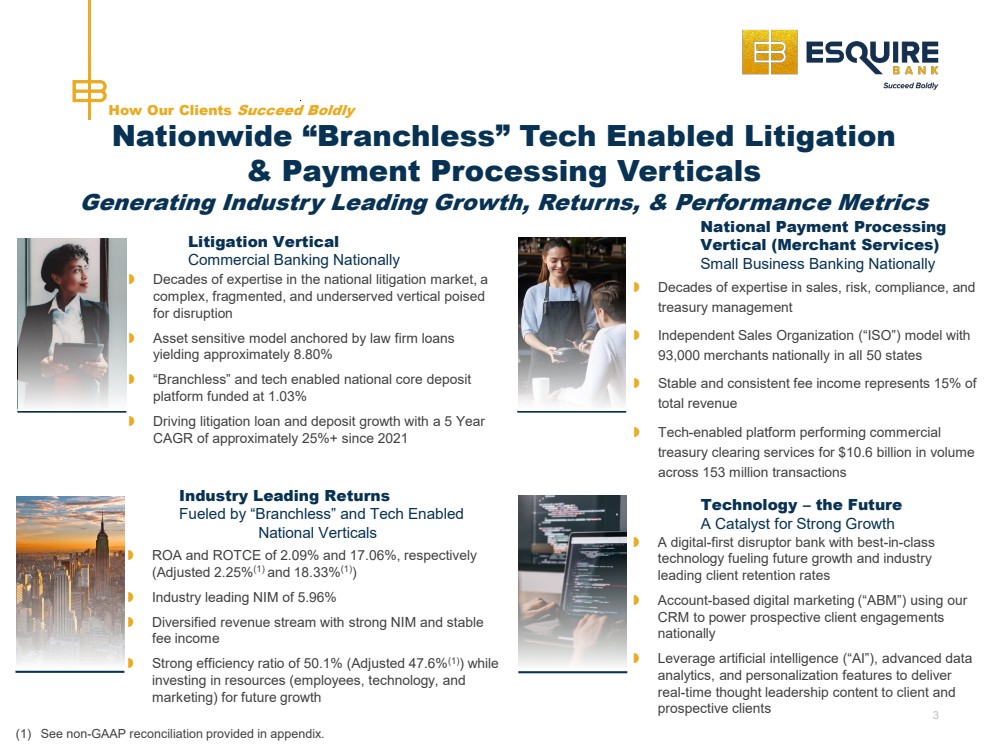
| Decades of expertise in the national litigation market, a complex, fragmented, and underserved vertical poised for disruption Asset sensitive model anchored by law firm loans yielding approximately 8.80% “Branchless” and tech enabled national core deposit platform funded at 1.03% Driving litigation loan and deposit growth with a 5 Year CAGR of approximately 25%+ since 2021 Decades of expertise in sales, risk, compliance, and treasury management Independent Sales Organization (“ISO”) model with 93,000 merchants nationally in all 50 states Stable and consistent fee income represents 15% of total revenue Tech-enabled platform performing commercial treasury clearing services for $10.6 billion in volume across 153 million transactions ROA and ROTCE of 2.09% and 17.06%, respectively (Adjusted 2.25%(1) and 18.33%(1)) Industry leading NIM of 5.96% Diversified revenue stream with strong NIM and stable fee income Strong efficiency ratio of 50.1% (Adjusted 47.6%(1)) while investing in resources (employees, technology, and marketing) for future growth A digital-first disruptor bank with best-in-class technology fueling future growth and industry leading client retention rates Account-based digital marketing (“ABM”) using our CRM to power prospective client engagements nationally Leverage artificial intelligence (“AI”), advanced data analytics, and personalization features to deliver real-time thought leadership content to client and prospective clients Nationwide “Branchless” Tech Enabled Litigation & Payment Processing Verticals Generating Industry Leading Growth, Returns, & Performance Metrics Litigation Vertical Commercial Banking Nationally Industry Leading Returns Fueled by “Branchless” and Tech Enabled National Verticals National Payment Processing Vertical (Merchant Services) Small Business Banking Nationally Technology – the Future A Catalyst for Strong Growth 3 How Our Clients Succeed Boldly (1) See non-GAAP reconciliation provided in appendix. |
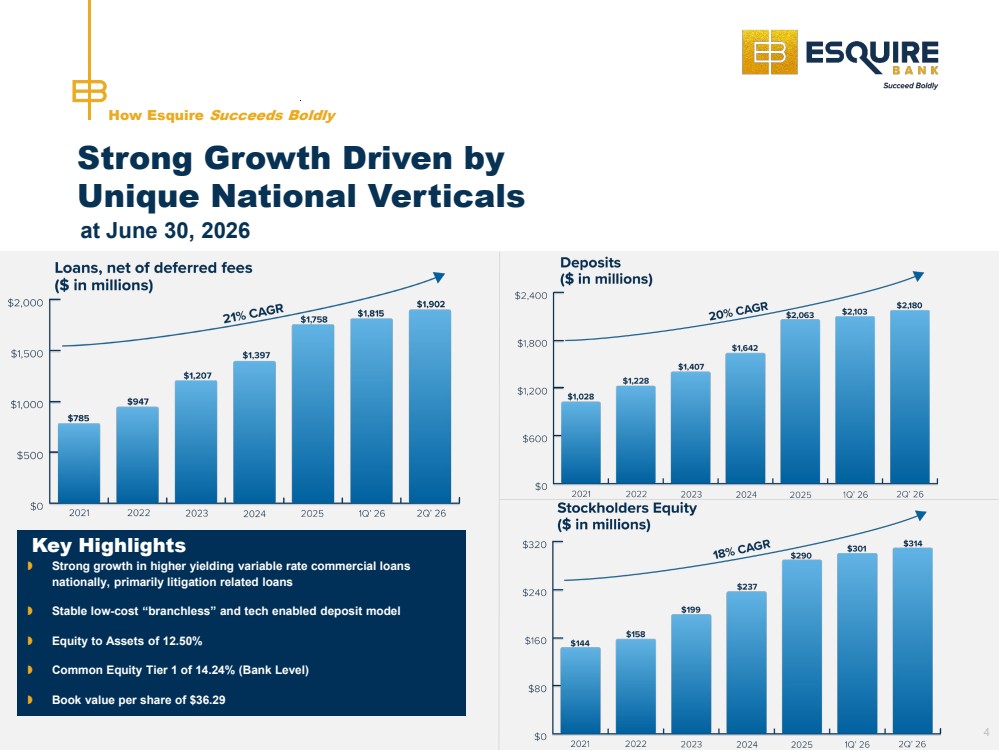
| Strong Growth Driven by Unique National Verticals How Esquire Succeeds Boldly Key Highlights Strong growth in higher yielding variable rate commercial loans nationally, primarily litigation related loans Stable low-cost “branchless” and tech enabled deposit model Equity to Assets of 12.50% Common Equity Tier 1 of 14.24% (Bank Level) Book value per share of $36.29 4 at June 30, 2026 |
| Stable low-cost “branchless” funding model with a strong commercial deposit franchise nationally DDA and escrow-based IOLTA accounts represent 25% and 60% of total deposits at June 30, 2026, respectively Higher yielding variable rate commercial loans anchored by our national litigation portfolio Asset sensitive balance sheet with approximately 90% of our variable rate commercial loans having one-year interest rate floors at their origination or renewal dates Resilient net interest margin despite significant declines in short-term rates since 2023 How Esquire Succeeds Boldly 5 Resilient Industry Leading Net Interest Margin |
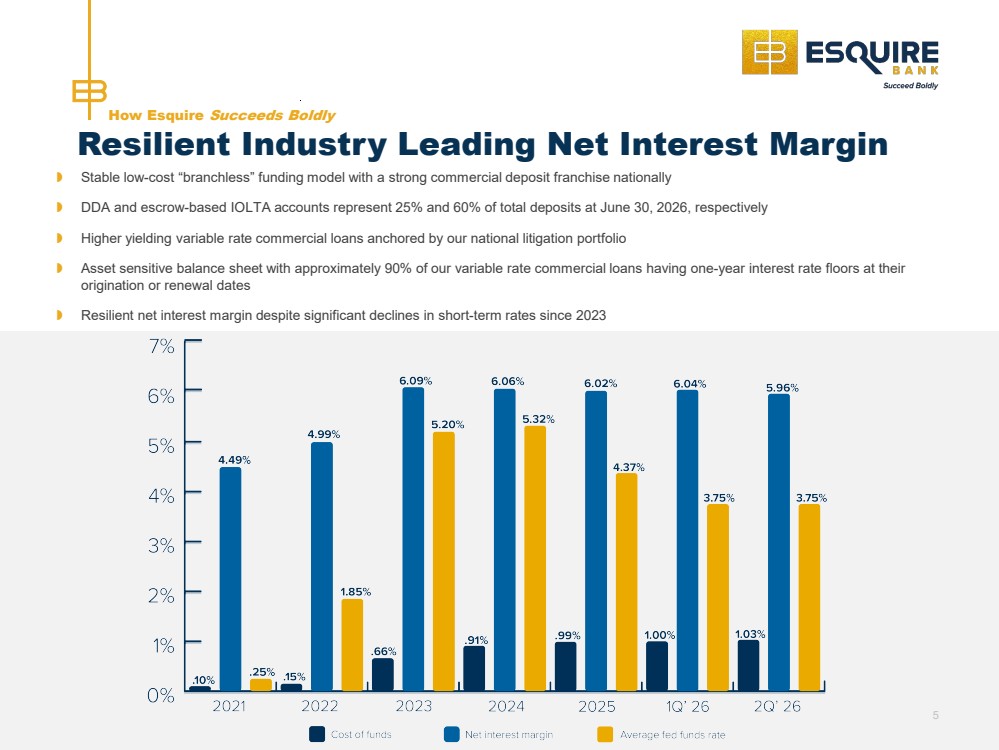
| Strong Revenue Growth ($ in thousands) at June 30, 2026 How Esquire Succeeds Boldly 6 Key Highlights Strong and resilient net interest margin Stable payment processing fee income Growing ASP fee income derived from off-balance sheet funds management |
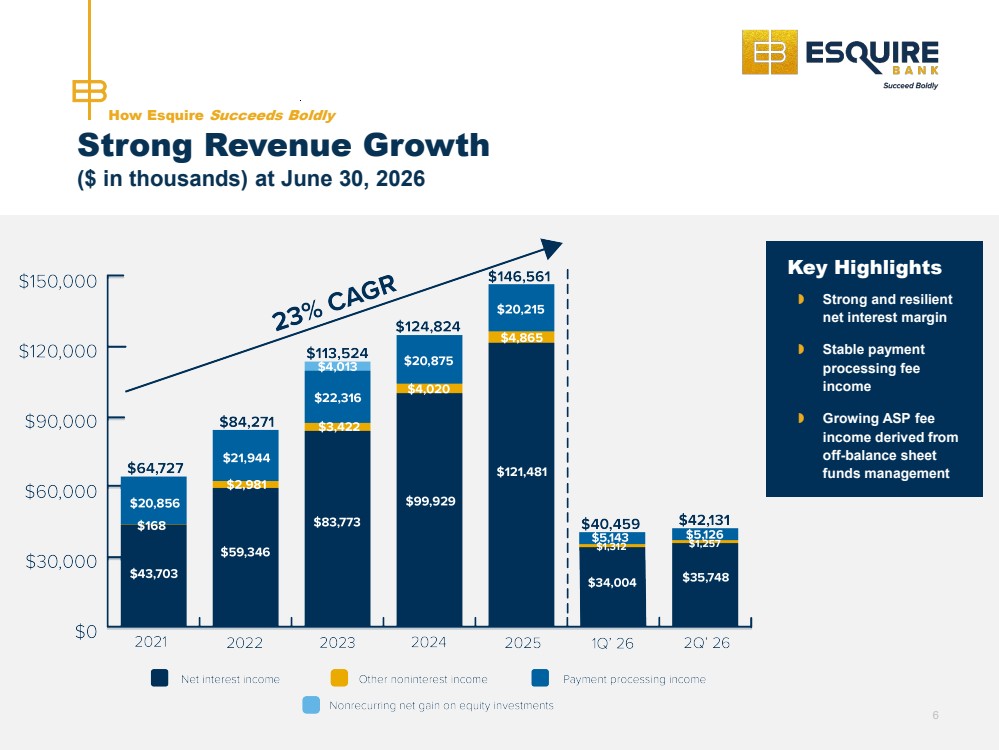
| Consistent Industry Leading Performance & Growth How Esquire Succeeds Boldly Industry Recognition & Awards #1 Best Law Firm Funding Provider in The Recorder’s 2026 “Best Of” survey KBW 2026 Bank Honor Roll for the third consecutive year 2025 Raymond James Community Bankers Cup for the eighth consecutive year Piper Sandler 2025 Bank & Thrift Sm-All Stars for the third time in several years Best-Performing Community Bank List of 2024 & 2025 by S&P Global Top 10 merchant acquiring bank by the Nilson Report Best In Class Marketer by the Association of National Advertisers B2 Awards in 2025 for the third consecutive year 7 at June 30, 2026 (1) See non-GAAP reconciliation provided at the end of this presentation |
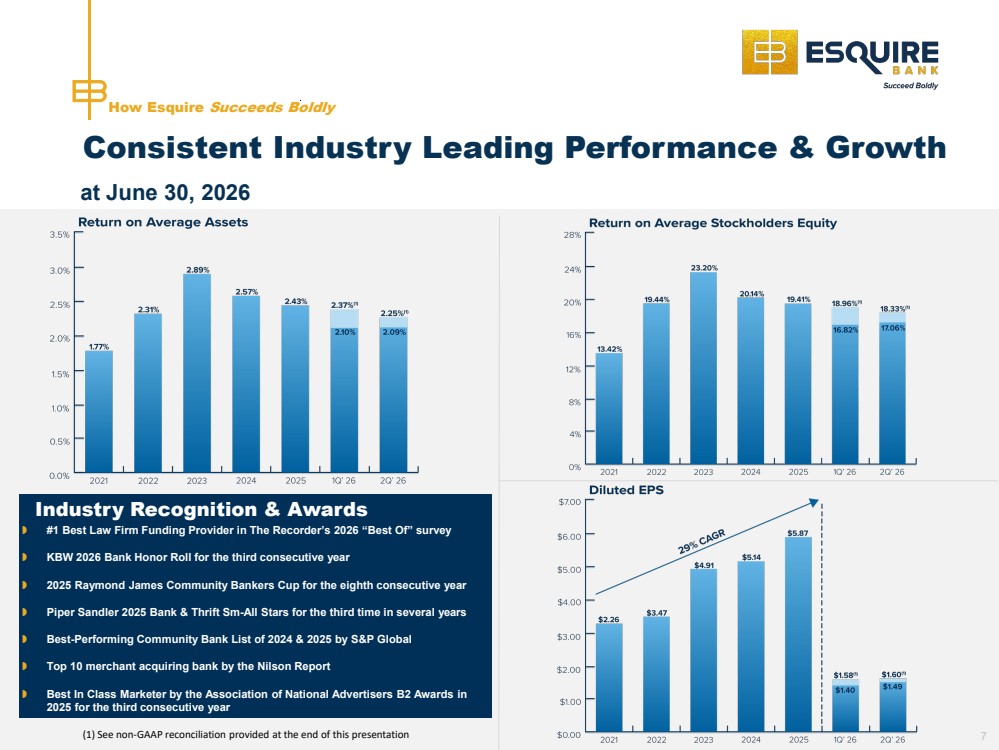
| Loan Portfolio Diversification with Focused Growth Focused growth in higher yielding variable rate commercial litigation related loans with strong credit metrics on a national basis Selective commercial real estate loan growth with strong historical performance, DSCRs, and LTVs in the NY metro market How Esquire Succeeds Boldly 8 at June 30, 2026 |
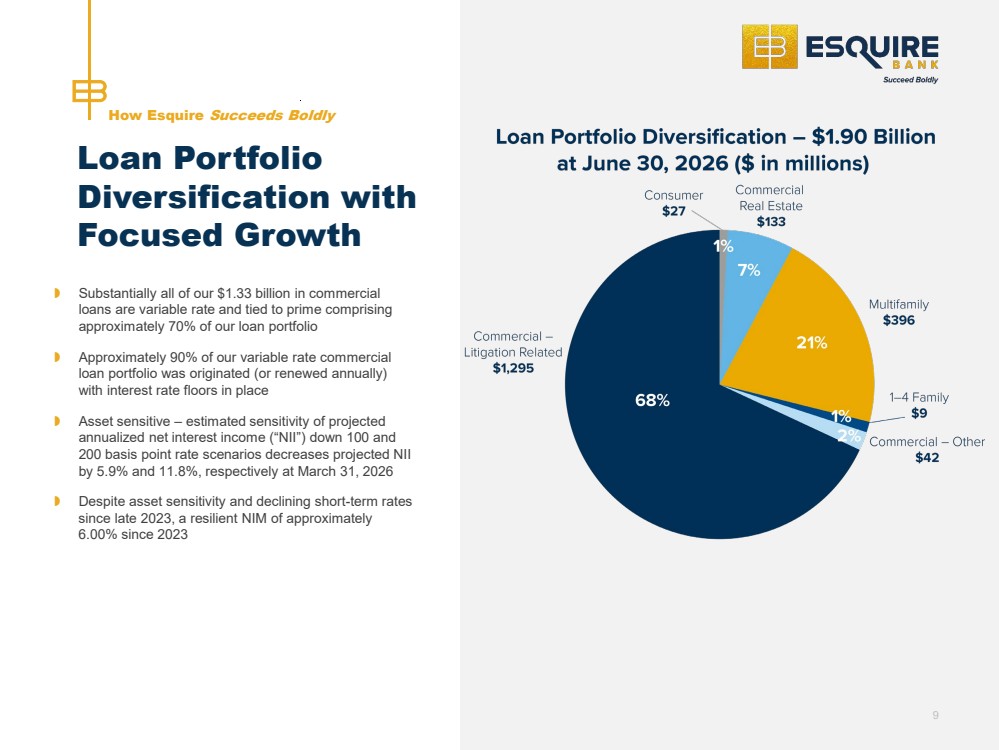
| Substantially all of our $1.33 billion in commercial loans are variable rate and tied to prime comprising approximately 70% of our loan portfolio Approximately 90% of our variable rate commercial loan portfolio was originated (or renewed annually) with interest rate floors in place Asset sensitive – estimated sensitivity of projected annualized net interest income (“NII”) down 100 and 200 basis point rate scenarios decreases projected NII by 5.9% and 11.8%, respectively at March 31, 2026 Despite asset sensitivity and declining short -term rates since late 2023, a resilient NIM of approximately 6.00% since 2023 Loan Portfolio Diversification with Focused Growth How Esquire Succeeds Boldly 9 |
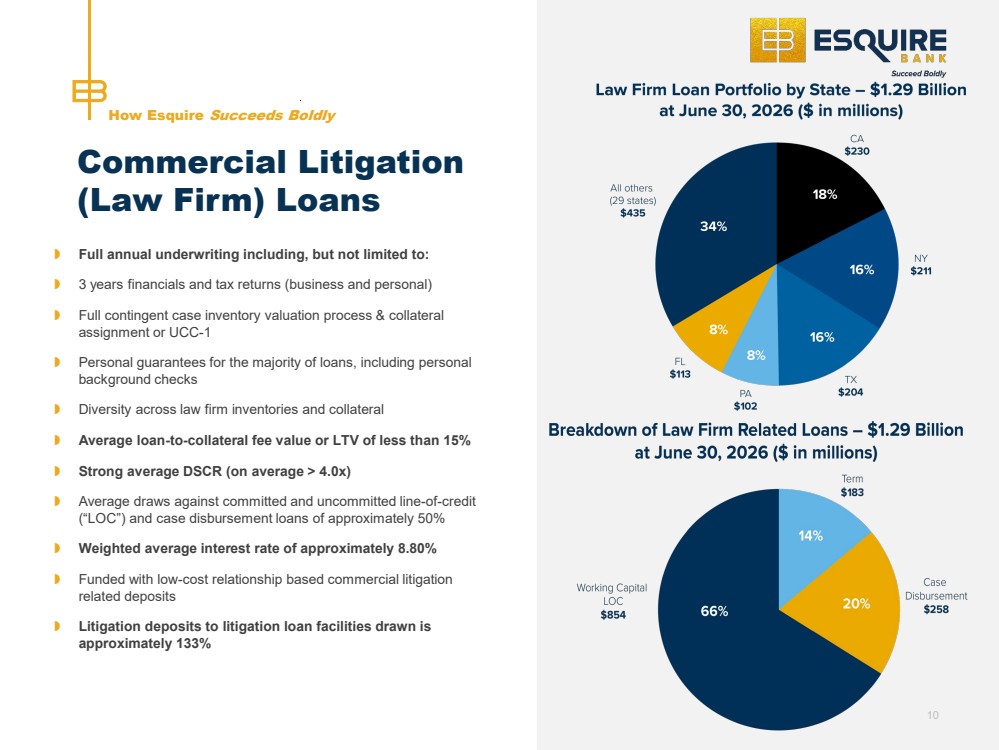
| Commercial Litigation (Law Firm) Loans Full annual underwriting including, but not limited to: 3 years financials and tax returns (business and personal) Full contingent case inventory valuation process & collateral assignment or UCC-1 Personal guarantees for the majority of loans, including personal background checks Diversity across law firm inventories and collateral Average loan-to-collateral fee value or LTV of less than 15% Strong average DSCR (on average > 4.0x) Average draws against committed and uncommitted line-of-credit (“LOC”) and case disbursement loans of approximately 50% Weighted average interest rate of approximately 8.80% Funded with low-cost relationship based commercial litigation related deposits Litigation deposits to litigation loan facilities drawn is approximately 133% How Esquire Succeeds Boldly 10 |
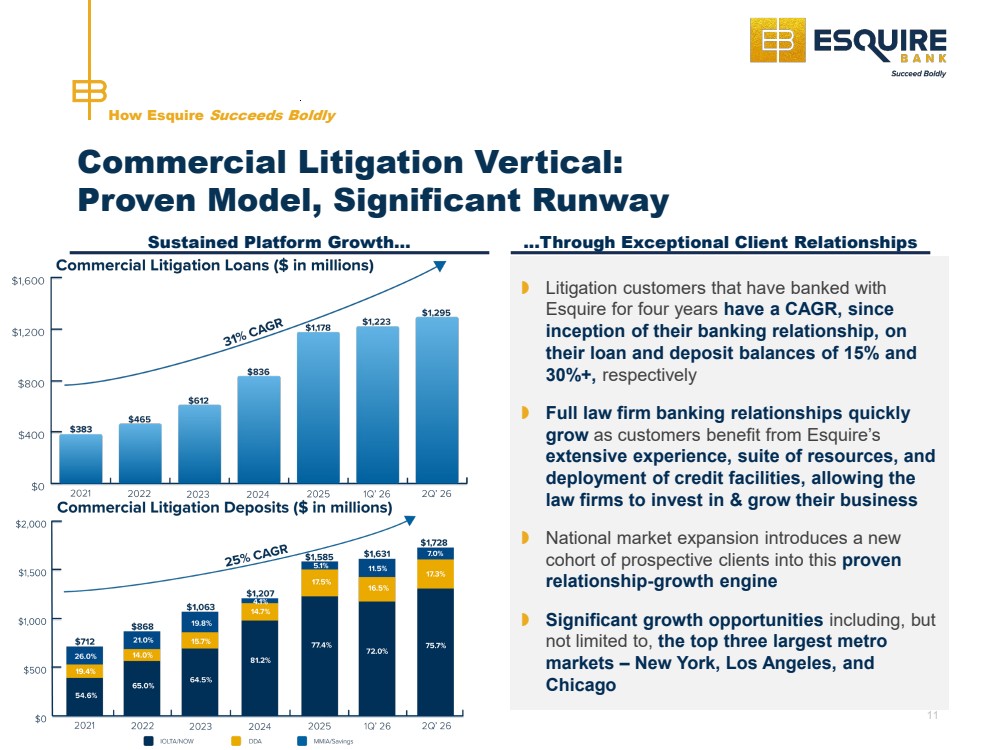
| Commercial Litigation Vertical: Proven Model, Significant Runway How Esquire Succeeds Boldly 11 Sustained Platform Growth… ...Through Exceptional Client Relationships Litigation customers that have banked with Esquire for four years have a CAGR, since inception of their banking relationship, on their loan and deposit balances of 15% and 30%+, respectively Full law firm banking relationships quickly grow as customers benefit from Esquire’s extensive experience, suite of resources, and deployment of credit facilities, allowing the law firms to invest in & grow their business National market expansion introduces a new cohort of prospective clients into this proven relationship-growth engine Significant growth opportunities including, but not limited to, the top three largest metro markets – New York, Los Angeles, and Chicago |
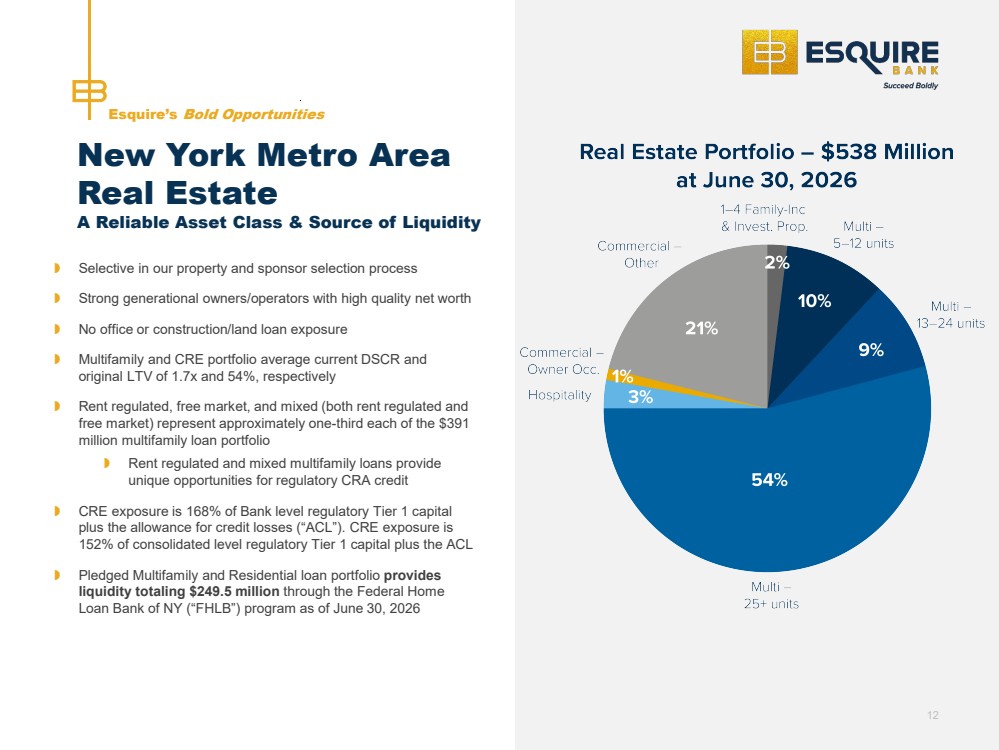
| Esquire’s Bold Opportunities New York Metro Area Real Estate A Reliable Asset Class & Source of Liquidity Selective in our property and sponsor selection process Strong generational owners/operators with high quality net worth No office or construction/land loan exposure Multifamily and CRE portfolio average current DSCR and original LTV of 1.7x and 54%, respectively Rent regulated, free market, and mixed (both rent regulated and free market) represent approximately one -third each of the $391 million multifamily loan portfolio Rent regulated and mixed multifamily loans provide unique opportunities for regulatory CRA credit CRE exposure is 168% of Bank level regulatory Tier 1 capital plus the allowance for credit losses (“ACL”). CRE exposure is 152% of consolidated level regulatory Tier 1 capital plus the ACL Pledged Multifamily and Residential loan portfolio provides liquidity totaling $249.5 million through the Federal Home Loan Bank of NY (“FHLB”) program as of June 30, 2026 12 |
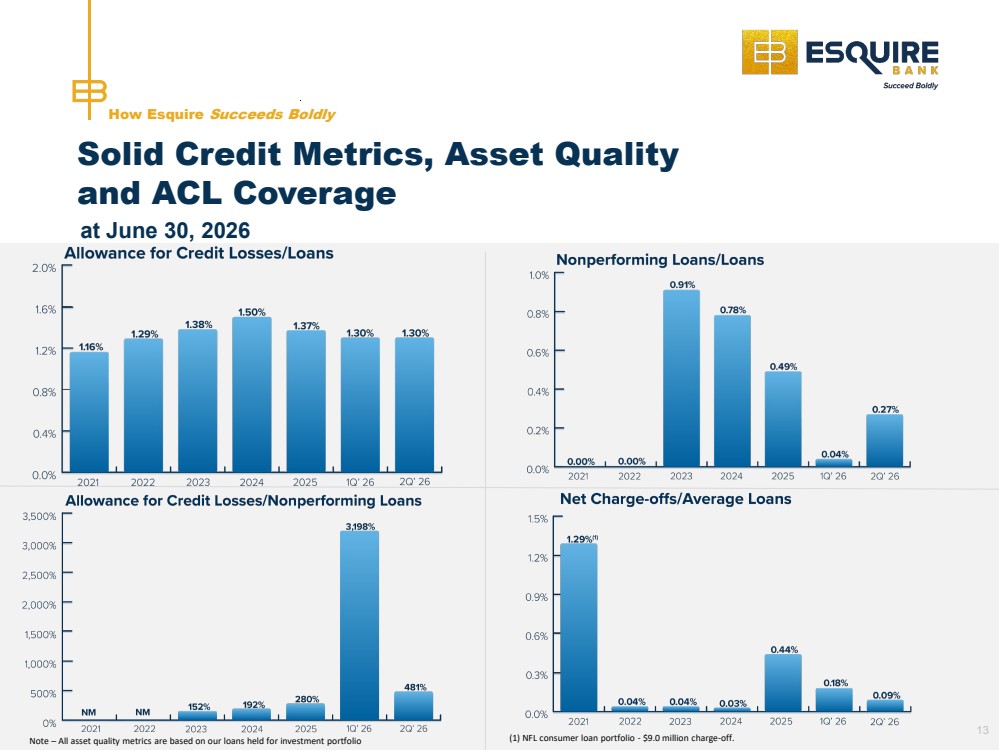
| Solid Credit Metrics, Asset Quality and ACL Coverage How Esquire Succeeds Boldly at June 30, 2026 Note – All asset quality metrics are based on our loans held for investment portfolio (1) NFL consumer loan portfolio - $9.0 million charge-off. 13 |
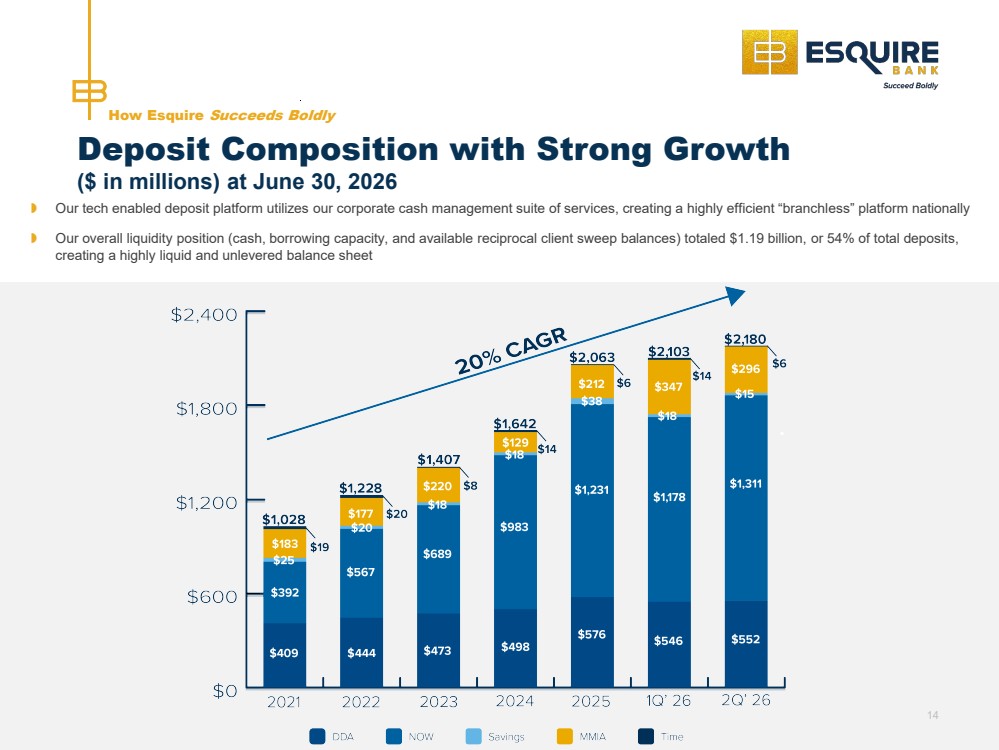
| Deposit Composition with Strong Growth Our tech enabled deposit platform utilizes our corporate cash management suite of services, creating a highly efficient “branchless” platform nationally Our overall liquidity position (cash, borrowing capacity, and available reciprocal client sweep balances) totaled $1.19 billion, or 54% of total deposits, creating a highly liquid and unlevered balance sheet How Esquire Succeeds Boldly 14 ($ in millions) at June 30, 2026 |
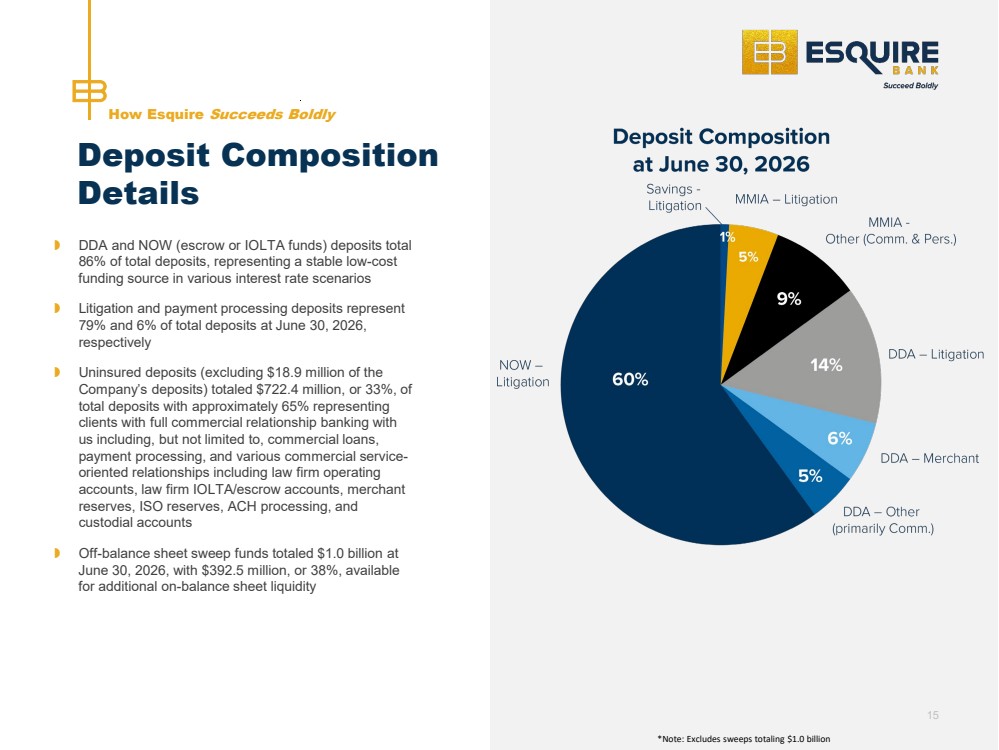
| *Note: Excludes sweeps totaling $1.0 billion Deposit Composition Details DDA and NOW (escrow or IOLTA funds) deposits total 86% of total deposits, representing a stable low-cost funding source in various interest rate scenarios Litigation and payment processing deposits represent 79% and 6% of total deposits at June 30, 2026, respectively Uninsured deposits (excluding $18.9 million of the Company’s deposits) totaled $722.4 million, or 33%, of total deposits with approximately 65% representing clients with full commercial relationship banking with us including, but not limited to, commercial loans, payment processing, and various commercial service-oriented relationships including law firm operating accounts, law firm IOLTA/escrow accounts, merchant reserves, ISO reserves, ACH processing, and custodial accounts Off-balance sheet sweep funds totaled $1.0 billion at June 30, 2026, with $392.5 million, or 38%, available for additional on-balance sheet liquidity How Esquire Succeeds Boldly 15 |
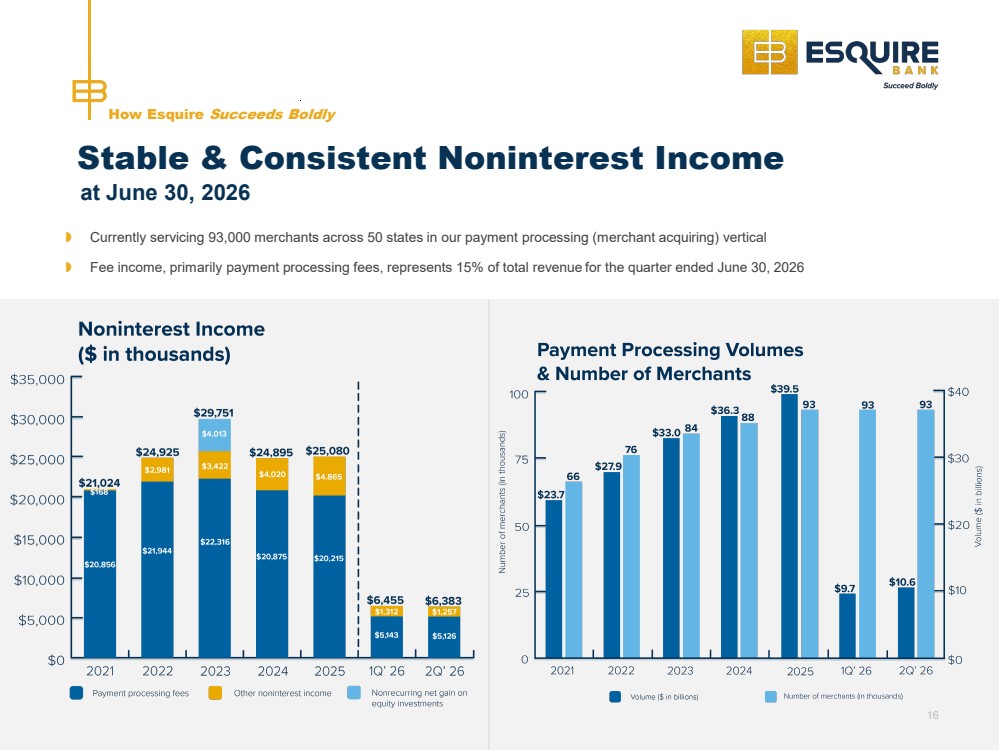
| Currently servicing 93,000 merchants across 50 states in our payment processing (merchant acquiring) vertical Fee income, primarily payment processing fees, represents 15% of total revenue for the quarter ended June 30, 2026 How Esquire Succeeds Boldly Stable & Consistent Noninterest Income at June 30, 2026 16 |
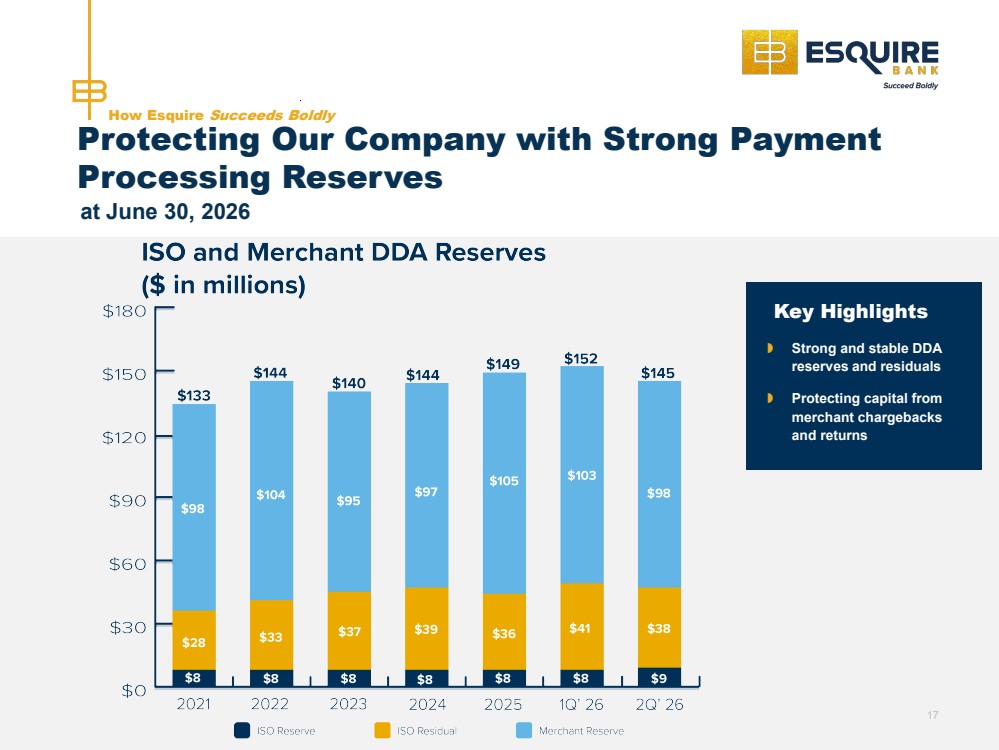
| How Esquire Succeeds Boldly Key Highlights Strong and stable DDA reserves and residuals Protecting capital from merchant chargebacks and returns 17 Protecting Our Company with Strong Payment Processing Reserves at June 30, 2026 |
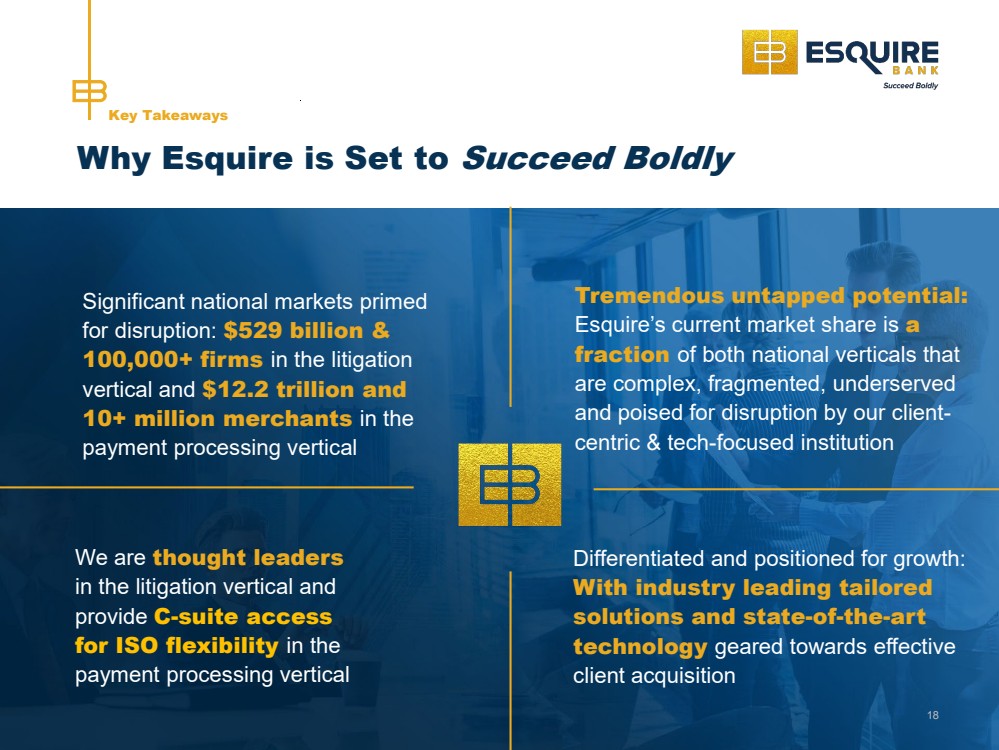
| Significant national markets primed for disruption: $529 billion & 100,000+ firms in the litigation vertical and $12.2 trillion and 10+ million merchants in the payment processing vertical Key Takeaways Why Esquire is Set to Succeed Boldly Tremendous untapped potential: Esquire’s current market share is a fraction of both national verticals that are complex, fragmented, underserved and poised for disruption by our client-centric & tech-focused institution We are thought leaders in the litigation vertical and provide C-suite access for ISO flexibility in the payment processing vertical Differentiated and positioned for growth: With industry leading tailored solutions and state-of-the-art technology geared towards effective client acquisition 18 |
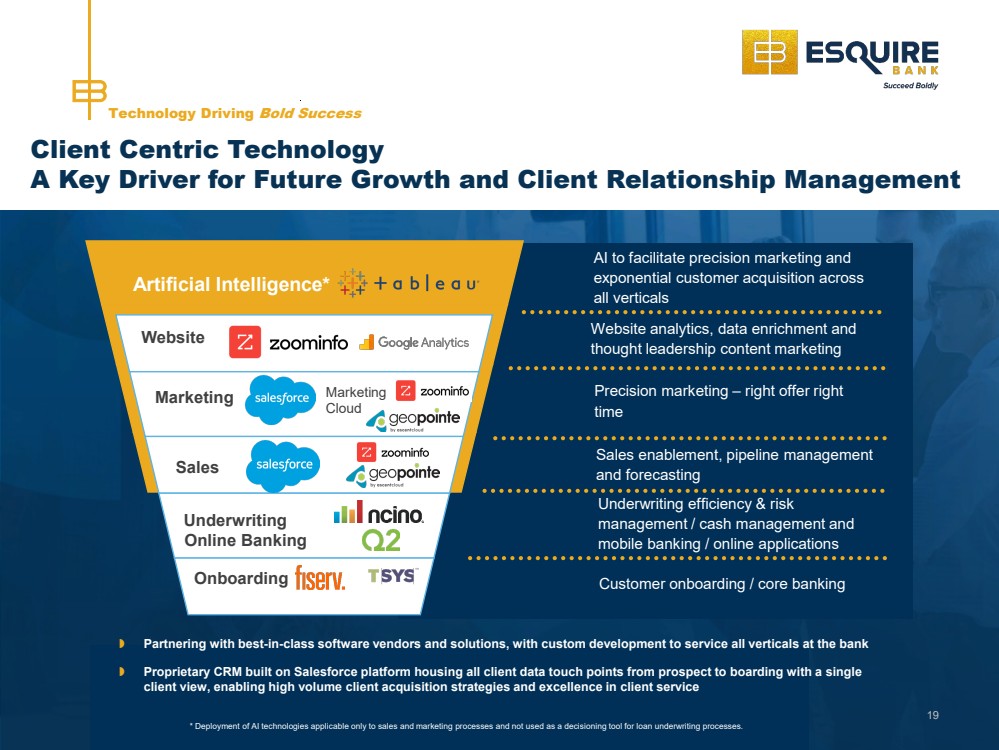
| Technology Driving Bold Success Client Centric Technology A Key Driver for Future Growth and Client Relationship Management Website Artificial Intelligence* Marketing Sales Underwriting Onboarding Marketing Cloud AI to facilitate precision marketing and exponential customer acquisition across all verticals Website analytics, data enrichment and thought leadership content marketing Precision marketing – right offer right time Sales enablement, pipeline management and forecasting Underwriting efficiency & risk management / cash management and mobile banking / online applications Customer onboarding / core banking Partnering with best-in-class software vendors and solutions, with custom development to service all verticals at the bank Proprietary CRM built on Salesforce platform housing all client data touch points from prospect to boarding with a single client view, enabling high volume client acquisition strategies and excellence in client service * Deployment of AI technologies applicable only to sales and marketing processes and not used as a decisioning tool for loan underwriting processes. 19 Online Banking |
| Succeeding Boldly Listed as ESQ Contact Information: Eric S. Bader Executive Vice President & Chief Operating Officer 516-535-2002 eric.bader@esqbank.com |
| Appendix & Supplemental Disclosure National Markets – Litigation & Payment Processing Verticals & Non-GAAP Reconciliation |

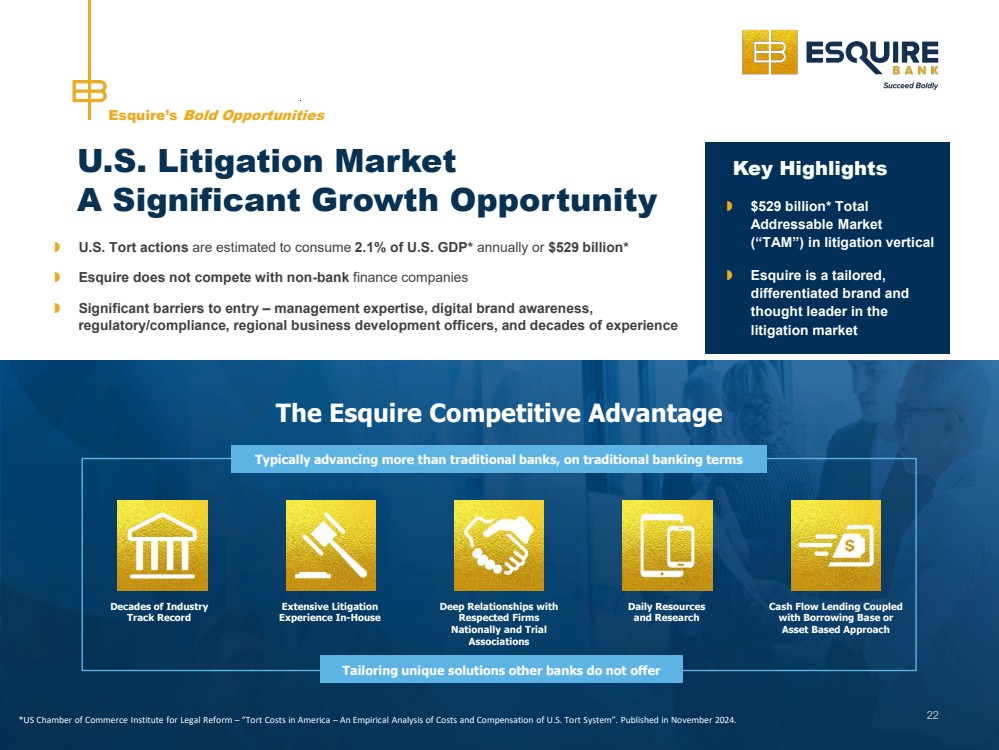
| The Esquire Competitive Advantage Esquire’s Bold Opportunities U.S. Litigation Market A Significant Growth Opportunity U.S. Tort actions are estimated to consume 2.1% of U.S. GDP* annually or $529 billion* Esquire does not compete with non-bank finance companies Significant barriers to entry – management expertise, digital brand awareness, regulatory/compliance, regional business development officers, and decades of experience Decades of Industry Track Record Extensive Litigation Experience In-House Deep Relationships with Respected Firms Nationally and Trial Associations Daily Resources and Research Cash Flow Lending Coupled with Borrowing Base or Asset Based Approach Tailoring unique solutions other banks do not offer Typically advancing more than traditional banks, on traditional banking terms 22 Key Highlights $529 billion* Total Addressable Market (“TAM”) in litigation vertical Esquire is a tailored, differentiated brand and thought leader in the litigation market *US Chamber of Commerce Institute for Legal Reform – “Tort Costs in America – An Empirical Analysis of Costs and Compensation of U.S. Tort System”. Published in November 2024. |
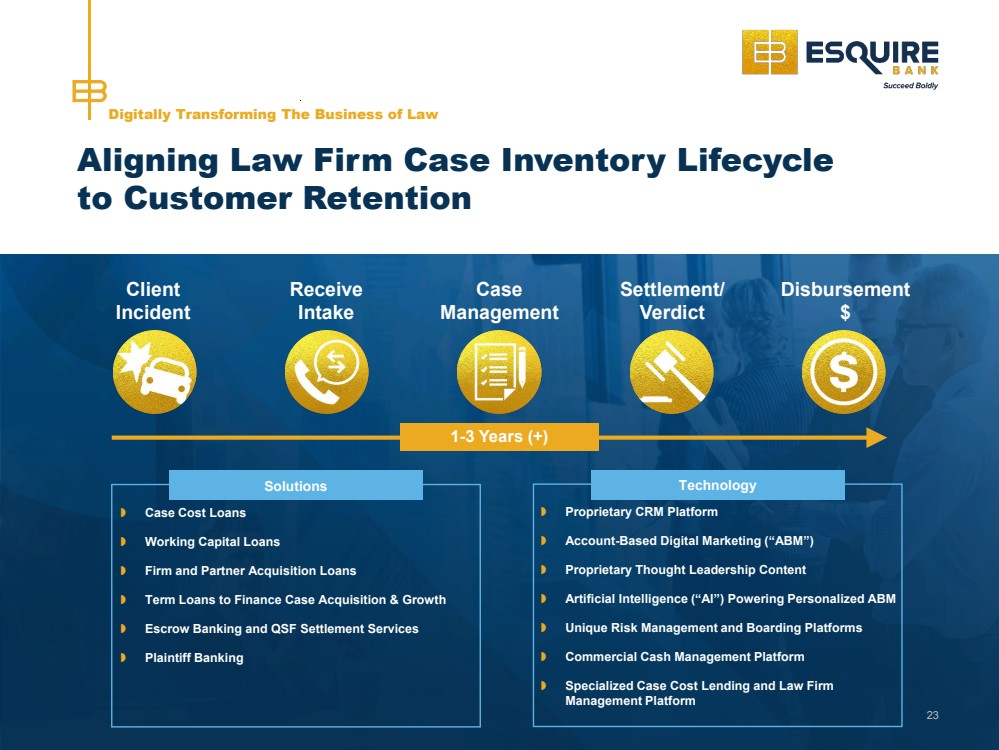
| 23 Digitally Transforming The Business of Law Aligning Law Firm Case Inventory Lifecycle to Customer Retention Client Incident Receive Intake Case Management Settlement/ Verdict Disbursement $ 1-3 Years (+) Solutions Case Cost Loans Working Capital Loans Firm and Partner Acquisition Loans Term Loans to Finance Case Acquisition & Growth Escrow Banking and QSF Settlement Services Plaintiff Banking Technology Proprietary CRM Platform Account-Based Digital Marketing (“ABM”) Proprietary Thought Leadership Content Artificial Intelligence (“AI”) Powering Personalized ABM Unique Risk Management and Boarding Platforms Commercial Cash Management Platform Specialized Case Cost Lending and Law Firm Management Platform 23 |
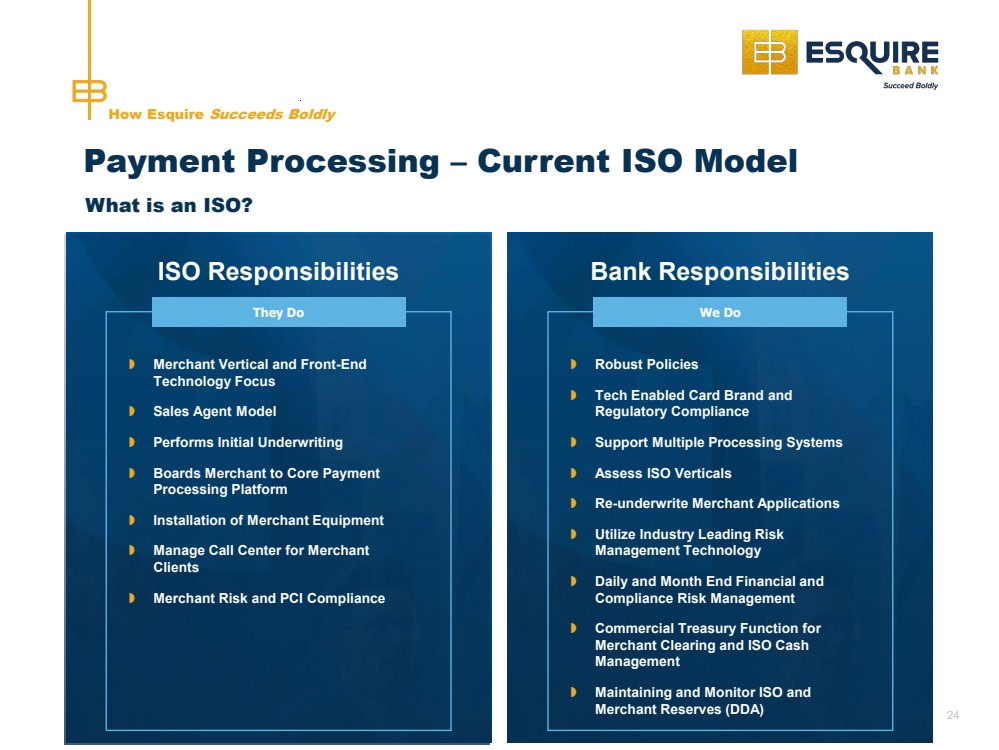
| Payment Processing – Current ISO Model How Esquire Succeeds Boldly What is an ISO? ISO Responsibilities They Do Merchant Vertical and Front-End Technology Focus Sales Agent Model Performs Initial Underwriting Boards Merchant to Core Payment Processing Platform Installation of Merchant Equipment Manage Call Center for Merchant Clients Merchant Risk and PCI Compliance Bank Responsibilities We Do Robust Policies Tech Enabled Card Brand and Regulatory Compliance Support Multiple Processing Systems Assess ISO Verticals Re-underwrite Merchant Applications Utilize Industry Leading Risk Management Technology Daily and Month End Financial and Compliance Risk Management Commercial Treasury Function for Merchant Clearing and ISO Cash Management Maintaining and Monitor ISO and Merchant Reserves (DDA) 24 |
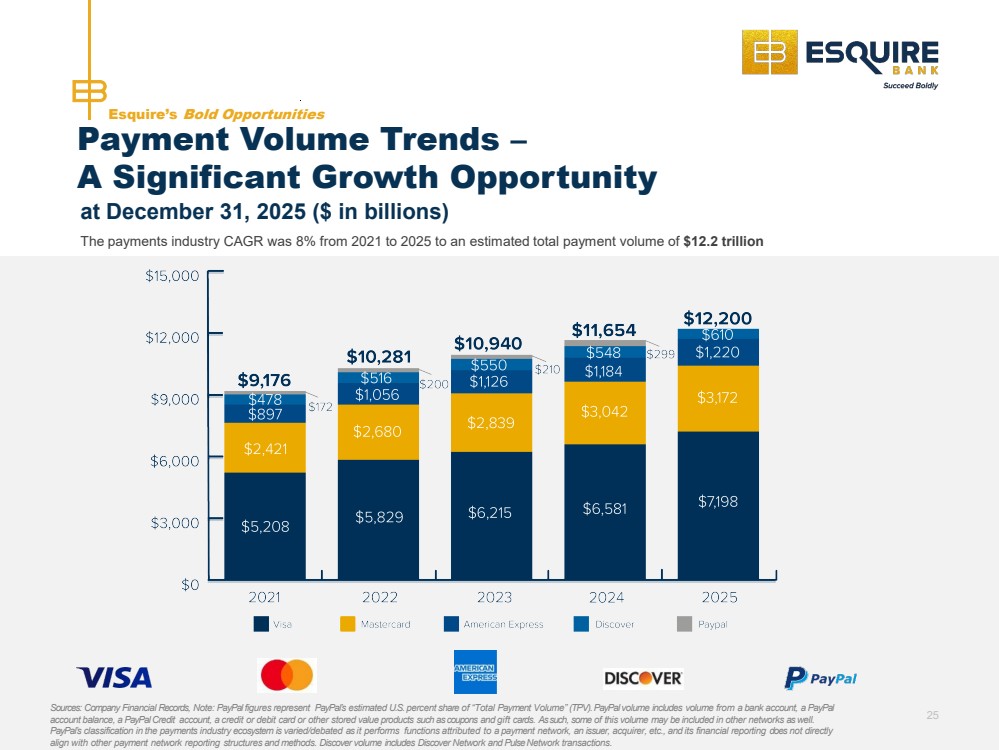
| The payments industry CAGR was 8% from 2021 to 2025 to an estimated total payment volume of $12.2 trillion Esquire’s Bold Opportunities Payment Volume Trends – A Significant Growth Opportunity Sources: Company Financial Records, Note: PayPal figures represent PayPal’s estimated U.S.percent share of “Total Payment Volume” (TPV).PayPal volume includes volume from a bank account, a PayPal account balance, a PayPalCredit account, a credit or debit card or other stored value products such as coupons and gift cards. Assuch, some of this volume may be included in other networks aswell. PayPal’s classification in the payments industry ecosystem is varied/debated as it performs functions attributed to a payment network, an issuer, acquirer, etc., and its financial reporting does not directly align with other payment network reporting structures and methods. Discover volume includes Discover Network and PulseNetwork transactions. 25 at December 31, 2025 ($ in billions) |
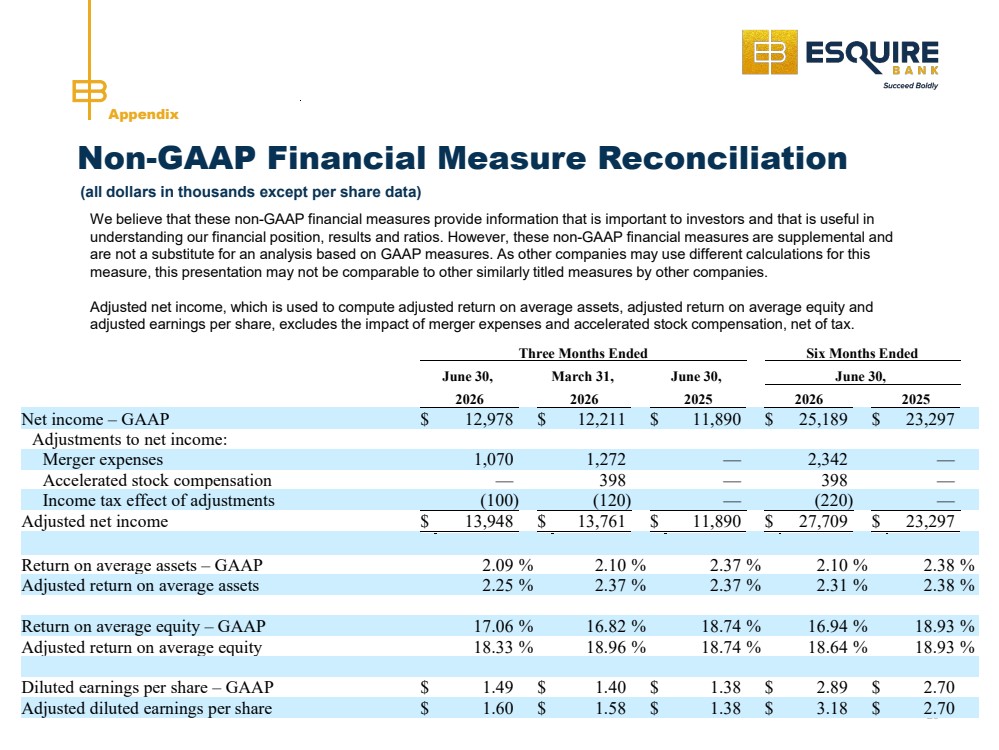
| Appendix Non-GAAP Financial Measure Reconciliation 26 (all dollars in thousands except per share data) We believe that these non-GAAP financial measures provide information that is important to investors and that is useful in understanding our financial position, results and ratios. However, these non-GAAP financial measures are supplemental and are not a substitute for an analysis based on GAAP measures. As other companies may use different calculations for this measure, this presentation may not be comparable to other similarly titled measures by other companies. Adjusted net income, which is used to compute adjusted return on average assets, adjusted return on average equity and adjusted earnings per share, excludes the impact of merger expenses and accelerated stock compensation, net of tax. Three Months Ended Six Months Ended June 30, March 31, June 30, June 30, 2026 2026 2025 2026 2025 Net income – GAAP $ 12,978 $ 12,211 $ 11,890 $ 25,189 $ 23,297 Adjustments to net income: Merger expenses 1,070 1,272 — 2,342 — Accelerated stock compensation — 398 — 398 — Income tax effect of adjustments (100) (120) — (220) — Adjusted net income $ 13,948 $ 13,761 $ 11,890 $ 27,709 $ 23,297 Return on average assets – GAAP 2.09 % 2.10 % 2.37 % 2.10 % 2.38 % Adjusted return on average assets 2.25 % 2.37 % 2.37 % 2.31 % 2.38 % Return on average equity – GAAP 17.06 % 16.82 % 18.74 % 16.94 % 18.93 % Adjusted return on average equity 18.33 % 18.96 % 18.74 % 18.64 % 18.93 % Diluted earnings per share – GAAP $ 1.49 $ 1.40 $ 1.38 $ 2.89 $ 2.70 Adjusted diluted earnings per share $ 1.60 $ 1.58 $ 1.38 $ 3.18 $ 2.70 |
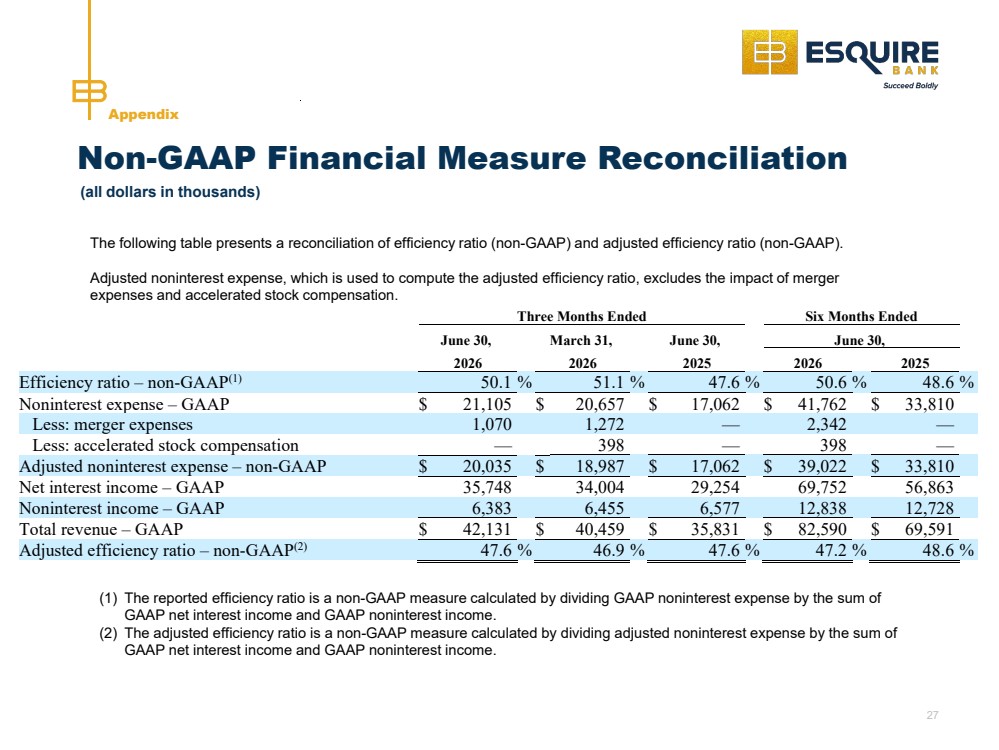
| Appendix Non-GAAP Financial Measure Reconciliation 27 (all dollars in thousands) The following table presents a reconciliation of efficiency ratio (non-GAAP) and adjusted efficiency ratio (non-GAAP). Adjusted noninterest expense, which is used to compute the adjusted efficiency ratio, excludes the impact of merger expenses and accelerated stock compensation. (1) The reported efficiency ratio is a non-GAAP measure calculated by dividing GAAP noninterest expense by the sum of GAAP net interest income and GAAP noninterest income. (2) The adjusted efficiency ratio is a non-GAAP measure calculated by dividing adjusted noninterest expense by the sum of GAAP net interest income and GAAP noninterest income. Three Months Ended Six Months Ended June 30, March 31, June 30, June 30, 2026 2026 2025 2026 2025 Efficiency ratio – non-GAAP(1) 50.1 % 51.1 % 47.6 % 50.6 % 48.6 % Noninterest expense – GAAP $ 21,105 $ 20,657 $ 17,062 $ 41,762 $ 33,810 Less: merger expenses 1,070 1,272 — 2,342 — Less: accelerated stock compensation — 398 — 398 — Adjusted noninterest expense – non-GAAP $ 20,035 $ 18,987 $ 17,062 $ 39,022 $ 33,810 Net interest income – GAAP 35,748 34,004 29,254 69,752 56,863 Noninterest income – GAAP 6,383 6,455 6,577 12,838 12,728 Total revenue – GAAP $ 42,131 $ 40,459 $ 35,831 $ 82,590 $ 69,591 Adjusted efficiency ratio – non-GAAP(2) 47.6 % 46.9 % 47.6 % 47.2 % 48.6 % |