Exhibit 99.2
| EVERY CONNECTION COUNTS TE Connectivity Third Quarter 2026 Earnings July 22, 2026 |

| Forward-Looking Statements and Non-GAAP Financial Measures 2 Forward-Looking Statements This presentation contains certain "forward-looking statements" within the meaning of the U.S. Private Securities Litigation Reform Act of 1995. These statements are based on management's current expectations and are subject to risks, uncertainty and changes in circumstances, which may cause actual results, performance, financial condition or achievements to differ materially from anticipated results, performance, financial condition or achievements. All statements contained herein that are not clearly historical in nature are forward-looking and the words "anticipate," "believe," "expect," "estimate," "plan," and similar expressions are generally intended to identify forward-looking statements. We have no intention and are under no obligation to update or alter (and expressly disclaim any such intention or obligation to do so) our forward-looking statements whether as a result of new information, future events or otherwise, except to the extent required by law. The forward-looking statements in this presentation include statements addressing our future financial condition and operating results. Examples of factors that could cause actual results to differ materially from those described in the forward-looking statements include, among others, the extent, severity and duration of business interruptions negatively affecting our business operations; business, economic, competitive and regulatory risks, such as conditions affecting demand for products in the automotive and other industries we serve; competition and pricing pressure; fluctuations in foreign currency exchange rates and commodity prices; natural disasters and political, economic and military instability in countries in which we operate, including continuing military conflict in certain parts of the world; developments in the credit markets; future goodwill impairment; compliance with current and future environmental and other laws and regulations; and the possible effects on us of changes in tax laws, tax treaties and other legislation. More detailed information about these and other factors is set forth in TE Connectivity plc's Annual Report on Form 10-K for the fiscal year ended Sept. 26, 2025, as well as in our Quarterly Reports on Form 10-Q, Current Reports on Form 8-K and other reports filed by us with the U.S. Securities and Exchange Commission. Non-GAAP Financial Measures Where we have used non-GAAP financial measures, reconciliations to the most comparable GAAP measure are provided, along with a disclosure on the usefulness of the non-GAAP financial measure, in this presentation. |
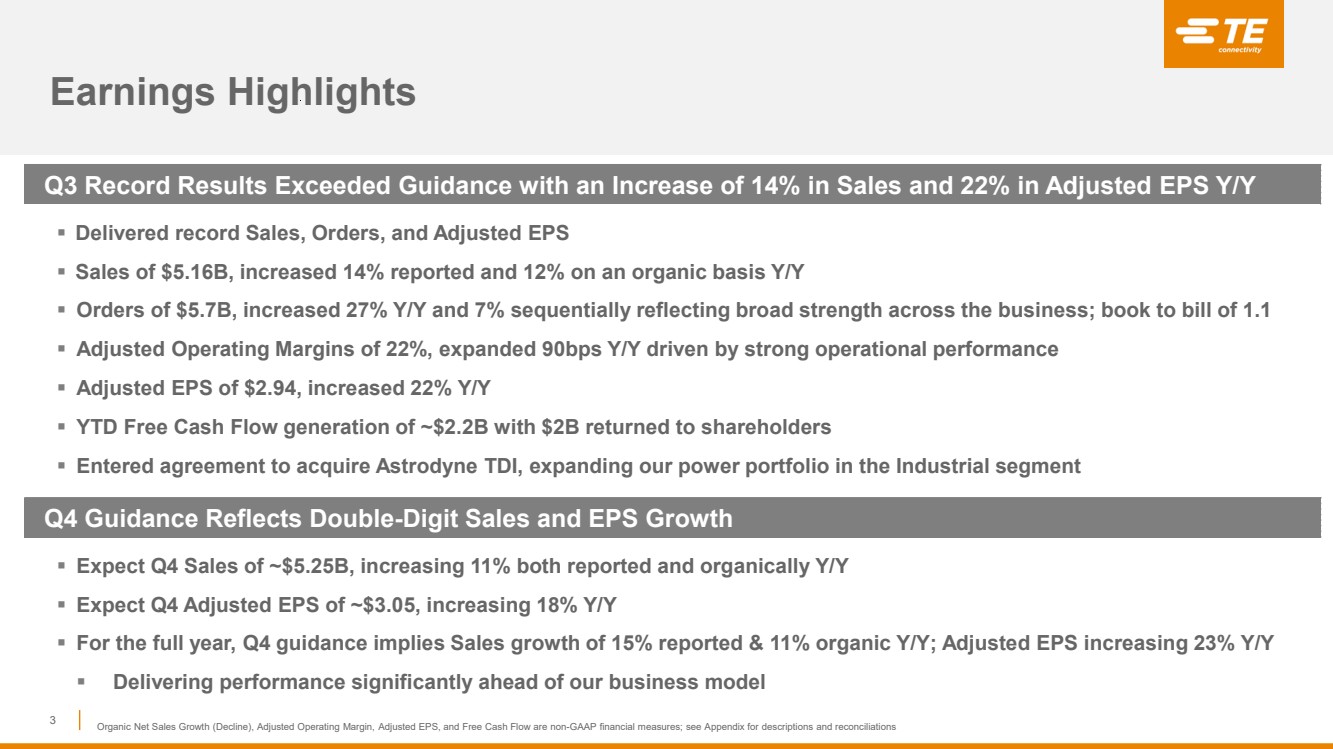
| Q3 Record Results Exceeded Guidance with an Increase of 14% in Sales and 22% in Adjusted EPS Y/Y ▪ Delivered record Sales, Orders, and Adjusted EPS ▪ Sales of $5.16B, increased 14% reported and 12% on an organic basis Y/Y ▪ Orders of $5.7B, increased 27% Y/Y and 7% sequentially reflecting broad strength across the business; book to bill of 1.1 ▪ Adjusted Operating Margins of 22%, expanded 90bps Y/Y driven by strong operational performance ▪ Adjusted EPS of $2.94, increased 22% Y/Y ▪ YTD Free Cash Flow generation of ~$2.2B with $2B returned to shareholders ▪ Entered agreement to acquire Astrodyne TDI, expanding our power portfolio in the Industrial segment Earnings Highlights 3 Organic Net Sales Growth (Decline), Adjusted Operating Margin, Adjusted EPS, and Free Cash Flow are non-GAAP financial measures; see Appendix for descriptions and reconciliations Q4 Guidance Reflects Double-Digit Sales and EPS Growth ▪ Expect Q4 Sales of ~$5.25B, increasing 11% both reported and organically Y/Y ▪ Expect Q4 Adjusted EPS of ~$3.05, increasing 18% Y/Y ▪ For the full year, Q4 guidance implies Sales growth of 15% reported & 11% organic Y/Y; Adjusted EPS increasing 23% Y/Y ▪ Delivering performance significantly ahead of our business model |
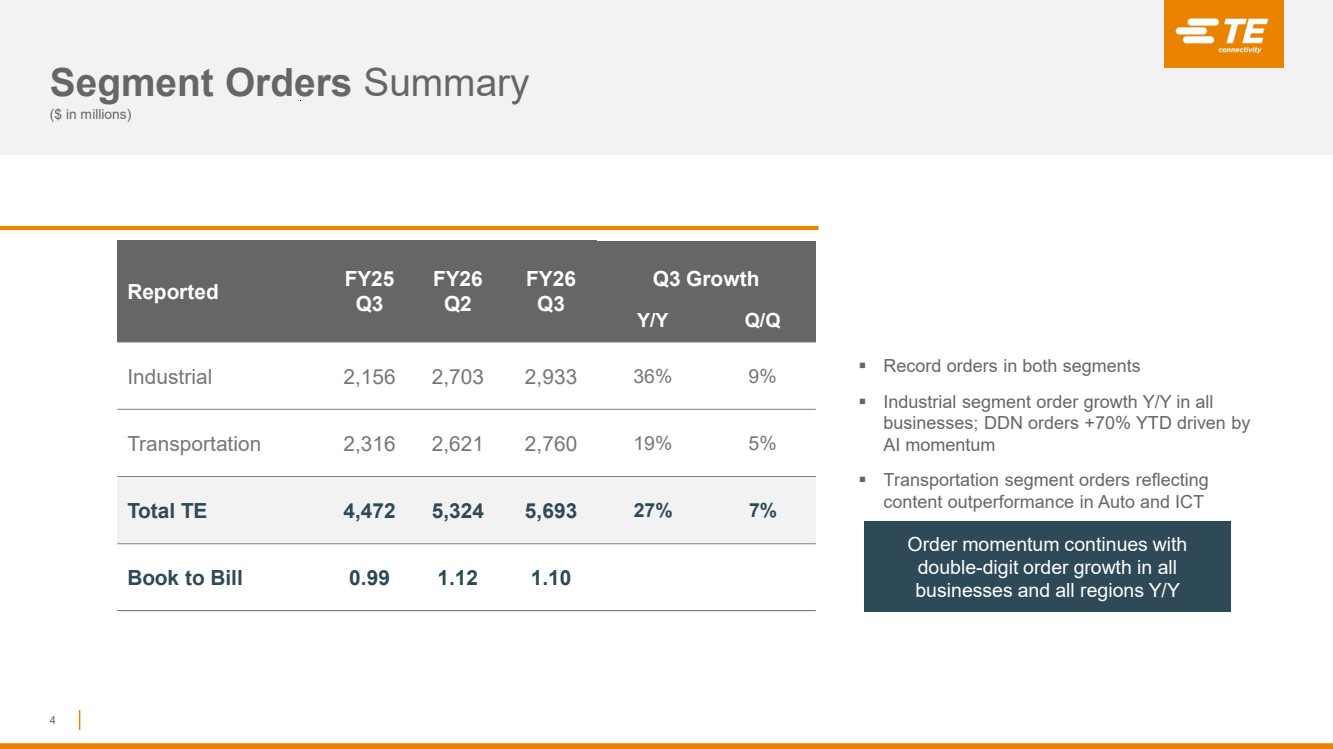
| Reported FY25 Q3 FY26 Q2 FY26 Q3 Q3 Growth Y/Y Q/Q Industrial 2,156 2,703 2,933 36% 9% Transportation 2,316 2,621 2,760 19% 5% Total TE 4,472 5,324 5,693 27% 7% Book to Bill 0.99 1.12 1.10 Segment Orders Summary ($ in millions) 4 ▪ Record orders in both segments ▪ Industrial segment order growth Y/Y in all businesses; DDN orders +70% YTD driven by AI momentum ▪ Transportation segment orders reflecting content outperformance in Auto and ICT Order momentum continues with double-digit order growth in all businesses and all regions Y/Y |
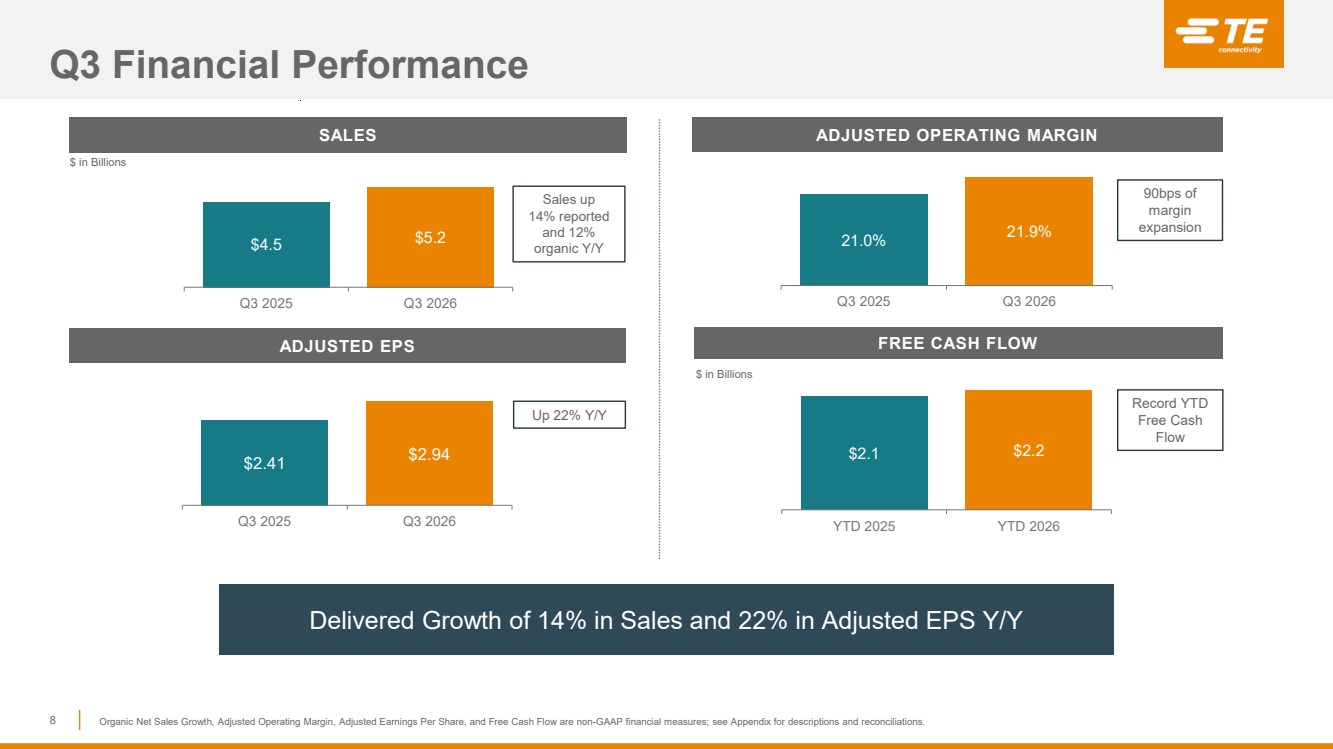
| Industrial Solutions Q3 SALES Reported Up 22% Organic Up 21% Q3 ADJUSTED OPERATING MARGIN Margin expansion of 70bps driven by strong operational performance and higher volume Adjusted EBITDA Margin 25.1% 26.3% 5 Q3 BUSINESS PERFORMANCE Y/Y Growth Rates Reported Organic Digital Data Networks (DDN) $813 34% 34% Automation & Connected Living (ACL) 664 16% 14% Energy 516 34% 33% Aerospace, Defense and Marine (AD&M) 419 12% 12% Medical 168 (7)% (7)% Industrial Solutions $2,580 22% 21% $ in Millions ▪ Digital Data Networks Continued momentum with AI sales as expected; orders support another strong sequential sales increase in Q4 ▪ Automation & Connected Living Growth across all regions driven by automation applications ▪ Energy Strong growth driven by grid hardening and data center build-out ▪ AD&M Performance reflects ongoing strength in commercial air and defense markets ▪ Medical Sales as expected $2,116 $2,580 Q3 2025 Q3 2026 22.1% 22.8% Q3 2025 Q3 2026 Increasing momentum across businesses with strong operational performance Organic Net Sales Growth (Decline), Adjusted Operating Margin, and Adjusted EBITDA Margin are non-GAAP financial measures; see Appendix for descriptions and reconciliations. |
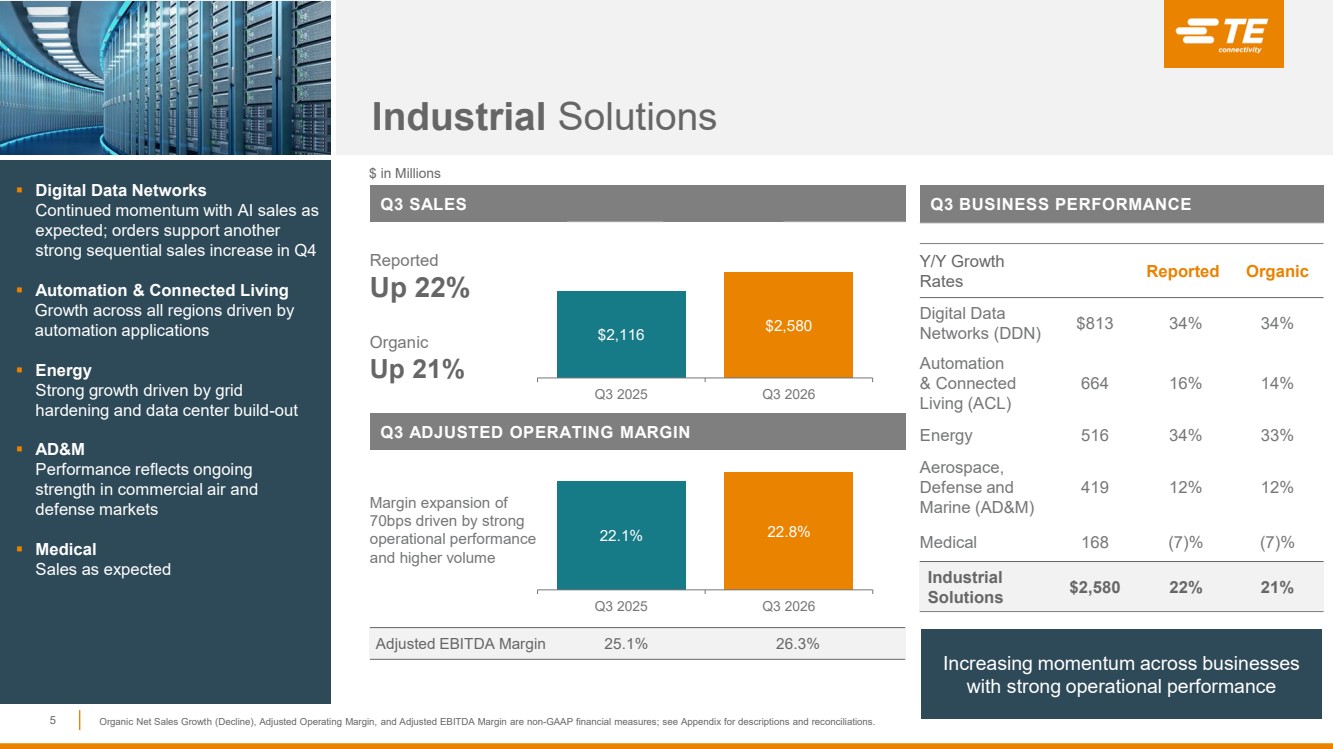
| Transportation Solutions Q3 SALES Reported Up 7% Organic Up 5% Q3 ADJUSTED OPERATING MARGIN Strong margin expansion of 90bps reflects continued execution by our teams Adjusted EBITDA Margin 24.2% 25.2% 6 $2,418 $2,580 Q3 2025 Q3 2026 Q3 BUSINESS PERFORMANCE Y/Y Growth Rates Reported Organic Automotive $1,913 5% 3% Commercial Transportation 434 20% 18% Sensors 233 (1)% (3)% Transportation Solutions $2,580 7% 5% $ in Millions 20.1% 21.0% Q3 2025 Q3 2026 ▪ Automotive Sales increase due to content outperformance in Asia and Europe ▪ Commercial Transportation Strong content growth across all regions ▪ Sensors Sales as expected Organic Net Sales Growth (Decline), Adjusted Operating Margin, and Adjusted EBITDA Margin are non-GAAP financial measures; see Appendix for descriptions and reconciliations. Continue to deliver content outperformance versus end markets with strong operational resiliency |
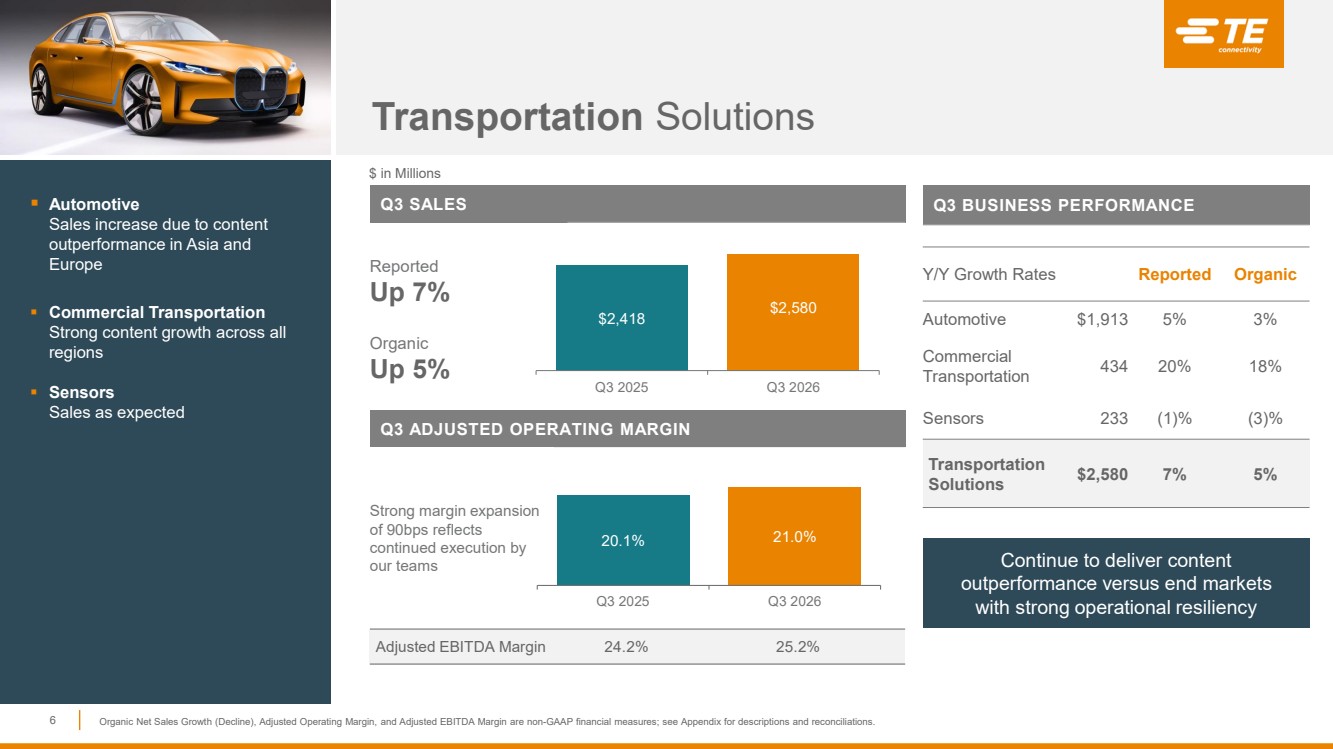
| Q3 Financial Summary 7 ($ in Millions, except per share amounts) Q3 FY25 Q3 FY26 Net Sales $ 4,534 $ 5,160 Operating Income $ 857 $ 981 Operating Margin 18.9% 19.0% Acquisition-Related Charges 30 9 Restructuring & Other Charges, Net 14 83 Amortization Expense 52 56 Adjusted Operating Income $ 953 $ 1,129 Adjusted Operating Margin 21.0% 21.9% Earnings Per Share* $ 2.14 $ 2.55 Acquisition-Related Charges 0.08 0.02 Restructuring & Other Charges, Net 0.05 0.21 Amortization Expense 0.14 0.15 Adjusted EPS $ 2.41 $ 2.94 Adjusted Effective Tax Rate 23.9% 23.1% *Represents Diluted Earnings Per Share from Continuing Operations Adjusted Operating Income, Adjusted Operating Margin, Adjusted Earnings Per Share, and Adjusted Effective Tax Rate are non-GAAP financial measures; see Appendix for descriptions and reconciliations. |
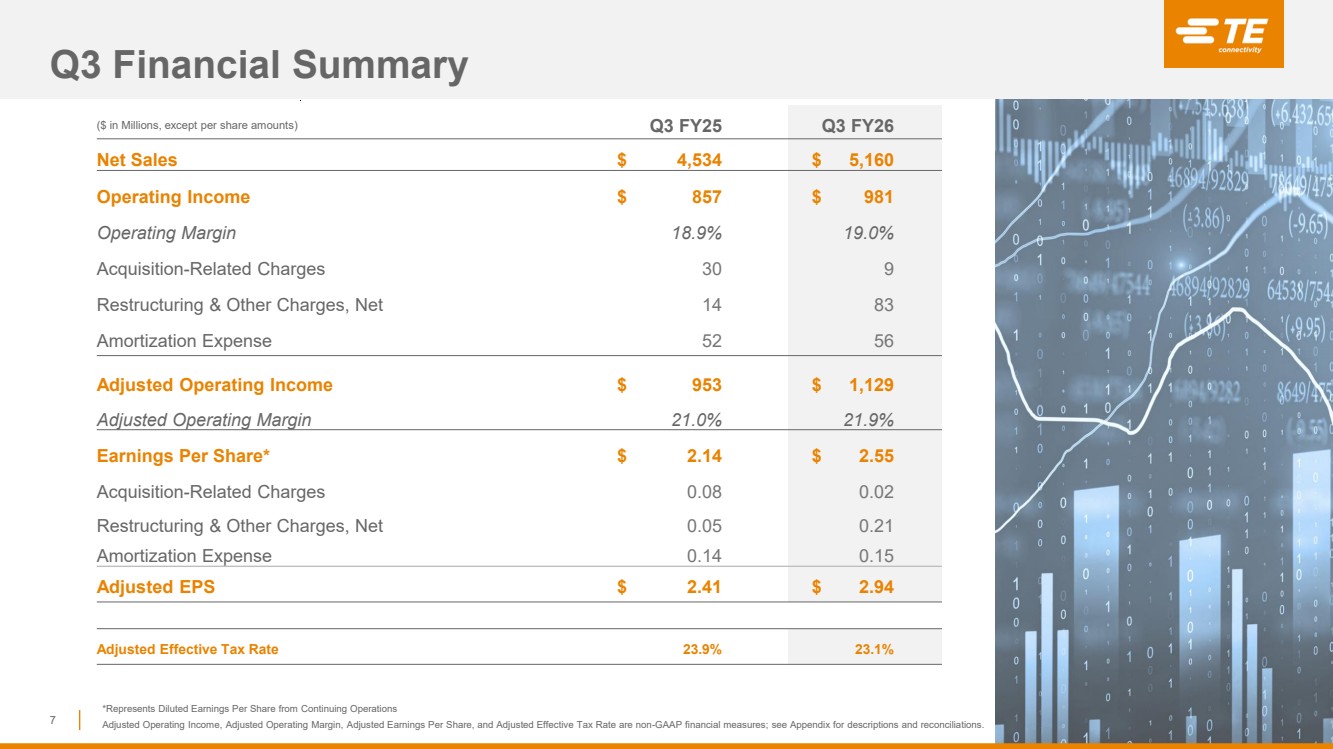
| Q3 Financial Performance 8 21.0% 21.9% Q3 2025 Q3 2026 SALES ADJUSTED OPERATING MARGIN ADJUSTED EPS FREE CASH FLOW Delivered Growth of 14% in Sales and 22% in Adjusted EPS Y/Y $ in Billions $ in Billions Record YTD Free Cash Flow $2.1 $2.2 YTD 2025 YTD 2026 Up 22% Y/Y $4.5 $5.2 Q3 2025 Q3 2026 90bps of margin expansion Organic Net Sales Growth, Adjusted Operating Margin, Adjusted Earnings Per Share, and Free Cash Flow are non-GAAP financial measures; see Appendix for descriptions and reconciliations. Sales up 14% reported and 12% organic Y/Y $2.41 $2.94 Q3 2025 Q3 2026 ADJUSTED OPERATING MARGIN |
| EVERY CONNECTION COUNTS Additional Information |

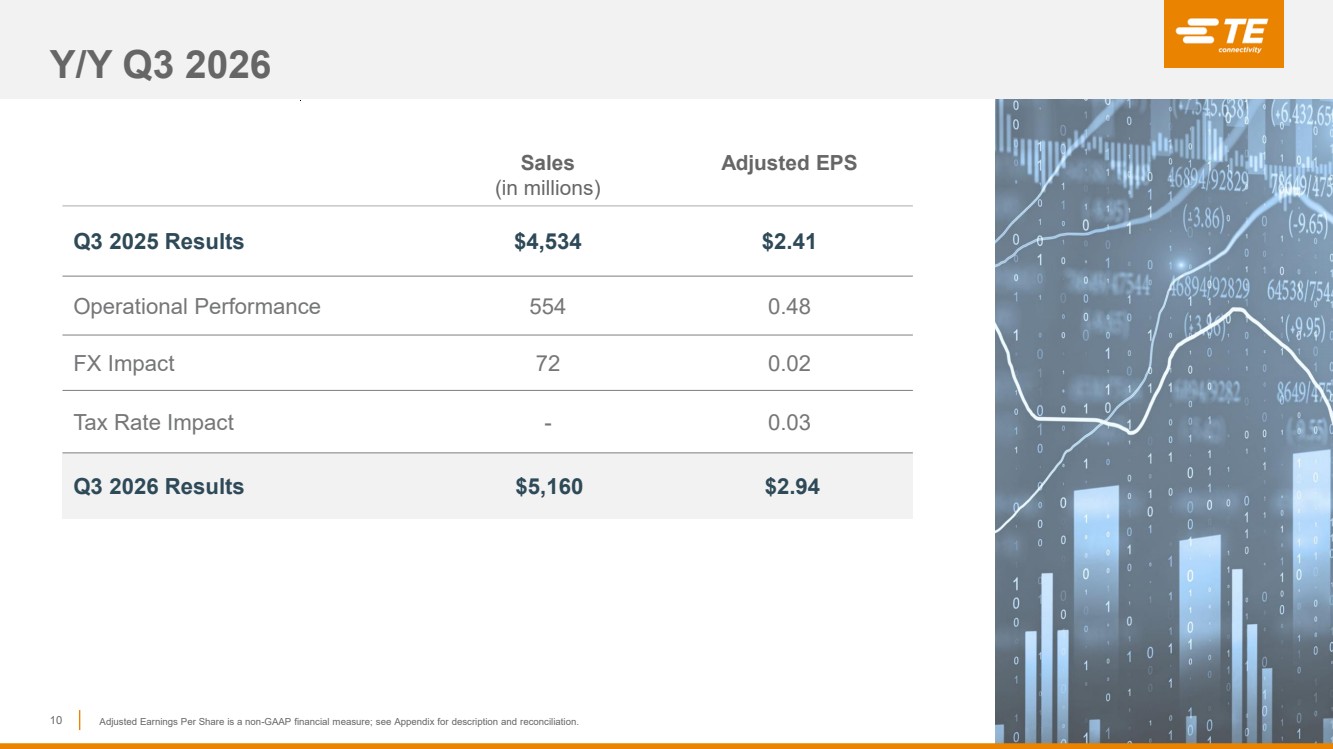
| Y/Y Q3 2026 10 Sales (in millions) Adjusted EPS Q3 2025 Results $4,534 $2.41 Operational Performance 554 0.48 FX Impact 72 0.02 Tax Rate Impact - 0.03 Q3 2026 Results $5,160 $2.94 Adjusted Earnings Per Share is a non-GAAP financial measure; see Appendix for description and reconciliation. |
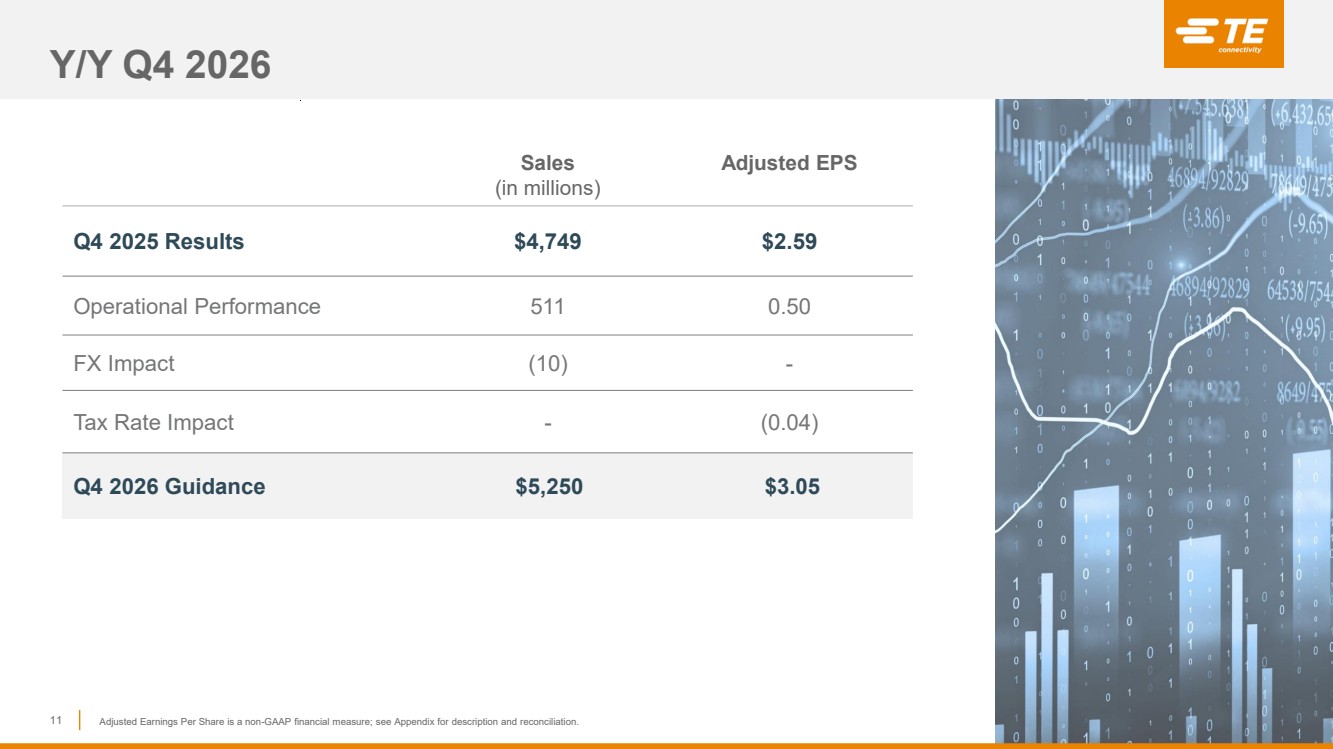
| Y/Y Q4 2026 11 Sales (in millions) Adjusted EPS Q4 2025 Results $4,749 $2.59 Operational Performance 511 0.50 FX Impact (10) - Tax Rate Impact - (0.04) Q4 2026 Guidance $5,250 $3.05 Adjusted Earnings Per Share is a non-GAAP financial measure; see Appendix for description and reconciliation. |
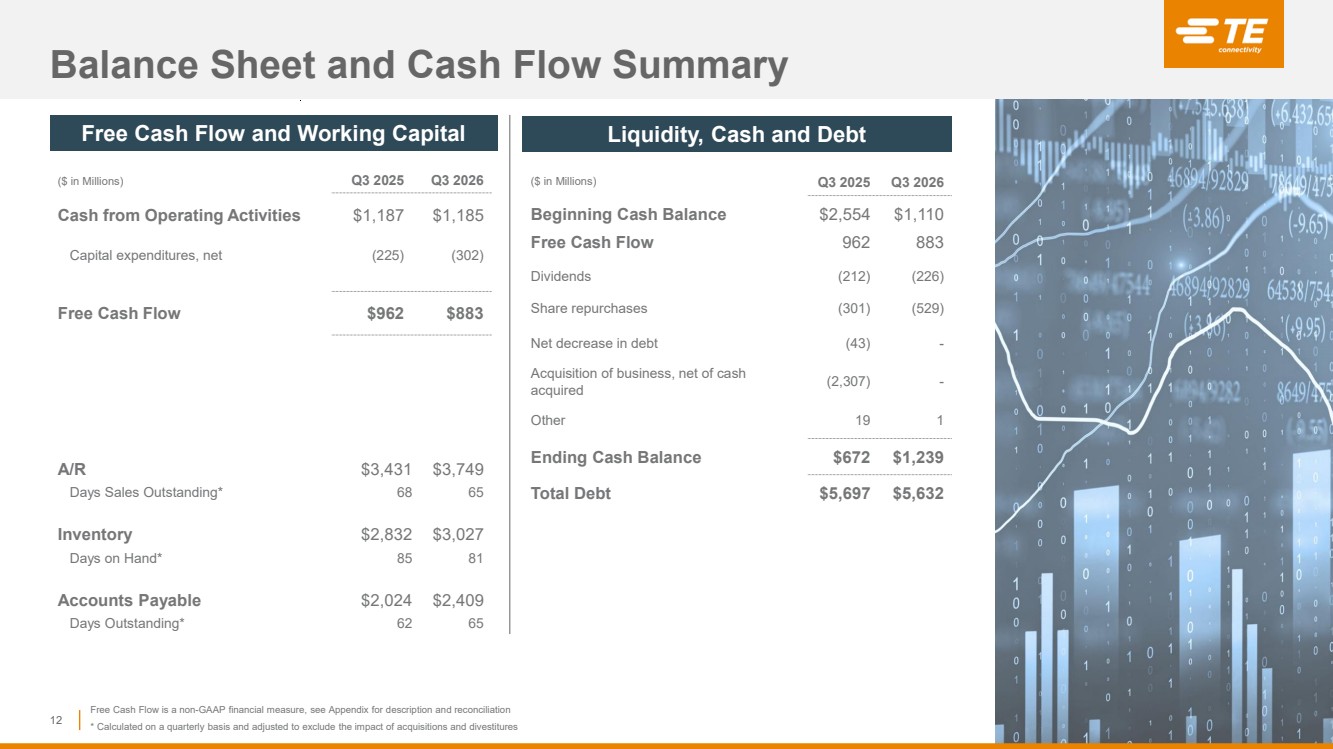
| Balance Sheet and Cash Flow Summary 12 ($ in Millions) Q3 2025 Q3 2026 Beginning Cash Balance $2,554 $1,110 Free Cash Flow 962 883 Dividends (212) (226) Share repurchases (301) (529) Net decrease in debt (43) - Acquisition of business, net of cash acquired (2,307) - Other 19 1 Ending Cash Balance $672 $1,239 Total Debt $5,697 $5,632 A/R $3,431 $3,749 Days Sales Outstanding* 68 65 Inventory $2,832 $3,027 Days on Hand* 85 81 Accounts Payable $2,024 $2,409 Days Outstanding* 62 65 Free Cash Flow and Working Capital Liquidity, Cash and Debt ($ in Millions) Q3 2025 Q3 2026 Cash from Operating Activities $1,187 $1,185 Capital expenditures, net (225) (302) Free Cash Flow $962 $883 Free Cash Flow is a non-GAAP financial measure, see Appendix for description and reconciliation * Calculated on a quarterly basis and adjusted to exclude the impact of acquisitions and divestitures |
| EVERY CONNECTION COUNTS Appendix |

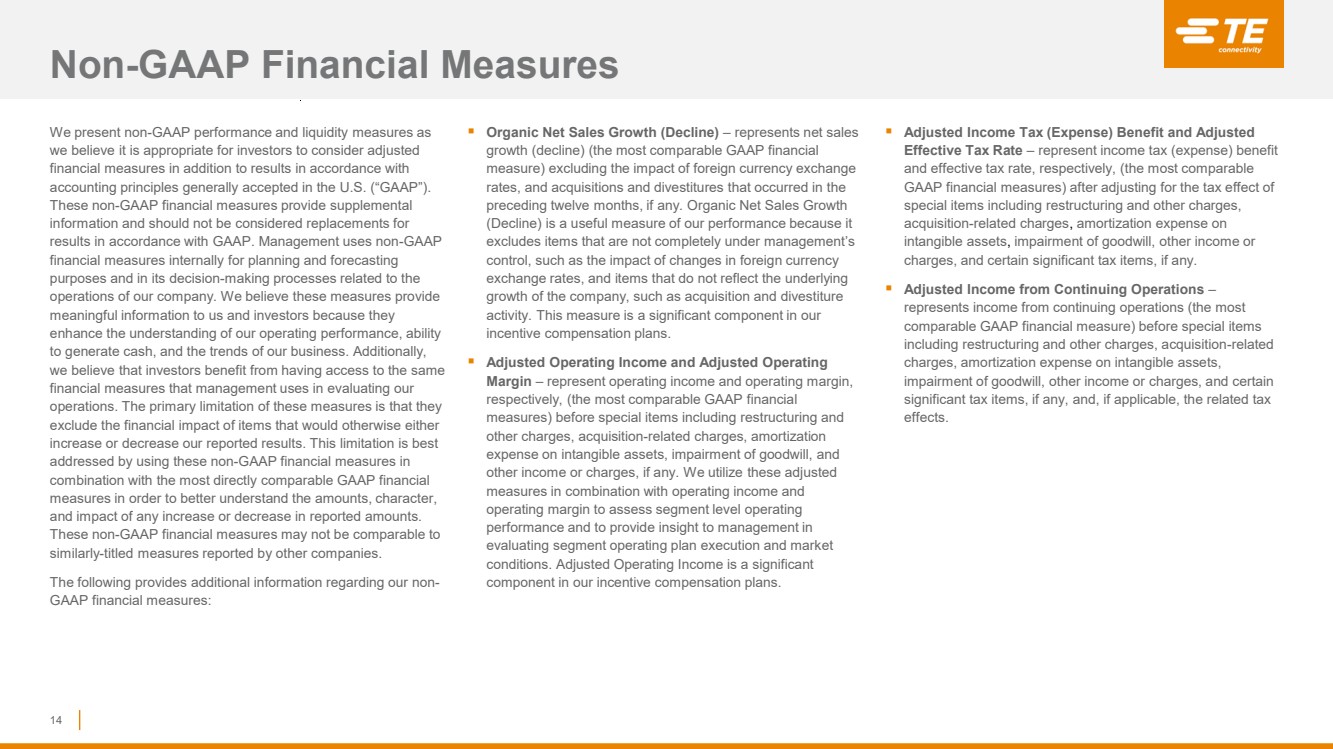
| We present non-GAAP performance and liquidity measures as we believe it is appropriate for investors to consider adjusted financial measures in addition to results in accordance with accounting principles generally accepted in the U.S. (“GAAP”). These non-GAAP financial measures provide supplemental information and should not be considered replacements for results in accordance with GAAP. Management uses non-GAAP financial measures internally for planning and forecasting purposes and in its decision-making processes related to the operations of our company. We believe these measures provide meaningful information to us and investors because they enhance the understanding of our operating performance, ability to generate cash, and the trends of our business. Additionally, we believe that investors benefit from having access to the same financial measures that management uses in evaluating our operations. The primary limitation of these measures is that they exclude the financial impact of items that would otherwise either increase or decrease our reported results. This limitation is best addressed by using these non-GAAP financial measures in combination with the most directly comparable GAAP financial measures in order to better understand the amounts, character, and impact of any increase or decrease in reported amounts. These non-GAAP financial measures may not be comparable to similarly-titled measures reported by other companies. The following provides additional information regarding our non-GAAP financial measures: ▪ Organic Net Sales Growth (Decline) – represents net sales growth (decline) (the most comparable GAAP financial measure) excluding the impact of foreign currency exchange rates, and acquisitions and divestitures that occurred in the preceding twelve months, if any. Organic Net Sales Growth (Decline) is a useful measure of our performance because it excludes items that are not completely under management’s control, such as the impact of changes in foreign currency exchange rates, and items that do not reflect the underlying growth of the company, such as acquisition and divestiture activity. This measure is a significant component in our incentive compensation plans. ▪ Adjusted Operating Income and Adjusted Operating Margin – represent operating income and operating margin, respectively, (the most comparable GAAP financial measures) before special items including restructuring and other charges, acquisition-related charges, amortization expense on intangible assets, impairment of goodwill, and other income or charges, if any. We utilize these adjusted measures in combination with operating income and operating margin to assess segment level operating performance and to provide insight to management in evaluating segment operating plan execution and market conditions. Adjusted Operating Income is a significant component in our incentive compensation plans. ▪ Adjusted Income Tax (Expense) Benefit and Adjusted Effective Tax Rate – represent income tax (expense) benefit and effective tax rate, respectively, (the most comparable GAAP financial measures) after adjusting for the tax effect of special items including restructuring and other charges, acquisition-related charges, amortization expense on intangible assets, impairment of goodwill, other income or charges, and certain significant tax items, if any. ▪ Adjusted Income from Continuing Operations – represents income from continuing operations (the most comparable GAAP financial measure) before special items including restructuring and other charges, acquisition-related charges, amortization expense on intangible assets, impairment of goodwill, other income or charges, and certain significant tax items, if any, and, if applicable, the related tax effects. Non-GAAP Financial Measures 14 |
| ▪ Adjusted Earnings Per Share – represents diluted earnings per share from continuing operations (the most comparable GAAP financial measure) before special items including restructuring and other charges, acquisition-related charges, amortization expense on intangible assets, impairment of goodwill, other income or charges, and certain significant tax items, if any, and, if applicable, the related tax effects. This measure is a significant component in our incentive compensation plans. ▪ Adjusted EBITDA and Adjusted EBITDA Margin – represent net income and net income as a percentage of net sales, respectively, (the most comparable GAAP financial measures) before interest expense, interest income, income taxes, depreciation, and amortization, as adjusted for net other income (expense), income (loss) from discontinued operations, and special items including restructuring and other charges, acquisition-related charges, impairment of goodwill, and other income or charges, if any. ▪ Free Cash Flow (FCF) – is a useful measure of our ability to generate cash. The difference between net cash provided by operating activities (the most comparable GAAP financial measure) and Free Cash Flow consists mainly of significant cash outflows and inflows that we believe are useful to identify. We believe Free Cash Flow provides useful information to investors as it provides insight into the primary cash flow metric used by management to monitor and evaluate cash flows generated from our operations. Free Cash Flow is defined as net cash provided by operating activities excluding voluntary pension contributions and the cash impact of special items, if any, minus net capital expenditures. Voluntary pension contributions are excluded from the GAAP financial measure because this activity is driven by economic financing decisions rather than operating activity. Certain special items, including cash paid (collected) pursuant to collateral requirements related to cross-currency swap contracts, are also excluded by management in evaluating Free Cash Flow. Net capital expenditures consist of capital expenditures less proceeds from the sale of property, plant, and equipment. These items are subtracted because they represent long-term commitments. In the calculation of Free Cash Flow, we subtract certain cash items that are ultimately within management’s and the Board of Directors’ discretion to direct and may imply that there is less or more cash available for our programs than the most comparable GAAP financial measure indicates. It should not be inferred that the entire Free Cash Flow amount is available for future discretionary expenditures, as our definition of Free Cash Flow does not consider certain non-discretionary expenditures, such as debt payments. In addition, we may have other discretionary expenditures, such as discretionary dividends, share repurchases, and business acquisitions, that are not considered in the calculation of Free Cash Flow. ▪ Free Cash Flow Conversion – represents Free Cash Flow as a percentage of Adjusted Income from Continuing Operations. We use Free Cash Flow Conversion as an indicator of our ability to convert earnings to cash. Non-GAAP Financial Measures (cont.) 15 |
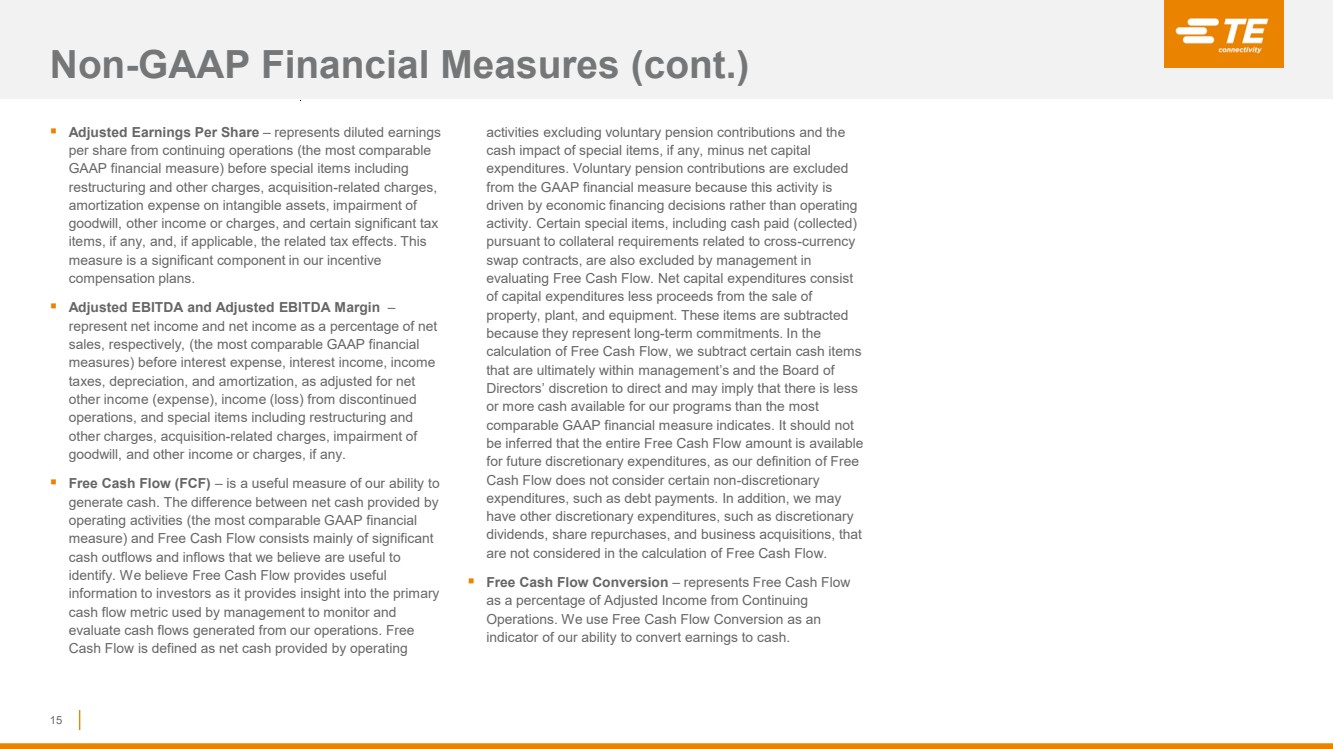
| Segment Summary 16 Transportation Solutions $ 2,580 $ 2,418 $ 7,469 $ 6,975 Industrial Solutions 2,580 2,116 7,104 5,538 Total $ 5,160 $ 4,534 $ 14,573 $ 12,513 O perating O perating O perating O perating Margin Margin Margin Margin Transportation Solutions $ 444 17.2 % $ 462 19.1 % $ 1,448 19.4 % $ 1,353 19.4 % Industrial Solutions 537 20.8 395 18.7 1,450 20.4 942 17.0 Total $ 981 19.0 % $ 857 18.9 % $ 2,898 19.9 % $ 2,295 18.3 % Adjusted Adjusted Adjusted Adjusted O perating O perating O perating O perating Margin (1) Margin (1) Margin (1) Margin (1) Transportation Solutions $ 541 21.0 % $ 486 20.1 % $ 1,586 21.2 % $ 1,476 21.2 % Industrial Solutions 588 22.8 467 22.1 1,608 22.6 1,107 20.0 Total $ 1,129 21.9 % $ 953 21.0 % $ 3,194 21.9 % $ 2,583 20.6 % (1) Adjusted operating income and adjusted operating margin are non-GAAP financial measures. See description of non-GAAP financial measures. 2026 2025 ($ in millions) Adjusted O perating Income (1) Adjusted O perating Adjusted O perating Income (1) Net Sales Net Sales Net Sales Income (1) Adjusted O perating Income (1) Income O perating O perating Income 2025 For the Q uarters Ended June 26, June 27, June 26, June 27, For the Nine Months Ended Net Sales O perating Income O perating Income 2026 |
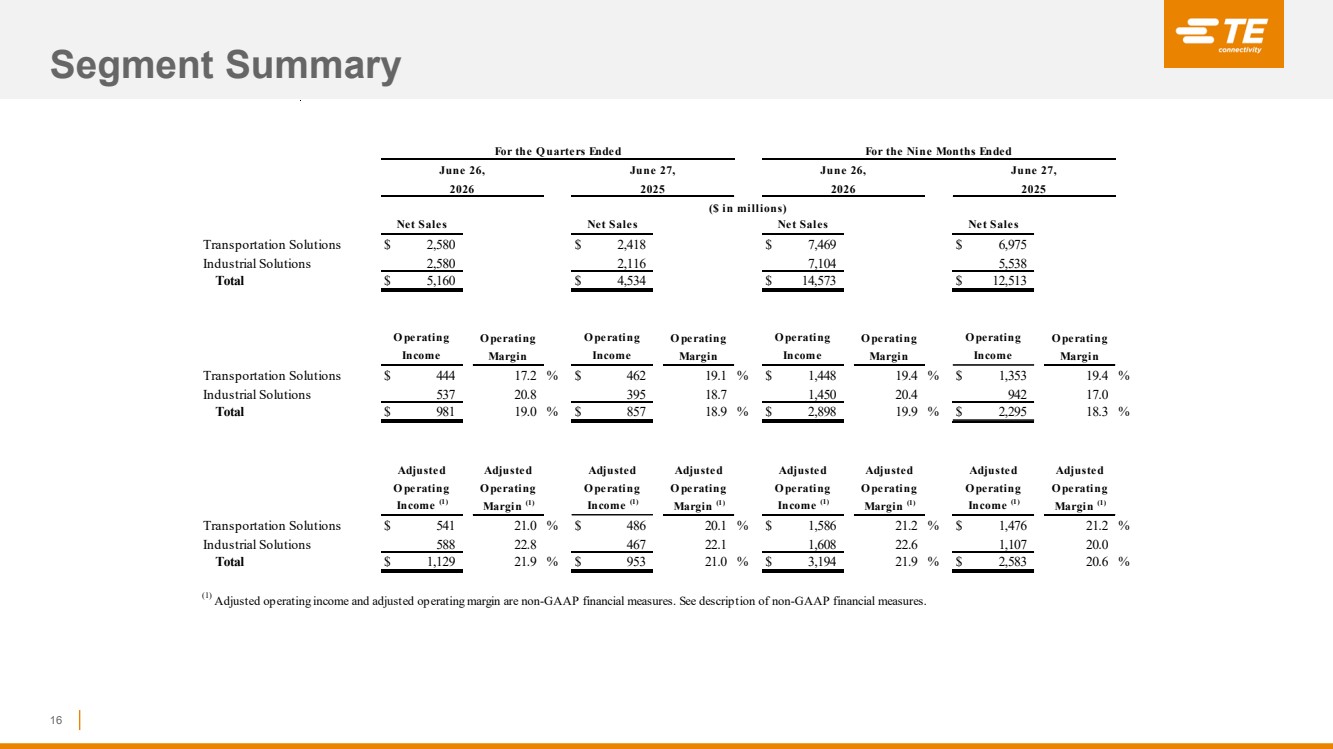
| Reconciliation of Net Sales Growth 17 Transportation Solutions: Automotive $ 290 5.5 % $ 105 2.0 % $ 185 $ — Commercial transportation 199 19.7 169 16.9 30 — Sensors 5 0.7 (18) (2.7) 23 — Total Transportation Solutions 494 7.1 256 3.7 238 — Industrial Solutions: Digital data networks 733 48.8 715 47.7 18 — Automation and connected living 230 14.7 180 11.5 49 1 Aerospace, defense, and marine 126 11.6 100 9.2 26 — Energy 488 55.5 189 21.5 28 271 Medical (11) (2.1) (12) (2.3) 1 — Total Industrial Solutions 1,566 28.3 1,172 21.2 122 272 Total $ 2,060 16.5 % $ 1,428 11.4 % $ 360 $ 272 (1) Organic net sales growth (decline) is a non-GAAP financial measure. See description of non-GAAP financial measures. (2) Represents the change in net sales resulting from changes in foreign currency exchange rates. Translation (2) Acquisitions Change in Net Sales for the Nine Months Ended June 26, 2026 versus Net Sales for the Nine Months Ended June 27, 2025 ($ in millions) Net Sales O rganic Net Sales Growth (Decline) Growth (Decline) (1) Transportation Solutions: Automotive $ 94 5.2 % $ 53 2.9 % $ 41 $ — Commercial transportation 71 19.6 63 17.8 8 — Sensors (3) (1.3) (6) (2.8) 3 — Total Transportation Solutions 162 6.7 110 4.5 52 — Industrial Solutions: Digital data networks 207 34.2 205 34.0 2 — Automation and connected living 93 16.3 83 14.3 10 — Aerospace, defense, and marine 45 12.0 43 11.5 2 — Energy 132 34.4 126 32.7 6 — Medical (13) (7.2) (13) (7.2) — — Total Industrial Solutions 464 21.9 444 21.0 20 — Total $ 626 13.8 % $ 554 12.2 % $ 72 $ — ($ in millions) Translation (2) Acquisitions Net Sales Growth (Decline) O rganic Net Sales Growth (Decline) (1) Change in Net Sales for the Q uarter Ended June 26, 2026 versus Net Sales for the Q uarter Ended June 27, 2025 |
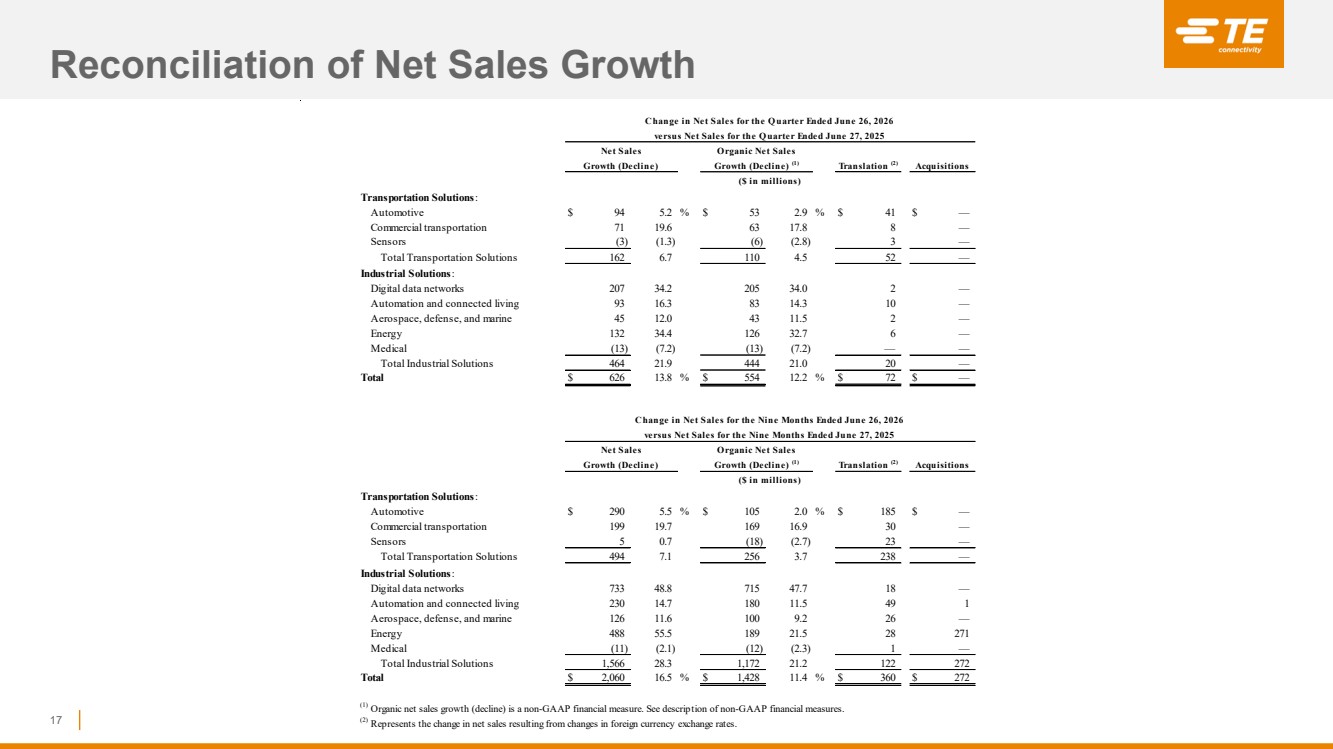
| Reconciliation of Non-GAAP Financial Measures to GAAP Financial Measures for the Quarter Ended June 26, 2026 18 Operating income: Transportation Solutions $ 444 $ 1 $ 79 $ 17 $ 541 Industrial Solutions 537 8 4 39 588 Total $ 981 $ 9 $ 83 $ 56 $ 1,129 Operating margin 19.0 % 21.9 % Income tax expense $ (223) $ (2) $ (22) $ (11) $ (258) Effective tax rate 23.0 % 23.1 % Income from continuing operations $ 748 $ 7 $ 61 $ 45 $ 861 Diluted earnings per share from continuing operations $ 2.55 $ 0.02 $ 0.21 $ 0.15 $ 2.94 Related and O ther Adjusted Acquisition- Restructuring Amortization Adjustments (2) See description of non-GAAP financial measures. (1) The tax effect of each non-GAAP adjustment is calculated based on the jurisdictions in which the expense (income) is incurred and the tax laws in effect for each such jurisdiction. U.S. GAAP Charges (1) (Non-GAAP) (2) Charges, Net (1) ($ in millions, except per share data) Expense (1) |
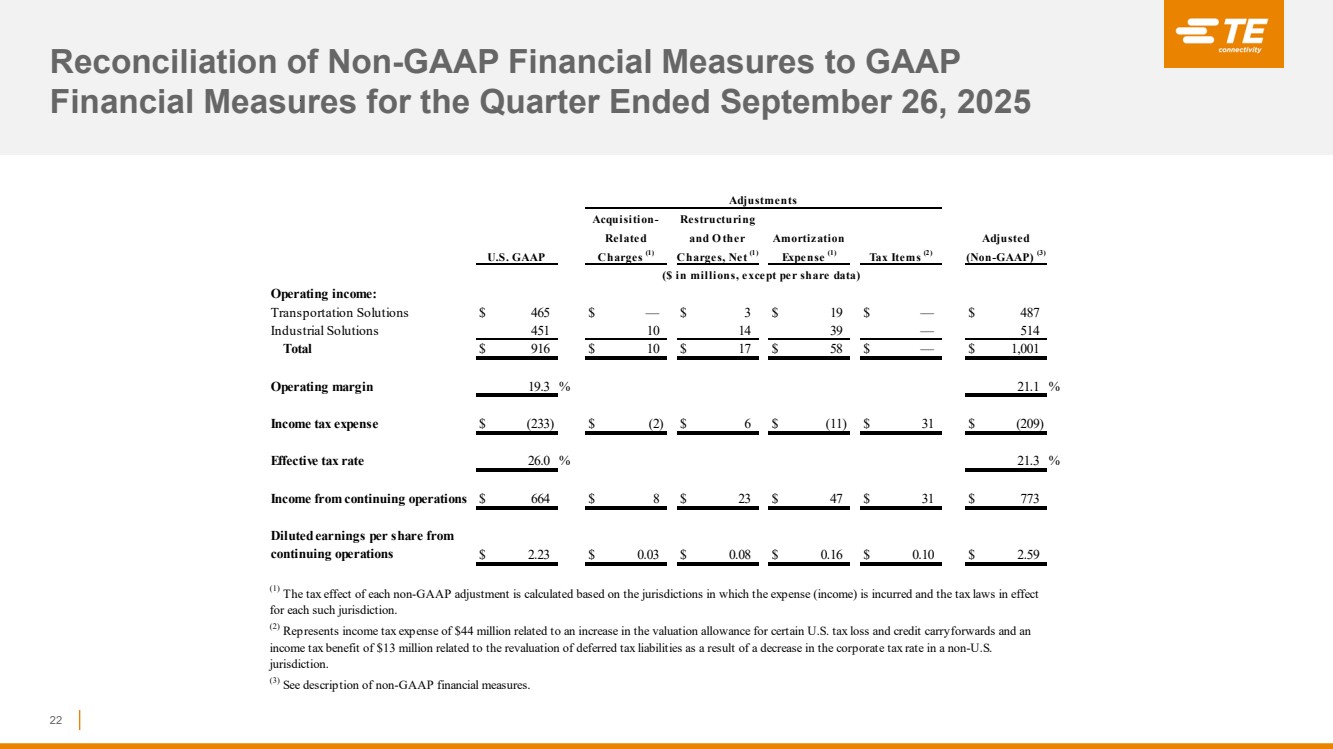
| Reconciliation of Non-GAAP Financial Measures to GAAP Financial Measures for the Quarter Ended June 27, 2025 19 Operating income: Transportation Solutions $ 462 $ — $ 7 $ 17 $ 486 Industrial Solutions 395 30 7 35 467 Total $ 857 $ 30 $ 14 $ 52 $ 953 Operating margin 18.9 % 21.0 % Income tax expense $ (208) $ (7) $ 1 $ (11) $ (225) Effective tax rate 24.6 % 23.9 % Income from continuing operations $ 638 $ 23 $ 15 $ 41 $ 717 Diluted earnings per share from continuing operations $ 2.14 $ 0.08 $ 0.05 $ 0.14 $ 2.41 ($ in millions, except per share data) (1) The tax effect of each non-GAAP adjustment is calculated based on the jurisdictions in which the expense (income) is incurred and the tax laws in effect for each such jurisdiction. Adjustments (2) See description of non-GAAP financial measures. Adjusted (Non-GAAP) (2) Related and O ther Amortization Acquisition- Restructuring U.S. GAAP Charges (1) Charges, Net (1) Expense (1) |
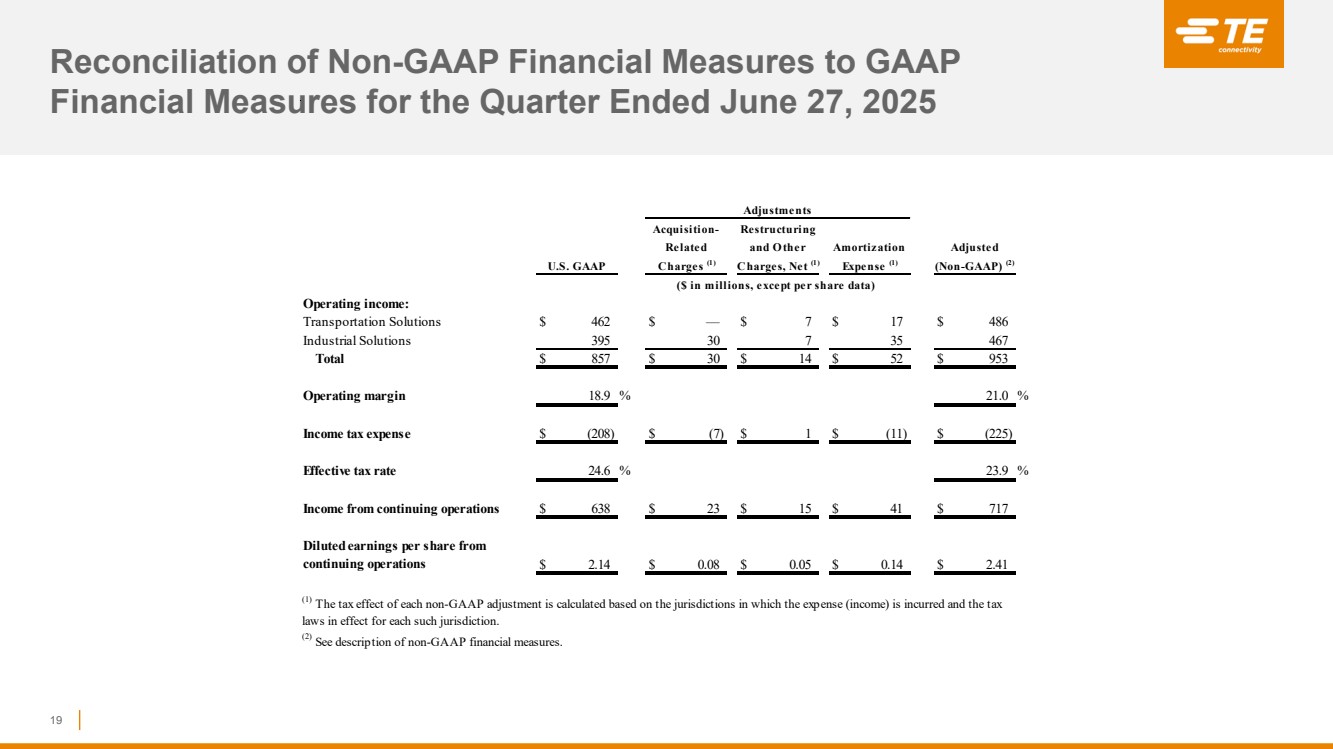
| Reconciliation of Non-GAAP Financial Measures to GAAP Financial Measures for the Nine Months Ended June 26, 2026 20 Operating income: Transportation Solutions $ 1,448 $ 1 $ 84 $ 53 $ — $ 1,586 Industrial Solutions 1,450 22 19 117 — 1,608 Total $ 2,898 $ 23 $ 103 $ 170 $ — $ 3,194 Operating margin 19.9 % 21.9 % Income tax expense $ (520) $ (5) $ (23) $ (34) $ (114) $ (696) Effective tax rate 18.1 % 22.0 % Income from continuing operations $ 2,354 $ 18 $ 80 $ 136 $ (114) $ 2,474 Diluted earnings per share from continuing operations $ 7.98 $ 0.06 $ 0.27 $ 0.46 $ (0.39) $ 8.39 ($ in millions, except per share data) (1) The tax effect of each non-GAAP adjustment is calculated based on the jurisdictions in which the expense (income) is incurred and the tax laws in effect for each such jurisdiction. (2) Represents a net income tax benefit related primarily to the settlement of prior period tax matters. (3) See description of non-GAAP financial measures. Related and O ther Adjusted U.S. GAAP Charges (1) Charges, Net (1) Tax Items (2) (Non-GAAP) (3) Amortization Expense (1) Adjustments Acquisition- Restructuring |
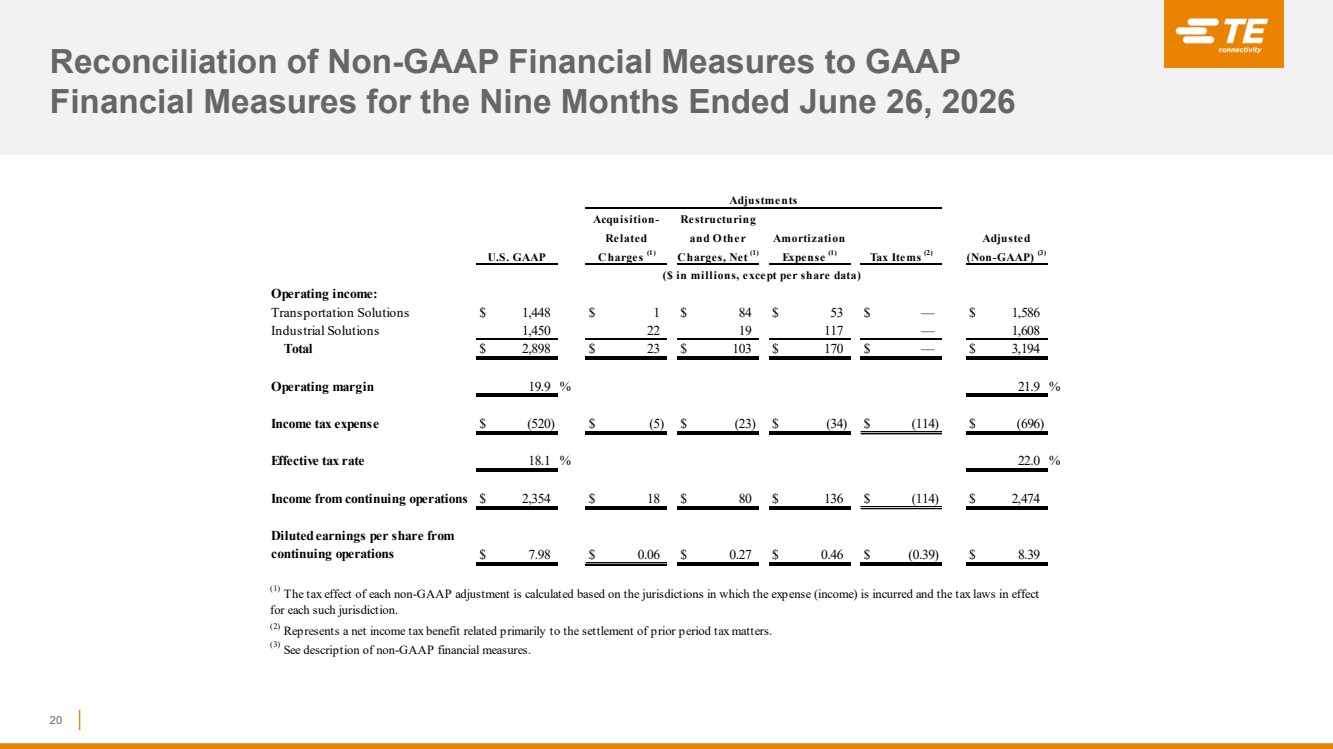
| Reconciliation of Non-GAAP Financial Measures to GAAP Financial Measures for the Nine Months Ended June 27, 2025 21 Operating income: Transportation Solutions $ 1,353 $ — $ 72 $ 51 $ — $ 1,476 Industrial Solutions 942 47 37 81 — 1,107 Total $ 2,295 $ 47 $ 109 $ 132 $ — $ 2,583 Operating margin 18.3 % 20.6 % Income tax expense $ (1,128) $ (10) $ (19) $ (26) $ 587 $ (596) Effective tax rate 48.9 % 23.0 % Income from continuing operations $ 1,179 $ 37 $ 90 $ 106 $ 587 $ 1,999 Diluted earnings per share from continuing operations $ 3.93 $ 0.12 $ 0.30 $ 0.35 $ 1.96 $ 6.66 ($ in millions, except per share data) (1) The tax effect of each non-GAAP adjustment is calculated based on the jurisdictions in which the expense (income) is incurred and the tax laws in effect for each such jurisdiction. (2) Includes income tax expense of $574 million related to a net increase in the valuation allowance for certain deferred tax assets associated with a ten-year tax credit obtained by a Swiss subsidiary in fiscal 2024 as well as income tax expense of $13 million related to the revaluation of deferred tax assets as a result of a decrease in the corporate tax rate in a non-U.S. jurisdiction. (3) See description of non-GAAP financial measures. Related and O ther Adjusted U.S. GAAP Charges (1) Charges, Net (1) Tax Items (2) (Non-GAAP) (3) Amortization Expense (1) Adjustments Acquisition- Restructuring |
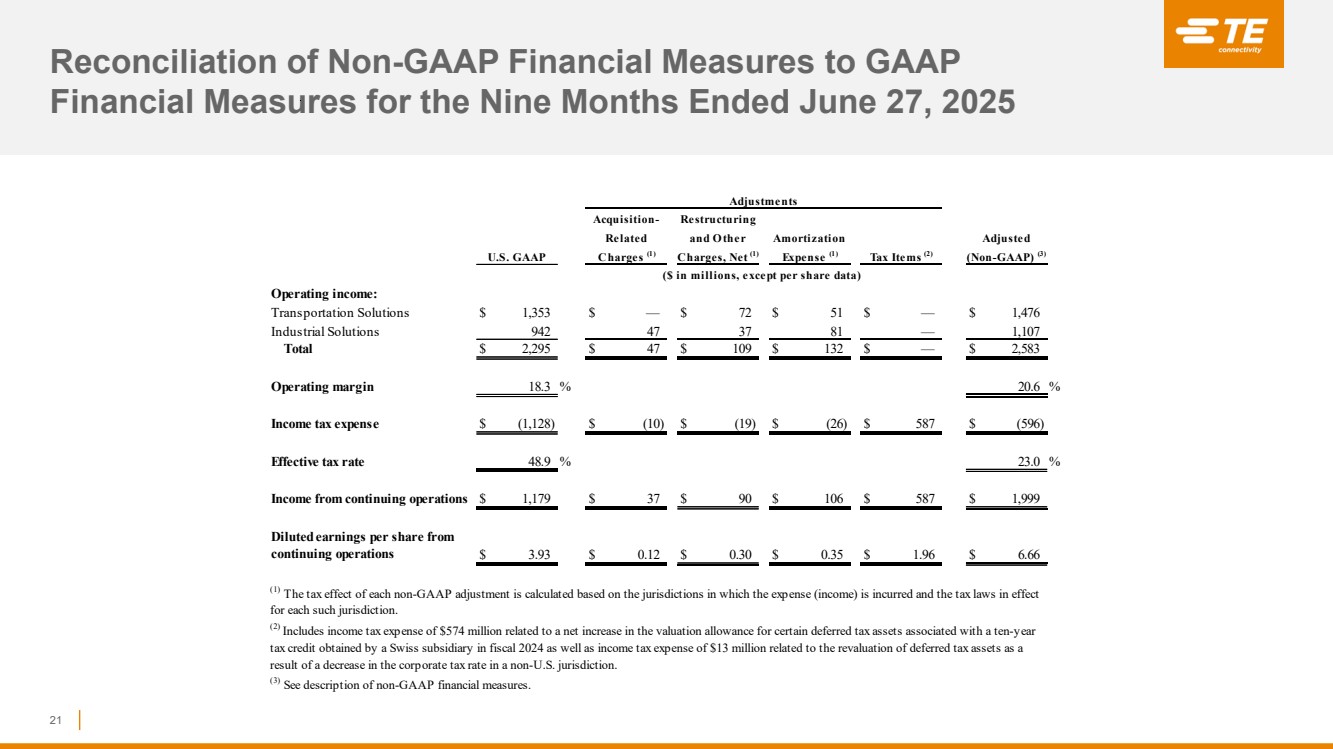
| Reconciliation of Non-GAAP Financial Measures to GAAP Financial Measures for the Quarter Ended September 26, 2025 22 Operating income: Transportation Solutions $ 465 $ — $ 3 $ 19 $ — $ 487 Industrial Solutions 451 10 14 39 — 514 Total $ 916 $ 10 $ 17 $ 58 $ — $ 1,001 Operating margin 19.3 % 21.1 % Income tax expense $ (233) $ (2) $ 6 $ (11) $ 31 $ (209) Effective tax rate 26.0 % 21.3 % Income from continuing operations $ 664 $ 8 $ 23 $ 47 $ 31 $ 773 Diluted earnings per share from continuing operations $ 2.23 $ 0.03 $ 0.08 $ 0.16 $ 0.10 $ 2.59 Related and O ther Amortization U.S. GAAP Charges (1) Charges, Net (1) Expense (1) Acquisition- Restructuring Adjustments Adjusted (Non-GAAP) (3) ($ in millions, except per share data) (1) The tax effect of each non-GAAP adjustment is calculated based on the jurisdictions in which the expense (income) is incurred and the tax laws in effect for each such jurisdiction. (3) See description of non-GAAP financial measures. Tax Items (2) (2) Represents income tax expense of $44 million related to an increase in the valuation allowance for certain U.S. tax loss and credit carryforwards and an income tax benefit of $13 million related to the revaluation of deferred tax liabilities as a result of a decrease in the corporate tax rate in a non-U.S. jurisdiction. |
| Reconciliation of Non-GAAP Financial Measures to GAAP Financial Measures for the Year Ended September 26, 2025 23 Operating income: Transportation Solutions $ 1,818 $ — $ 75 $ 70 $ — $ 1,963 Industrial Solutions 1,393 57 51 120 — 1,621 Total $ 3,211 $ 57 $ 126 $ 190 $ — $ 3,584 Operating margin 18.6 % 20.8 % Income tax expense $ (1,361) $ (12) $ (13) $ (37) $ 618 $ (805) Effective tax rate 42.5 % 22.5 % Income from continuing operations $ 1,843 $ 45 $ 113 $ 153 $ 618 $ 2,772 Diluted earnings per share from continuing operations $ 6.16 $ 0.15 $ 0.38 $ 0.51 $ 2.07 $ 9.27 (3) See description of non-GAAP financial measures. Charges, Net (1) Tax Items (2) Amortization Expense (1) (2) Represents income tax expense of $574 million related to a net increase in the valuation allowance for certain deferred tax assets associated with a ten-year tax credit obtained by a Swiss subsidiary in fiscal 2024 as well as income tax expense of $44 million related to an increase in the valuation allowance for certain U.S. tax loss and credit carryforwards. Adjustments Adjusted (Non-GAAP) (3) ($ in millions, except per share data) (1) The tax effect of each non-GAAP adjustment is calculated based on the jurisdictions in which the expense (income) is incurred and the tax laws in effect for each such jurisdiction. Acquisition- Restructuring Related and O ther U.S. GAAP Charges (1) |
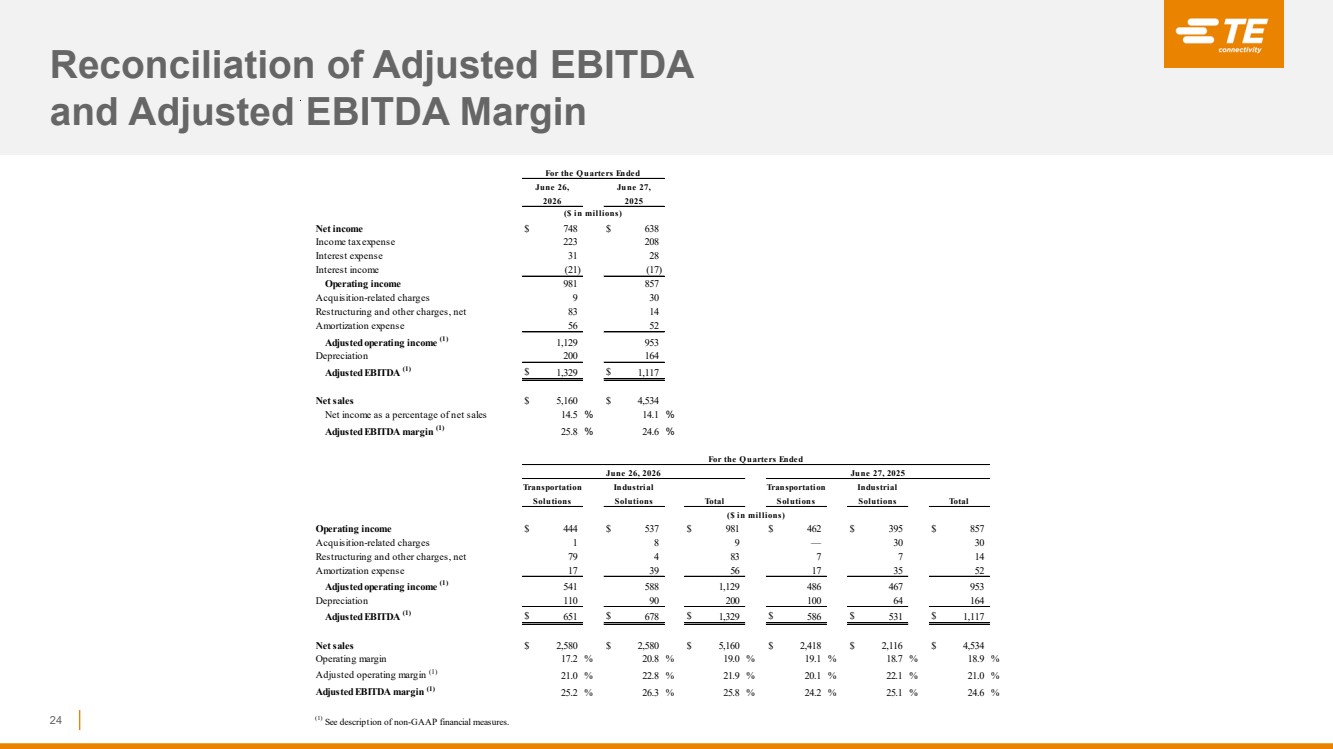
| Reconciliation of Adjusted EBITDA and Adjusted EBITDA Margin 24 Net income $ 748 $ 638 Income tax expense 223 208 Interest expense 31 28 Interest income (21) (17) Operating income 981 857 Acquisition-related charges 9 30 Restructuring and other charges, net 83 14 Amortization expense 56 52 Adjusted operating income (1) 1,129 953 Depreciation 200 164 Adjusted EBITDA (1) $ 1,329 $ 1,117 Net sales $ 5,160 $ 4,534 Net income as a percentage of net sales 14.5 % 14.1 % Adjusted EBITDA margin (1) 25.8 % 24.6 % Operating income $ 444 $ 537 $ 981 $ 462 $ 395 $ 857 Acquisition-related charges 1 8 9 — 30 30 Restructuring and other charges, net 79 4 83 7 7 14 Amortization expense 17 39 56 17 35 52 Adjusted operating income (1) 541 588 1,129 486 467 953 Depreciation 110 90 200 100 64 164 Adjusted EBITDA (1) $ 651 $ 678 $ 1,329 $ 586 $ 531 $ 1,117 Net sales $ 2,580 $ 2,580 $ 5,160 $ 2,418 $ 2,116 $ 4,534 Operating margin 17.2 % 20.8 % 19.0 % 19.1 % 18.7 % 18.9 % Adjusted operating margin (1) 21.0 % 22.8 % 21.9 % 20.1 % 22.1 % 21.0 % Adjusted EBITDA margin (1) 25.2 % 26.3 % 25.8 % 24.2 % 25.1 % 24.6 % (1) See description of non-GAAP financial measures. ($ in millions) Transportation Industrial Solutions Solutions Total Solutions Solutions Total June 26, 2026 June 27, 2025 For the Q uarters Ended ($ in millions) June 26, 2026 June 27, 2025 Transportation Industrial For the Q uarters Ended |
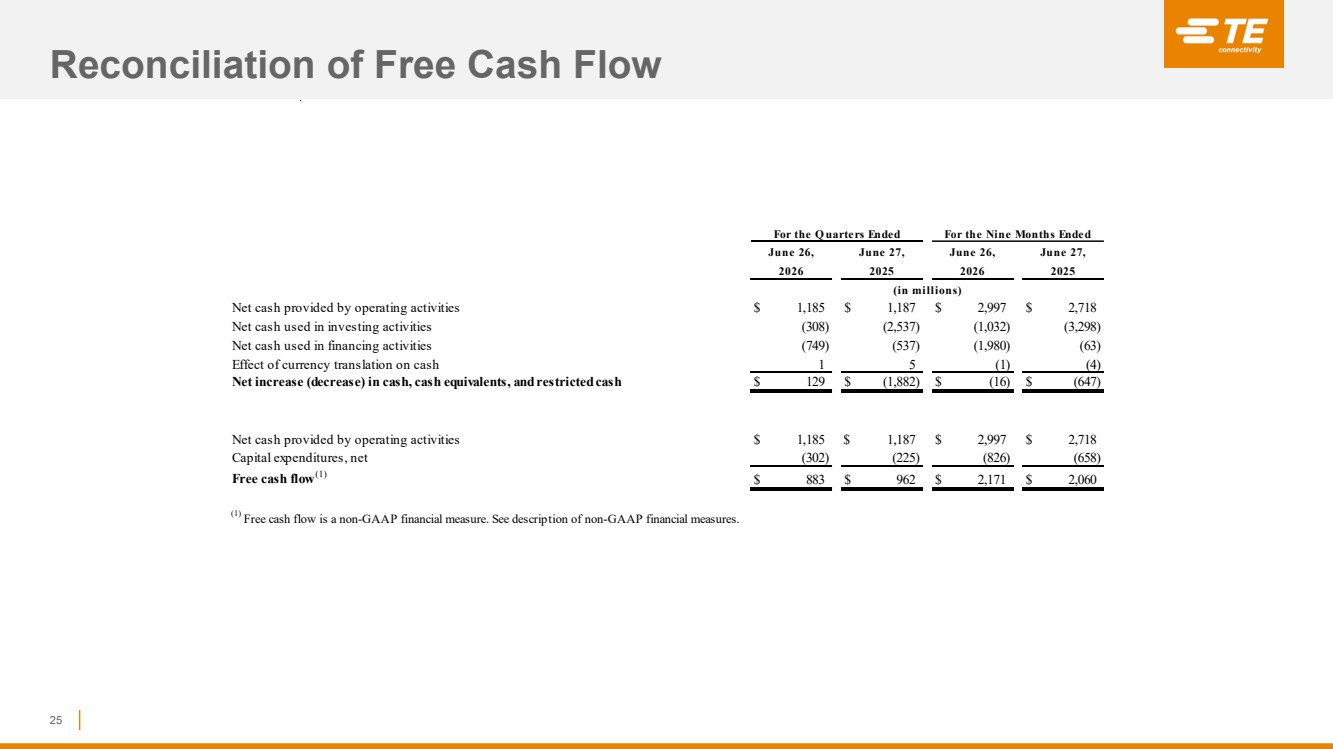
| Reconciliation of Free Cash Flow 25 Net cash provided by operating activities $ 1,185 $ 1,187 $ 2,997 $ 2,718 Net cash used in investing activities (308) (2,537) (1,032) (3,298) Net cash used in financing activities (749) (537) (1,980) (63) Effect of currency translation on cash 1 5 (1) (4) Net increase (decrease) in cash, cash equivalents, and restricted cash $ 129 $ (1,882) $ (16) $ (647) Net cash provided by operating activities $ 1,185 $ 1,187 $ 2,997 $ 2,718 Capital expenditures, net (302) (225) (826) (658) Free cash flow (1) $ 883 $ 962 $ 2,171 $ 2,060 (1) Free cash flow is a non-GAAP financial measure. See description of non-GAAP financial measures. 2026 2025 2026 2025 (in millions) For the Q uarters Ended June 26, June 27, June 26, June 27, For the Nine Months Ended |
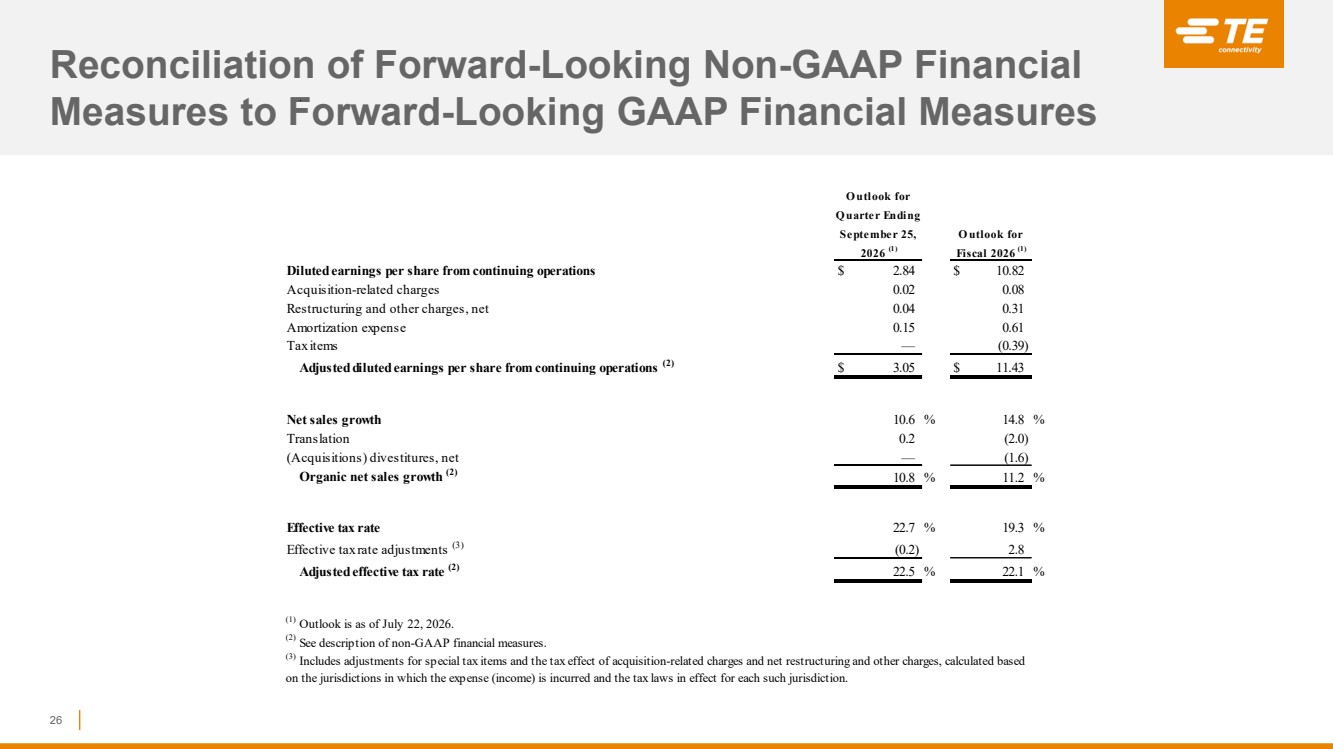
| Reconciliation of Forward-Looking Non-GAAP Financial Measures to Forward-Looking GAAP Financial Measures 26 Diluted earnings per share from continuing operations $ 2.84 $ 10.82 Acquisition-related charges 0.02 0.08 Restructuring and other charges, net 0.04 0.31 Amortization expense 0.15 0.61 Tax items — (0.39) Adjusted diluted earnings per share from continuing operations (2) $ 3.05 $ 11.43 Net sales growth 10.6 % 14.8 % Translation 0.2 (2.0) (Acquisitions) divestitures, net — (1.6) Organic net sales growth (2) 10.8 % 11.2 % Effective tax rate 22.7 % 19.3 % Effective tax rate adjustments (3) (0.2) 2.8 Adjusted effective tax rate (2) 22.5 % 22.1 % Q uarter Ending O utlook for 2026 (1) September 25, O utlook for Fiscal 2026 (1) (3) Includes adjustments for special tax items and the tax effect of acquisition-related charges and net restructuring and other charges, calculated based on the jurisdictions in which the expense (income) is incurred and the tax laws in effect for each such jurisdiction. (1) Outlook is as of July 22, 2026. (2) See description of non-GAAP financial measures. |