
Second Quarter 2026 Earnings July 22, 2026 Exhibit 99.2
2 This presentation, including documents incorporated herein by reference, will contain forward-looking statements within the meaning of Section 27A of the Securities Act of 1933, as amended and Section 21E of the Securities Exchange Act of 1934, as amended. Such forward-looking statements are made pursuant to the safe harbor provisions of the Private Securities Litigation Reform Act of 1995. Forward-looking statements are subject to risks and uncertainties that could cause actual results to differ materially from those contemplated by the forward-looking statements. Please review our disclosures in filings with the United States Securities and Exchange Commission. Non-GAAP Financial Data This presentation includes the use of adjusted operating income, operating ratio, adjusted operating ratio, adjusted earnings per share, adjusted income before taxes and adjusted operating expenses, which are financial measures that are not in accordance with United States generally accepted accounting principles (“GAAP”). Each such measure is a supplemental non-GAAP financial measure that is used by management and external users of our financial statements, such as industry analysts, investors and lenders. While management believes such measures are useful for investors, they should not be used as a replacement for financial measures that are in accordance with GAAP. In addition, our use of these non-GAAP measures should not be interpreted as indicating that these or similar items could not occur in future periods. In addition, adjusted operating ratio excludes truckload and LTL segment fuel surcharges from revenue and nets these surcharges against fuel expense. Disclosure
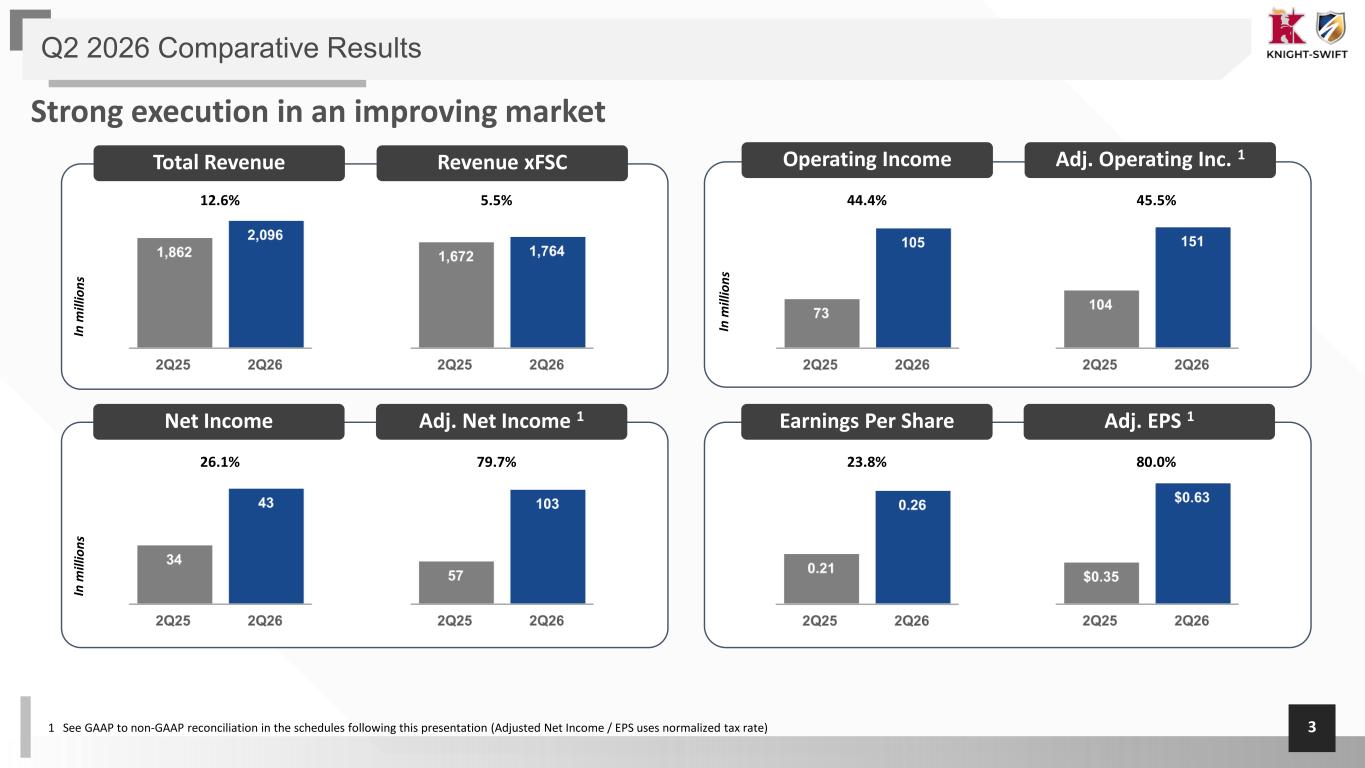
3 Q2 2026 Comparative Results Total Revenue 12.6% Revenue xFSC 5.5% Operating Income 44.4% Adj. Operating Inc. 1 45.5% Net Income Adj. Net Income 1 79.7% Earnings Per Share Adj. EPS 1 80.0% Strong execution in an improving market 1 See GAAP to non-GAAP reconciliation in the schedules following this presentation (Adjusted Net Income / EPS uses normalized tax rate) 26.1% 23.8%
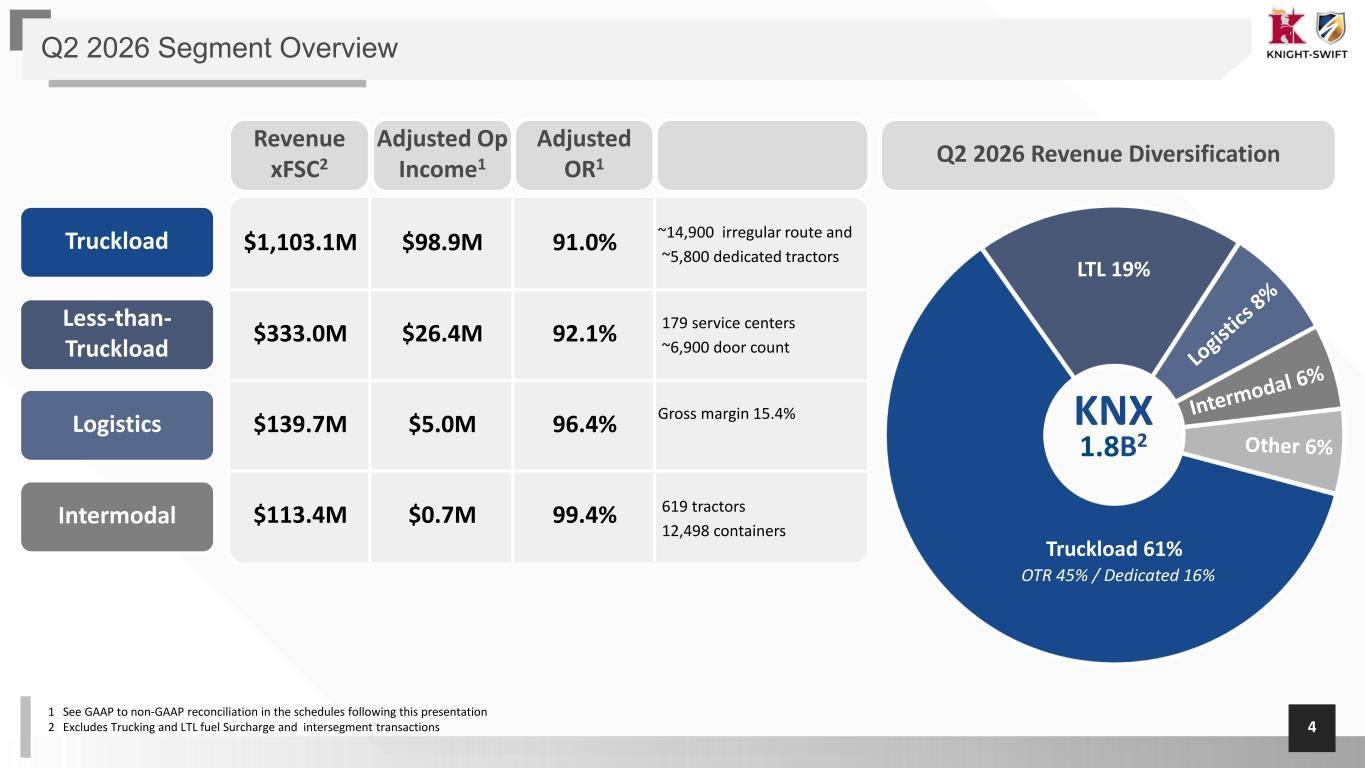
4 $1,103.1M $98.9M 91.0% ~14,900 irregular route and ~5,800 dedicated tractors $333.0M $26.4M 92.1% 179 service centers ~6,900 door count $139.7M $5.0M 96.4% Gross margin 15.4% $113.4M $0.7M 99.4% 619 tractors 12,498 containers 1 See GAAP to non-GAAP reconciliation in the schedules following this presentation 2 Excludes Trucking and LTL fuel Surcharge and intersegment transactions Q2 2026 Revenue Diversification Q2 2026 Segment Overview OTR 45% / Dedicated 16% LTL 19% Truckload 61% Revenue xFSC2 Adjusted Op Income1 Adjusted OR1 Truckload Less-than- Truckload Logistics Intermodal KNX 1.8B2
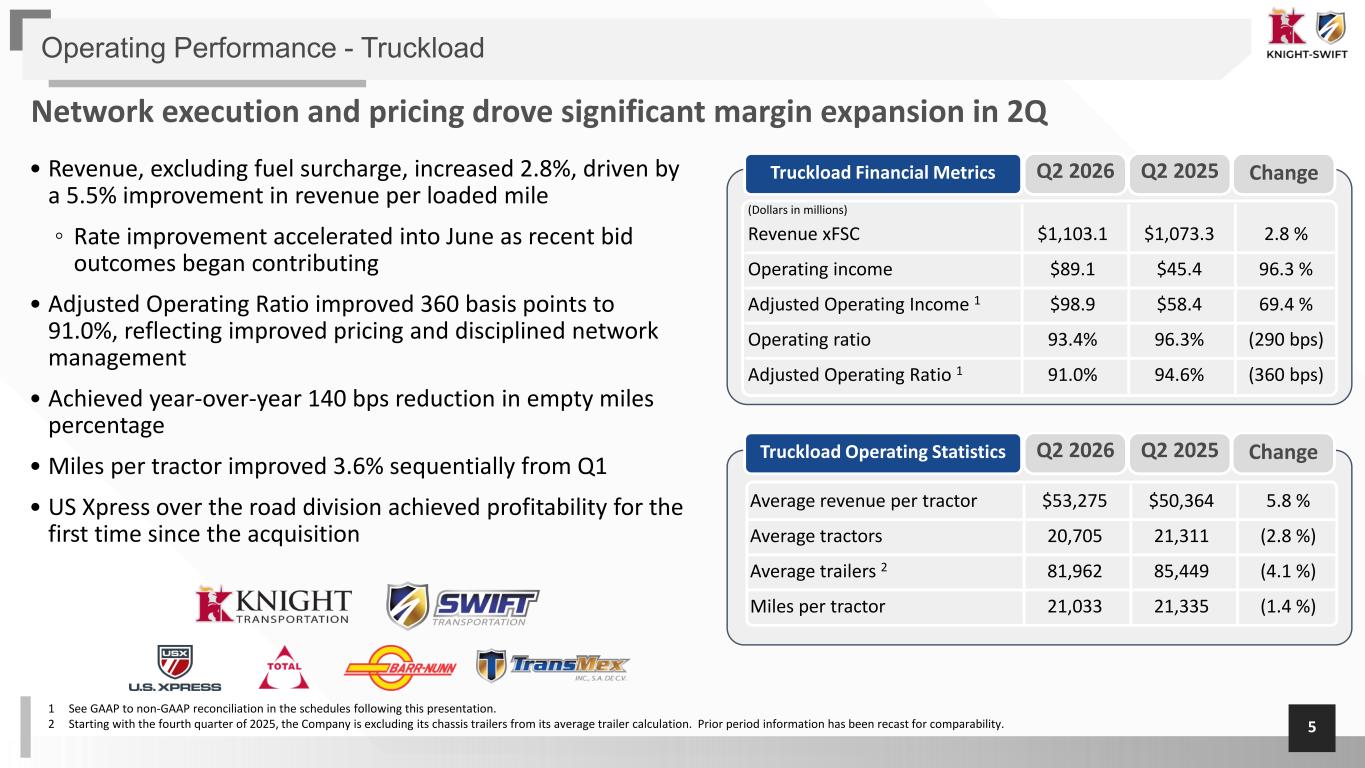
5 (Dollars in millions) Revenue xFSC $1,103.1 $1,073.3 2.8 % Operating income $89.1 $45.4 96.3 % Adjusted Operating Income 1 $98.9 $58.4 69.4 % Operating ratio 93.4% 96.3% (290 bps) Adjusted Operating Ratio 1 91.0% 94.6% (360 bps) Truckload Financial Metrics Average revenue per tractor $53,275 $50,364 5.8 % Average tractors 20,705 21,311 (2.8 %) Average trailers 2 81,962 85,449 (4.1 %) Miles per tractor 21,033 21,335 (1.4 %) Operating Performance - Truckload Network execution and pricing drove significant margin expansion in 2Q Q2 2026 Q2 2025 Change Truckload Operating Statistics Q2 2026 Q2 2025 Change 1 See GAAP to non-GAAP reconciliation in the schedules following this presentation. 2 Starting with the fourth quarter of 2025, the Company is excluding its chassis trailers from its average trailer calculation. Prior period information has been recast for comparability. • Revenue, excluding fuel surcharge, increased 2.8%, driven by a 5.5% improvement in revenue per loaded mile ◦ Rate improvement accelerated into June as recent bid outcomes began contributing • Adjusted Operating Ratio improved 360 basis points to 91.0%, reflecting improved pricing and disciplined network management • Achieved year-over-year 140 bps reduction in empty miles percentage • Miles per tractor improved 3.6% sequentially from Q1 • US Xpress over the road division achieved profitability for the first time since the acquisition
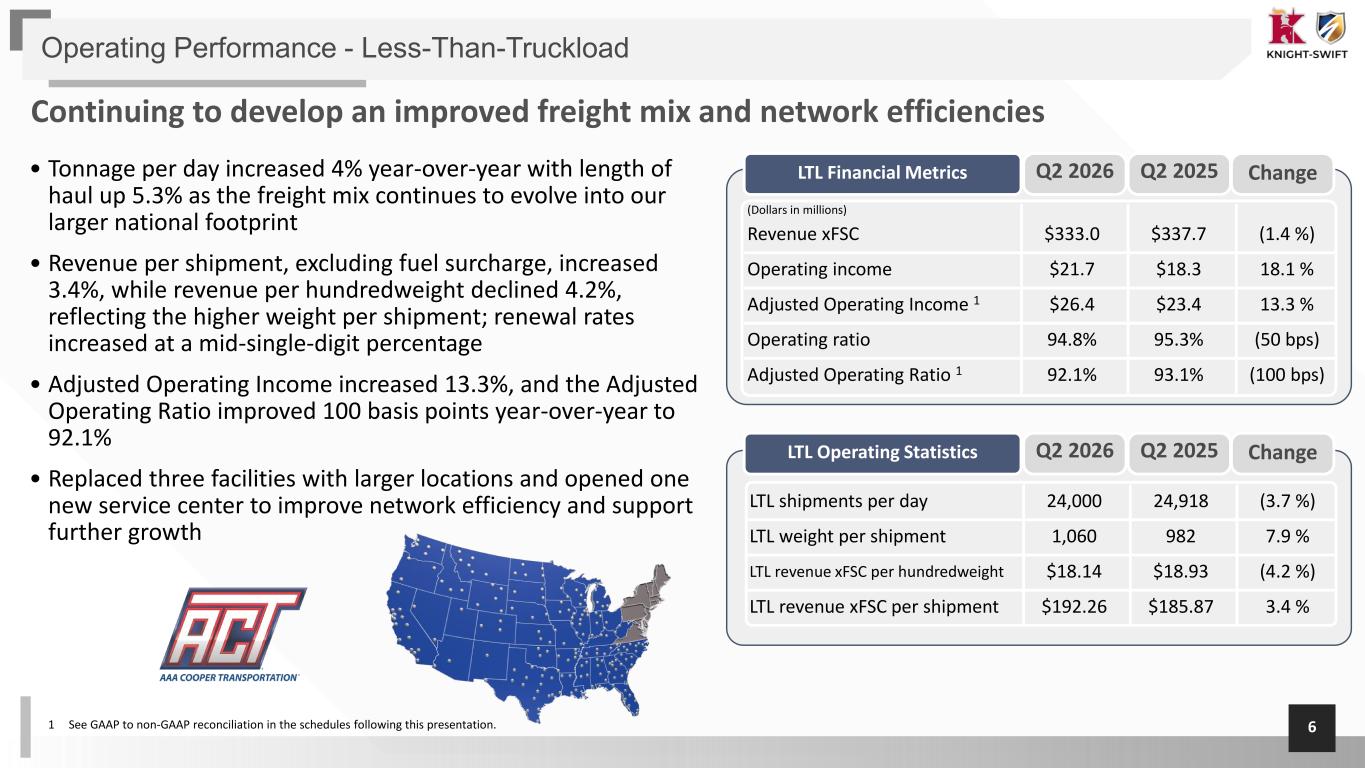
6 LTL shipments per day 24,000 24,918 (3.7 %) LTL weight per shipment 1,060 982 7.9 % LTL revenue xFSC per hundredweight $18.14 $18.93 (4.2 %) LTL revenue xFSC per shipment $192.26 $185.87 3.4 % Operating Performance - Less-Than-Truckload Continuing to develop an improved freight mix and network efficiencies (Dollars in millions) Revenue xFSC $333.0 $337.7 (1.4 %) Operating income $21.7 $18.3 18.1 % Adjusted Operating Income 1 $26.4 $23.4 13.3 % Operating ratio 94.8% 95.3% (50 bps) Adjusted Operating Ratio 1 92.1% 93.1% (100 bps) LTL Financial Metrics LTL Operating Statistics 1 See GAAP to non-GAAP reconciliation in the schedules following this presentation. • Tonnage per day increased 4% year-over-year with length of haul up 5.3% as the freight mix continues to evolve into our larger national footprint • Revenue per shipment, excluding fuel surcharge, increased 3.4%, while revenue per hundredweight declined 4.2%, reflecting the higher weight per shipment; renewal rates increased at a mid-single-digit percentage • Adjusted Operating Income increased 13.3%, and the Adjusted Operating Ratio improved 100 basis points year-over-year to 92.1% • Replaced three facilities with larger locations and opened one new service center to improve network efficiency and support further growth Q2 2026 Q2 2025 Change Q2 2026 Q2 2025 Change
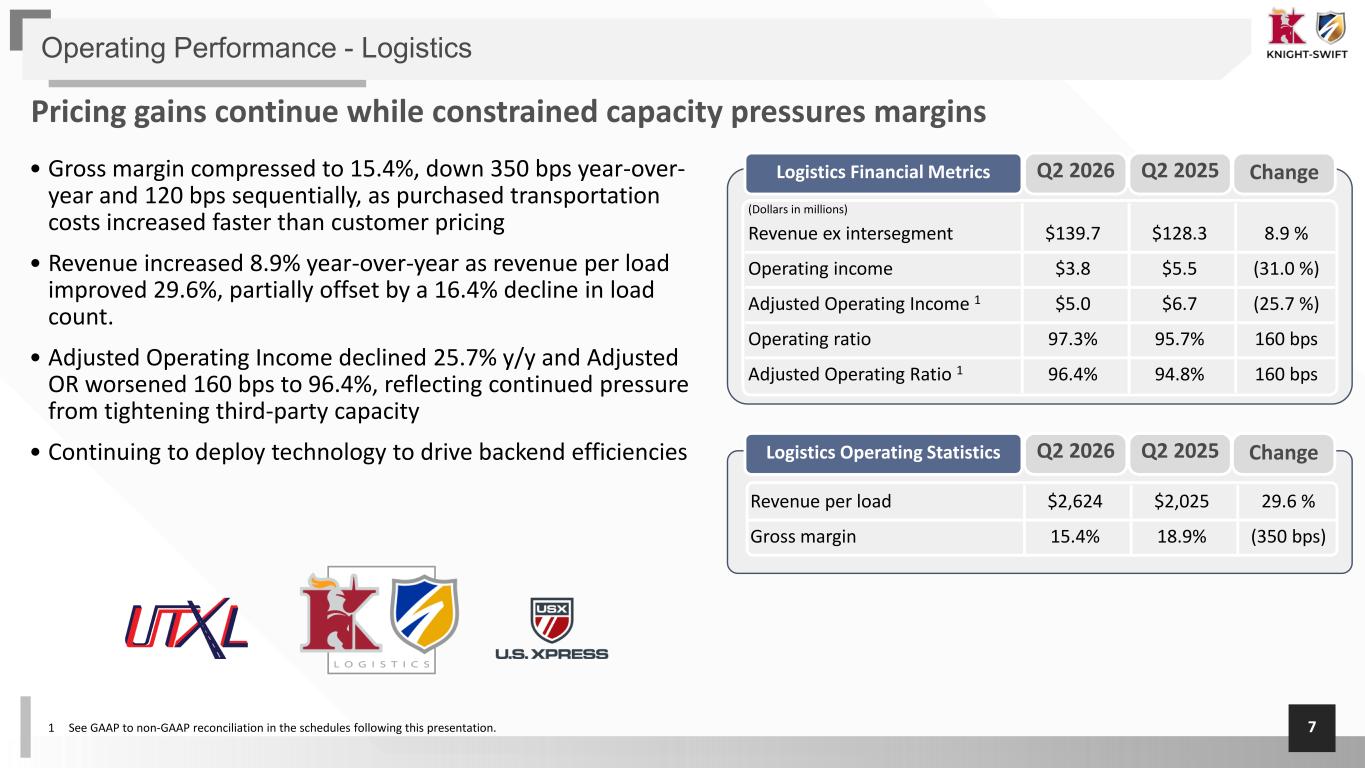
7 • Gross margin compressed to 15.4%, down 350 bps year-over- year and 120 bps sequentially, as purchased transportation costs increased faster than customer pricing • Revenue increased 8.9% year-over-year as revenue per load improved 29.6%, partially offset by a 16.4% decline in load count. • Adjusted Operating Income declined 25.7% y/y and Adjusted OR worsened 160 bps to 96.4%, reflecting continued pressure from tightening third-party capacity • Continuing to deploy technology to drive backend efficiencies Operating Performance - Logistics Pricing gains continue while constrained capacity pressures margins (Dollars in millions) Revenue ex intersegment $139.7 $128.3 8.9 % Operating income $3.8 $5.5 (31.0 %) Adjusted Operating Income 1 $5.0 $6.7 (25.7 %) Operating ratio 97.3% 95.7% 160 bps Adjusted Operating Ratio 1 96.4% 94.8% 160 bps Logistics Financial Metrics Revenue per load $2,624 $2,025 29.6 % Gross margin 15.4% 18.9% (350 bps) Logistics Operating Statistics 1 See GAAP to non-GAAP reconciliation in the schedules following this presentation. Q2 2026 Q2 2025 Change Q2 2026 Q2 2025 Change
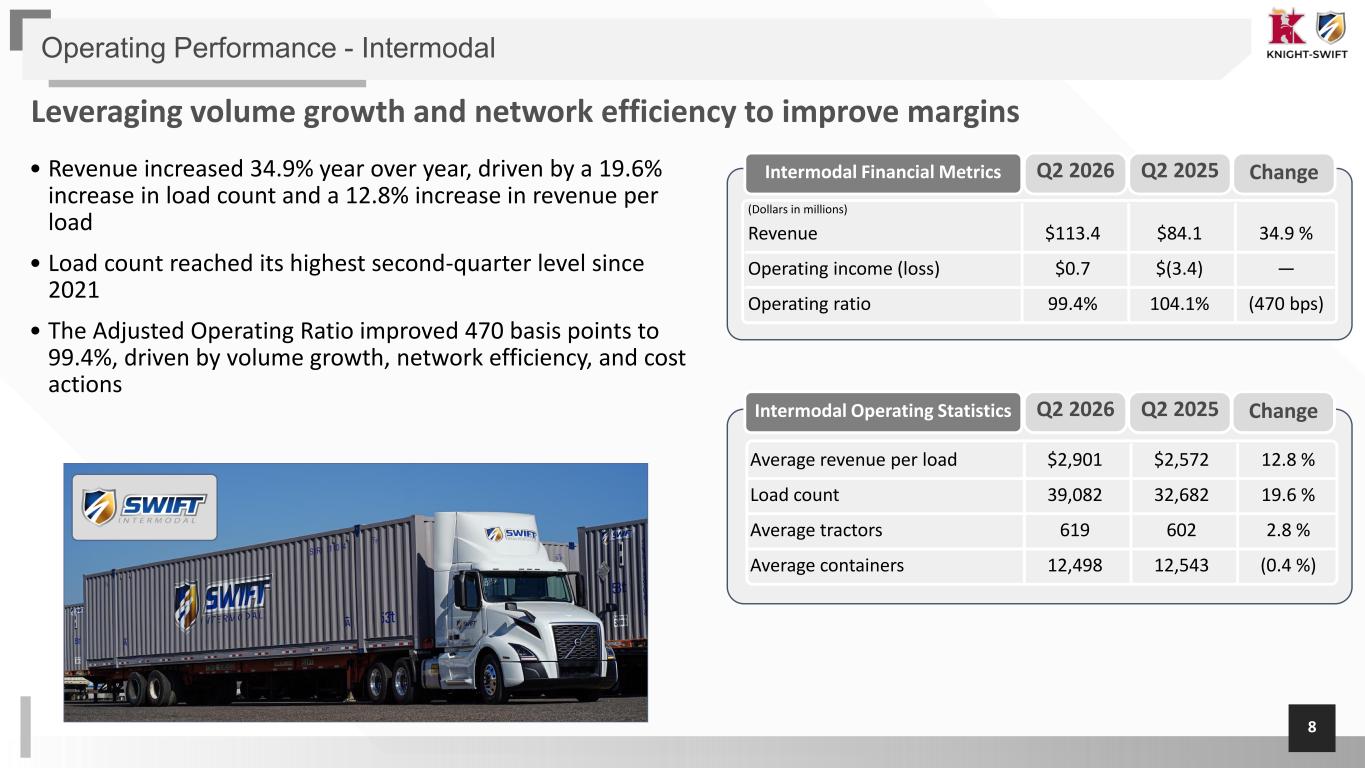
8 • Revenue increased 34.9% year over year, driven by a 19.6% increase in load count and a 12.8% increase in revenue per load • Load count reached its highest second-quarter level since 2021 • The Adjusted Operating Ratio improved 470 basis points to 99.4%, driven by volume growth, network efficiency, and cost actions Operating Performance - Intermodal Leveraging volume growth and network efficiency to improve margins (Dollars in millions) Revenue $113.4 $84.1 34.9 % Operating income (loss) $0.7 $(3.4) — Operating ratio 99.4% 104.1% (470 bps) Intermodal Financial Metrics Average revenue per load $2,901 $2,572 12.8 % Load count 39,082 32,682 19.6 % Average tractors 619 602 2.8 % Average containers 12,498 12,543 (0.4 %) Intermodal Operating Statistics Q2 2026 Q2 2025 Change Q2 2026 Q2 2025 Change
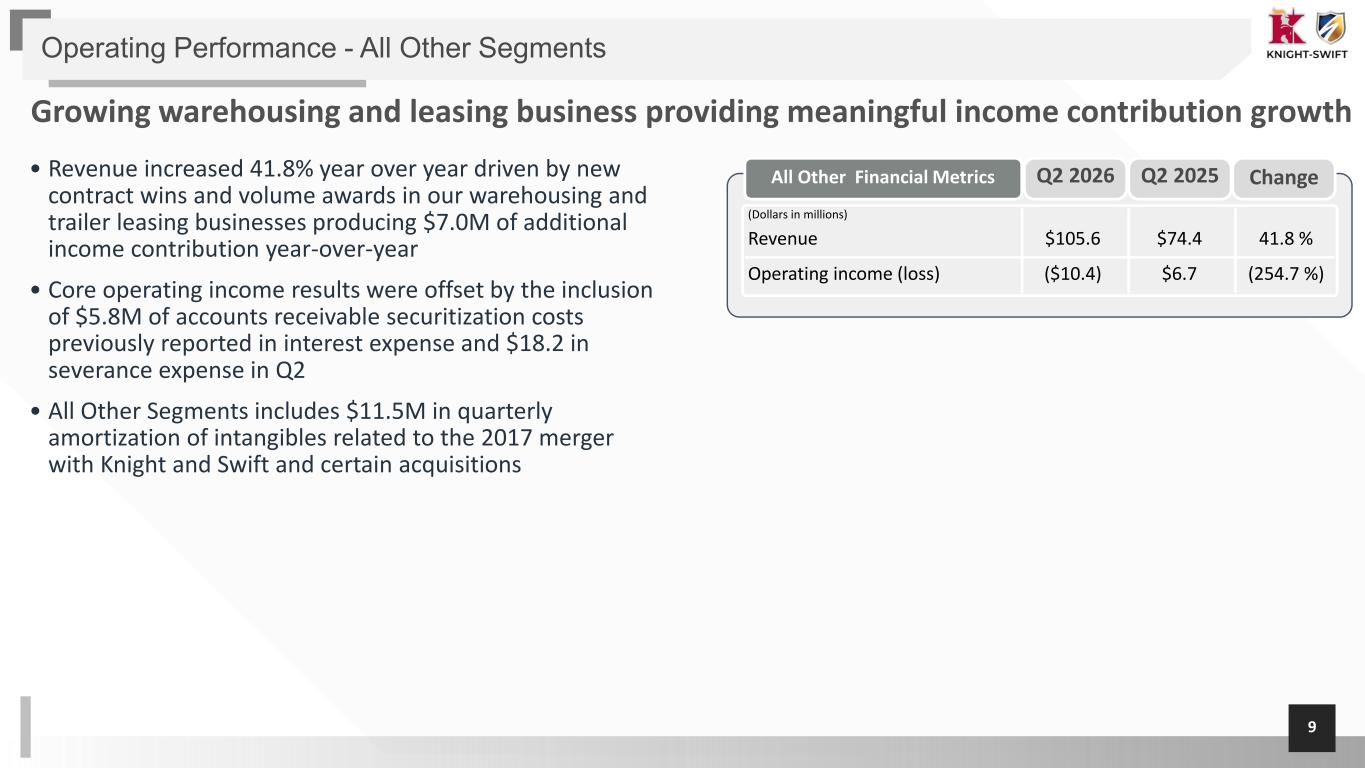
9 • Revenue increased 41.8% year over year driven by new contract wins and volume awards in our warehousing and trailer leasing businesses producing $7.0M of additional income contribution year-over-year • Core operating income results were offset by the inclusion of $5.8M of accounts receivable securitization costs previously reported in interest expense and $18.2 in severance expense in Q2 • All Other Segments includes $11.5M in quarterly amortization of intangibles related to the 2017 merger with Knight and Swift and certain acquisitions Operating Performance - All Other Segments Growing warehousing and leasing business providing meaningful income contribution growth (Dollars in millions) Revenue $105.6 $74.4 41.8 % Operating income (loss) ($10.4) $6.7 (254.7 %) All Other Financial Metrics Q2 2026 Q2 2025 Change
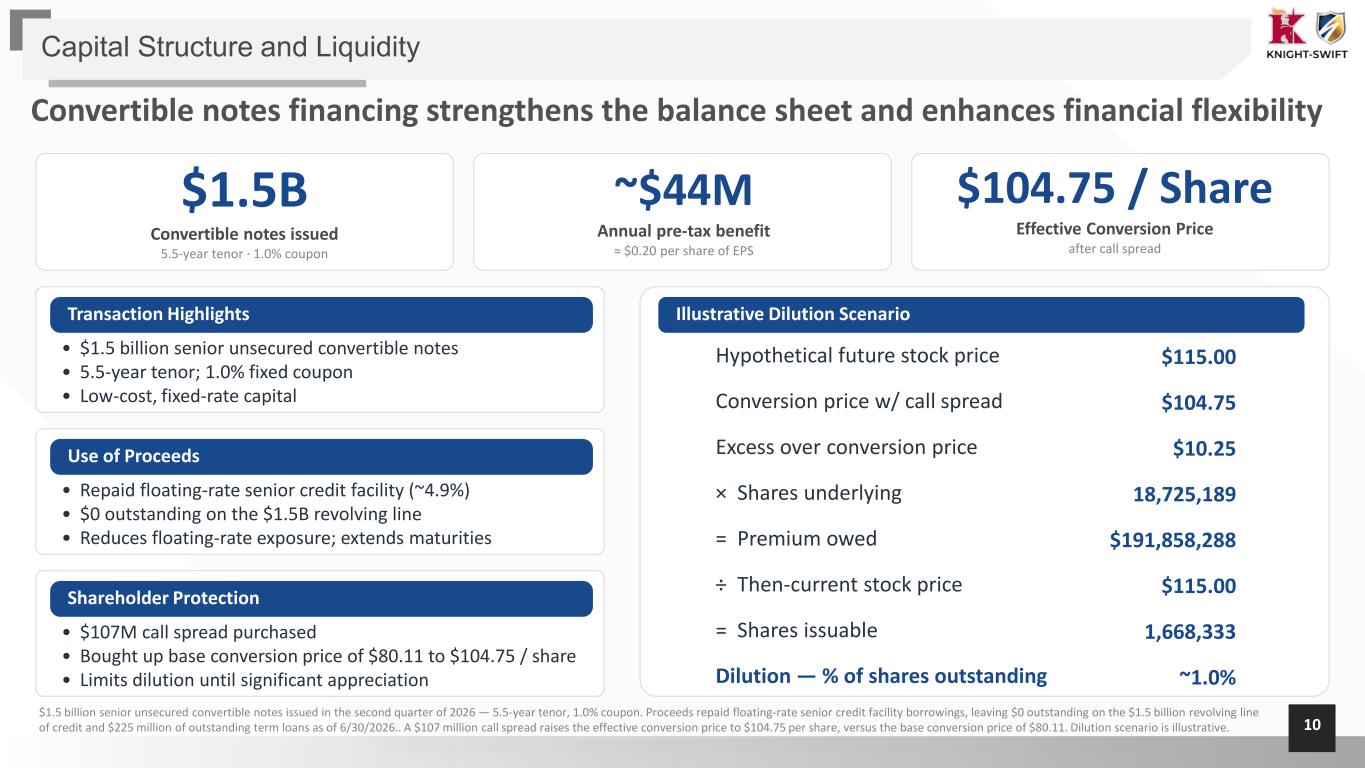
10 Capital Structure and Liquidity Convertible notes financing strengthens the balance sheet and enhances financial flexibility $1.5B Convertible notes issued 5.5-year tenor · 1.0% coupon ~$44M Annual pre-tax benefit ≈ $0.20 per share of EPS Transaction Highlights • $1.5 billion senior unsecured convertible notes • 5.5-year tenor; 1.0% fixed coupon • Low-cost, fixed-rate capital Use of Proceeds • Repaid floating-rate senior credit facility (~4.9%) • $0 outstanding on the $1.5B revolving line • Reduces floating-rate exposure; extends maturities Shareholder Protection • $107M call spread purchased • Bought up base conversion price of $80.11 to $104.75 / share • Limits dilution until significant appreciation Illustrative Dilution Scenario Hypothetical future stock price Conversion price w/ call spread Excess over conversion price × Shares underlying = Premium owed ÷ Then-current stock price = Shares issuable Dilution — % of shares outstanding $115.00 $104.75 $10.25 18,725,189 $191,858,288 $115.00 1,668,333 ~1.0% $1.5 billion senior unsecured convertible notes issued in the second quarter of 2026 — 5.5-year tenor, 1.0% coupon. Proceeds repaid floating-rate senior credit facility borrowings, leaving $0 outstanding on the $1.5 billion revolving line of credit and $225 million of outstanding term loans as of 6/30/2026.. A $107 million call spread raises the effective conversion price to $104.75 per share, versus the base conversion price of $80.11. Dilution scenario is illustrative. $104.75 / Share Effective Conversion Price after call spread
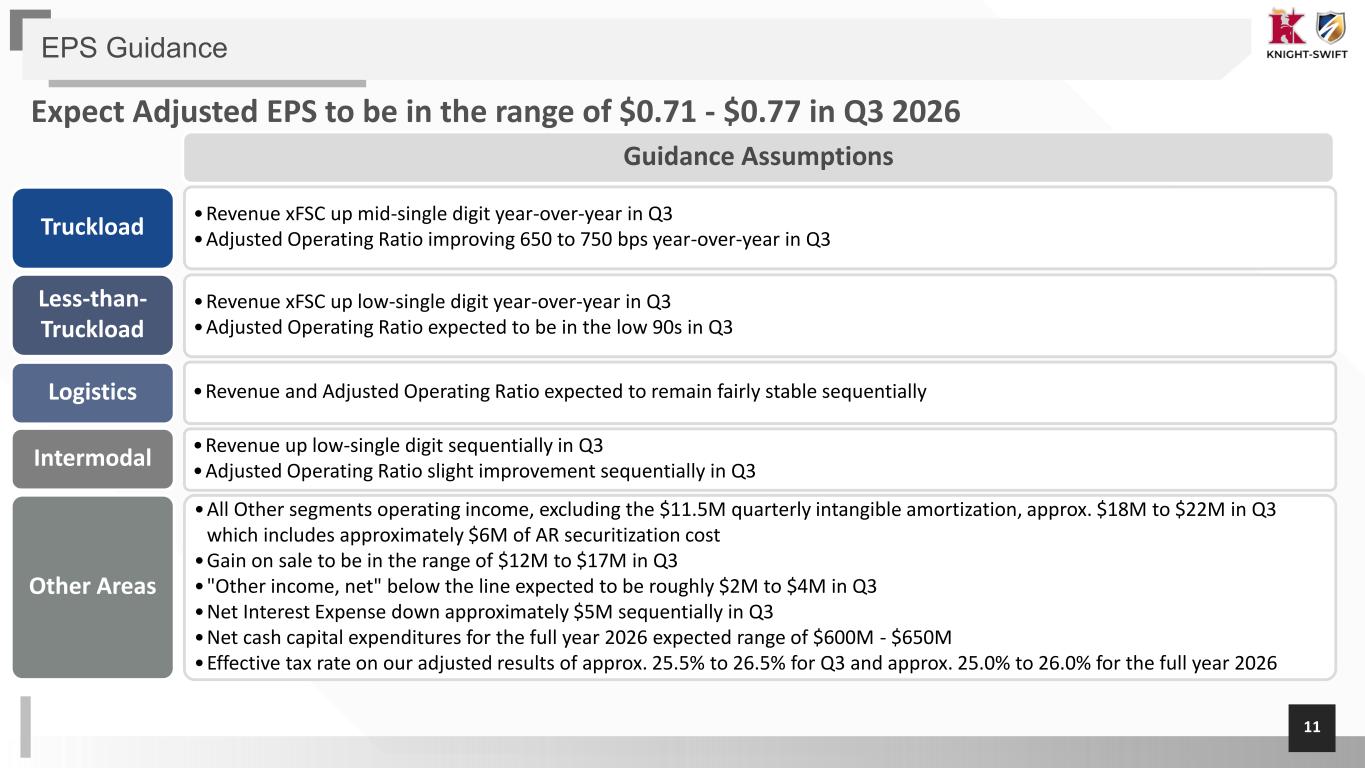
11 EPS Guidance Expect Adjusted EPS to be in the range of $0.71 - $0.77 in Q3 2026 Truckload •Revenue xFSC up mid-single digit year-over-year in Q3 •Adjusted Operating Ratio improving 650 to 750 bps year-over-year in Q3 Guidance Assumptions Less-than- Truckload •Revenue xFSC up low-single digit year-over-year in Q3 •Adjusted Operating Ratio expected to be in the low 90s in Q3 Logistics •Revenue up low-single digit sequentially in Q3 •Adjusted Operating Ratio slight improvement sequentially in Q3 •Revenue and Adjusted Operating Ratio expected to remain fairly stable sequentially Intermodal •All Other segments operating income, excluding the $11.5M quarterly intangible amortization, approx. $18M to $22M in Q3 which includes approximately $6M of AR securitization cost •Gain on sale to be in the range of $12M to $17M in Q3 •"Other income, net" below the line expected to be roughly $2M to $4M in Q3 •Net Interest Expense down approximately $5M sequentially in Q3 •Net cash capital expenditures for the full year 2026 expected range of $600M - $650M •Effective tax rate on our adjusted results of approx. 25.5% to 26.5% for Q3 and approx. 25.0% to 26.0% for the full year 2026 Other Areas

Appendix
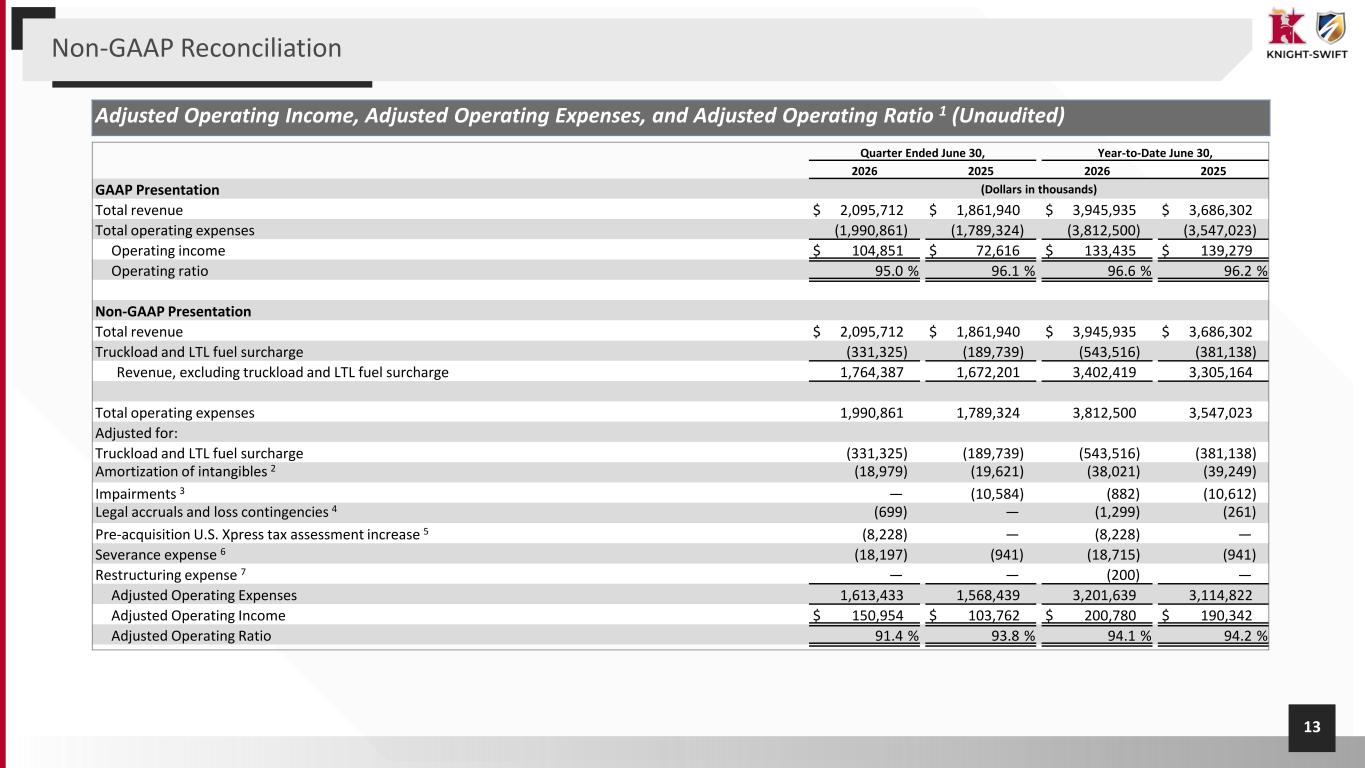
13 Adjusted Operating Income, Adjusted Operating Expenses, and Adjusted Operating Ratio 1 (Unaudited) Quarter Ended June 30, Year-to-Date June 30, 2026 2025 2026 2025 GAAP Presentation (Dollars in thousands) Total revenue $ 2,095,712 $ 1,861,940 $ 3,945,935 $ 3,686,302 Total operating expenses (1,990,861) (1,789,324) (3,812,500) (3,547,023) Operating income $ 104,851 $ 72,616 $ 133,435 $ 139,279 Operating ratio 95.0 % 96.1 % 96.6 % 96.2 % Non-GAAP Presentation Total revenue $ 2,095,712 $ 1,861,940 $ 3,945,935 $ 3,686,302 Truckload and LTL fuel surcharge (331,325) (189,739) (543,516) (381,138) Revenue, excluding truckload and LTL fuel surcharge 1,764,387 1,672,201 3,402,419 3,305,164 Total operating expenses 1,990,861 1,789,324 3,812,500 3,547,023 Adjusted for: Truckload and LTL fuel surcharge (331,325) (189,739) (543,516) (381,138) Amortization of intangibles 2 (18,979) (19,621) (38,021) (39,249) Impairments 3 — (10,584) (882) (10,612) Legal accruals and loss contingencies 4 (699) — (1,299) (261) Pre-acquisition U.S. Xpress tax assessment increase 5 (8,228) — (8,228) — Severance expense 6 (18,197) (941) (18,715) (941) Restructuring expense 7 — — (200) — Adjusted Operating Expenses 1,613,433 1,568,439 3,201,639 3,114,822 Adjusted Operating Income $ 150,954 $ 103,762 $ 200,780 $ 190,342 Adjusted Operating Ratio 91.4 % 93.8 % 94.1 % 94.2 % Non-GAAP Reconciliation
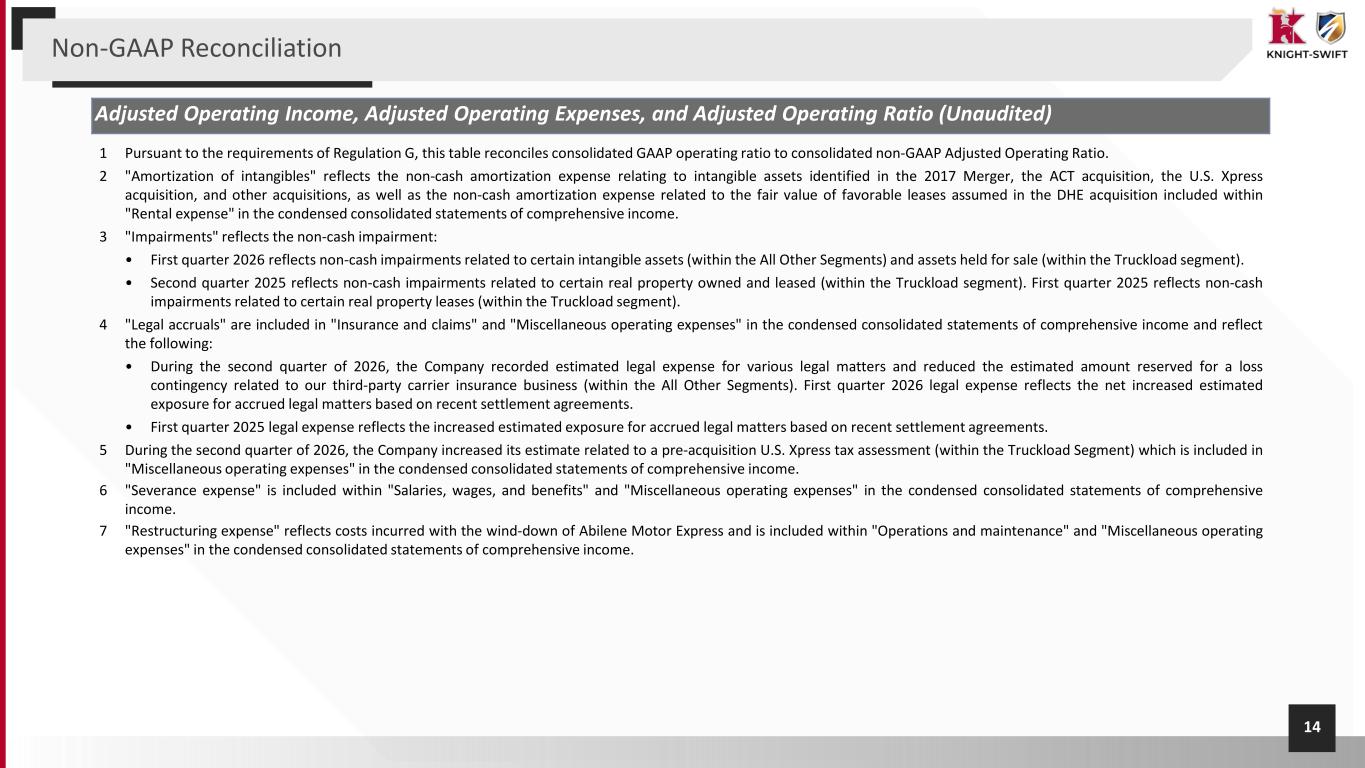
14 Adjusted Operating Income, Adjusted Operating Expenses, and Adjusted Operating Ratio (Unaudited) 1 Pursuant to the requirements of Regulation G, this table reconciles consolidated GAAP operating ratio to consolidated non-GAAP Adjusted Operating Ratio. 2 "Amortization of intangibles" reflects the non-cash amortization expense relating to intangible assets identified in the 2017 Merger, the ACT acquisition, the U.S. Xpress acquisition, and other acquisitions, as well as the non-cash amortization expense related to the fair value of favorable leases assumed in the DHE acquisition included within "Rental expense" in the condensed consolidated statements of comprehensive income. 3 "Impairments" reflects the non-cash impairment: • First quarter 2026 reflects non-cash impairments related to certain intangible assets (within the All Other Segments) and assets held for sale (within the Truckload segment). • Second quarter 2025 reflects non-cash impairments related to certain real property owned and leased (within the Truckload segment). First quarter 2025 reflects non-cash impairments related to certain real property leases (within the Truckload segment). 4 "Legal accruals" are included in "Insurance and claims" and "Miscellaneous operating expenses" in the condensed consolidated statements of comprehensive income and reflect the following: • During the second quarter of 2026, the Company recorded estimated legal expense for various legal matters and reduced the estimated amount reserved for a loss contingency related to our third-party carrier insurance business (within the All Other Segments). First quarter 2026 legal expense reflects the net increased estimated exposure for accrued legal matters based on recent settlement agreements. • First quarter 2025 legal expense reflects the increased estimated exposure for accrued legal matters based on recent settlement agreements. 5 During the second quarter of 2026, the Company increased its estimate related to a pre-acquisition U.S. Xpress tax assessment (within the Truckload Segment) which is included in "Miscellaneous operating expenses" in the condensed consolidated statements of comprehensive income. 6 "Severance expense" is included within "Salaries, wages, and benefits" and "Miscellaneous operating expenses" in the condensed consolidated statements of comprehensive income. 7 "Restructuring expense" reflects costs incurred with the wind-down of Abilene Motor Express and is included within "Operations and maintenance" and "Miscellaneous operating expenses" in the condensed consolidated statements of comprehensive income. Non-GAAP Reconciliation
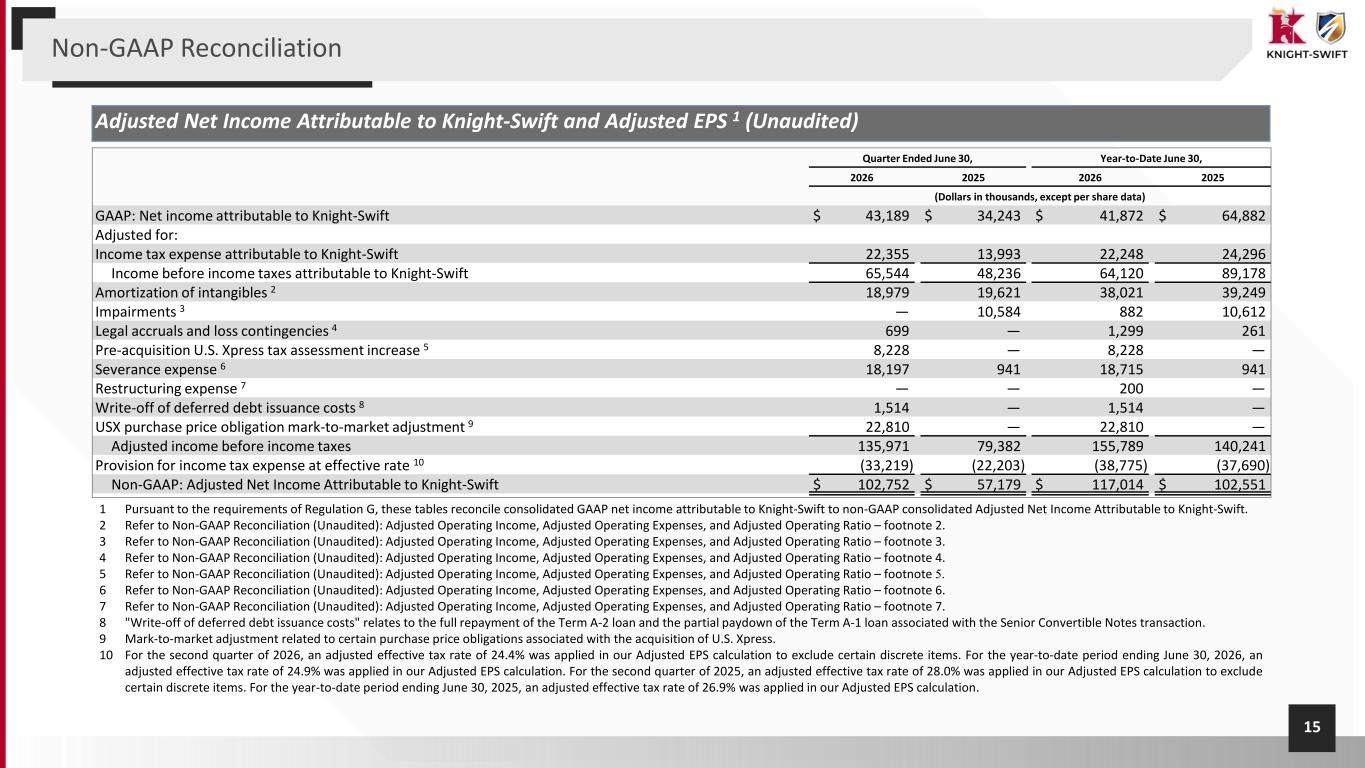
15 1 Pursuant to the requirements of Regulation G, these tables reconcile consolidated GAAP net income attributable to Knight-Swift to non-GAAP consolidated Adjusted Net Income Attributable to Knight-Swift. 2 Refer to Non-GAAP Reconciliation (Unaudited): Adjusted Operating Income, Adjusted Operating Expenses, and Adjusted Operating Ratio – footnote 2. 3 Refer to Non-GAAP Reconciliation (Unaudited): Adjusted Operating Income, Adjusted Operating Expenses, and Adjusted Operating Ratio – footnote 3. 4 Refer to Non-GAAP Reconciliation (Unaudited): Adjusted Operating Income, Adjusted Operating Expenses, and Adjusted Operating Ratio – footnote 4. 5 Refer to Non-GAAP Reconciliation (Unaudited): Adjusted Operating Income, Adjusted Operating Expenses, and Adjusted Operating Ratio – footnote 5. 6 Refer to Non-GAAP Reconciliation (Unaudited): Adjusted Operating Income, Adjusted Operating Expenses, and Adjusted Operating Ratio – footnote 6. 7 Refer to Non-GAAP Reconciliation (Unaudited): Adjusted Operating Income, Adjusted Operating Expenses, and Adjusted Operating Ratio – footnote 7. 8 "Write-off of deferred debt issuance costs" relates to the full repayment of the Term A-2 loan and the partial paydown of the Term A-1 loan associated with the Senior Convertible Notes transaction. 9 Mark-to-market adjustment related to certain purchase price obligations associated with the acquisition of U.S. Xpress. 10 For the second quarter of 2026, an adjusted effective tax rate of 24.4% was applied in our Adjusted EPS calculation to exclude certain discrete items. For the year-to-date period ending June 30, 2026, an adjusted effective tax rate of 24.9% was applied in our Adjusted EPS calculation. For the second quarter of 2025, an adjusted effective tax rate of 28.0% was applied in our Adjusted EPS calculation to exclude certain discrete items. For the year-to-date period ending June 30, 2025, an adjusted effective tax rate of 26.9% was applied in our Adjusted EPS calculation. Adjusted Net Income Attributable to Knight-Swift and Adjusted EPS 1 (Unaudited) Quarter Ended June 30, Year-to-Date June 30, 2026 2025 2026 2025 (Dollars in thousands, except per share data) GAAP: Net income attributable to Knight-Swift $ 43,189 $ 34,243 $ 41,872 $ 64,882 Adjusted for: Income tax expense attributable to Knight-Swift 22,355 13,993 22,248 24,296 Income before income taxes attributable to Knight-Swift 65,544 48,236 64,120 89,178 Amortization of intangibles 2 18,979 19,621 38,021 39,249 Impairments 3 — 10,584 882 10,612 Legal accruals and loss contingencies 4 699 — 1,299 261 Pre-acquisition U.S. Xpress tax assessment increase 5 8,228 — 8,228 — Severance expense 6 18,197 941 18,715 941 Restructuring expense 7 — — 200 — Write-off of deferred debt issuance costs 8 1,514 — 1,514 — USX purchase price obligation mark-to-market adjustment 9 22,810 — 22,810 — Adjusted income before income taxes 135,971 79,382 155,789 140,241 Provision for income tax expense at effective rate 10 (33,219) (22,203) (38,775) (37,690) Non-GAAP: Adjusted Net Income Attributable to Knight-Swift $ 102,752 $ 57,179 $ 117,014 $ 102,551 Non-GAAP Reconciliation
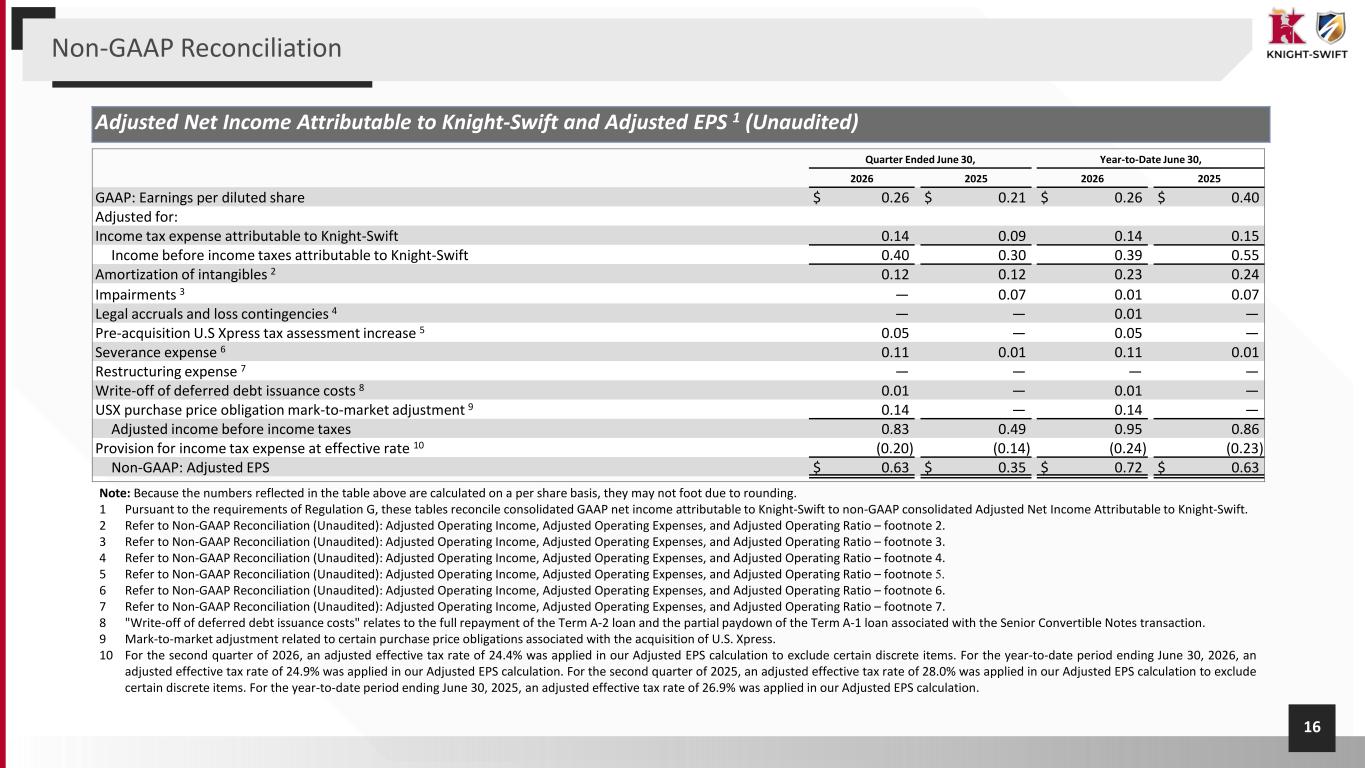
16 Adjusted Net Income Attributable to Knight-Swift and Adjusted EPS 1 2 (Unaudited) Quarter Ended June 30, Year-to-Date June 30, 2026 2025 2026 2025 GAAP: Earnings per diluted share $ 0.26 $ 0.21 $ 0.26 $ 0.40 Adjusted for: Income tax expense attributable to Knight-Swift 0.14 0.09 0.14 0.15 Income before income taxes attributable to Knight-Swift 0.40 0.30 0.39 0.55 Amortization of intangibles 2 0.12 0.12 0.23 0.24 Impairments 3 — 0.07 0.01 0.07 Legal accruals and loss contingencies 4 — — 0.01 — Pre-acquisition U.S Xpress tax assessment increase 5 0.05 — 0.05 — Severance expense 6 0.11 0.01 0.11 0.01 Restructuring expense 7 — — — — Write-off of deferred debt issuance costs 8 0.01 — 0.01 — USX purchase price obligation mark-to-market adjustment 9 0.14 — 0.14 — Adjusted income before income taxes 0.83 0.49 0.95 0.86 Provision for income tax expense at effective rate 10 (0.20) (0.14) (0.24) (0.23) Non-GAAP: Adjusted EPS $ 0.63 $ 0.35 $ 0.72 $ 0.63 Note: Because the numbers reflected in the table above are calculated on a per share basis, they may not foot due to rounding. 1 Pursuant to the requirements of Regulation G, these tables reconcile consolidated GAAP net income attributable to Knight-Swift to non-GAAP consolidated Adjusted Net Income Attributable to Knight-Swift. 2 Refer to Non-GAAP Reconciliation (Unaudited): Adjusted Operating Income, Adjusted Operating Expenses, and Adjusted Operating Ratio – footnote 2. 3 Refer to Non-GAAP Reconciliation (Unaudited): Adjusted Operating Income, Adjusted Operating Expenses, and Adjusted Operating Ratio – footnote 3. 4 Refer to Non-GAAP Reconciliation (Unaudited): Adjusted Operating Income, Adjusted Operating Expenses, and Adjusted Operating Ratio – footnote 4. 5 Refer to Non-GAAP Reconciliation (Unaudited): Adjusted Operating Income, Adjusted Operating Expenses, and Adjusted Operating Ratio – footnote 5. 6 Refer to Non-GAAP Reconciliation (Unaudited): Adjusted Operating Income, Adjusted Operating Expenses, and Adjusted Operating Ratio – footnote 6. 7 Refer to Non-GAAP Reconciliation (Unaudited): Adjusted Operating Income, Adjusted Operating Expenses, and Adjusted Operating Ratio – footnote 7. 8 "Write-off of deferred debt issuance costs" relates to the full repayment of the Term A-2 loan and the partial paydown of the Term A-1 loan associated with the Senior Convertible Notes transaction. 9 Mark-to-market adjustment related to certain purchase price obligations associated with the acquisition of U.S. Xpress. 10 For the second quarter of 2026, an adjusted effective tax rate of 24.4% was applied in our Adjusted EPS calculation to exclude certain discrete items. For the year-to-date period ending June 30, 2026, an adjusted effective tax rate of 24.9% was applied in our Adjusted EPS calculation. For the second quarter of 2025, an adjusted effective tax rate of 28.0% was applied in our Adjusted EPS calculation to exclude certain discrete items. For the year-to-date period ending June 30, 2025, an adjusted effective tax rate of 26.9% was applied in our Adjusted EPS calculation. djusted Net Income Attributable to Knight-Swift and Adjusted EPS 1 (Una di ) Non-GAAP Reconciliation
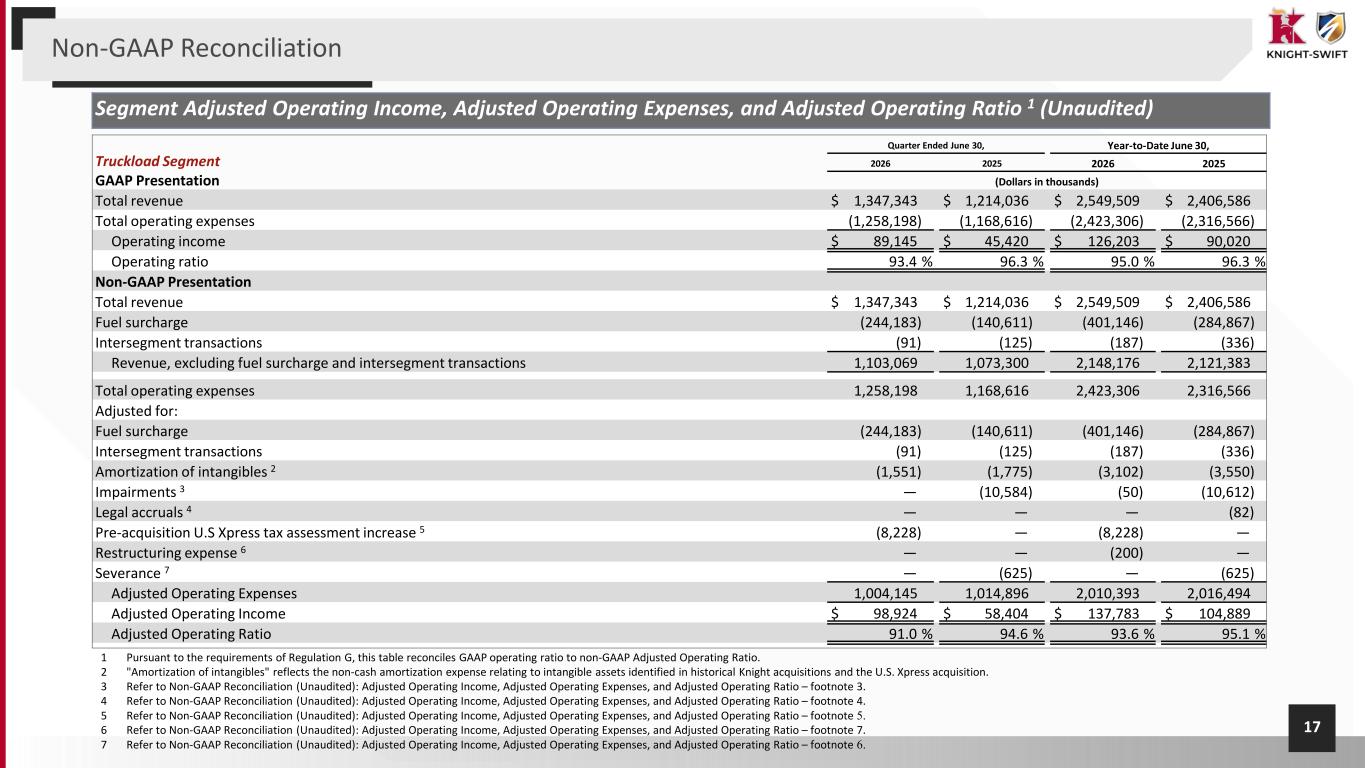
17 Segment Adjusted Operating Income, Adjusted Operating Expenses, and Adjusted Operating Ratio 1 (Unaudited) Quarter Ended June 30, Year-to-Date June 30, Truckload Segment 2026 2025 2026 2025 GAAP Presentation (Dollars in thousands) Total revenue $ 1,347,343 $ 1,214,036 $ 2,549,509 $ 2,406,586 Total operating expenses (1,258,198) (1,168,616) (2,423,306) (2,316,566) Operating income $ 89,145 $ 45,420 $ 126,203 $ 90,020 Operating ratio 93.4 % 96.3 % 95.0 % 96.3 % Non-GAAP Presentation Total revenue $ 1,347,343 $ 1,214,036 $ 2,549,509 $ 2,406,586 Fuel surcharge (244,183) (140,611) (401,146) (284,867) Intersegment transactions (91) (125) (187) (336) Revenue, excluding fuel surcharge and intersegment transactions 1,103,069 1,073,300 2,148,176 2,121,383 Total operating expenses 1,258,198 1,168,616 2,423,306 2,316,566 Adjusted for: Fuel surcharge (244,183) (140,611) (401,146) (284,867) Intersegment transactions (91) (125) (187) (336) Amortization of intangibles 2 (1,551) (1,775) (3,102) (3,550) Impairments 3 — (10,584) (50) (10,612) Legal accruals 4 — — — (82) Pre-acquisition U.S Xpress tax assessment increase 5 (8,228) — (8,228) — Restructuring expense 6 — — (200) — Severance 7 — (625) — (625) Adjusted Operating Expenses 1,004,145 1,014,896 2,010,393 2,016,494 Adjusted Operating Income $ 98,924 $ 58,404 $ 137,783 $ 104,889 Adjusted Operating Ratio 91.0 % 94.6 % 93.6 % 95.1 % 1 Pursuant to the requirements of Regulation G, this table reconciles GAAP operating ratio to non-GAAP Adjusted Operating Ratio. 2 "Amortization of intangibles" reflects the non-cash amortization expense relating to intangible assets identified in historical Knight acquisitions and the U.S. Xpress acquisition. 3 Refer to Non-GAAP Reconciliation (Unaudited): Adjusted Operating Income, Adjusted Operating Expenses, and Adjusted Operating Ratio – footnote 3. 4 Refer to Non-GAAP Reconciliation (Unaudited): Adjusted Operating Income, Adjusted Operating Expenses, and Adjusted Operating Ratio – footnote 4. 5 Refer to Non-GAAP Reconciliation (Unaudited): Adjusted Operating Income, Adjusted Operating Expenses, and Adjusted Operating Ratio – footnote 5. 6 Refer to Non-GAAP Reconciliation (Unaudited): Adjusted Operating Income, Adjusted Operating Expenses, and Adjusted Operating Ratio – footnote 7. 7 Refer to Non-GAAP Reconciliation (Unaudited): Adjusted Operating Income, Adjusted Operating Expenses, and Adjusted Operating Ratio – footnote 6. Non-GAAP Reconciliation
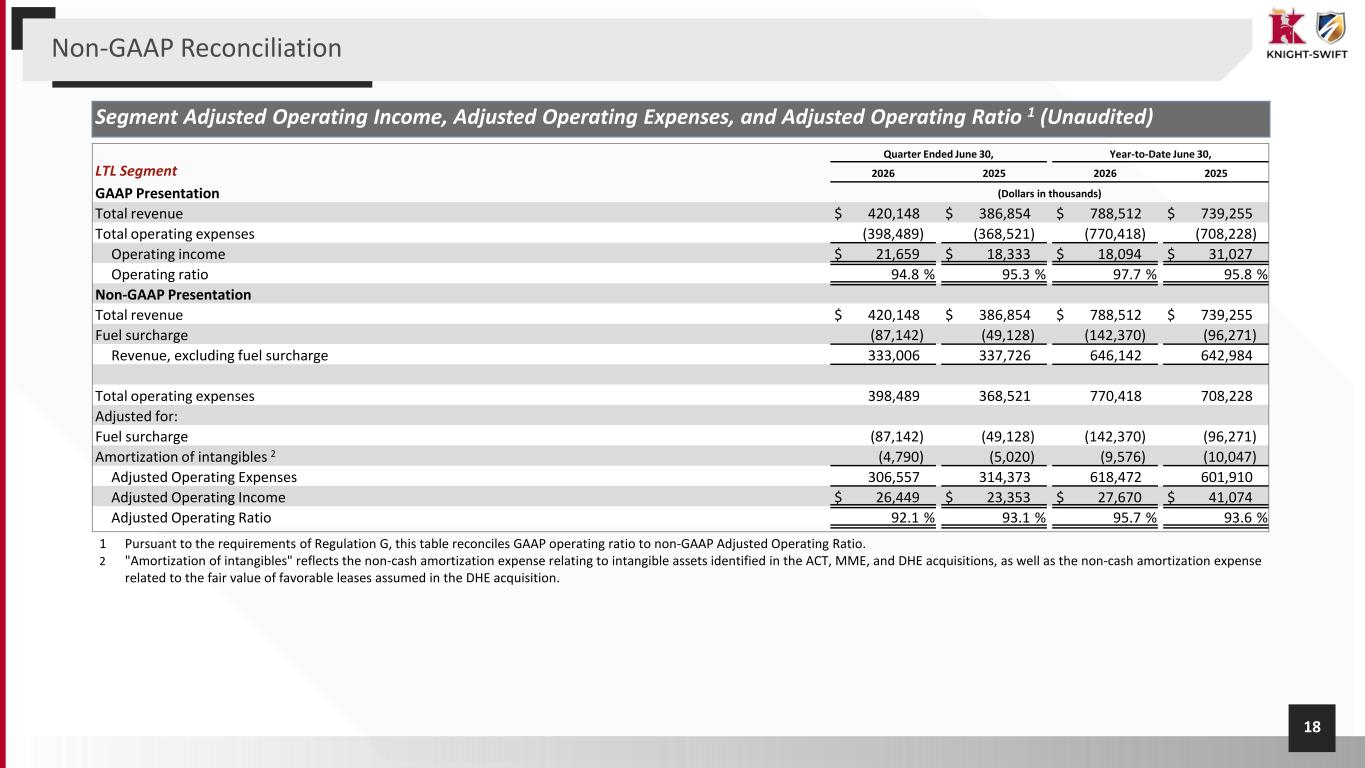
18 Segment Adjusted Operating Income, Adjusted Operating Expenses, and Adjusted Operating Ratio 1 (Unaudited) Quarter Ended June 30, Year-to-Date June 30, LTL Segment 2026 2025 2026 2025 GAAP Presentation (Dollars in thousands) Total revenue $ 420,148 $ 386,854 $ 788,512 $ 739,255 Total operating expenses (398,489) (368,521) (770,418) (708,228) Operating income $ 21,659 $ 18,333 $ 18,094 $ 31,027 Operating ratio 94.8 % 95.3 % 97.7 % 95.8 % Non-GAAP Presentation Total revenue $ 420,148 $ 386,854 $ 788,512 $ 739,255 Fuel surcharge (87,142) (49,128) (142,370) (96,271) Revenue, excluding fuel surcharge 333,006 337,726 646,142 642,984 Total operating expenses 398,489 368,521 770,418 708,228 Adjusted for: Fuel surcharge (87,142) (49,128) (142,370) (96,271) Amortization of intangibles 2 (4,790) (5,020) (9,576) (10,047) Adjusted Operating Expenses 306,557 314,373 618,472 601,910 Adjusted Operating Income $ 26,449 $ 23,353 $ 27,670 $ 41,074 Adjusted Operating Ratio 92.1 % 93.1 % 95.7 % 93.6 % 1 Pursuant to the requirements of Regulation G, this table reconciles GAAP operating ratio to non-GAAP Adjusted Operating Ratio. 2 "Amortization of intangibles" reflects the non-cash amortization expense relating to intangible assets identified in the ACT, MME, and DHE acquisitions, as well as the non-cash amortization expense related to the fair value of favorable leases assumed in the DHE acquisition. Non-GAAP Reconciliation
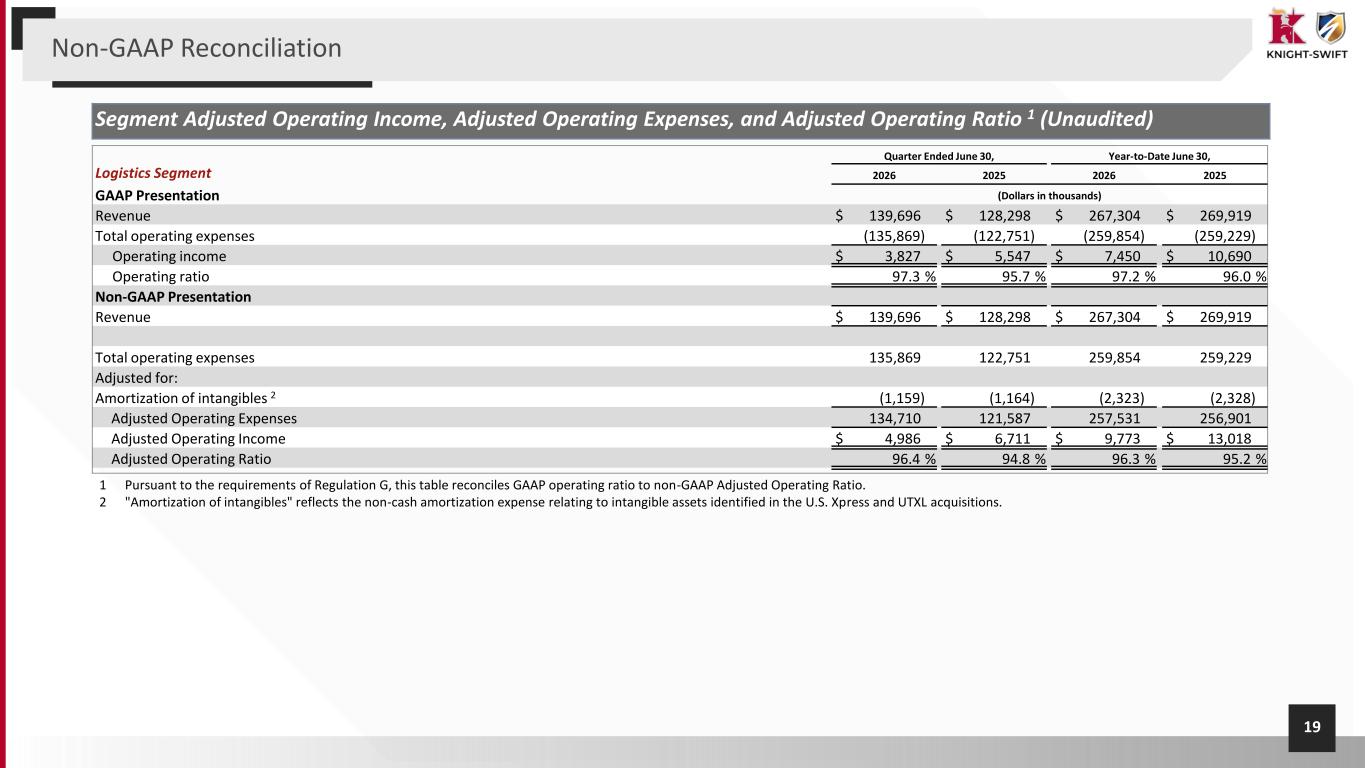
19 Quarter Ended June 30, Year-to-Date June 30, Logistics Segment 2026 2025 2026 2025 GAAP Presentation (Dollars in thousands) Revenue $ 139,696 $ 128,298 $ 267,304 $ 269,919 Total operating expenses (135,869) (122,751) (259,854) (259,229) Operating income $ 3,827 $ 5,547 $ 7,450 $ 10,690 Operating ratio 97.3 % 95.7 % 97.2 % 96.0 % Non-GAAP Presentation Revenue $ 139,696 $ 128,298 $ 267,304 $ 269,919 Total operating expenses 135,869 122,751 259,854 259,229 Adjusted for: Amortization of intangibles 2 (1,159) (1,164) (2,323) (2,328) Adjusted Operating Expenses 134,710 121,587 257,531 256,901 Adjusted Operating Income $ 4,986 $ 6,711 $ 9,773 $ 13,018 Adjusted Operating Ratio 96.4 % 94.8 % 96.3 % 95.2 % Segment Adjusted Operating Income, Adjusted Operating Expenses, and Adjusted Operating Ratio 1 (Unaudited) 1 Pursuant to the requirements of Regulation G, this table reconciles GAAP operating ratio to non-GAAP Adjusted Operating Ratio. 2 "Amortization of intangibles" reflects the non-cash amortization expense relating to intangible assets identified in the U.S. Xpress and UTXL acquisitions. Non-GAAP Reconciliation
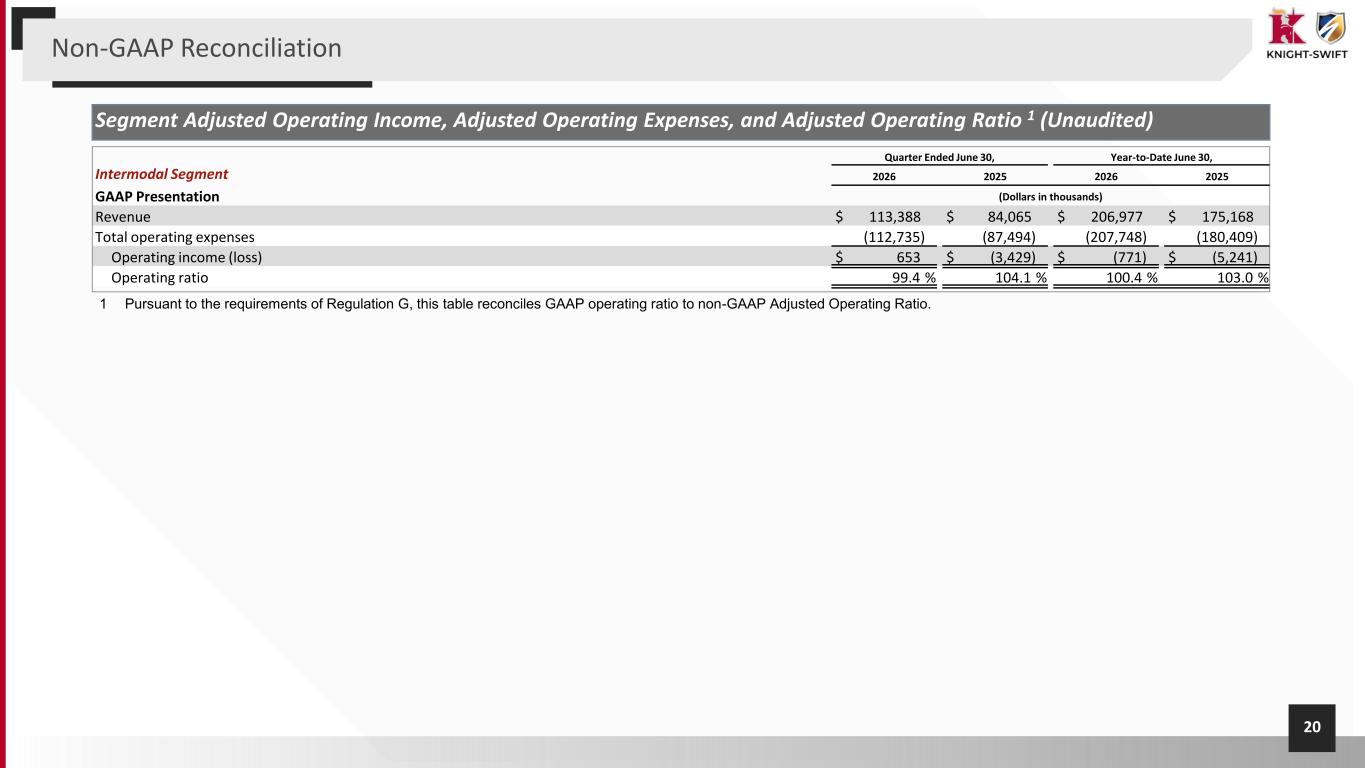
20 Segment Adjusted Operating Income, Adjusted Operating Expenses, and Adjusted Operating Ratio 1 (Unaudited) Quarter Ended June 30, Year-to-Date June 30, Intermodal Segment 2026 2025 2026 2025 GAAP Presentation (Dollars in thousands) Revenue $ 113,388 $ 84,065 $ 206,977 $ 175,168 Total operating expenses (112,735) (87,494) (207,748) (180,409) Operating income (loss) $ 653 $ (3,429) $ (771) $ (5,241) Operating ratio 99.4 % 104.1 % 100.4 % 103.0 % 1 Pursuant to the requirements of Regulation G, this table reconciles GAAP operating ratio to non-GAAP Adjusted Operating Ratio. Non-GAAP Reconciliation