
Exhibit 99.2
DR. REDDY’S LABORATORIES LTD. 8-2-337, Road No. 3, Banjara Hills, Hyderabad - 500034. Telangana, India. |
CONTACT | |
| Investor relationS | Media relationS | |
AISHWARYA SITHARAM aishwaryasitharam@drreddys.com |
SANTOSH VYAS santoshvyas@drreddys.com | |
Dr. Reddy’s Q1FY27 Financial Results
Hyderabad, India, July 22, 2026: Dr. Reddy’s Laboratories Ltd. (BSE: 500124 | NSE: DRREDDY | NYSE: RDY | NSEIFSC: DRREDDY) today announced its consolidated financial results for the quarter ended June 30, 2026. The information mentioned in this release is based on consolidated financial statements under International Financial Reporting Standards (IFRS).
| Particulars | Q1FY27 |
|
Revenues
|
₹ 80,705 Mn [Down: 5.6% YoY; Up: 7.4% QoQ] |
|
Gross Margin
|
46.5% [Q4FY26: 56.9%; Q4FY26: 44.8%] |
|
EBITDA
|
₹ 10,088 Mn [12.5% of Revenues] |
|
Profit before Tax
|
₹ 5,526 Mn [6.8% of Revenues] |
|
Profit after Tax attributable to Equity Holders |
₹ 4,435 Mn [5.5% of Revenues] |
Notes: Results include the adverse impact of a provision of ₹ 2,397 Mn towards inventory and other associated costs related to semaglutide’s active pharmaceutical ingredient (’semaglutide API related impact’), resulting in a decrease in gross profit, EBITDA and PBT margins by ~3%.
Commenting on the results, Co-Chairman & MD, G V Prasad said: “Our Q1FY27 performance reflected the expected transition beyond lenalidomide revenues, along with an unexpected impact related to semaglutide API. However, our underlying base business continued to deliver healthy double-digit growth across all key geographies. Our focus remains on improving the health of our base business through disciplined execution and operational excellence, while building our future pipeline of peptides, biosimilars, and innovative assets to deliver long-term growth.”
 |
 |
 |
| 1 |
| All amounts in millions, except EPS | All US dollar amounts based on convenience translation rate of 1 USD = ₹94.66 |
Dr. Reddy’s Laboratories Limited & Subsidiaries
Revenue Mix by Segment for the quarter
| Particulars | Q1FY27 | Q1FY26 | YoY | Q4FY26 | QoQ | |||||||||||||||
| (₹) | (₹) | Gr% | (₹) | Gr% | ||||||||||||||||
| Global Generics | 71,993 | 75,620 | (5 | ) | 65,802 | 9 | ||||||||||||||
| North America | 22,048 | 34,123 | (35 | ) | 17,562 | 26 | ||||||||||||||
| Emerging Markets | 18,328 | 14,042 | 31 | 18,057 | 2 | |||||||||||||||
| India | 17,177 | 14,711 | 17 | 15,663 | 10 | |||||||||||||||
| Europe | 14,440 | 12,744 | 13 | 14,520 | (0.6 | ) | ||||||||||||||
| Pharmaceutical Services and Active Ingredients (PSAI) | 8,519 | 8,181 | 4 | 9,124 | (7 | ) | ||||||||||||||
| Others | 193 | 1,651 | (88 | ) | 236 | (18 | ) | |||||||||||||
| Total | 80,705 | 85,452 | (6 | ) | 75,162 | 7 | ||||||||||||||
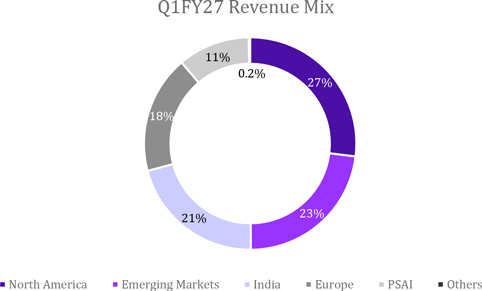
Branded businesses, namely India, Emerging Markets and the acquired consumer health portfolio in
Nicotine Replacement Therapy, account for 52% of Q1FY27 revenues.
|
|
|
| 2 |
Consolidated Income Statement for the quarter
| Particulars | Q1FY27 | Q1FY26 | YoY | Q4FY26 | QoQ | |||||||||||||||||||||||||||
| ($) | (₹) | ($) | (₹) | Gr% | ($) | (₹) | Gr% | |||||||||||||||||||||||||
| Revenues | 853 | 80,705 | 903 | 85,452 | (6 | ) | 794 | 75,162 | 7 | |||||||||||||||||||||||
| Cost of Revenues | 456 | 43,165 | 389 | 36,825 | 17 | 438 | 41,471 | 4 | ||||||||||||||||||||||||
| Gross Profit | 397 | 37,540 | 514 | 48,627 | (23 | ) | 356 | 33,691 | 11 | |||||||||||||||||||||||
| % of Revenues | 46.5 | % | 56.9 | % | 44.8 | % | ||||||||||||||||||||||||||
| Selling, General & Administrative Expenses | 304 | 28,820 | 271 | 25,647 | 12 | 293 | 27,762 | 4 | ||||||||||||||||||||||||
| % of Revenues | 35.7 | % | 30.0 | % | 36.9 | % | ||||||||||||||||||||||||||
| Research & Development Expenses | 61 | 5,766 | 66 | 6,244 | (8 | ) | 58 | 5,463 | 6 | |||||||||||||||||||||||
| % of Revenues | 7.1 | % | 7.3 | % | 7.3 | % | ||||||||||||||||||||||||||
| Impairment of Non-Current Assets, net | 0.2 | 15 | - | - | - | 27 | 2,586 | (99 | ) | |||||||||||||||||||||||
| Other (Income)/Expense, net | (9 | ) | (845 | ) | (8 | ) | (739 | ) | 14 | (36 | ) | (3445 | ) | (75 | ) | |||||||||||||||||
| Results from Operating Activities | 40 | 3,784 | 185 | 17,475 | (78 | ) | 14 | 1,325 | 186 | |||||||||||||||||||||||
| Finance (Income)/Expense, net | (18 | ) | (1,734 | ) | (17 | ) | (1,570 | ) | 10 | (7 | ) | (620 | ) | 180 | ||||||||||||||||||
| Share of Profit of Equity Investees, net of tax | (0.1 | ) | (8 | ) | (0.02 | ) | (2 | ) | 300 | (0.5 | ) | (46 | ) | (83 | ) | |||||||||||||||||
| Profit before Income Tax | 58 | 5,526 | 201 | 19,047 | (71 | ) | 21 | 1,991 | 178 | |||||||||||||||||||||||
| % of Revenues | 6.8 | % | 22.3 | % | 2.6 | % | ||||||||||||||||||||||||||
| Income Tax Expense/(Benefit) | 12 | 1,178 | 52 | 4,950 | (76 | ) | (2 | ) | (214 | ) | (650 | ) | ||||||||||||||||||||
| Profit for the Period | 46 | 4,348 | 149 | 14,096 | (69 | ) | 23 | 2,205 | 97 | |||||||||||||||||||||||
| % of Revenues | 5.4 | % | 16.5 | % | 2.9 | % | ||||||||||||||||||||||||||
| Attributable to Equity holders of the Parent Co. | 47 | 4,435 | 150 | 14,178 | (69 | ) | 23 | 2,201 | 102 | |||||||||||||||||||||||
| % of Revenues | 5.5 | % | 16.6 | % | 2.9 | % | ||||||||||||||||||||||||||
| Attributable to Non-controlling interests | (1 | ) | (87 | ) | (1 | ) | (82 | ) | 6 | 0.04 | 4 | (2,697 | ) | |||||||||||||||||||
| Diluted Earnings per Share (EPS) | 0.06 | 5.32 | 0.18 | 17.02 | (84 | ) | 0.03 | 2.64 | 101 | |||||||||||||||||||||||
Earnings before Interest, Tax, Depreciation & Amortization (EBITDA) Computation for the quarter
| Particulars | Q1FY27 | Q1FY26 | Q4FY26 | |||||||||||||||||||||
| ($) | (₹) | ($) | (₹) | ($) | (₹) | |||||||||||||||||||
| Profit before Income Tax | 58 | 5,526 | 201 | 19,047 | 21 | 1,991 | ||||||||||||||||||
| Interest (Income) / Expense, net* | (9 | ) | (825 | ) | (11 | ) | (1,028 | ) | (4 | ) | (346 | ) | ||||||||||||
| Depreciation | 36 | 3,380 | 31 | 2,894 | 37 | 3,459 | ||||||||||||||||||
| Amortization | 21 | 1,992 | 20 | 1,871 | 22 | 2,117 | ||||||||||||||||||
| Impairment | 0 | 15 | - | - | 27 | 2,586 | ||||||||||||||||||
| EBITDA | 107 | 10,088 | 241 | 22,784 | 104 | 9,807 | ||||||||||||||||||
| % of Revenues | 12.5 | % | 26.7 | % | 13.0 | % | ||||||||||||||||||
*Includes income from Investment
Key Balance Sheet Items
| Particulars | As on 30th Jun 2026 | As on 31st Mar 2026 | As on 30th Jun 2025 | |||||||||||||||||||||
| ($) | (₹) | ($) | (₹) | ($) | (₹) | |||||||||||||||||||
| Cash and Cash Equivalents and Other Investments | 967 | 91,508 | 1,041 | 98,509 | 773 | 73,169 | ||||||||||||||||||
| Trade Receivables | 1,062 | 100,557 | 1,069 | 101,219 | 1,005 | 95,137 | ||||||||||||||||||
| Inventories | 850 | 80,473 | 808 | 76,531 | 799 | 75,600 | ||||||||||||||||||
| Property, Plant, and Equipment | 1,221 | 115,549 | 1,225 | 115,930 | 1,086 | 102,784 | ||||||||||||||||||
| Goodwill and Other Intangible Assets | 1,230 | 116,463 | 1,246 | 117,952 | 1,136 | 107,572 | ||||||||||||||||||
| Loans and Borrowings (Current & Non-Current) | 760 | 71,952 | 817 | 77,341 | 514 | 48,644 | ||||||||||||||||||
| Trade Payables | 396 | 37,497 | 353 | 33,411 | 396 | 37,457 | ||||||||||||||||||
| Equity | 4,086 | 386,735 | 4,019 | 380,457 | 3,737 | 353,755 | ||||||||||||||||||
|
|
|
| 3 |
Key Business Highlights for Q1FY27
| · | First-to-market launch in the United States of Bosutinib Tablets 400mg, with 180-days of generic drug exclusivity. |
| · | Launched generic semaglutide injection in Canada, indicated for treatment of Type 2 diabetes, after receiving the Notice of Compliance from Pharmaceutical Drugs Directorate. |
| · | Launched generic semaglutide tablets in India for treatment of Type 2 diabetes. |
| · | ’Celevida GLP+’ launched in India by Dr. Reddy’s-Nestlé Health Science to support nutritional needs of GLP-1 users. |
| · | Toripalimab, in-licensed novel therapy for treatment of nasopharyngeal carcinoma, surpassed revenues of ₹100 crores in less than two years of launch in India. |
| · | Entered into an agreement with Innoviva Specialty Therapeutics to exclusively develop and commercialise, XACDURO® (sulbactam for injection; durlobactam for injection), used in treatment of hospital-acquired bacterial pneumonia in select markets across South and Central America, the Caribbean, Russia and CIS countries. |
| · | Filed Marketing Authorization Application abatacept intravenous (IV) presentation with European Medicines Agency (EMA). |
| · | Fast Track Designation granted by USFDA for partnered product, COYA 302, for the treatment of Amyotrophic Lateral Sclerosis (ALS). |
ESG Highlights for Q1FY27
| · | Completed 25 years of listing on the New York Stock Exchange as the first and only Indian pharmaceutical company listed on the exchange. |
| · | Placed in the top 1% globally by FTSE Russell. |
| · | Ranked 165th globally and 5th among Indian companies by TIME–Statista among the World’s Most Sustainable Companies. |
Other Updates for Q1FY27
| · | Received a Form 483 with seven observations, following a Pre-License Inspection (PLI) by United States Food and Drug Administration (USFDA) at our biologics manufacturing facility in Bachupally, Hyderabad in June 2026, to which responses were provided within the stipulated timeline. |
| · | Certain batches of semaglutide were found to be out of specification due to an issue associated with the active pharmaceutical ingredient (API) used in the product. Appropriate measures are being taken to ensure product quality and resumption of supplies. |
|
|
|
| 4 |
Revenue Analysis
| · | Q1FY27 consolidated revenues at ₹80.7 billion, decline of 6% YoY and growth of 7% QoQ. |
Growth was impacted primarily on account of lower lenalidomide revenues. The underlying base business, i.e. excluding lenalidomide, continued to deliver healthy double-digit growth across all geographies, including North America, aided by favourable currency movements.
Global Generics (GG)
| · | Q1FY27 revenues at ₹72.0 billion, decline of 5% YoY and growth of 9% QoQ, accounting for 89% of consolidated revenues. |
| · | Branded businesses, namely India, Emerging Markets and the acquired consumer health portfolio in Nicotine Replacement Therapy (NRT), account for 52% of Q1FY27 revenues. |
North America
| · | Q1FY27 revenues at ₹22.0 billion, decline of 35% YoY and growth of 26% QoQ, accounting for 27% of consolidated revenues. |
Decline was largely due to lower Lenalidomide sales.
| · | During the quarter, we launched six new products in the region. |
| · | During the quarter, we filed five new Abbreviated New Drug Applications (ANDAs) and one New Drug Application (NDA) with the USFDA. |
| · | As of June 30, 2026, filings pending approval from USFDA were 79 including: |
| - | 76 ANDAs (45 are Paragraph IV applications, and 24 may have a ‘First to File’ status) and |
| - | Three NDAs filed u/s 505(b)(2), of which one is a Paragraph IV application. |
Emerging Markets
| · | Q1FY27 revenues at ₹18.3 billion, growth of 31% YoY and 2% QoQ, accounting for 23% of consolidated revenues. |
YoY growth was largely driven by new launches across markets, further supported by favourable forex.
| - | Q1FY27 Russia revenues at ₹9.0 billion, growth of 28% YoY and 8% QoQ. |
YoY growth was supported by price increase in certain brands, new product launches and favorable currency movements.
| - | Q1FY27 Other Commonwealth of Independent States (CIS) countries and Romania revenues at ₹2.2 billion, growth of 12% YoY and decline of 6% QoQ. |
YoY growth was largely on account of higher sales volumes and favourable exchange movements.
| - | Q1FY27 Rest of World (RoW) revenues at ₹7.1 billion, growth of 42% YoY and decline of 3% QoQ. |
YoY growth was largely on account of higher sales volumes from existing products and new product launches across countries, aided by favourable currency movements.
| · | During the quarter, we launched 43 new products across countries. |
|
|
|
| 5 |
India
| · | Q1FY27 revenues at ₹17.2 billion, growth of 17% YoY and 10% QoQ, accounting for 21% of consolidated revenues. |
Growth was driven by revenues from new brand launches, including innovative assets and recently acquired portfolios, price increases and higher sales volumes.
| · | As per IQVIA data published for June 2026, our rank in the Indian Pharmaceutical Market (IPM) was at 9th on a Moving Quarterly Total (MQT) and 10th on a Moving Annual Total (MAT) basis. We continued to outperform the IPM, with secondary sales growth of 14.6% as compared to IPM growth of 13.5% on a MQT basis and 13.5% as compared to IPM growth of 11.1% on a MAT basis. |
| · | During the quarter, we launched seven new brands. |
Europe
| · | Q1FY27 revenues at ₹14.4 billion, growth of 13% YoY and flat QoQ, accounting for 18% of consolidated revenues. |
Revenues from new generic product launches and favourable forex movement were moderated by pricing pressure in generics. NRT revenues declined primarily due to the change in operating model post-integration, under which rebates and discounts are offered to distributors, as compared to the transition period when sales were managed by the seller, Haleon.
| - | Q1FY27 NRT revenues at ₹6.6 billion, decline of 2% YoY and 6% QoQ. |
| - | Q1FY27 Germany revenues at ₹4.1 billion, growth of 29% YoY and 6% QoQ. |
| - | Q1FY27 UK revenues at ₹2.3 billion, growth of 33% YoY and flat QoQ. |
| - | Q1FY27 Rest of Europe revenues at ₹1.5 billion, growth of 29% YoY and 4% QoQ. |
| · | During the quarter, we launched 24 new generic products in the region. |
Pharmaceutical Services and Active Ingredients (PSAI)
| · | Q1FY27 revenues at ₹8.5 billion, growth of 4% YoY and decline of 7% QoQ. |
Growth was largely on account of momentum in our services business, aided by favourable currency fluctuations.
| · | During the quarter, we filed 38 Drug Master Files (DMFs) globally. |
|
|
|
| 6 |
Income Statement Highlights:
Gross Margin
| · | Q1FY27 at 46.5% (GG: 51.6%, PSAI: 4.5%), a decline of 1,039 basis points (bps) YoY and an increase of 169 bps QoQ. |
The YoY decline for the quarter was primarily on account of an adverse product mix, primarily on account of reduced sales of Lenalidomide, price erosion in North America and Europe Generics, a semaglutide API related impact indicated earlier and elevated solvent costs arising on account of the Middle East crisis.
Excluding the semaglutide API related impact, gross margin was 49.4% (GG: 53.8%| PSAI: 12.9%).
Selling, General & Administrative (SG&A) Expenses
| · | Q1FY27 at ₹28.8 billion, increase of 12% YoY and 4% QoQ. |
As % to Revenues – Q1FY27: 35.7 % | Q1FY26: 30.0% | Q4FY26: 36.9%.
The YoY increase was due to higher personnel costs, including increments, adverse forex movement, targeted investments in branded businesses and higher freight costs due to Middle East crisis.
Research & Development (R&D) Expenses
| · | Q1FY27 at ₹5.8 billion, decrease of 8% YoY and increase of 6% QoQ. |
As % to Revenues – Q1FY27: 7.1% | Q1FY26: 7.3% | Q4FY26: 7.3%.
R&D expenditure was lower due to reduced development spends in biosimilars. R&D spends remain focused on complex generics, including peptides and biosimilars.
Profit before Tax (PBT)
| · | Q1FY27 at ₹5.5 billion, decline of 71% YoY and increase of 178% QoQ. |
As % to Revenues – Q1FY27: 6.8% | Q1FY26: 22.3% | Q4FY26: 2.6%.
Excluding the semaglutide API related impact, PBT margin was 9.8%.
Income Tax
| · | Q1FY27 expense at ₹1.2 billion. As % to PBT – Q1FY27: 21.3% | Q1FY26: 26.0% | Q4FY26: (10.8)%. |
The ETR was lower in Q1FY27 primarily due to reversal of previously recognized tax provisions no longer required consequent to favorable resolution of tax assessment pertaining to earlier year and a favourable jurisdictional mix for the quarter, in comparison to the same period in the previous year.
Profit attributable to Equity Holders of Parent Company
| · | Q1FY27 at ₹4.4 billion, decline of 69% YoY and increase of 101% QoQ. |
As % to Revenues (before semaglutide API related impact) – Q1FY27: 5.5% | Q1FY26: 16.6% | Q4FY26: 2.9%.
Diluted Earnings per Share (EPS)
| · | Q1FY27 is ₹5.32. |
|
|
|
| 7 |
Other Financial Highlights:
EBITDA
| · | Q1FY27 at ₹10.1 billion, a decline of 1,416 bps YoY and 55 bps QoQ. |
As % to Revenues – Q1FY27: 12.5% | Q1FY26: 26.7% | Q4FY26: 13.0%.
Excluding the semaglutide API related impact, EBITDA margin was 15.4%.
Others:
| · | Operating Working Capital: As on 30th June 2026 at ₹143.5 billion |
| · | Capital Expenditure: Q1FY27 at ₹3.1 billion. |
| · | Cash Flow (before acquisition related payout): Q1FY27 at ₹(2.2) billion. |
| · | Net Cash Surplus: As on 30th June 2026 at ₹30.6 billion. |
| · | Net Debt to Equity: As on 30th June 2026 is (0.08). |
| · | Annualised Return on Capital Employed (RoCE): Q1FY27 stood at 5.3%. |
Excluding the semaglutide API related impact, annualised RoCE at 8%.
|
|
|
| 8 |
About key metrics and non-GAAP Financial Measures
This press release contains non-GAAP financial measures within the meaning of Regulation G and Item 10(e) of Regulation S-K. Such non-GAAP financial measures are measures of our historical performance, financial position or cash flows that are adjusted to exclude or include amounts from the most directly comparable financial measure calculated and presented in accordance with IFRS.
The presentation of this financial information is not intended to be considered in isolation or as a substitute for, or superior to, the financial information prepared and presented in accordance with IFRS. Our non-GAAP financial measures are not based on any comprehensive set of accounting rules or principles. These measures may be different from non-GAAP financial measures used by other companies, limiting their usefulness for comparison purposes.
We believe these non-GAAP financial measures provide investors with useful supplemental information about the financial performance of our business, enable comparison of financial results between periods where certain items may vary independent of business performance, and allow for greater transparency with respect to key metrics used by management in operating our business.
For more information on our non-GAAP financial measures and a reconciliation of GAAP to non-GAAP measures, please refer to “Reconciliation of GAAP to Non-GAAP Results” table in this press release.
|
|
|
| 9 |
All amounts in millions, except EPS
Reconciliation of GAAP Measures to Non-GAAP Measures
Operating Working Capital
| Particulars | As on 30th Jun 2026 | |||
| (₹) | ||||
| Inventories | 80,473 | |||
| Trade Receivables | 100,557 | |||
| Less: | ||||
| Trade Payables | (37,497 | ) | ||
| Operating Working Capital | 143,533 | |||
Free Cash Flow
| Particulars | Three months ended 30th Jun 2026 | |||
| (₹) | ||||
| Net cash generated from operating activities | 1,015 | |||
| Less: | ||||
| Taxes | (1,942 | ) | ||
| Investments in Property, Plant & Equipment and intangibles | (1,231 | ) | ||
| Free Cash Flow before Acquisitions | (2,158 | ) | ||
| Less: | ||||
| Acquisitions related pay-out | (220 | ) | ||
| Cash Flow | (2,378 | ) | ||
Net Cash Surplus and Debt to Equity
| Particulars | As on 30th Jun 2026 | |||
| (₹) | ||||
| Cash and Cash Equivalents | 11,204 | |||
| Investments | 80,304 | |||
| Short-term Borrowings | (57,688 | ) | ||
| Long-term Borrowings (Current & Non-current) | (14,264 | ) | ||
| Less: | ||||
| Restricted Cash Balance – Unclaimed Dividend and others | (102 | ) | ||
| Lease liabilities (Included in Short-term and Long-term Borrowings) | 14,264 | |||
| Equity Investments (Included in Investments) | (3,150 | ) | ||
| Net Cash Surplus | 30,568 | |||
| Equity | 386,735 | |||
| Net Debt/Equity | (0.08 | ) | ||
|
|
|
| 10 |
Computation of RoCE
| Particulars | As on 30th Jun 2026 | |||
| (₹) | ||||
| Profit before Tax | 5,526 | |||
| Less: | ||||
| Interest and Investment Income (Excluding forex gain/loss) | (825 | ) | ||
| Earnings Before Interest and taxes [A] | 4,701 | |||
| Average Capital Employed [B] | 356,973 | |||
| Annualised Return on Capital Employed (A/B) (Ratio) | 5.3 | % | ||
Computation of Capital Employed:
| Particulars | As on | |||||||
| 30th Jun 2026 | 31st Mar 2026 | |||||||
| Property Plant and Equipment | 115,549 | 115,930 | ||||||
| Intangibles | 103,603 | 105,059 | ||||||
| Goodwill | 12,860 | 12,893 | ||||||
| Investment in Equity Accounted Associates | 5,798 | 5,673 | ||||||
| Other Current Assets | 36,364 | 36,256 | ||||||
| Other Non-Current Assets | 1,111 | 1,226 | ||||||
| Inventories | 80,473 | 76,531 | ||||||
| Trade Receivables | 100,557 | 101,219 | ||||||
| Derivative Financial Instruments | (4,538 | ) | (6,743 | ) | ||||
| Less: | ||||||||
| Other Liabilities | 46,540 | 53,702 | ||||||
| Provisions | 7,066 | 7,659 | ||||||
| Trade payables | 37,497 | 33,411 | ||||||
| Operating Capital Employed | 360,674 | 353,272 | ||||||
| Average Capital Employed | 356,973 | |||||||
Computation of EBITDA
Refer page no. 3.
|
|
|
| 11 |
Earnings Call Details
The management of the Company will host an Earnings call to discuss the Company’s financial performance and answer any questions from the participants.
Date: Wednesday, July 22, 2026
Time: 19:30 pm IST | 10:00 am ET
| Conference Joining Information |
| Pre-register with the below link and join |
|
https://drreddys.zoom.us/webinar/register/WN_xVkKzh0MSyaxs-eKX8_0wg |
Audio Link and Transcript will be available on the Company’s website: www.drreddys.com
About Dr. Reddy’s: Dr. Reddy’s Laboratories Ltd. (BSE: 500124, NSE: DRREDDY, NYSE: RDY, NSEIFSC: DRREDDY) is a global pharmaceutical company headquartered in Hyderabad, India. Established in 1984, we are committed to providing access to affordable and innovative medicines. Driven by our purpose of ‘Good Health Can’t Wait’, we offer a portfolio of products and services including APIs, generics, branded generics, biosimilars and OTC. Our major therapeutic areas of focus are gastrointestinal, cardiovascular, diabetology, oncology, pain management and dermatology. Our major markets include – USA, India, Russia & CIS countries, China, Brazil, and Europe. As a company with a history of deep science that has led to several industry firsts, we continue to plan and invest in businesses of the future. As an early adopter of sustainability and ESG actions, we released our first Sustainability Report in 2004. Our current ESG goals aim to set the bar high in environmental stewardship; access and affordability for patients; diversity; and governance.
For more information, log on to: www.drreddys.com.
Disclaimer: This press release may include statements of future expectations and other forward-looking statements that are based on the management’s current views and assumptions and involve known or unknown risks and uncertainties that could cause actual results, performance, or events to differ materially from those expressed or implied in such statements. In addition to statements which are forward-looking by reason of context, the words “may”, “will”, “should”, “expects”, “plans”, “intends”, “anticipates”, “believes”, “estimates”, “predicts”, “potential”, or “continue” and similar expressions identify forward-looking statements. Actual results, performance or events may differ materially from those in such statements due to without limitation, (i) general economic conditions such as performance of financial markets, credit defaults , currency exchange rates , interest rates, persistency levels and frequency / severity of insured loss events (ii) mortality and morbidity levels and trends, (iii) changing levels of competition and general competitive factors, (iv) changes in laws and regulations and in the policies of central banks and/or governments, (v) the impact of acquisitions or reorganization , including related integration issues, and (vi) the susceptibility of our industry and the markets addressed by our, and our customers’, products and services to economic downturns as a result of natural disasters, epidemics, pandemics or other widespread illness, including coronavirus (or COVID-19), and (vii) other risks and uncertainties identified in our public filings with the Securities and Exchange Commission, including those listed under the “Risk Factors” and “Forward-Looking Statements” sections of our Annual Report on Form 20-F for the year ended March 31, 2026, and our other filings with US SEC. The company assumes no obligation to update any information contained herein.
|
|
|
| 12 |