
1Pathward Financial, Inc. (Nasdaq: CASH) | Quarterly Investor Presentation THE PATHWARD STORY UPDATED JULY 22 , 2026
2Pathward Financial, Inc. (Nasdaq: CASH) | Quarterly Investor Presentation FORWARD LOOKING STATEMENTS This investor update contains “forward-looking statements” which are made in good faith by Pathward Financial, Inc. (the “Company”) pursuant to the “safe harbor” provisions of the Private Securities Litigation Reform Act of 1995. You can identify forward-looking statements by words such as “may,” “hope,” “will,” “should,” “expect,” “plan,” “anticipate,” “intend,” “believe,” “estimate,” “predict,” “potential,” “continue,” “could,” “future,” “target,” or the negative of those terms, or other words of similar meaning or similar expressions. You should carefully read statements that contain these words because they discuss our future expectations or state other “forward- looking” information. These forward-looking statements are based on information currently available to us and assumptions about future events, and include statements with respect to the Company’s beliefs, expectations, estimates, and intentions, which are subject to significant risks and uncertainties, and are subject to change based on various factors, some of which are beyond the Company’s control. Such risks, uncertainties and other factors may cause our actual growth, results of operations, financial condition, cash flows, performance and business prospects and opportunities to differ materially from those expressed in, or implied by, these forward-looking statements. Such statements address, among others, the following subjects: future operating results, including our performance expectations and fiscal 2026 and 2027 financial guidance; our fiscal 2026 goals and strategy; progress on key strategic initiatives; future performance and business prospects; our value proposition, including opportunities for revenue growth; expected results of our partnerships; impacts of our improved data analytics, underwriting and monitoring processes; impacts of our evolved operating model; expectations with respect to credit performance; expected nonperforming loan resolutions and net charge-off rates; the performance of our securities portfolio; the impact of card balances related to government stimulus programs; customer retention; loan and other product demand; new products and services; credit quality; the level of net charge-offs and the adequacy of the allowance for credit losses; and technology, including impacts of technology investments. The following factors, among others, could cause the Company's financial performance and results of operations to differ materially from the expectations, estimates, and intentions expressed in such forward-looking statements: maintaining our executive management team; expected growth opportunities may not be realized or may take longer to realize than expected; our ability to successfully implement measures designed to reduce expenses and increase efficiencies; changes in trade, monetary, and fiscal policies and laws, including actual changes in interest rates and the Fed Funds rate, and changes in international trade policies, tariffs and treaties affecting imports and exports, and their related impacts on macroeconomic conditions, customer behavior, funding costs and loan and securities portfolios; changes in tax laws; trade disputes, barriers to trade or the emergence of trade restrictions; the strength of the United States' economy, and the local economies in which the Company operates; adverse developments in the financial services industry generally such as bank failures, responsive measures to mitigate and manage such developments, related supervisory and regulatory actions and costs, and related impacts on customer behavior; inflation, market, and monetary fluctuations; our liquidity and capital positions, including the sufficiency of our liquidity; the timely and efficient development of new products and services offered by the Company or its strategic partners, as well as risks (including reputational and litigation) attendant thereto, and the perceived overall value and acceptance of these products and services by users; the ability of the Company’s subsidiary Pathward®, N.A. (“Pathward”) to maintain its Durbin Amendment exemption; the risks of dealing with or utilizing third parties, including, in connection with the Company’s prepaid card and tax refund advance businesses; the risk of reduced volume of refund advance loans as a result of reduced customer demand for or usage of the Company’s strategic partners’ refund advance products; our relationship with and any actions which may be initiated by our regulators, and any related increases in compliance and other costs; changes in financial services laws and regulations, including laws and regulations relating to the tax refund industry; technological changes, including, but not limited to, the protection of our electronic systems and information; the impact of acquisitions and divestitures; litigation risk; the growth of the Company’s business, as well as expenses related thereto; continued maintenance by Pathward of its status as a well-capitalized institution, changes in consumer borrowing, spending and saving habits; losses from fraudulent or illegal activity; technological risks and developments and cyber threats, attacks or events; emerging external focus among regulators and other officials related to risks in connection with the development and use of artificial intelligence; the success of the Company at maintaining its high quality asset level and managing and collecting assets of borrowers in default should problem assets increase; the potential adverse effects of unusual and infrequently occurring events, including the impact on financial markets from geopolitical conflicts, government shutdowns, weather-related disasters, or public health events, such as pandemics and any governmental or societal responses thereto; and the other factors described under the caption “Risk Factors” and in other sections of the Company’s Annual Report on Form 10-K for the Company's fiscal year ended September 30, 2025 and in other filings made by the Company with the Securities and Exchange Commission (“SEC”). The foregoing list of factors is not exclusive. We caution you not to place undue reliance on these forward-looking statements. All subsequent written and oral forward-looking statements attributable to us or any person acting on our behalf are expressly qualified in their entirety by the cautionary statements contained in or referred to in this section. The forward-looking statements included herein speak only as of the date of this investor update. The Company expressly disclaims any intent or obligation to update, revise or clarify any forward-looking statements, whether written or oral, that may be made from time to time by or on behalf of the Company or its subsidiaries, whether as a result of new information, changed circumstances or future events or for any other reason, except as required by applicable law.
3Pathward Financial, Inc. (Nasdaq: CASH) | Quarterly Investor Presentation Since our founding, we have worked to advance financial inclusion. We seek out diverse partners, including fintechs, affinity groups, government agencies, and other banks and work with them to identify markets where people and businesses are underserved. Our national bank charter, coordination with regulators, and deep understanding of risk and compliance allow us to guide our partners and deliver financial products, services and funding to the people and businesses who need them the most. We are powering financial inclusion. AT PATHWARD®, LEADING THE WAY TO FINANCIAL ACCESS IS THE HEART OF OUR BUSINESS.
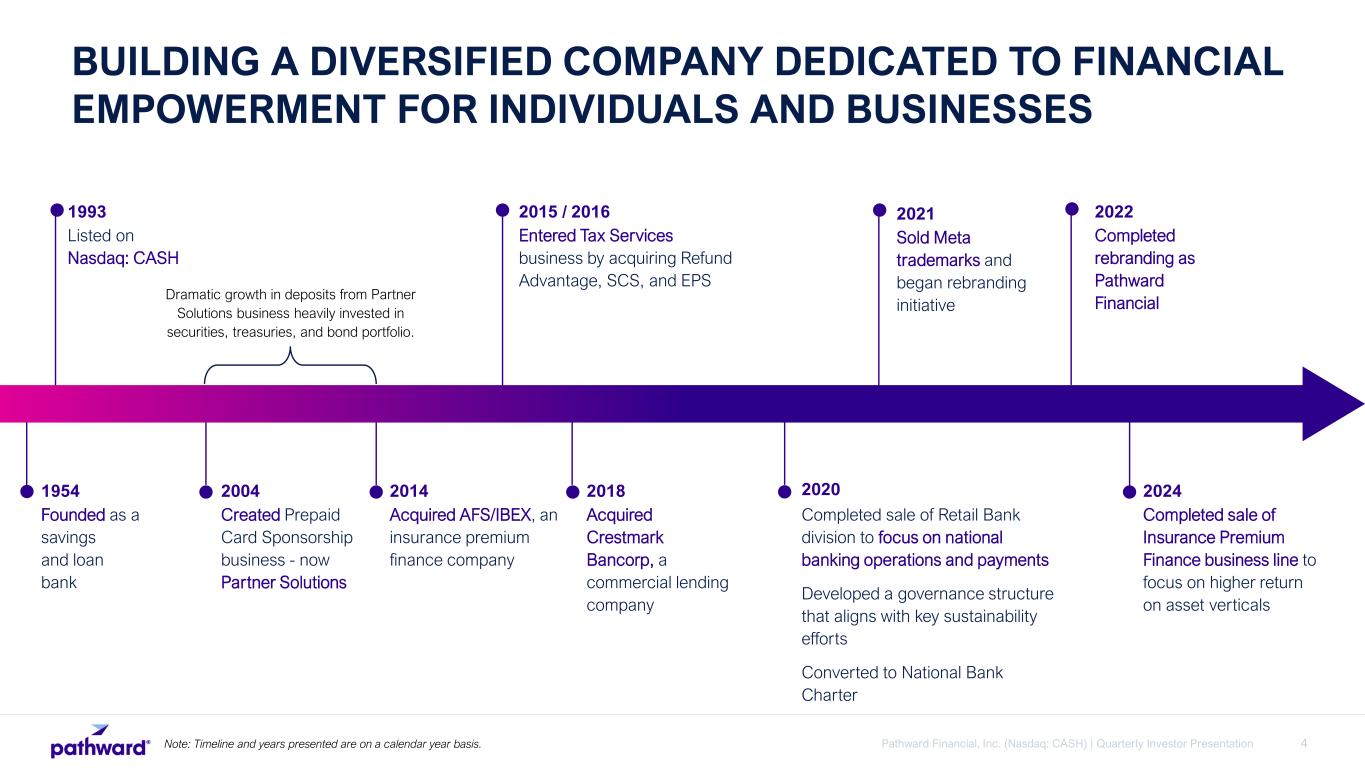
4Pathward Financial, Inc. (Nasdaq: CASH) | Quarterly Investor Presentation BUILDING A DIVERSIFIED COMPANY DEDICATED TO FINANCIAL EMPOWERMENT FOR INDIVIDUALS AND BUSINESSES 1993 Listed on Nasdaq: CASH 2015 / 2016 Entered Tax Services business by acquiring Refund Advantage, SCS, and EPS 2020 Completed sale of Retail Bank division to focus on national banking operations and payments Developed a governance structure that aligns with key sustainability efforts Converted to National Bank Charter 2004 Created Prepaid Card Sponsorship business - now Partner Solutions 2014 Acquired AFS/IBEX, an insurance premium finance company 2018 Acquired Crestmark Bancorp, a commercial lending company Dramatic growth in deposits from Partner Solutions business heavily invested in securities, treasuries, and bond portfolio. 1954 Founded as a savings and loan bank 2021 Sold Meta trademarks and began rebranding initiative 2022 Completed rebranding as Pathward Financial 2024 Completed sale of Insurance Premium Finance business line to focus on higher return on asset verticals Note: Timeline and years presented are on a calendar year basis.
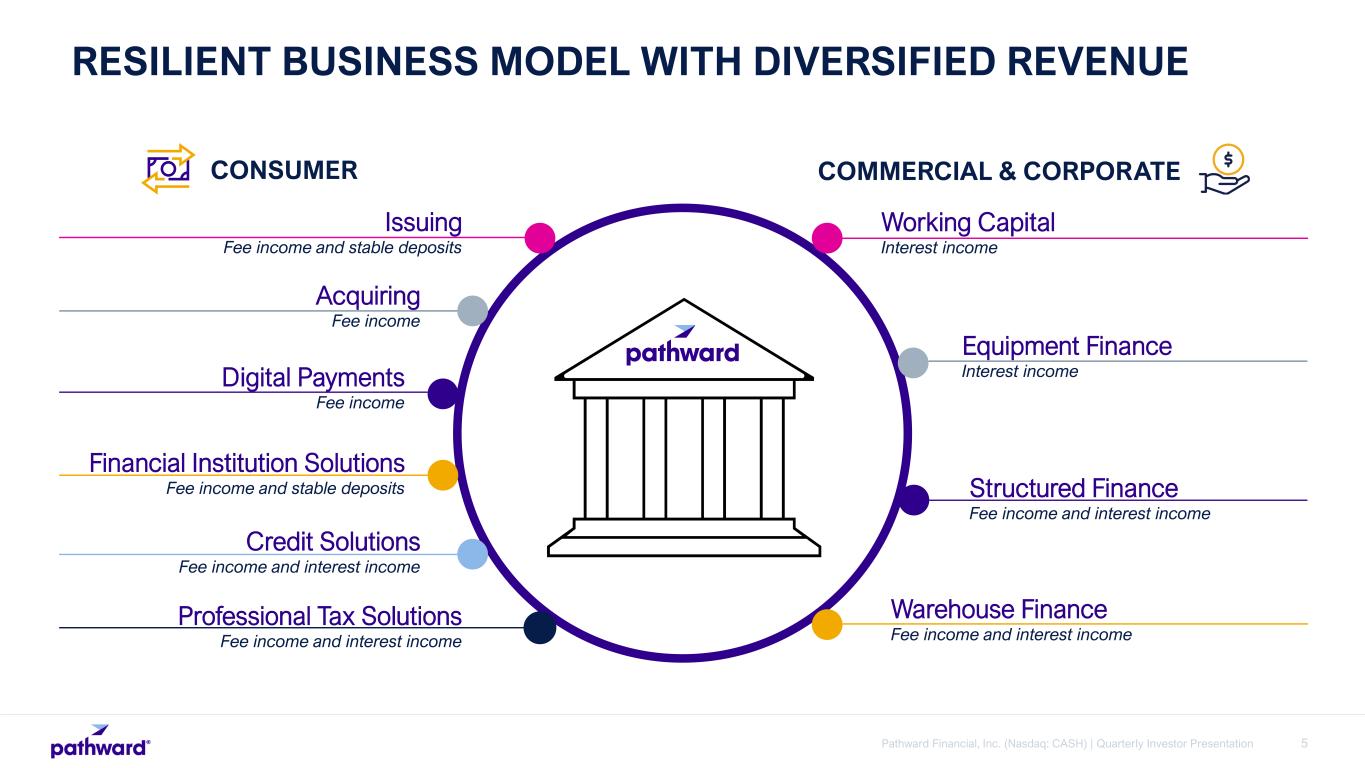
5Pathward Financial, Inc. (Nasdaq: CASH) | Quarterly Investor Presentation RESILIENT BUSINESS MODEL WITH DIVERSIFIED REVENUE Issuing Fee income and stable deposits Acquiring Fee income Digital Payments Fee income Financial Institution Solutions Fee income and stable deposits Credit Solutions Fee income and interest income Professional Tax Solutions Fee income and interest income Working Capital Interest income Equipment Finance Interest income Structured Finance Fee income and interest income Warehouse Finance Fee income and interest income CONSUMER COMMERCIAL & CORPORATE
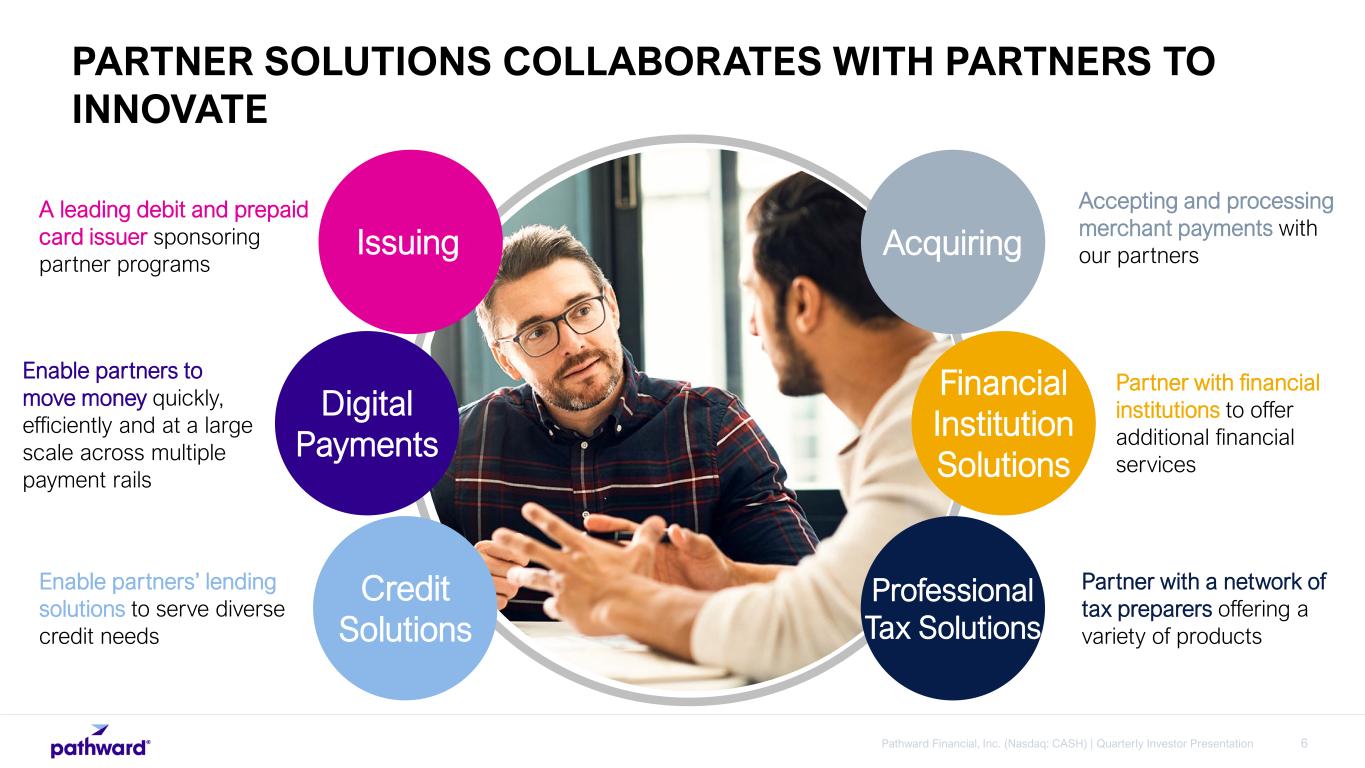
6Pathward Financial, Inc. (Nasdaq: CASH) | Quarterly Investor Presentation Issuing Acquiring Digital Payments Financial Institution Solutions Credit Solutions Professional Tax Solutions A leading debit and prepaid card issuer sponsoring partner programs Enable partners’ lending solutions to serve diverse credit needs Partner with a network of tax preparers offering a variety of products Partner with financial institutions to offer additional financial services Enable partners to move money quickly, efficiently and at a large scale across multiple payment rails Accepting and processing merchant payments with our partners PARTNER SOLUTIONS COLLABORATES WITH PARTNERS TO INNOVATE
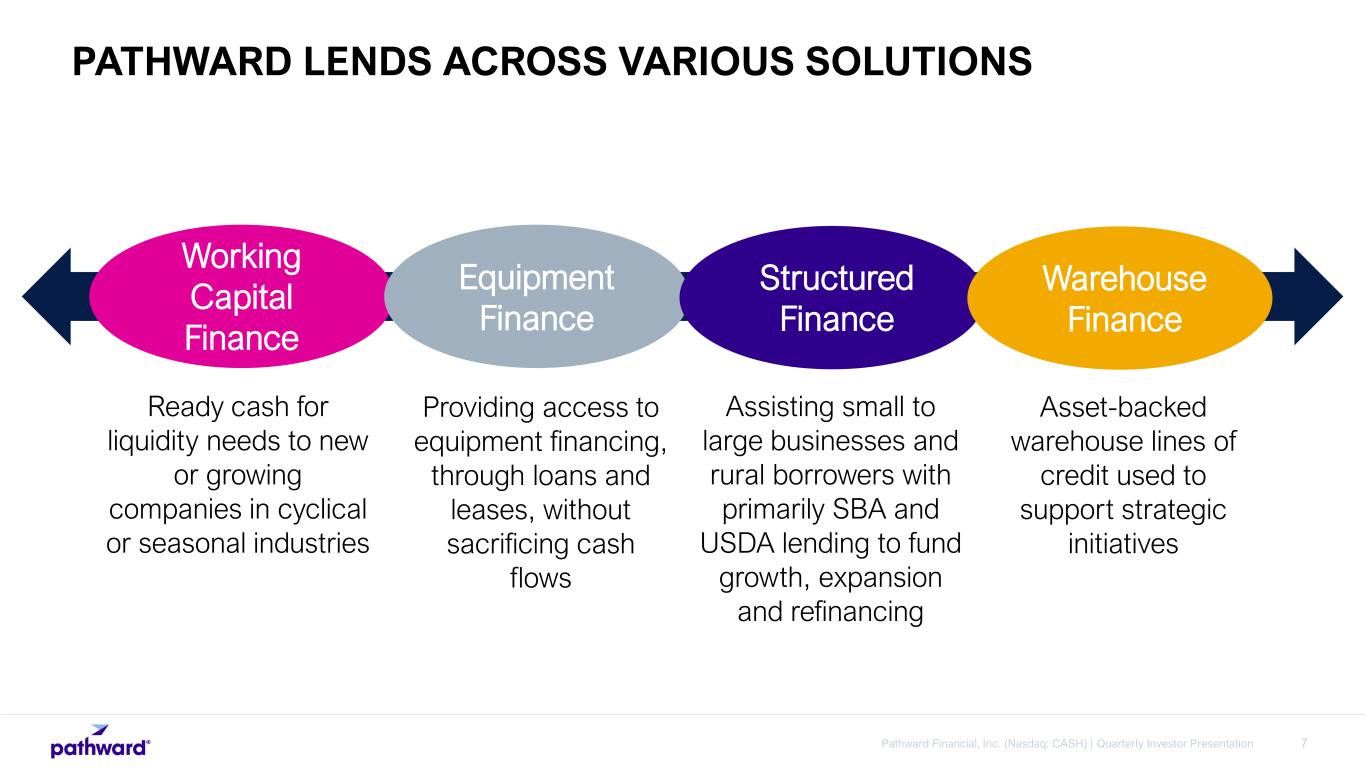
7Pathward Financial, Inc. (Nasdaq: CASH) | Quarterly Investor Presentation Working Capital Finance Equipment Finance Structured Finance Ready cash for liquidity needs to new or growing companies in cyclical or seasonal industries Providing access to equipment financing, through loans and leases, without sacrificing cash flows Assisting small to large businesses and rural borrowers with primarily SBA and USDA lending to fund growth, expansion and refinancing Warehouse Finance Asset-backed warehouse lines of credit used to support strategic initiatives PATHWARD LENDS ACROSS VARIOUS SOLUTIONS
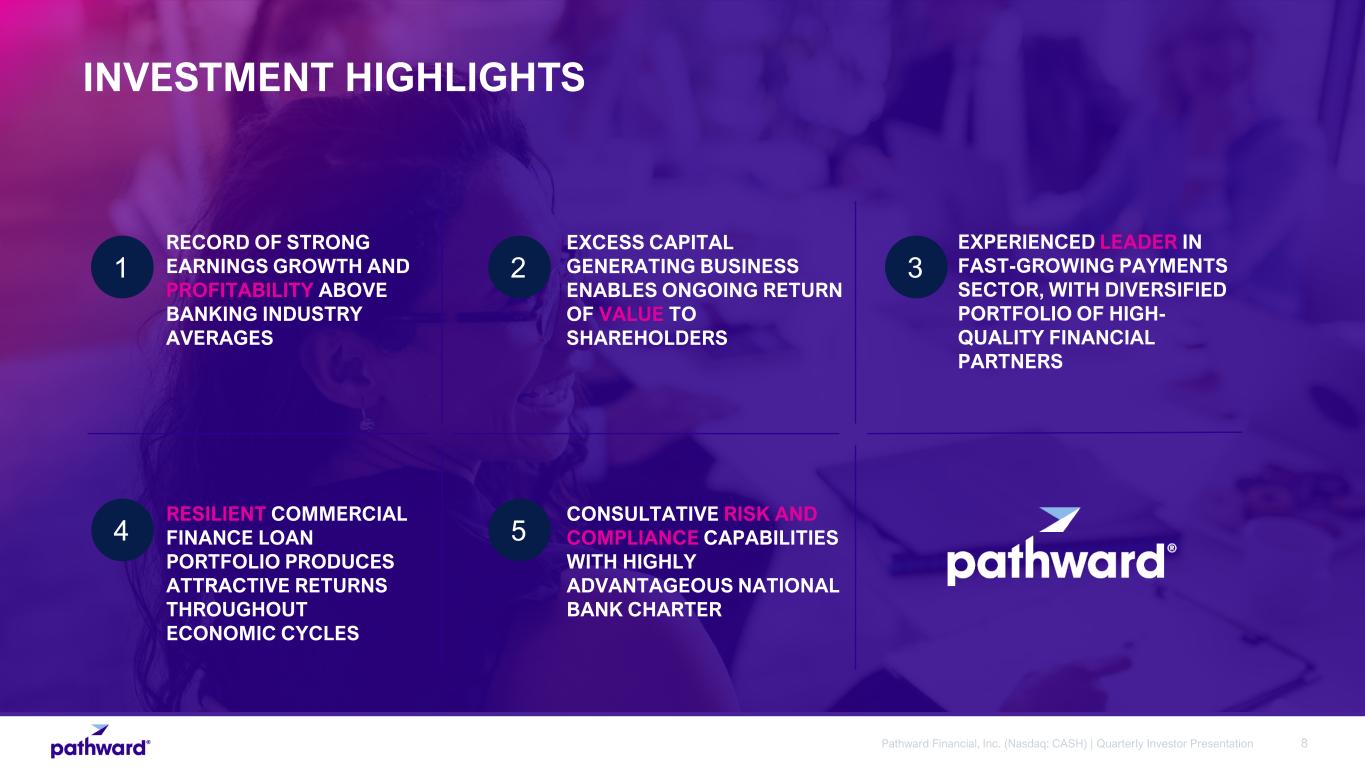
8Pathward Financial, Inc. (Nasdaq: CASH) | Quarterly Investor Presentation RECORD OF STRONG EARNINGS GROWTH AND PROFITABILITY ABOVE BANKING INDUSTRY AVERAGES EXCESS CAPITAL GENERATING BUSINESS ENABLES ONGOING RETURN OF VALUE TO SHAREHOLDERS INVESTMENT HIGHLIGHTS 2 3 4 1 5 EXPERIENCED LEADER IN FAST-GROWING PAYMENTS SECTOR, WITH DIVERSIFIED PORTFOLIO OF HIGH- QUALITY FINANCIAL PARTNERS RESILIENT COMMERCIAL FINANCE LOAN PORTFOLIO PRODUCES ATTRACTIVE RETURNS THROUGHOUT ECONOMIC CYCLES CONSULTATIVE RISK AND COMPLIANCE CAPABILITIES WITH HIGHLY ADVANTAGEOUS NATIONAL BANK CHARTER
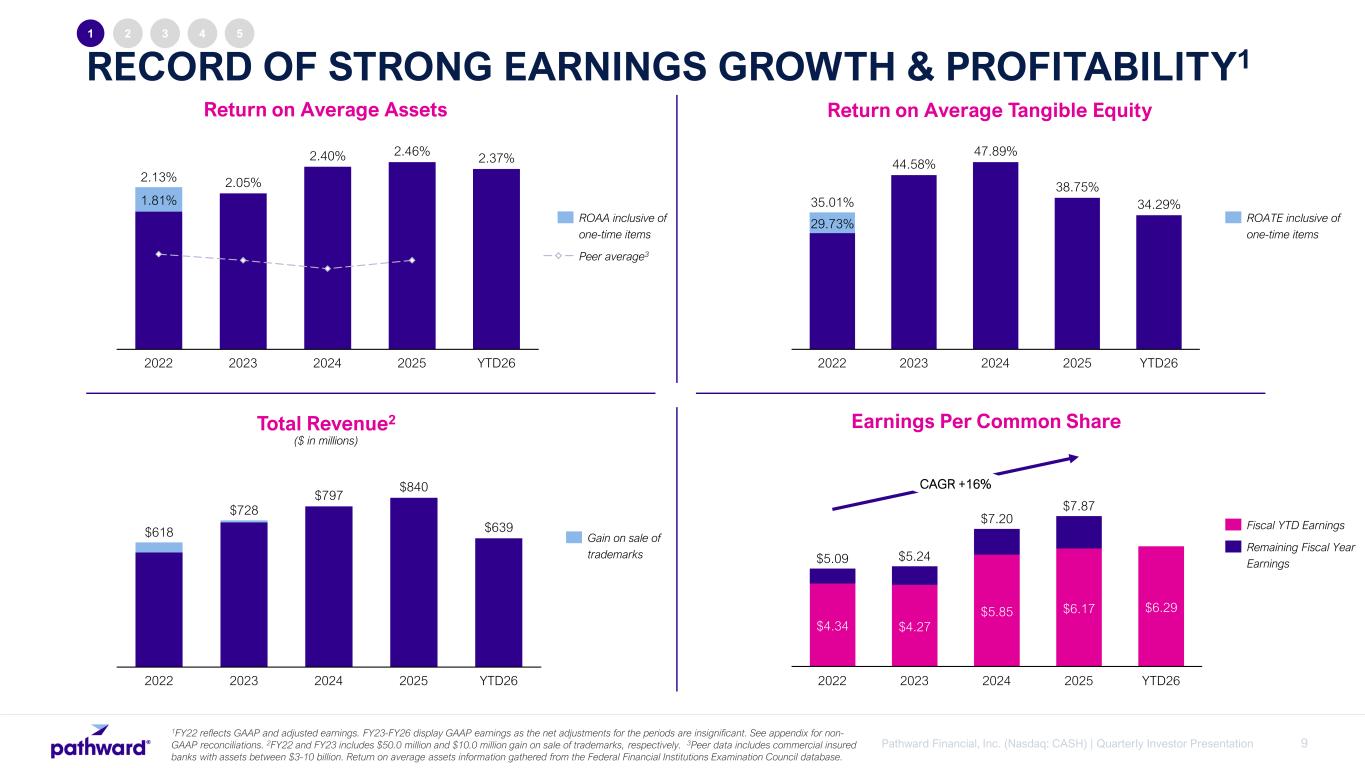
9Pathward Financial, Inc. (Nasdaq: CASH) | Quarterly Investor Presentation Earnings Per Common Share RECORD OF STRONG EARNINGS GROWTH & PROFITABILITY1 Return on Average Assets Total Revenue2 ($ in millions) 1FY22 reflects GAAP and adjusted earnings. FY23-FY26 display GAAP earnings as the net adjustments for the periods are insignificant. See appendix for non- GAAP reconciliations. 2FY22 and FY23 includes $50.0 million and $10.0 million gain on sale of trademarks, respectively. 3Peer data includes commercial insured banks with assets between $3-10 billion. Return on average assets information gathered from the Federal Financial Institutions Examination Council database. 1 2 3 4 5 $797 $840 $639 2022 2023 2024 2025 YTD26 $618 $728 Gain on sale of trademarks $4.34 $4.27 $5.85 $6.17 $6.29 2022 2023 2024 2025 YTD26 $5.09 $5.24 $7.20 $7.87 CAGR +16% 2.05% 2.40% 2.46% 2.37% 1.81% 2022 2023 2024 2025 YTD26 2.13% ROAA inclusive of one-time items Peer average3 44.58% 47.89% 38.75% 34.29% 29.73% 2022 2023 2024 2025 YTD26 35.01% ROATE inclusive of one-time items Return on Average Tangible Equity Fiscal YTD Earnings Remaining Fiscal Year Earnings
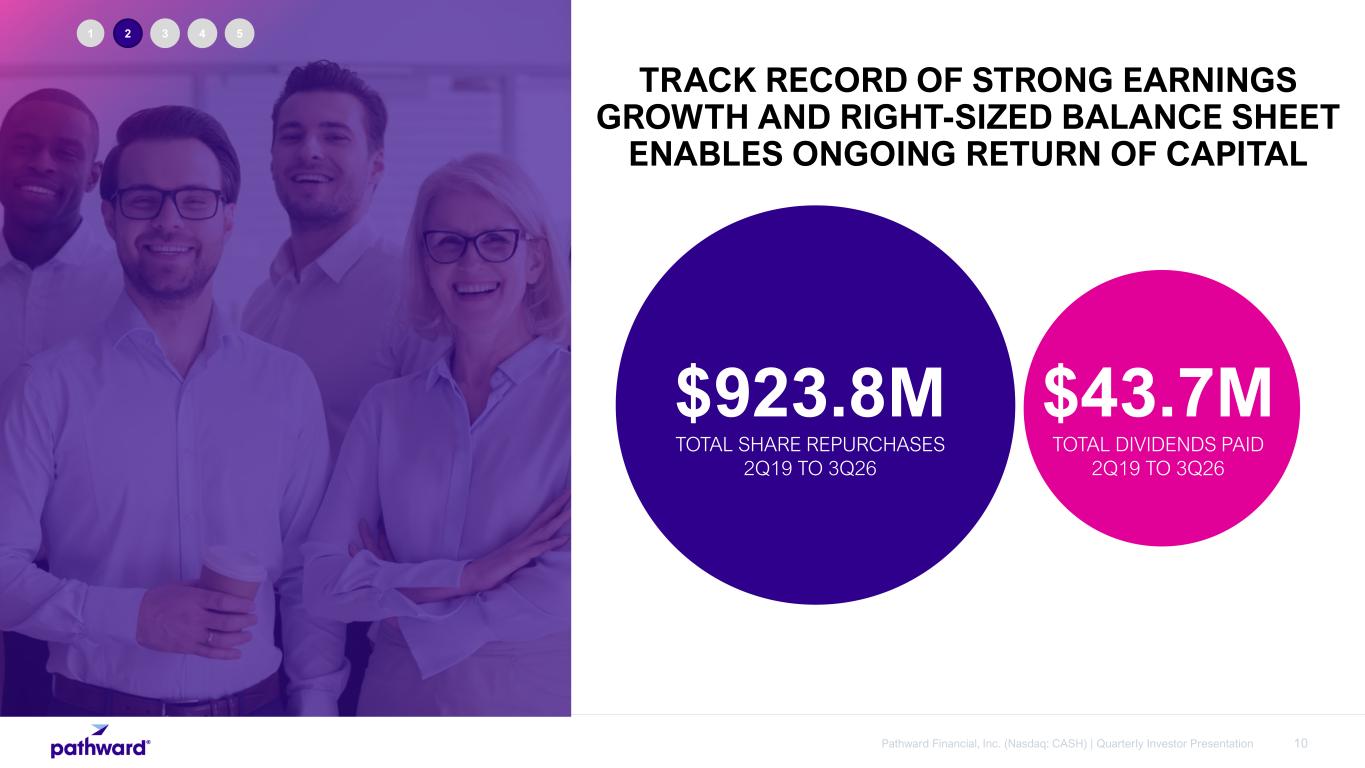
10Pathward Financial, Inc. (Nasdaq: CASH) | Quarterly Investor Presentation TRACK RECORD OF STRONG EARNINGS GROWTH AND RIGHT-SIZED BALANCE SHEET ENABLES ONGOING RETURN OF CAPITAL 1 2 3 4 5 $923.8M TOTAL SHARE REPURCHASES 2Q19 TO 3Q26 $43.7M TOTAL DIVIDENDS PAID 2Q19 TO 3Q26
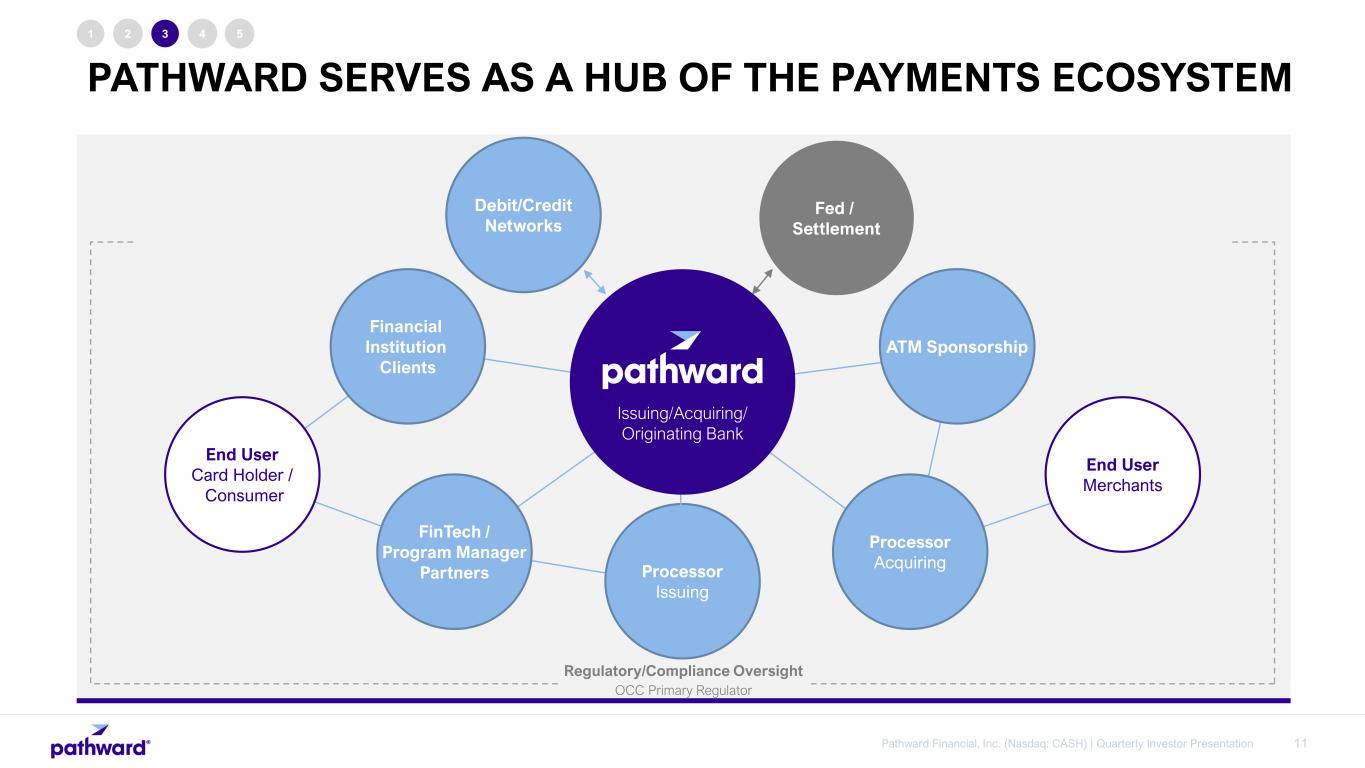
11Pathward Financial, Inc. (Nasdaq: CASH) | Quarterly Investor Presentation 1 2 3 4 5 Fed / Settlement ATM Sponsorship Processor AcquiringProcessor Issuing FinTech / Program Manager Partners Financial Institution Clients Debit/Credit Networks End User Card Holder / Consumer End User Merchants Issuing/Acquiring/ Originating Bank Regulatory/Compliance Oversight OCC Primary Regulator PATHWARD SERVES AS A HUB OF THE PAYMENTS ECOSYSTEM
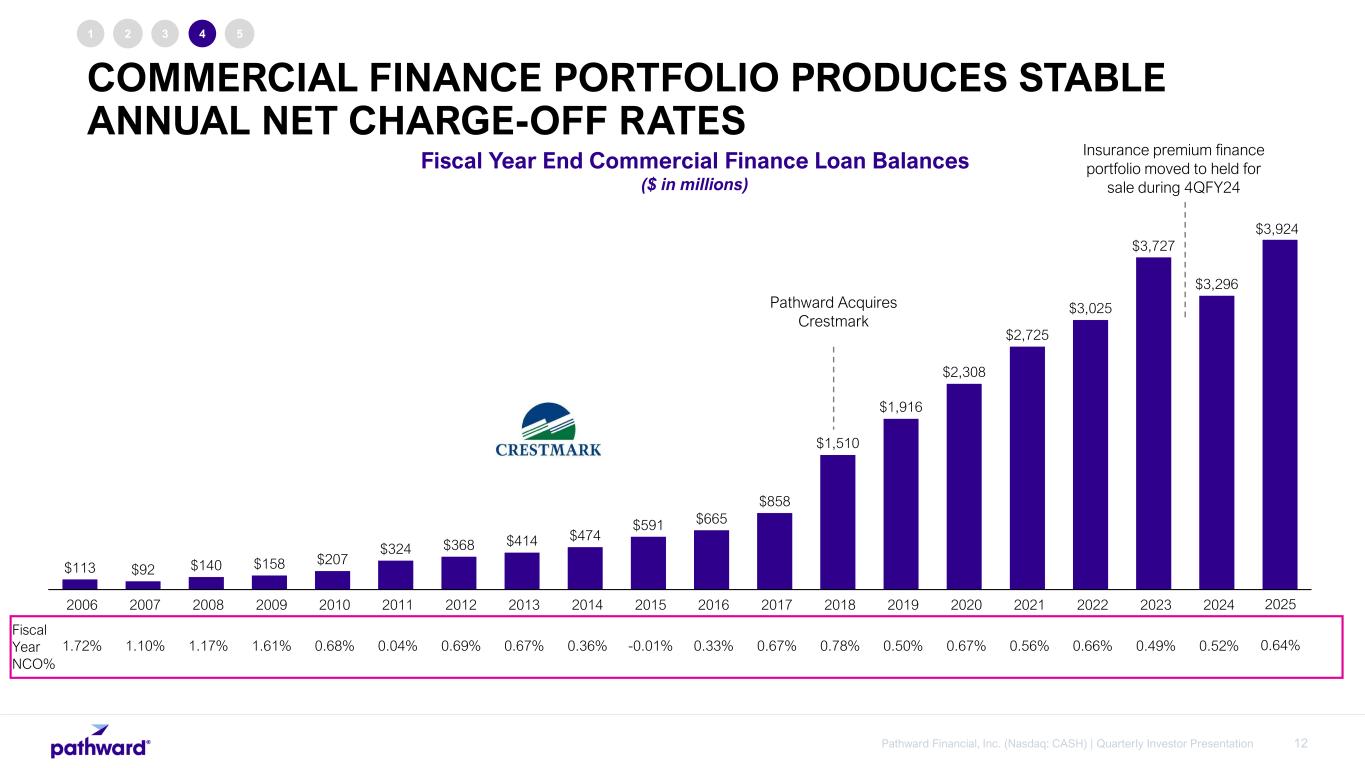
12Pathward Financial, Inc. (Nasdaq: CASH) | Quarterly Investor Presentation Fiscal Year End Commercial Finance Loan Balances ($ in millions) $113 $92 $140 $158 $207 $324 $368 $414 $474 $591 $665 $858 $1,510 $1,916 $2,308 $2,725 $3,025 $3,727 $3,296 $3,924 0 500 1,000 1,500 2,000 2,500 3,000 3,500 4,000 2006 1.72% 2007 1.10% 2008 1.17% 2009 1.61% 2010 0.68% 2011 0.04% 2012 0.69% 2013 0.67% 2014 0.36% 2015 -0.01% 2016 0.33% 2017 0.67% 2018 0.78% 2019 0.50% 2020 0.67% 2021 0.56% 2022 0.66% 2023 0.49% 2024 0.52% Fiscal Year NCO% 1 2 3 4 5 Pathward Acquires Crestmark Insurance premium finance portfolio moved to held for sale during 4QFY24 2025 0.64% COMMERCIAL FINANCE PORTFOLIO PRODUCES STABLE ANNUAL NET CHARGE-OFF RATES
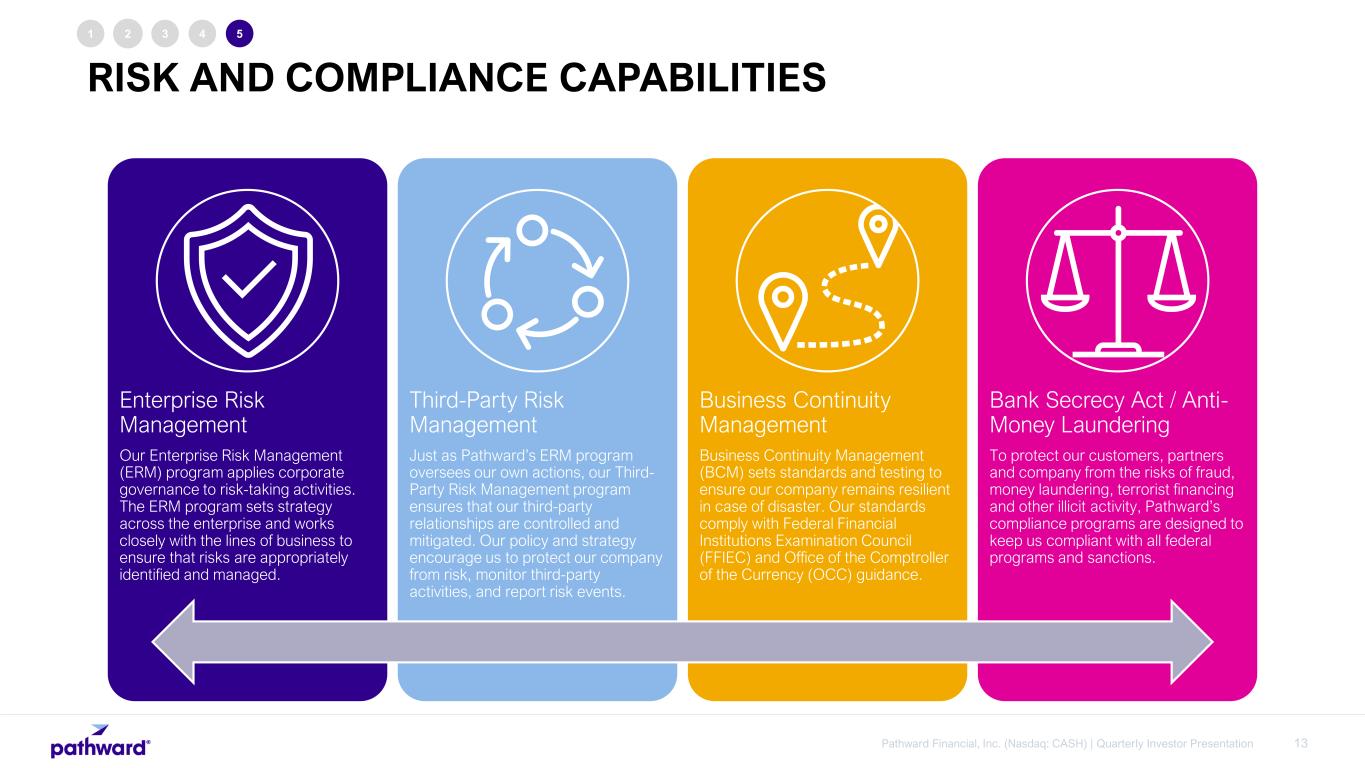
13Pathward Financial, Inc. (Nasdaq: CASH) | Quarterly Investor Presentation 1 2 3 4 5 Enterprise Risk Management Our Enterprise Risk Management (ERM) program applies corporate governance to risk-taking activities. The ERM program sets strategy across the enterprise and works closely with the lines of business to ensure that risks are appropriately identified and managed. Third-Party Risk Management Just as Pathward’s ERM program oversees our own actions, our Third- Party Risk Management program ensures that our third-party relationships are controlled and mitigated. Our policy and strategy encourage us to protect our company from risk, monitor third-party activities, and report risk events. Business Continuity Management Business Continuity Management (BCM) sets standards and testing to ensure our company remains resilient in case of disaster. Our standards comply with Federal Financial Institutions Examination Council (FFIEC) and Office of the Comptroller of the Currency (OCC) guidance. Bank Secrecy Act / Anti- Money Laundering To protect our customers, partners and company from the risks of fraud, money laundering, terrorist financing and other illicit activity, Pathward’s compliance programs are designed to keep us compliant with all federal programs and sanctions. RISK AND COMPLIANCE CAPABILITIES

14Pathward Financial, Inc. (Nasdaq: CASH) | Quarterly Investor Presentation QUARTERLY INVESTOR UPDATE THIRD Q UARTER F ISCAL YEAR 2026
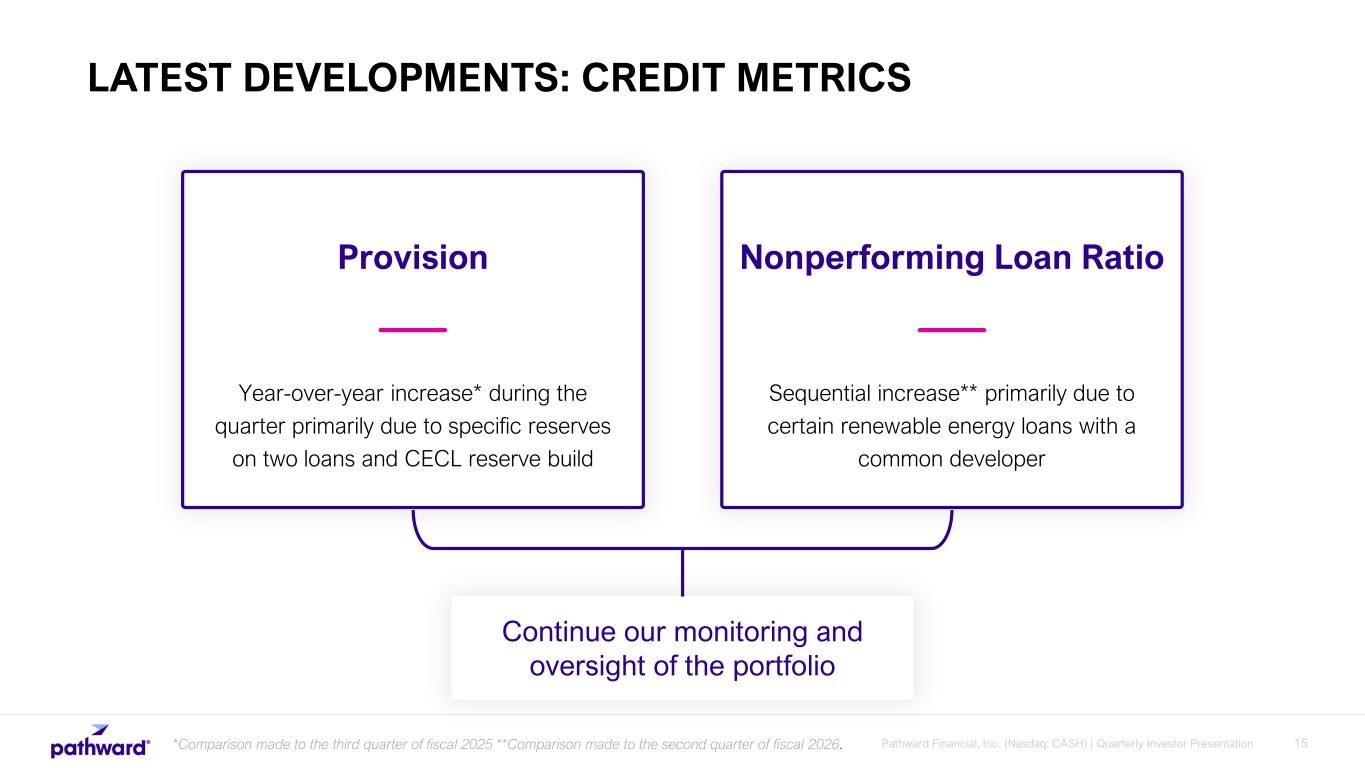
15Pathward Financial, Inc. (Nasdaq: CASH) | Quarterly Investor Presentation LATEST DEVELOPMENTS: CREDIT METRICS Provision Year-over-year increase* during the quarter primarily due to specific reserves on two loans and CECL reserve build Nonperforming Loan Ratio Sequential increase** primarily due to certain renewable energy loans with a common developer Continue our monitoring and oversight of the portfolio *Comparison made to the third quarter of fiscal 2025 **Comparison made to the second quarter of fiscal 2026.
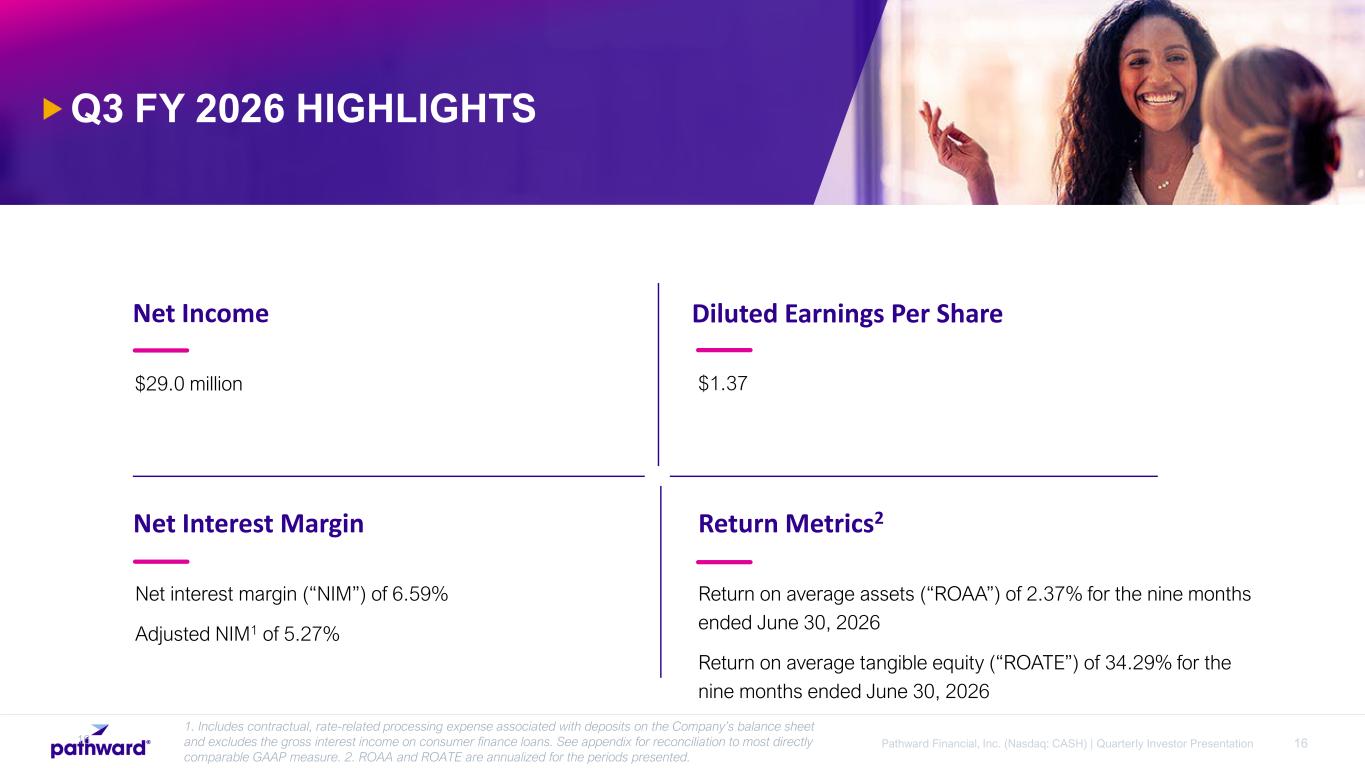
16Pathward Financial, Inc. (Nasdaq: CASH) | Quarterly Investor Presentation Net Income $29.0 million Diluted Earnings Per Share $1.37 Net Interest Margin Net interest margin (“NIM”) of 6.59% Adjusted NIM1 of 5.27% Return Metrics2 Return on average assets (“ROAA”) of 2.37% for the nine months ended June 30, 2026 Return on average tangible equity (“ROATE”) of 34.29% for the nine months ended June 30, 2026 Q3 FY 2026 HIGHLIGHTS 16 1. Includes contractual, rate-related processing expense associated with deposits on the Company’s balance sheet and excludes the gross interest income on consumer finance loans. See appendix for reconciliation to most directly comparable GAAP measure. 2. ROAA and ROATE are annualized for the periods presented.
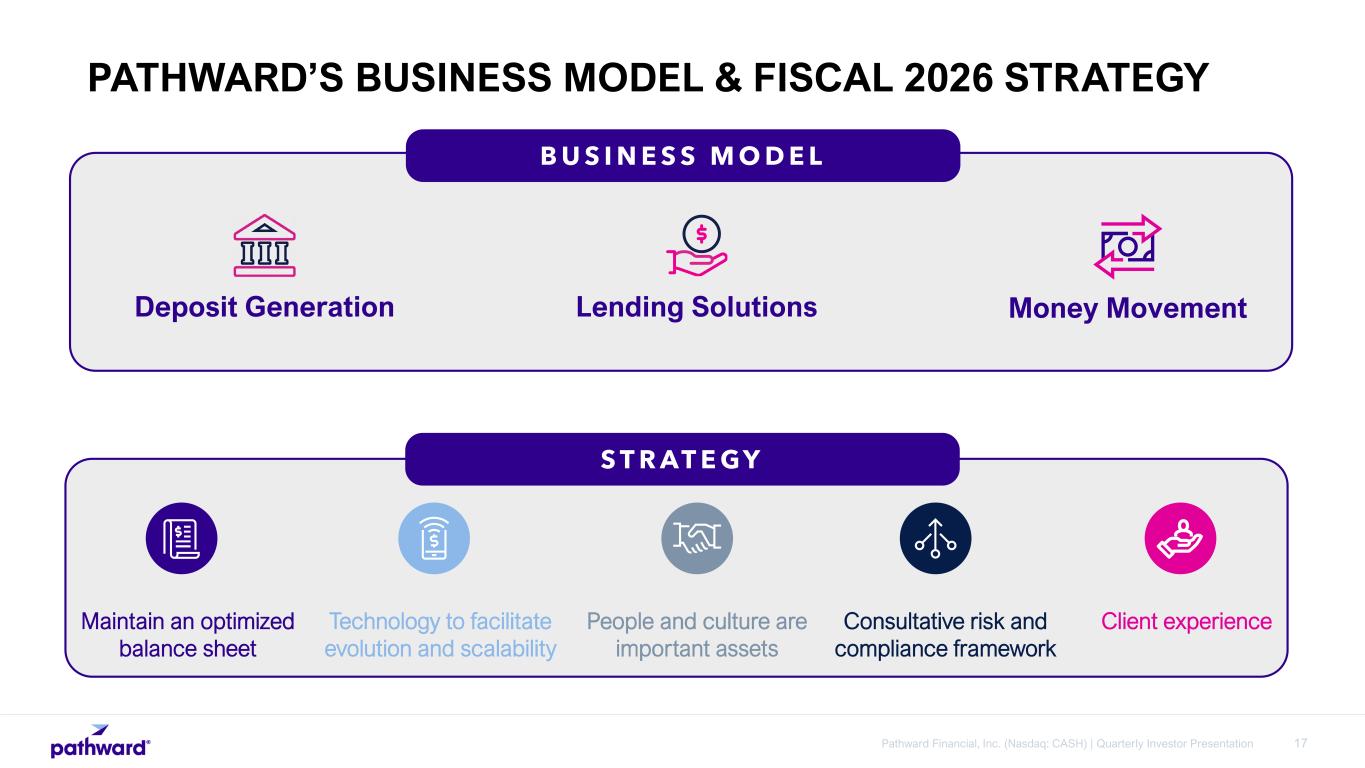
17Pathward Financial, Inc. (Nasdaq: CASH) | Quarterly Investor Presentation Deposit Generation Lending Solutions PATHWARD’S BUSINESS MODEL & FISCAL 2026 STRATEGY S T R AT E GY Money Movement B U S I N E S S M O D E L Maintain an optimized balance sheet Technology to facilitate evolution and scalability People and culture are important assets Consultative risk and compliance framework Client experience
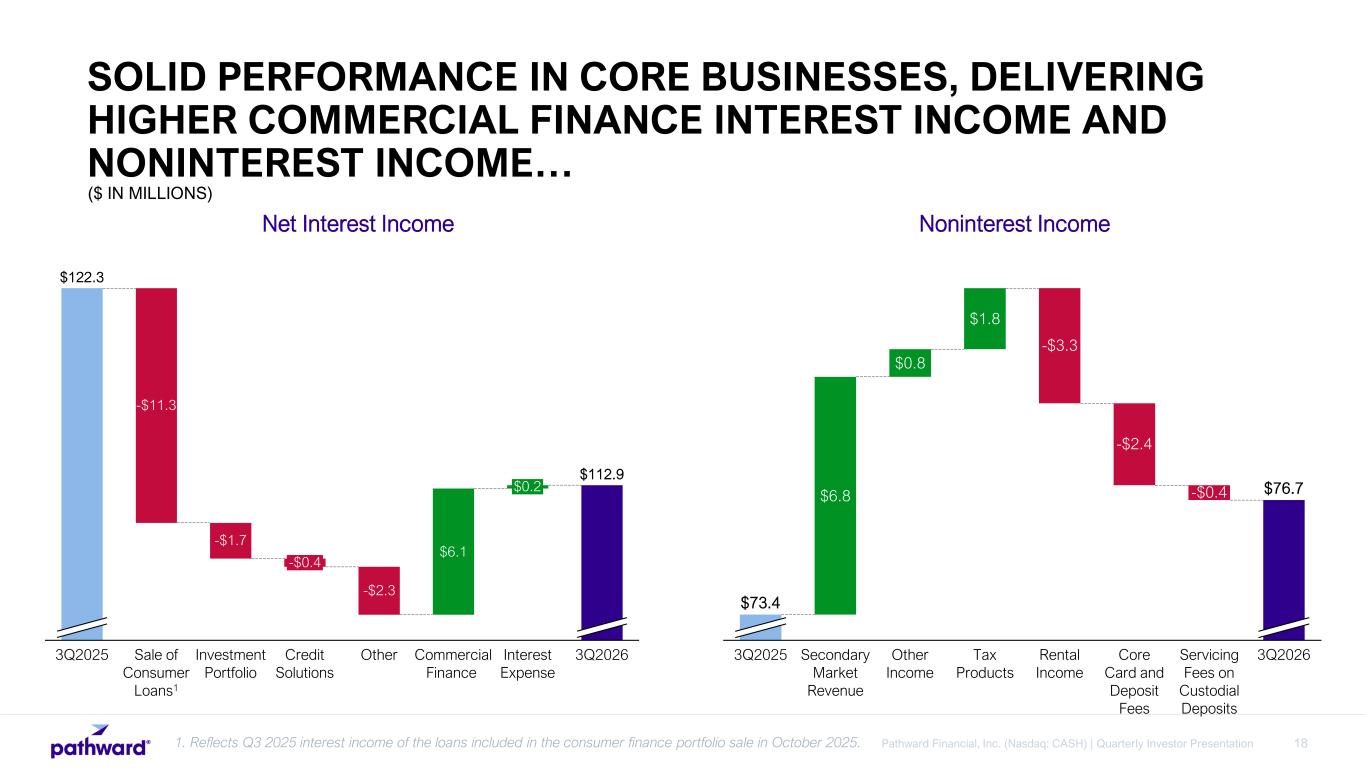
18Pathward Financial, Inc. (Nasdaq: CASH) | Quarterly Investor Presentation ($ IN MILLIONS) SOLID PERFORMANCE IN CORE BUSINESSES, DELIVERING HIGHER COMMERCIAL FINANCE INTEREST INCOME AND NONINTEREST INCOME… 1. Reflects Q3 2025 interest income of the loans included in the consumer finance portfolio sale in October 2025. Net Interest Income Noninterest Income $6.1 3Q2025 -$11.3 Sale of Consumer Loans1 -$1.7 Investment Portfolio -$0.4 Credit Solutions -$2.3 Other Commercial Finance $0.2 Interest Expense 3Q2026 $122.3 $112.9 $6.8 $0.8 $1.8 3Q2025 Secondary Market Revenue Other Income Tax Products -$3.3 Rental Income -$2.4 Core Card and Deposit Fees -$0.4 Servicing Fees on Custodial Deposits 3Q2026 $73.4 $76.7
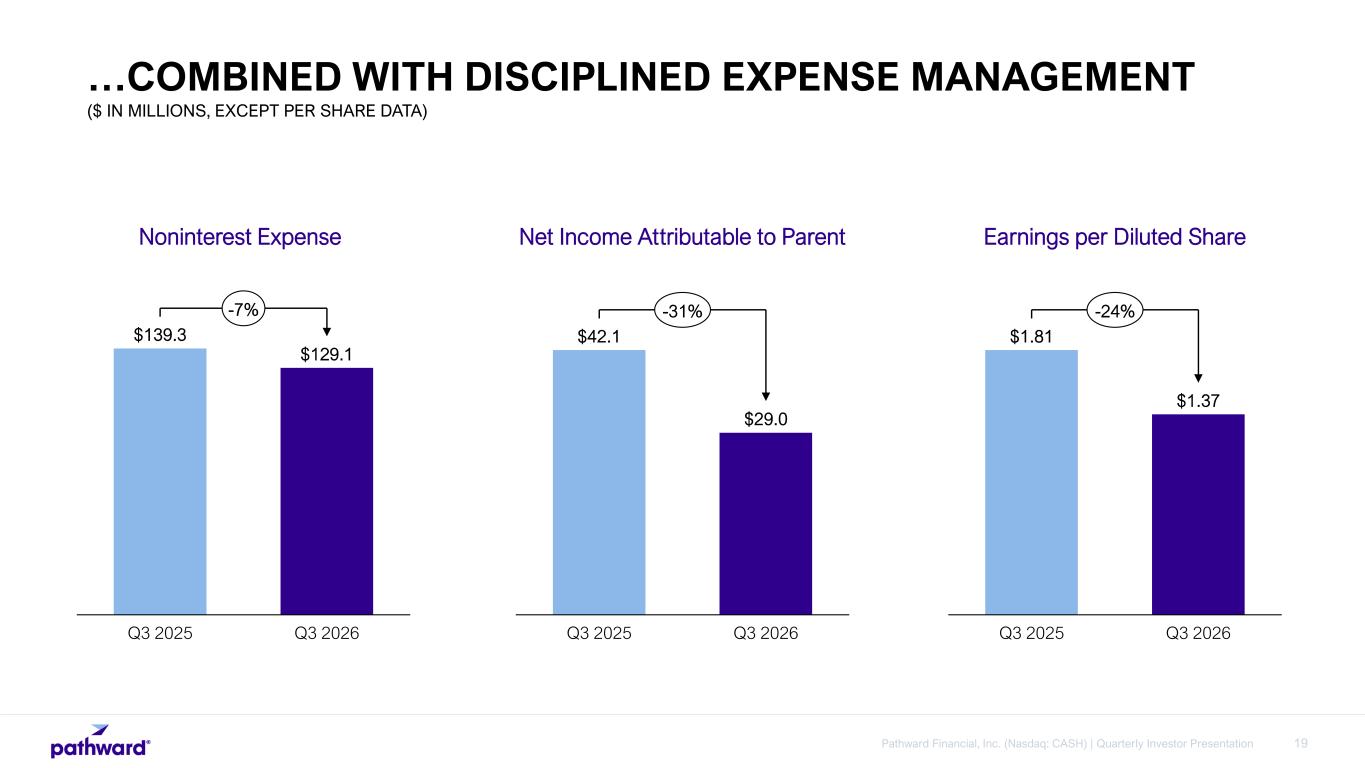
19Pathward Financial, Inc. (Nasdaq: CASH) | Quarterly Investor Presentation $42.1 $29.0 Q3 2025 Q3 2026 -31% Net Income Attributable to Parent $1.81 $1.37 Q3 2025 Q3 2026 -24% Earnings per Diluted Share $139.3 $129.1 Q3 2025 Q3 2026 -7% Noninterest Expense ($ IN MILLIONS, EXCEPT PER SHARE DATA) …COMBINED WITH DISCIPLINED EXPENSE MANAGEMENT
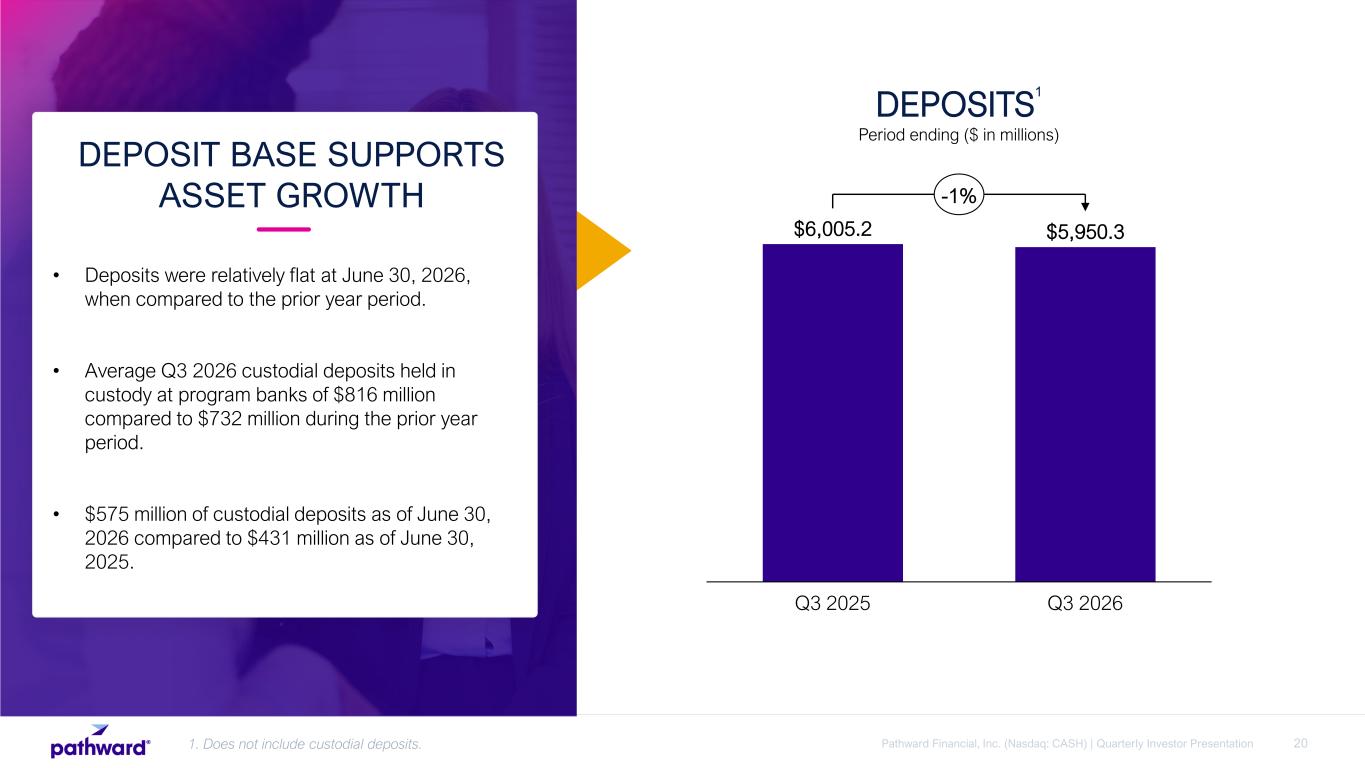
20Pathward Financial, Inc. (Nasdaq: CASH) | Quarterly Investor Presentation • Deposits were relatively flat at June 30, 2026, when compared to the prior year period. • Average Q3 2026 custodial deposits held in custody at program banks of $816 million compared to $732 million during the prior year period. • $575 million of custodial deposits as of June 30, 2026 compared to $431 million as of June 30, 2025. DEPOSIT BASE SUPPORTS ASSET GROWTH $6,005.2 $5,950.3 Q3 2025 Q3 2026 -1% DEPOSITS 1 Period ending ($ in millions) 1. Does not include custodial deposits.
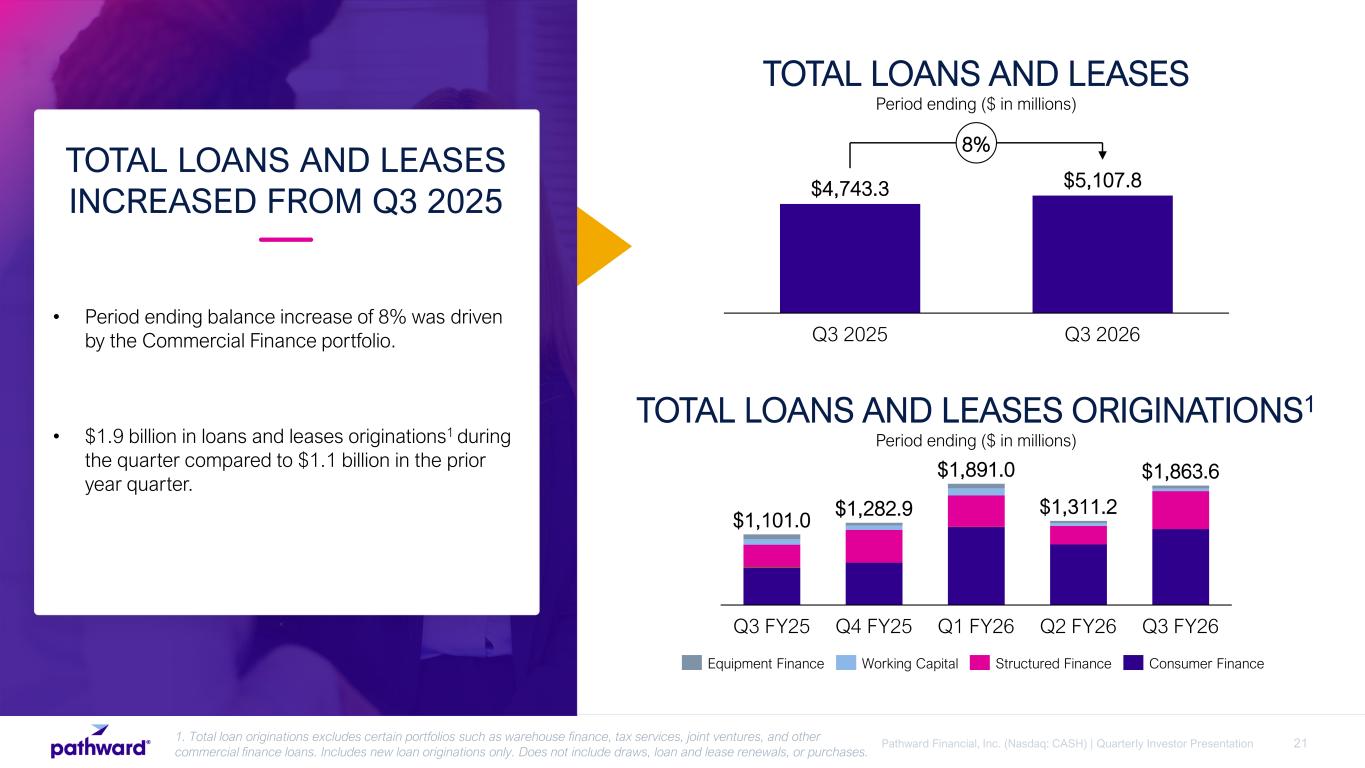
21Pathward Financial, Inc. (Nasdaq: CASH) | Quarterly Investor Presentation TOTAL LOANS AND LEASES INCREASED FROM Q3 2025 • Period ending balance increase of 8% was driven by the Commercial Finance portfolio. • $1.9 billion in loans and leases originations1 during the quarter compared to $1.1 billion in the prior year quarter. $4,743.3 $5,107.8 Q3 2025 Q3 2026 8% TOTAL LOANS AND LEASES Period ending ($ in millions) Q3 FY25 Q4 FY25 Q1 FY26 Q2 FY26 $1,101.0 $1,282.9 $1,891.0 $1,311.2 Q3 FY26 $1,863.6 TOTAL LOANS AND LEASES ORIGINATIONS1 Period ending ($ in millions) Equipment Finance Working Capital Structured Finance Consumer Finance 1. Total loan originations excludes certain portfolios such as warehouse finance, tax services, joint ventures, and other commercial finance loans. Includes new loan originations only. Does not include draws, loan and lease renewals, or purchases.
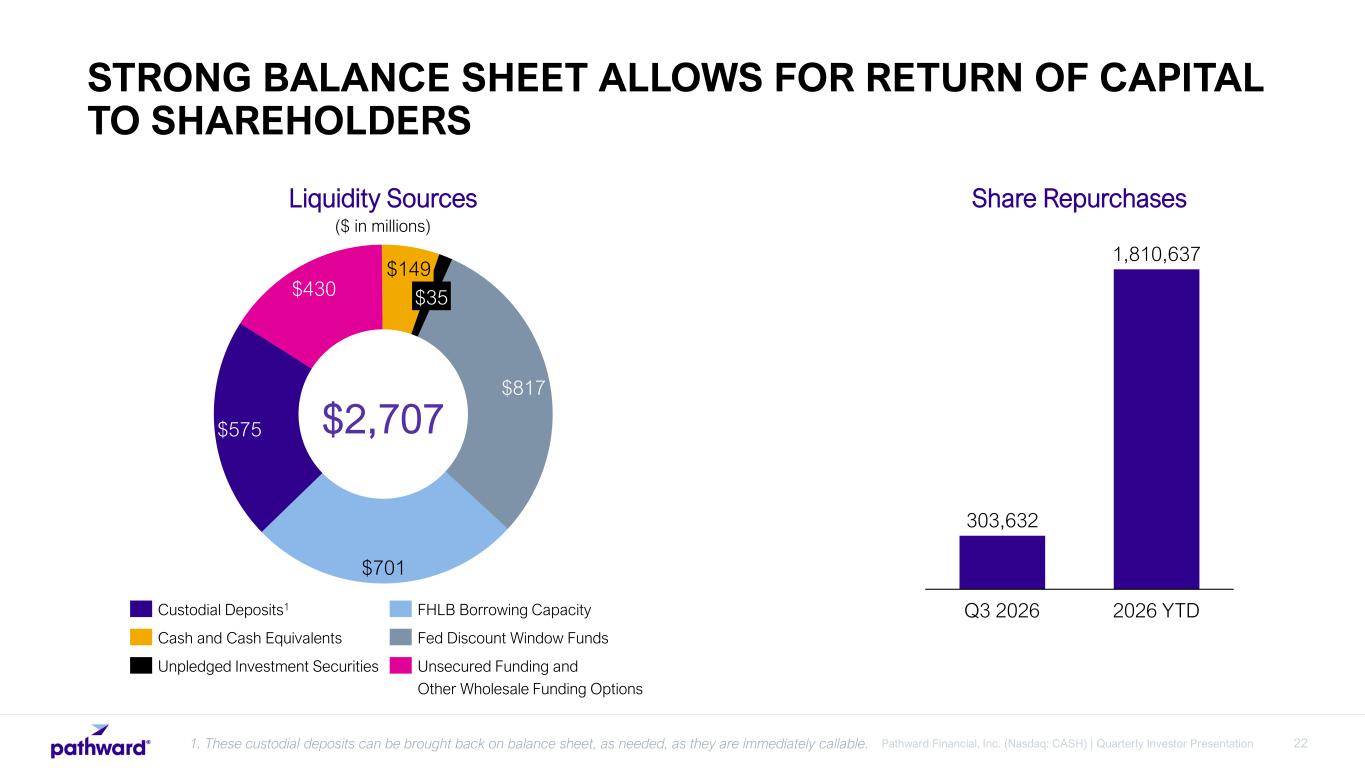
22Pathward Financial, Inc. (Nasdaq: CASH) | Quarterly Investor Presentation $575 $701 $430 $817 $149 $35 1. These custodial deposits can be brought back on balance sheet, as needed, as they are immediately callable. ($ in millions) 303,632 1,810,637 Q3 2026 2026 YTD Share RepurchasesLiquidity Sources $2,707 Custodial Deposits1 Cash and Cash Equivalents Unpledged Investment Securities FHLB Borrowing Capacity Fed Discount Window Funds Unsecured Funding and Other Wholesale Funding Options STRONG BALANCE SHEET ALLOWS FOR RETURN OF CAPITAL TO SHAREHOLDERS
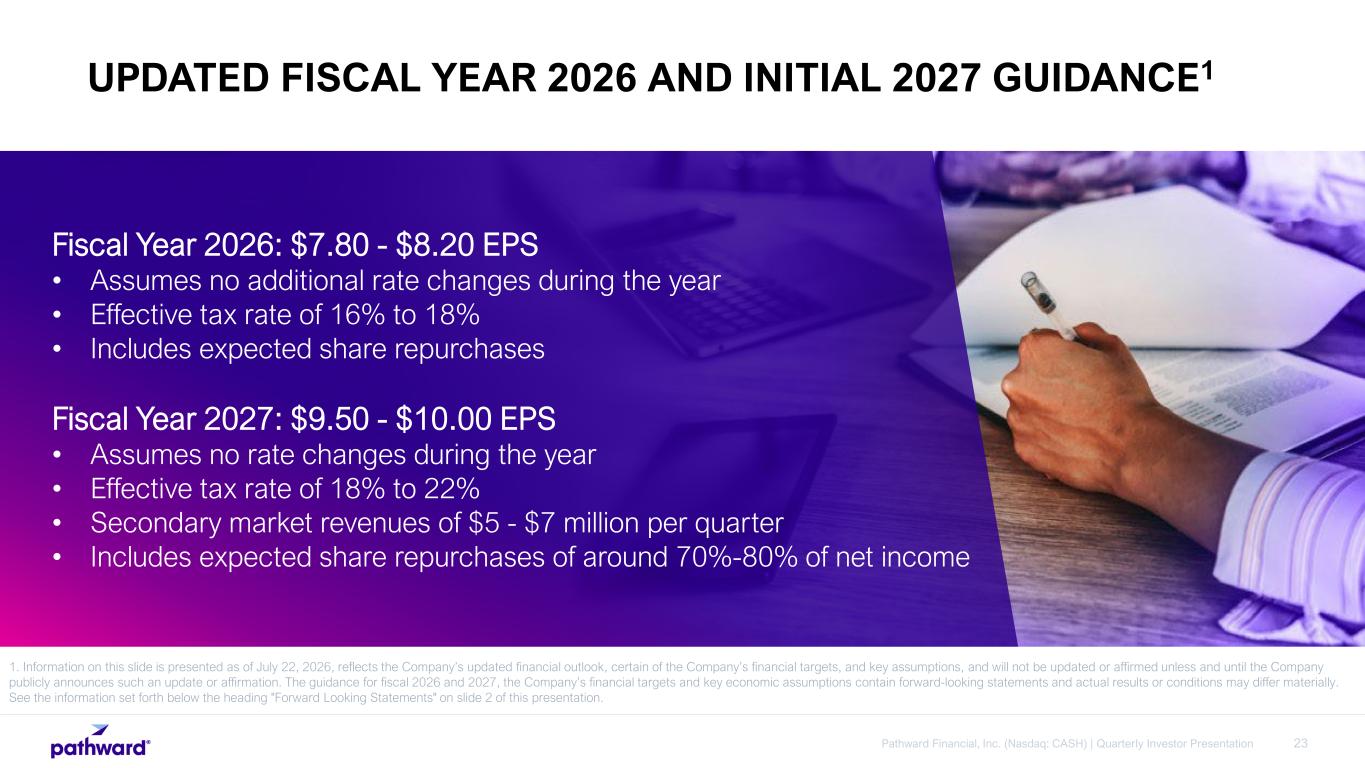
23Pathward Financial, Inc. (Nasdaq: CASH) | Quarterly Investor Presentation 1. Information on this slide is presented as of July 22, 2026, reflects the Company’s updated financial outlook, certain of the Company’s financial targets, and key assumptions, and will not be updated or affirmed unless and until the Company publicly announces such an update or affirmation. The guidance for fiscal 2026 and 2027, the Company’s financial targets and key economic assumptions contain forward-looking statements and actual results or conditions may differ materially. See the information set forth below the heading "Forward Looking Statements" on slide 2 of this presentation. UPDATED FISCAL YEAR 2026 AND INITIAL 2027 GUIDANCE1 Fiscal Year 2026: $7.80 - $8.20 EPS • Assumes no additional rate changes during the year • Effective tax rate of 16% to 18% • Includes expected share repurchases Fiscal Year 2027: $9.50 - $10.00 EPS • Assumes no rate changes during the year • Effective tax rate of 18% to 22% • Secondary market revenues of $5 - $7 million per quarter • Includes expected share repurchases of around 70%-80% of net income

24Pathward Financial, Inc. (Nasdaq: CASH) | Quarterly Investor Presentation Q&A
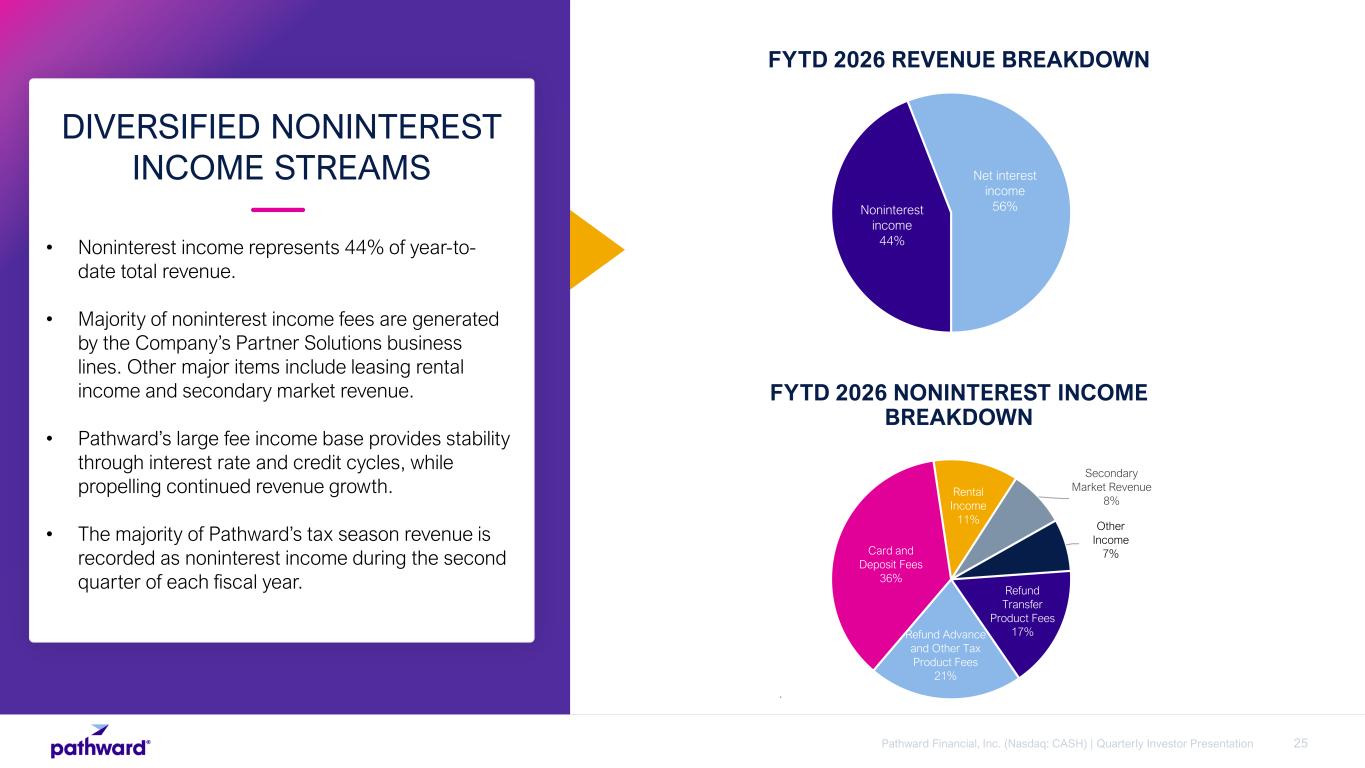
25Pathward Financial, Inc. (Nasdaq: CASH) | Quarterly Investor Presentation • Noninterest income represents 44% of year-to- date total revenue. • Majority of noninterest income fees are generated by the Company’s Partner Solutions business lines. Other major items include leasing rental income and secondary market revenue. • Pathward’s large fee income base provides stability through interest rate and credit cycles, while propelling continued revenue growth. • The majority of Pathward’s tax season revenue is recorded as noninterest income during the second quarter of each fiscal year. DIVERSIFIED NONINTEREST INCOME STREAMS Refund Transfer Product Fees 17%Refund Advance and Other Tax Product Fees 21% Card and Deposit Fees 36% Rental Income 11% Secondary Market Revenue 8% Other Income 7% FYTD 2026 NONINTEREST INCOME BREAKDOWN . Noninterest income 44% Net interest income 56% FYTD 2026 REVENUE BREAKDOWN
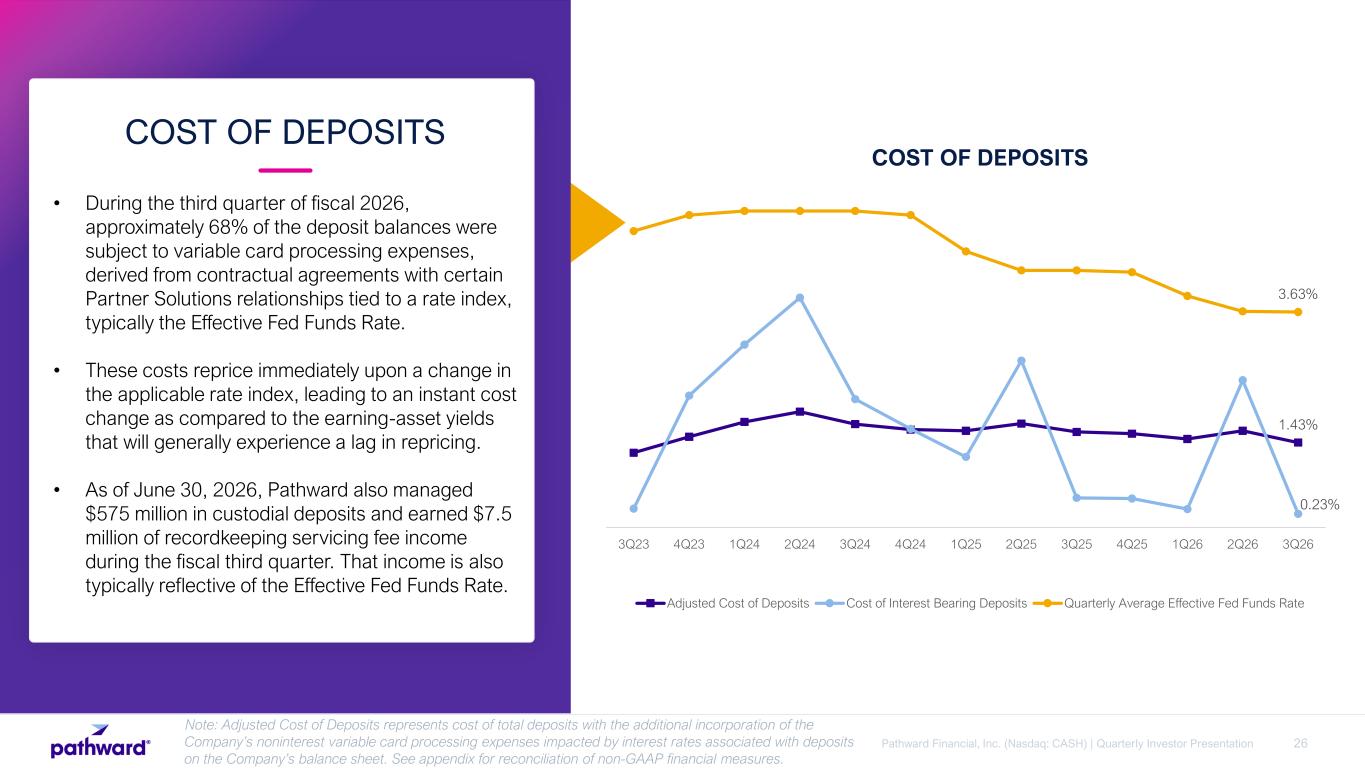
26Pathward Financial, Inc. (Nasdaq: CASH) | Quarterly Investor Presentation • During the third quarter of fiscal 2026, approximately 68% of the deposit balances were subject to variable card processing expenses, derived from contractual agreements with certain Partner Solutions relationships tied to a rate index, typically the Effective Fed Funds Rate. • These costs reprice immediately upon a change in the applicable rate index, leading to an instant cost change as compared to the earning-asset yields that will generally experience a lag in repricing. • As of June 30, 2026, Pathward also managed $575 million in custodial deposits and earned $7.5 million of recordkeeping servicing fee income during the fiscal third quarter. That income is also typically reflective of the Effective Fed Funds Rate. COST OF DEPOSITS 1.43% 0.23% 3.63% 3Q23 4Q23 1Q24 2Q24 3Q24 4Q24 1Q25 2Q25 3Q25 4Q25 1Q26 2Q26 3Q26 Adjusted Cost of Deposits Cost of Interest Bearing Deposits Quarterly Average Effective Fed Funds Rate Note: Adjusted Cost of Deposits represents cost of total deposits with the additional incorporation of the Company’s noninterest variable card processing expenses impacted by interest rates associated with deposits on the Company’s balance sheet. See appendix for reconciliation of non-GAAP financial measures. COST OF DEPOSITS
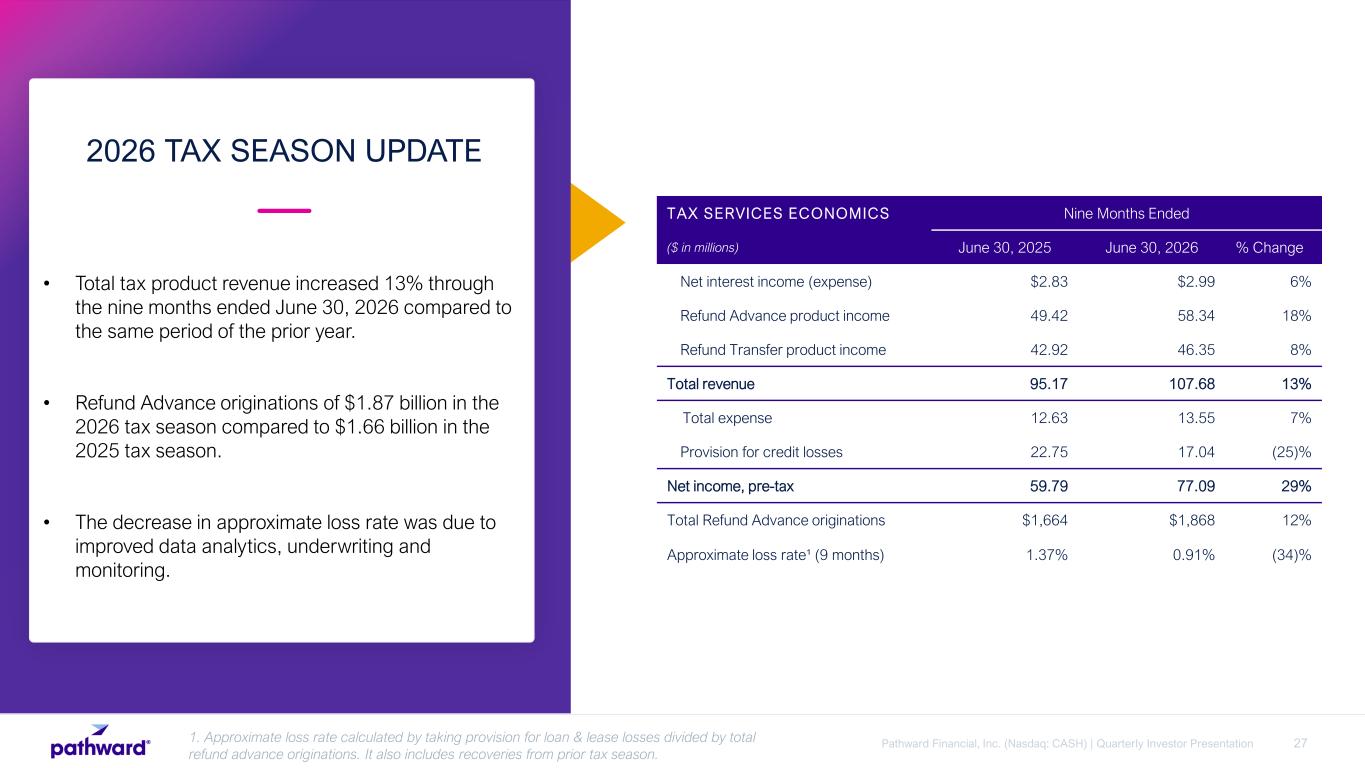
27Pathward Financial, Inc. (Nasdaq: CASH) | Quarterly Investor Presentation1. Approximate loss rate calculated by taking provision for loan & lease losses divided by total refund advance originations. It also includes recoveries from prior tax season. TAX SERVICES ECONOMICS Nine Months Ended ($ in millions) June 30, 2025 June 30, 2026 % Change Net interest income (expense) $2.83 $2.99 6% Refund Advance product income 49.42 58.34 18% Refund Transfer product income 42.92 46.35 8% Total revenue 95.17 107.68 13% Total expense 12.63 13.55 7% Provision for credit losses 22.75 17.04 (25)% Net income, pre-tax 59.79 77.09 29% Total Refund Advance originations $1,664 $1,868 12% Approximate loss rate¹ (9 months) 1.37% 0.91% (34)% • Total tax product revenue increased 13% through the nine months ended June 30, 2026 compared to the same period of the prior year. • Refund Advance originations of $1.87 billion in the 2026 tax season compared to $1.66 billion in the 2025 tax season. • The decrease in approximate loss rate was due to improved data analytics, underwriting and monitoring. 2026 TAX SEASON UPDATE
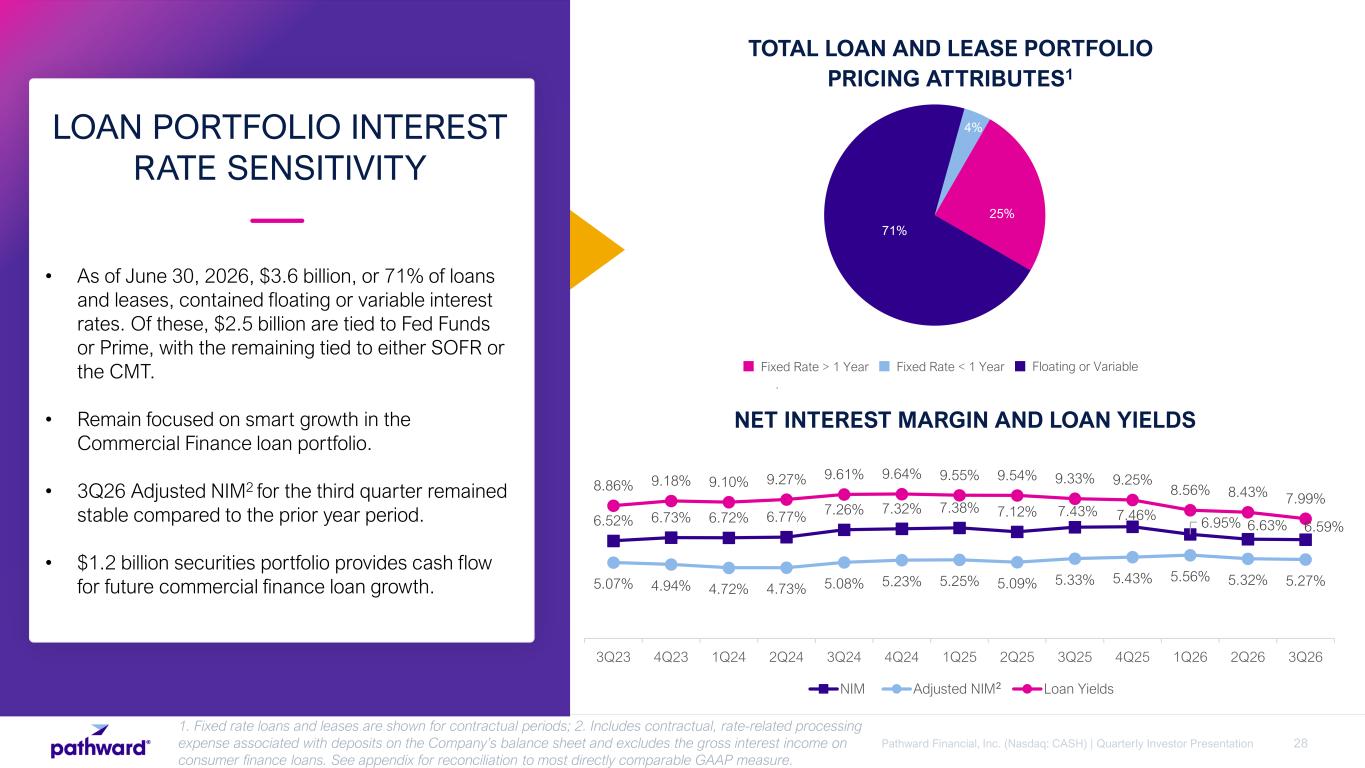
28Pathward Financial, Inc. (Nasdaq: CASH) | Quarterly Investor Presentation . 71% 4% 25% Fixed Rate > 1 Year TOTAL LOAN AND LEASE PORTFOLIO PRICING ATTRIBUTES1 Fixed Rate < 1 Year Floating or Variable NET INTEREST MARGIN AND LOAN YIELDS 6.52% 6.73% 6.72% 6.77% 7.26% 7.32% 7.38% 7.12% 7.43% 7.46% 6.95% 6.63% 6.59% 5.07% 4.94% 4.72% 4.73% 5.08% 5.23% 5.25% 5.09% 5.33% 5.43% 5.56% 5.32% 5.27% 8.86% 9.18% 9.10% 9.27% 9.61% 9.64% 9.55% 9.54% 9.33% 9.25% 8.56% 8.43% 7.99% 3Q23 4Q23 1Q24 2Q24 3Q24 4Q24 1Q25 2Q25 3Q25 4Q25 1Q26 2Q26 3Q26 NIM Adjusted NIM Loan Yields2 1. Fixed rate loans and leases are shown for contractual periods; 2. Includes contractual, rate-related processing expense associated with deposits on the Company’s balance sheet and excludes the gross interest income on consumer finance loans. See appendix for reconciliation to most directly comparable GAAP measure. • As of June 30, 2026, $3.6 billion, or 71% of loans and leases, contained floating or variable interest rates. Of these, $2.5 billion are tied to Fed Funds or Prime, with the remaining tied to either SOFR or the CMT. • Remain focused on smart growth in the Commercial Finance loan portfolio. • 3Q26 Adjusted NIM2 for the third quarter remained stable compared to the prior year period. • $1.2 billion securities portfolio provides cash flow for future commercial finance loan growth. LOAN PORTFOLIO INTEREST RATE SENSITIVITY
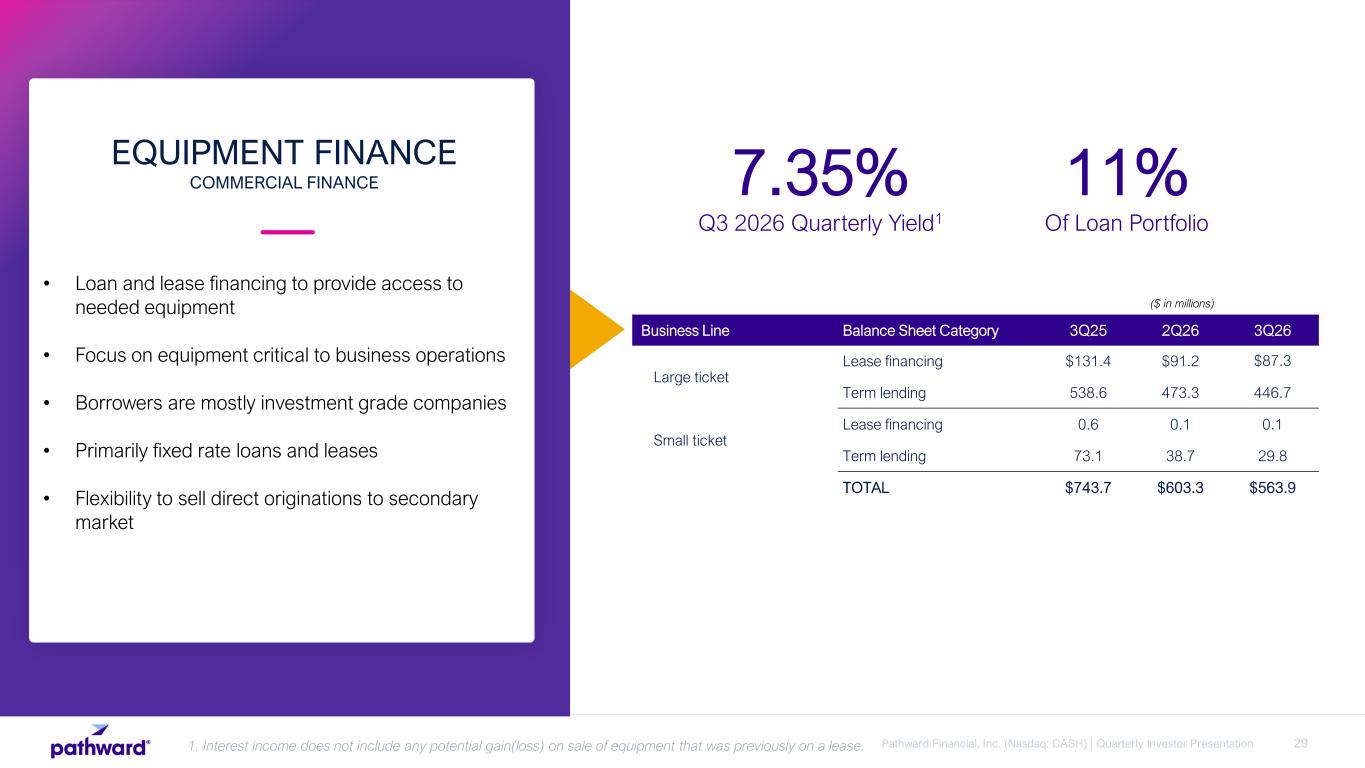
29Pathward Financial, Inc. (Nasdaq: CASH) | Quarterly Investor Presentation 7.35% Q3 2026 Quarterly Yield1 11% Of Loan Portfolio Business Line Balance Sheet Category 3Q25 2Q26 3Q26 Large ticket Lease financing $131.4 $91.2 $87.3 Term lending 538.6 473.3 446.7 Small ticket Lease financing 0.6 0.1 0.1 Term lending 73.1 38.7 29.8 TOTAL $743.7 $603.3 $563.9 1. Interest income does not include any potential gain(loss) on sale of equipment that was previously on a lease. ($ in millions) • Loan and lease financing to provide access to needed equipment • Focus on equipment critical to business operations • Borrowers are mostly investment grade companies • Primarily fixed rate loans and leases • Flexibility to sell direct originations to secondary market EQUIPMENT FINANCE COMMERCIAL FINANCE
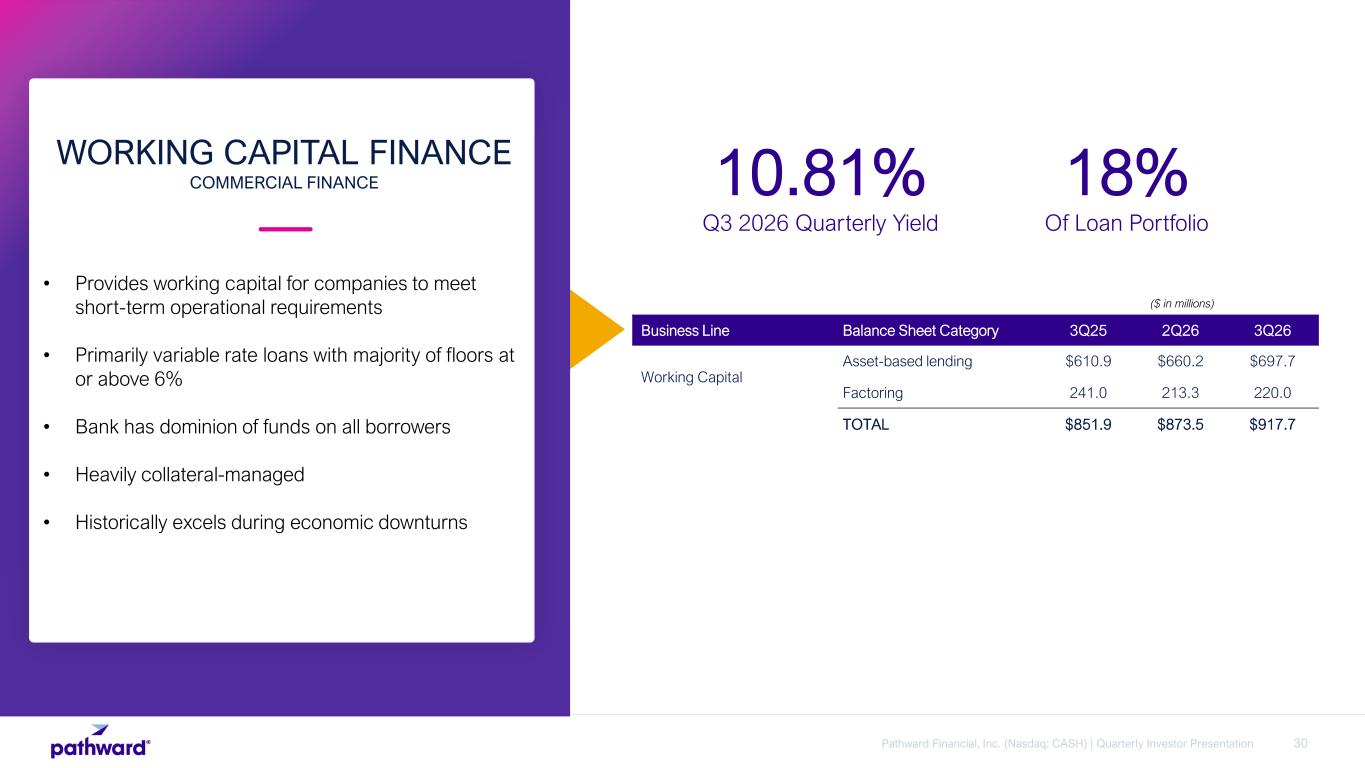
30Pathward Financial, Inc. (Nasdaq: CASH) | Quarterly Investor Presentation 10.81% Q3 2026 Quarterly Yield 18% Of Loan Portfolio Business Line Balance Sheet Category 3Q25 2Q26 3Q26 Working Capital Asset-based lending $610.9 $660.2 $697.7 Factoring 241.0 213.3 220.0 TOTAL $851.9 $873.5 $917.7 • Provides working capital for companies to meet short-term operational requirements • Primarily variable rate loans with majority of floors at or above 6% • Bank has dominion of funds on all borrowers • Heavily collateral-managed • Historically excels during economic downturns WORKING CAPITAL FINANCE COMMERCIAL FINANCE ($ in millions)
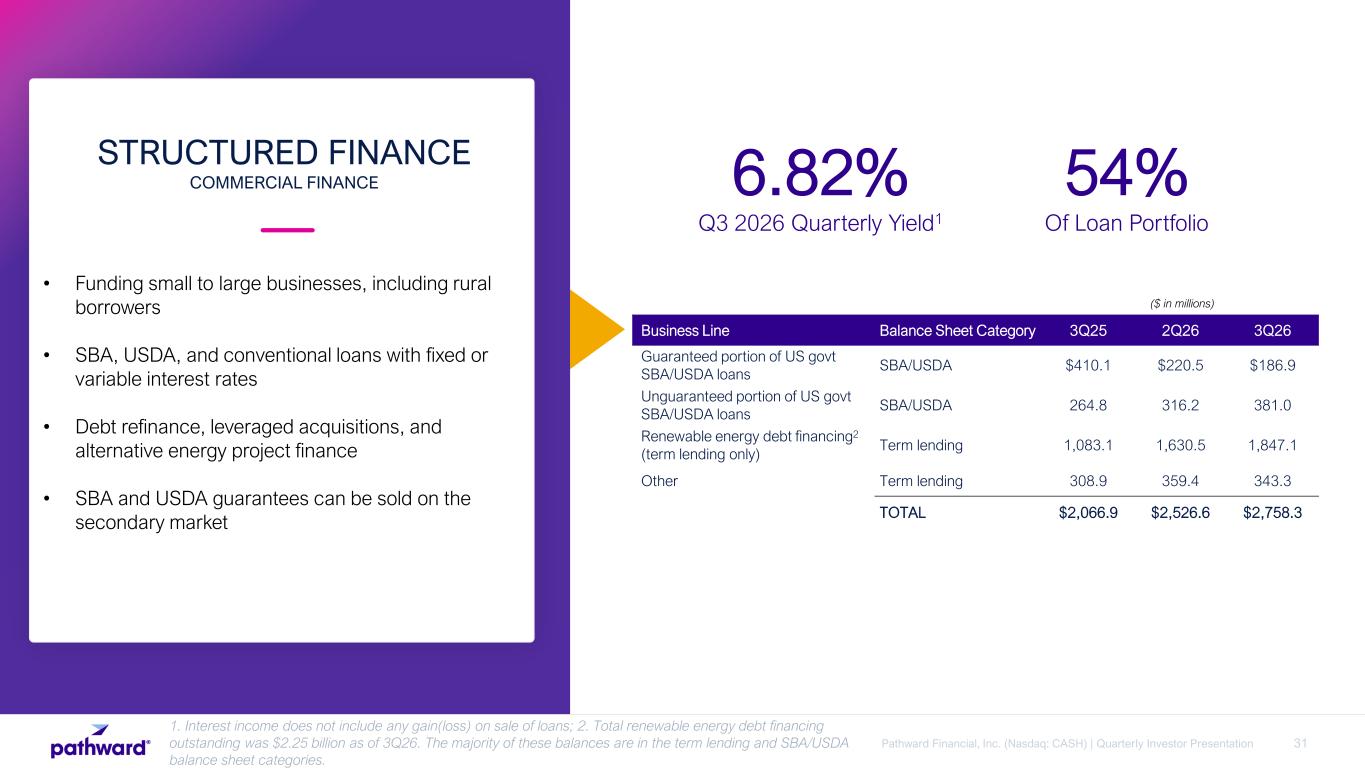
31Pathward Financial, Inc. (Nasdaq: CASH) | Quarterly Investor Presentation 6.82% Q3 2026 Quarterly Yield1 54% Of Loan Portfolio Business Line Balance Sheet Category 3Q25 2Q26 3Q26 Guaranteed portion of US govt SBA/USDA loans SBA/USDA $410.1 $220.5 $186.9 Unguaranteed portion of US govt SBA/USDA loans SBA/USDA 264.8 316.2 381.0 Renewable energy debt financing2 (term lending only) Term lending 1,083.1 1,630.5 1,847.1 Other Term lending 308.9 359.4 343.3 TOTAL $2,066.9 $2,526.6 $2,758.3 1. Interest income does not include any gain(loss) on sale of loans; 2. Total renewable energy debt financing outstanding was $2.25 billion as of 3Q26. The majority of these balances are in the term lending and SBA/USDA balance sheet categories. • Funding small to large businesses, including rural borrowers • SBA, USDA, and conventional loans with fixed or variable interest rates • Debt refinance, leveraged acquisitions, and alternative energy project finance • SBA and USDA guarantees can be sold on the secondary market STRUCTURED FINANCE COMMERCIAL FINANCE ($ in millions)
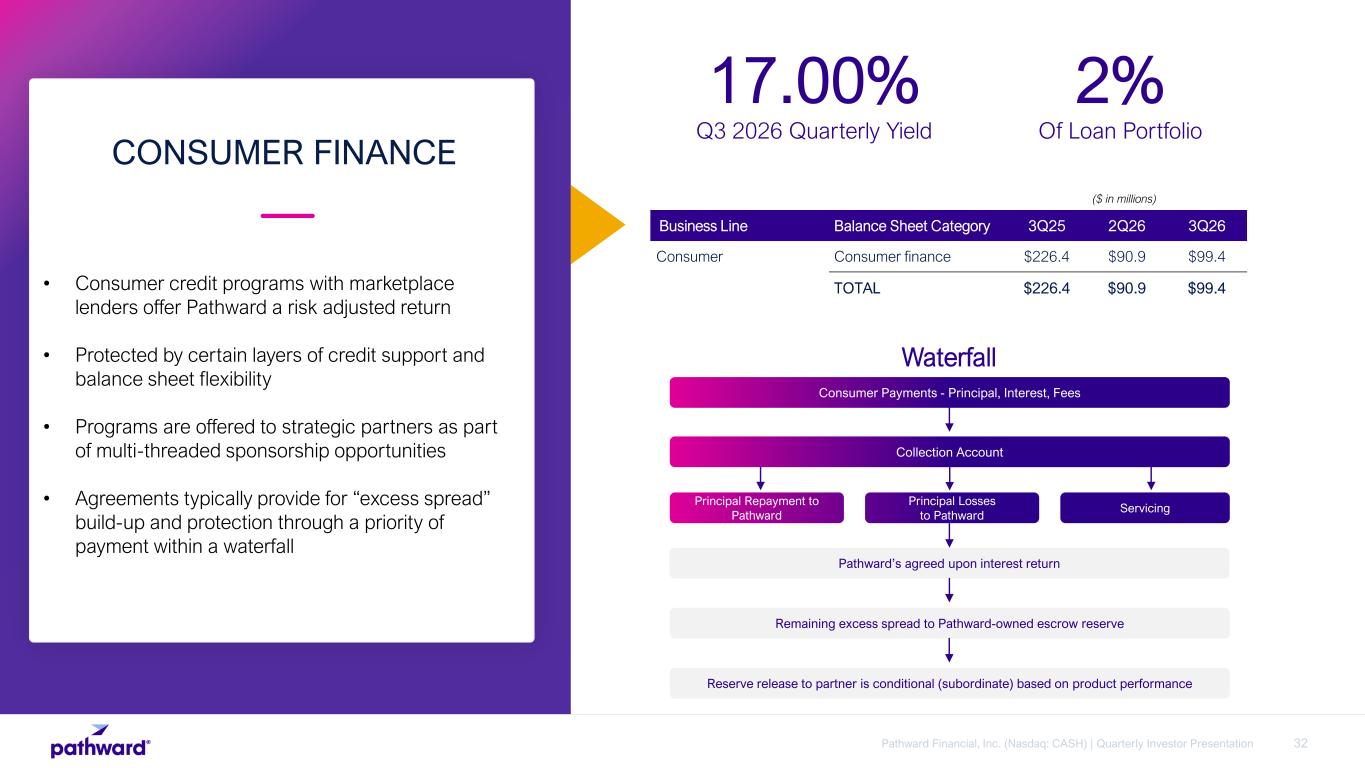
32Pathward Financial, Inc. (Nasdaq: CASH) | Quarterly Investor Presentation 17.00% Q3 2026 Quarterly Yield 2% Of Loan Portfolio Business Line Balance Sheet Category 3Q25 2Q26 3Q26 Consumer Consumer finance $226.4 $90.9 $99.4 TOTAL $226.4 $90.9 $99.4 Consumer Payments - Principal, Interest, Fees Collection Account Servicing Principal Losses to Pathward Principal Repayment to Pathward Pathward’s agreed upon interest return Remaining excess spread to Pathward-owned escrow reserve Reserve release to partner is conditional (subordinate) based on product performance Waterfall • Consumer credit programs with marketplace lenders offer Pathward a risk adjusted return • Protected by certain layers of credit support and balance sheet flexibility • Programs are offered to strategic partners as part of multi-threaded sponsorship opportunities • Agreements typically provide for “excess spread” build-up and protection through a priority of payment within a waterfall CONSUMER FINANCE ($ in millions)
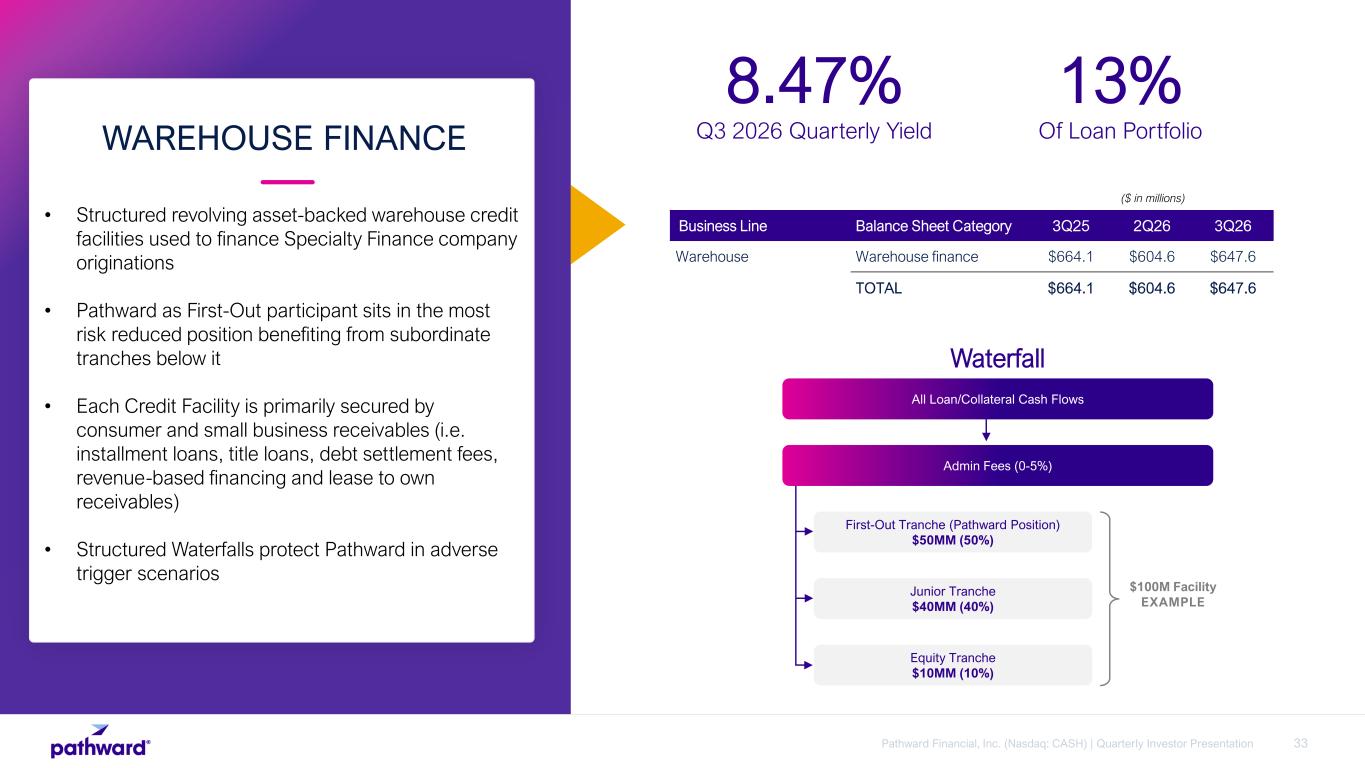
33Pathward Financial, Inc. (Nasdaq: CASH) | Quarterly Investor Presentation 8.47% Q3 2026 Quarterly Yield 13% Of Loan Portfolio Business Line Balance Sheet Category 3Q25 2Q26 3Q26 Warehouse Warehouse finance $664.1 $604.6 $647.6 TOTAL $664.1 $604.6 $647.6 Waterfall All Loan/Collateral Cash Flows Admin Fees (0-5%) Junior Tranche $40MM (40%) Equity Tranche $10MM (10%) First-Out Tranche (Pathward Position) $50MM (50%) $100M Facility EXAMPLE • Structured revolving asset-backed warehouse credit facilities used to finance Specialty Finance company originations • Pathward as First-Out participant sits in the most risk reduced position benefiting from subordinate tranches below it • Each Credit Facility is primarily secured by consumer and small business receivables (i.e. installment loans, title loans, debt settlement fees, revenue-based financing and lease to own receivables) • Structured Waterfalls protect Pathward in adverse trigger scenarios WAREHOUSE FINANCE ($ in millions)
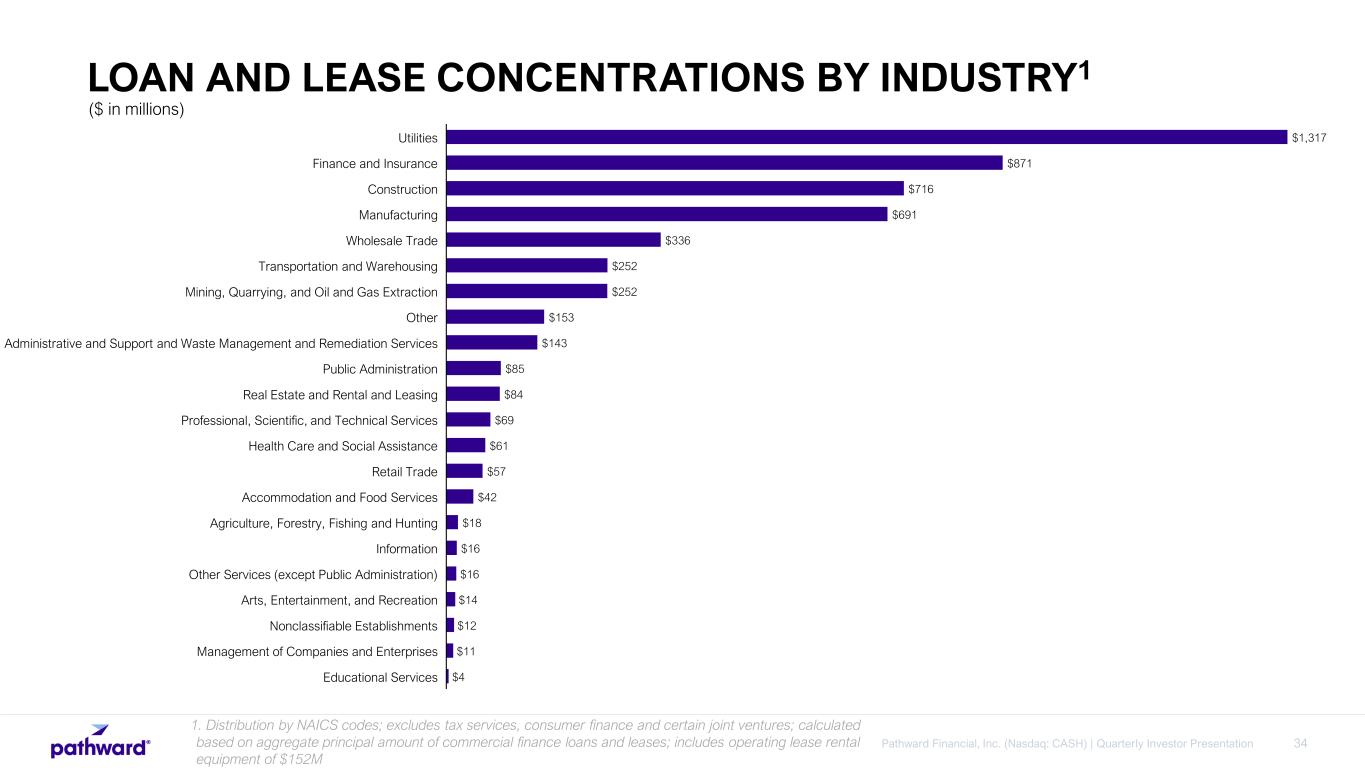
34Pathward Financial, Inc. (Nasdaq: CASH) | Quarterly Investor Presentation 1. Distribution by NAICS codes; excludes tax services, consumer finance and certain joint ventures; calculated based on aggregate principal amount of commercial finance loans and leases; includes operating lease rental equipment of $152M $1,317 $871 $716 $691 $336 $252 $252 $153 $143 $85 $84 $69 $61 $57 $42 $18 $16 $16 $14 $12 $11 $4 Utilities Finance and Insurance Construction Manufacturing Wholesale Trade Transportation and Warehousing Mining, Quarrying, and Oil and Gas Extraction Other Administrative and Support and Waste Management and Remediation Services Public Administration Real Estate and Rental and Leasing Professional, Scientific, and Technical Services Health Care and Social Assistance Retail Trade Accommodation and Food Services Agriculture, Forestry, Fishing and Hunting Information Other Services (except Public Administration) Arts, Entertainment, and Recreation Nonclassifiable Establishments Management of Companies and Enterprises Educational Services ($ in millions) LOAN AND LEASE CONCENTRATIONS BY INDUSTRY1
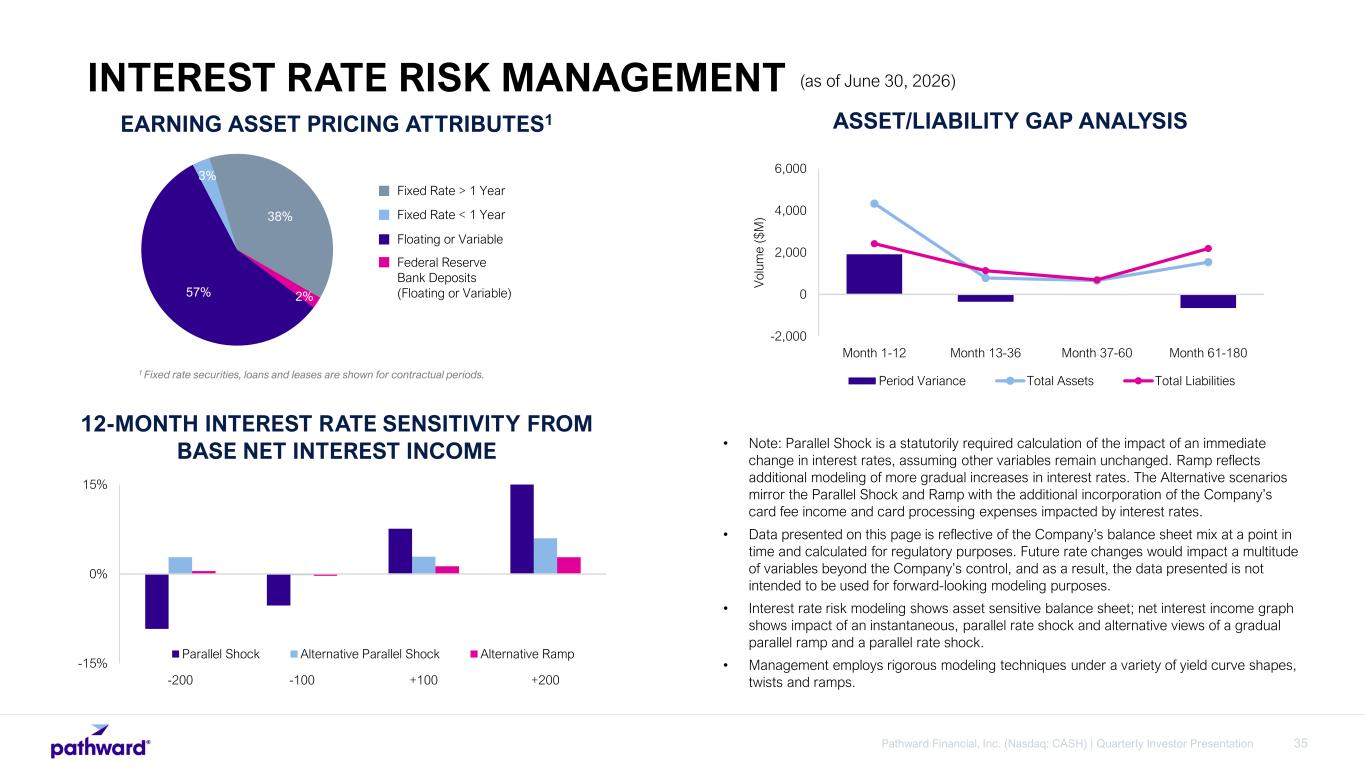
35Pathward Financial, Inc. (Nasdaq: CASH) | Quarterly Investor Presentation ASSET/LIABILITY GAP ANALYSIS 1 Fixed rate securities, loans and leases are shown for contractual periods. 2%57% 3% 38% Fixed Rate > 1 Year EARNING ASSET PRICING ATTRIBUTES1 Fixed Rate < 1 Year Floating or Variable Federal Reserve Bank Deposits (Floating or Variable) • Note: Parallel Shock is a statutorily required calculation of the impact of an immediate change in interest rates, assuming other variables remain unchanged. Ramp reflects additional modeling of more gradual increases in interest rates. The Alternative scenarios mirror the Parallel Shock and Ramp with the additional incorporation of the Company’s card fee income and card processing expenses impacted by interest rates. • Data presented on this page is reflective of the Company’s balance sheet mix at a point in time and calculated for regulatory purposes. Future rate changes would impact a multitude of variables beyond the Company’s control, and as a result, the data presented is not intended to be used for forward-looking modeling purposes. • Interest rate risk modeling shows asset sensitive balance sheet; net interest income graph shows impact of an instantaneous, parallel rate shock and alternative views of a gradual parallel ramp and a parallel rate shock. • Management employs rigorous modeling techniques under a variety of yield curve shapes, twists and ramps. -15% 0% 15% -200 -100 +100 +200 Parallel Shock Alternative Parallel Shock Alternative Ramp 12-MONTH INTEREST RATE SENSITIVITY FROM BASE NET INTEREST INCOME -2,000 0 2,000 4,000 6,000 Month 1-12 Month 13-36 Month 37-60 Month 61-180 V ol um e ($ M ) Period Variance Total Assets Total Liabilities INTEREST RATE RISK MANAGEMENT (as of June 30, 2026)
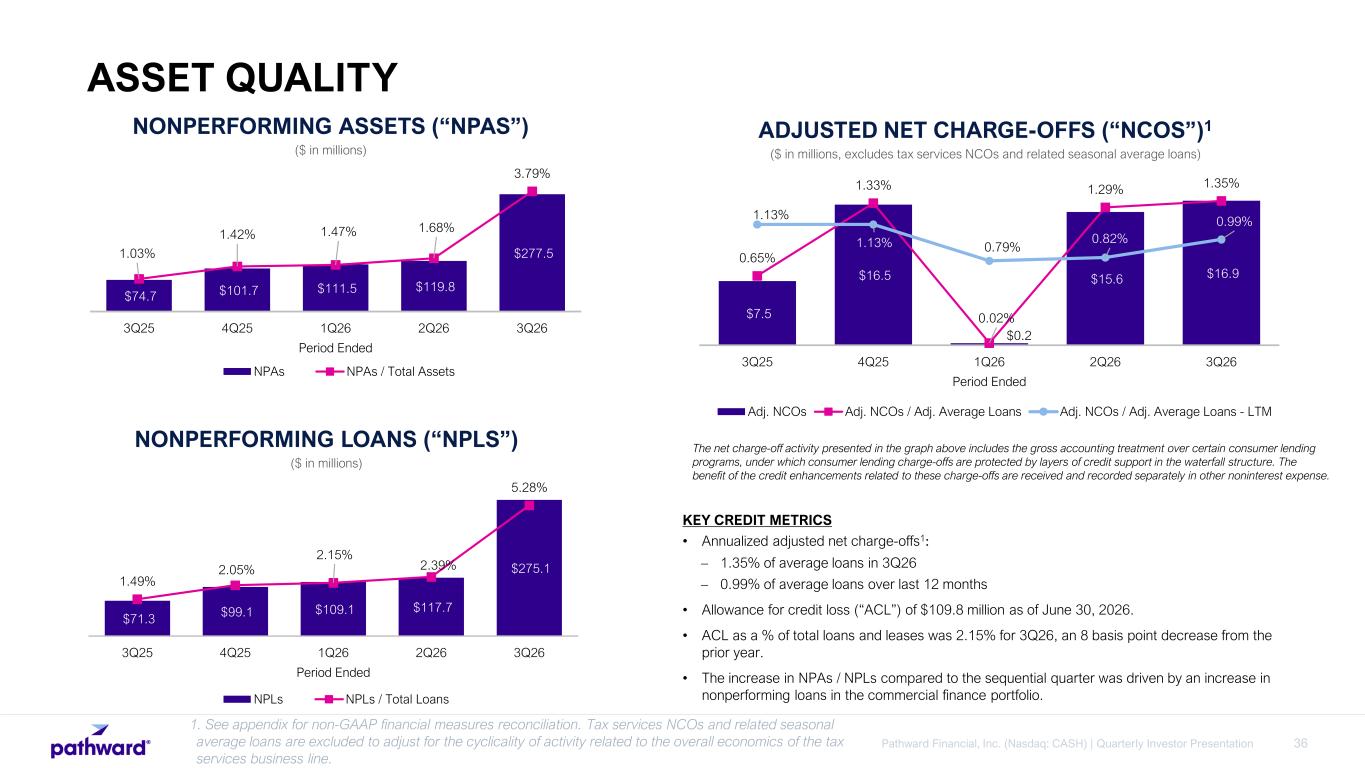
36Pathward Financial, Inc. (Nasdaq: CASH) | Quarterly Investor Presentation $7.5 $16.5 $0.2 $15.6 $16.9 0.65% 1.33% 0.02% 1.29% 1.35% 1.13% 1.13% 0.79% 0.82% 0.99% 3Q25 4Q25 1Q26 2Q26 3Q26 Period Ended Adj. NCOs Adj. NCOs / Adj. Average Loans Adj. NCOs / Adj. Average Loans - LTM ADJUSTED NET CHARGE-OFFS (“NCOS”)1 ($ in millions, excludes tax services NCOs and related seasonal average loans) KEY CREDIT METRICS • Annualized adjusted net charge-offs1: – 1.35% of average loans in 3Q26 – 0.99% of average loans over last 12 months • Allowance for credit loss (“ACL”) of $109.8 million as of June 30, 2026. • ACL as a % of total loans and leases was 2.15% for 3Q26, an 8 basis point decrease from the prior year. • The increase in NPAs / NPLs compared to the sequential quarter was driven by an increase in nonperforming loans in the commercial finance portfolio. 1. See appendix for non-GAAP financial measures reconciliation. Tax services NCOs and related seasonal average loans are excluded to adjust for the cyclicality of activity related to the overall economics of the tax services business line. $71.3 $99.1 $109.1 $117.7 $275.1 1.49% 2.05% 2.15% 2.39% 5.28% 3Q25 4Q25 1Q26 2Q26 3Q26 Period Ended NPLs NPLs / Total Loans NONPERFORMING ASSETS (“NPAS”) ($ in millions) NONPERFORMING LOANS (“NPLS”) ($ in millions) $74.7 $101.7 $111.5 $119.8 $277.5 1.03% 1.42% 1.47% 1.68% 3.79% 3Q25 4Q25 1Q26 2Q26 3Q26 Period Ended NPAs NPAs / Total Assets The net charge-off activity presented in the graph above includes the gross accounting treatment over certain consumer lending programs, under which consumer lending charge-offs are protected by layers of credit support in the waterfall structure. The benefit of the credit enhancements related to these charge-offs are received and recorded separately in other noninterest expense. ASSET QUALITY
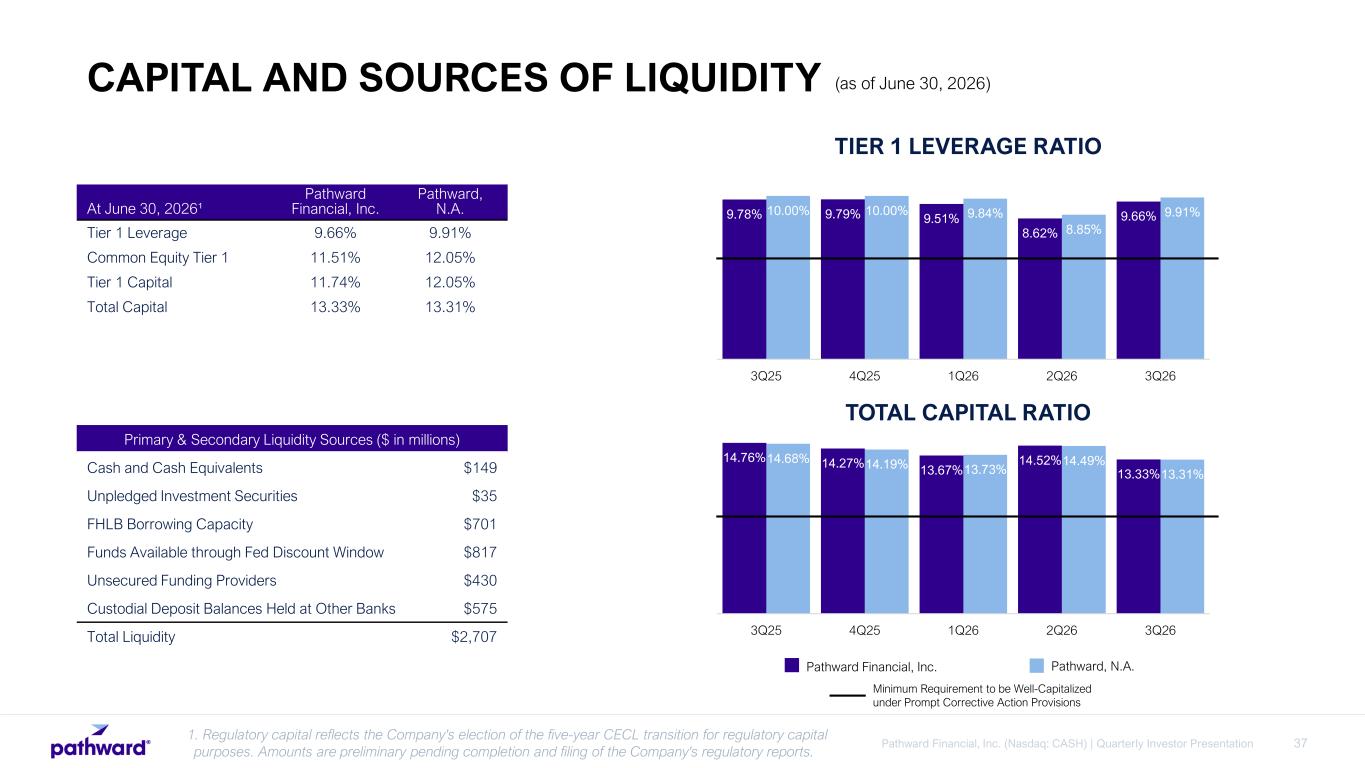
37Pathward Financial, Inc. (Nasdaq: CASH) | Quarterly Investor Presentation At June 30, 2026¹ Pathward Financial, Inc. Pathward, N.A. Tier 1 Leverage 9.66% 9.91% Common Equity Tier 1 11.51% 12.05% Tier 1 Capital 11.74% 12.05% Total Capital 13.33% 13.31% Primary & Secondary Liquidity Sources ($ in millions) Cash and Cash Equivalents $149 Unpledged Investment Securities $35 FHLB Borrowing Capacity $701 Funds Available through Fed Discount Window $817 Unsecured Funding Providers $430 Custodial Deposit Balances Held at Other Banks $575 Total Liquidity $2,707 9.78% 9.79% 9.51% 8.62% 9.66%10.00% 10.00% 9.84% 8.85% 9.91% 3Q25 4Q25 1Q26 2Q26 3Q26 TIER 1 LEVERAGE RATIO 14.76% 14.27% 13.67% 14.52% 13.33% 14.68% 14.19% 13.73% 14.49% 13.31% 3Q25 4Q25 1Q26 2Q26 3Q26 TOTAL CAPITAL RATIO Pathward Financial, Inc. Pathward, N.A. Minimum Requirement to be Well-Capitalized under Prompt Corrective Action Provisions 1. Regulatory capital reflects the Company's election of the five-year CECL transition for regulatory capital purposes. Amounts are preliminary pending completion and filing of the Company's regulatory reports. CAPITAL AND SOURCES OF LIQUIDITY (as of June 30, 2026)

38Pathward Financial, Inc. (Nasdaq: CASH) | Quarterly Investor Presentation APPENDIX
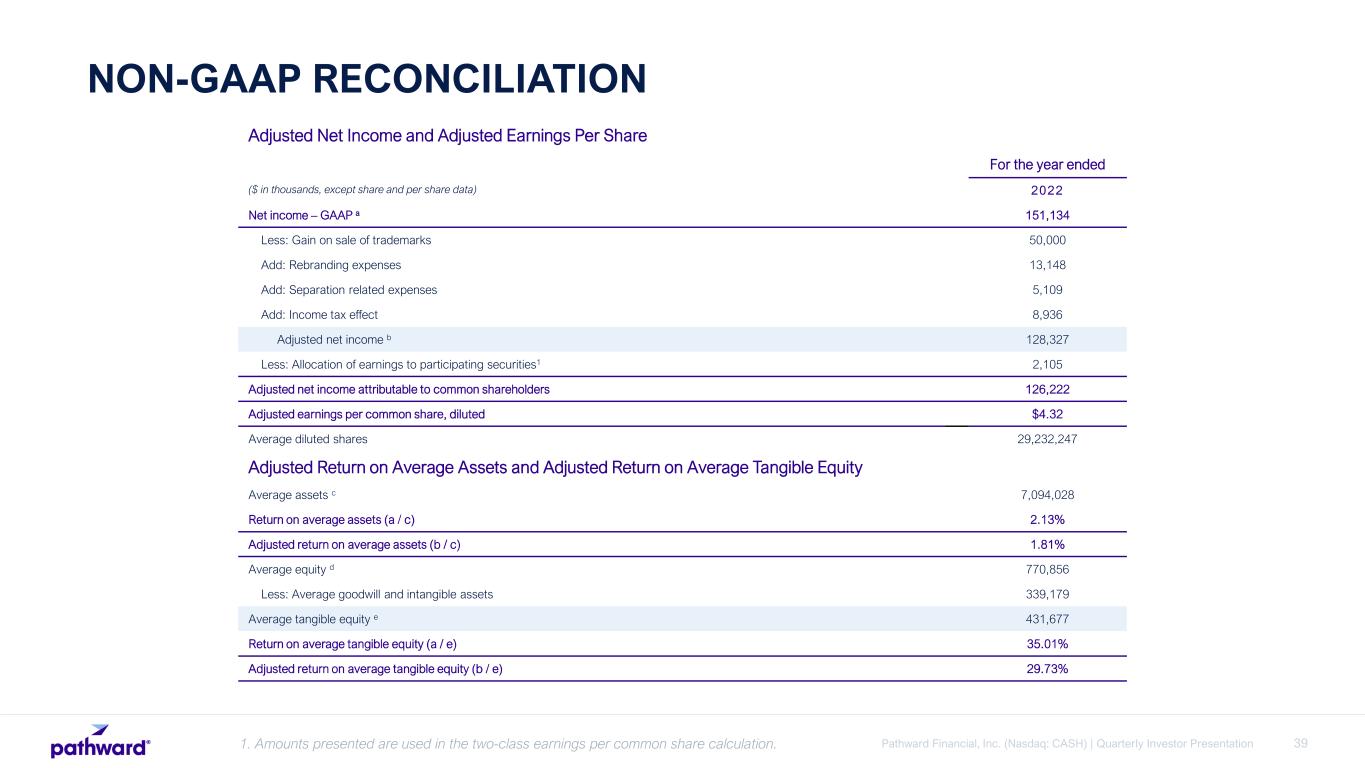
39Pathward Financial, Inc. (Nasdaq: CASH) | Quarterly Investor Presentation NON-GAAP RECONCILIATION 1. Amounts presented are used in the two-class earnings per common share calculation. Adjusted Net Income and Adjusted Earnings Per Share For the year ended ($ in thousands, except share and per share data) 2022 Net income – GAAP a 151,134 Less: Gain on sale of trademarks 50,000 Add: Rebranding expenses 13,148 Add: Separation related expenses 5,109 Add: Income tax effect 8,936 Adjusted net income b 128,327 Less: Allocation of earnings to participating securities1 2,105 Adjusted net income attributable to common shareholders 126,222 Adjusted earnings per common share, diluted $4.32 Average diluted shares 29,232,247 Adjusted Return on Average Assets and Adjusted Return on Average Tangible Equity Average assets c 7,094,028 Return on average assets (a / c) 2.13% Adjusted return on average assets (b / c) 1.81% Average equity d 770,856 Less: Average goodwill and intangible assets 339,179 Average tangible equity e 431,677 Return on average tangible equity (a / e) 35.01% Adjusted return on average tangible equity (b / e) 29.73%
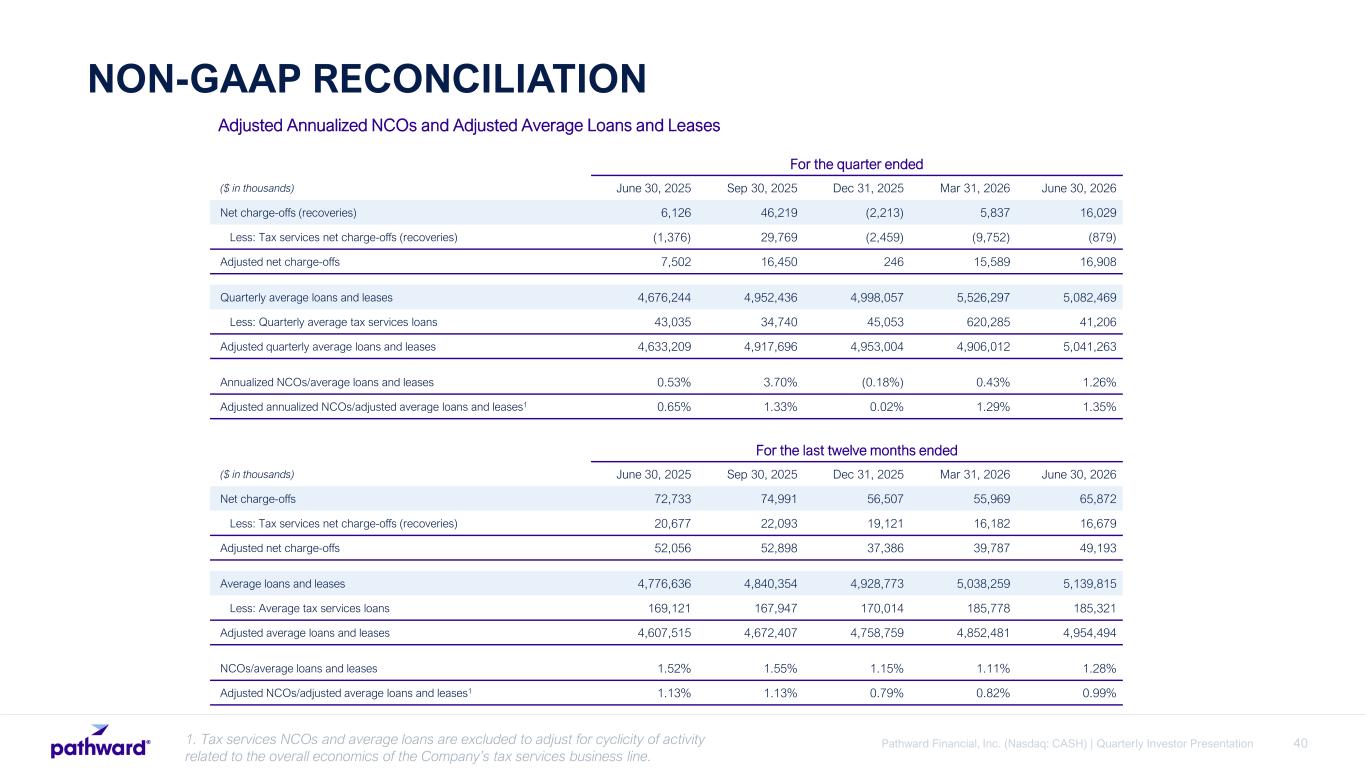
40Pathward Financial, Inc. (Nasdaq: CASH) | Quarterly Investor Presentation NON-GAAP RECONCILIATION For the quarter ended ($ in thousands) June 30, 2025 Sep 30, 2025 Dec 31, 2025 Mar 31, 2026 June 30, 2026 Net charge-offs (recoveries) 6,126 46,219 (2,213) 5,837 16,029 Less: Tax services net charge-offs (recoveries) (1,376) 29,769 (2,459) (9,752) (879) Adjusted net charge-offs 7,502 16,450 246 15,589 16,908 Quarterly average loans and leases 4,676,244 4,952,436 4,998,057 5,526,297 5,082,469 Less: Quarterly average tax services loans 43,035 34,740 45,053 620,285 41,206 Adjusted quarterly average loans and leases 4,633,209 4,917,696 4,953,004 4,906,012 5,041,263 Annualized NCOs/average loans and leases 0.53% 3.70% (0.18%) 0.43% 1.26% Adjusted annualized NCOs/adjusted average loans and leases1 0.65% 1.33% 0.02% 1.29% 1.35% Adjusted Annualized NCOs and Adjusted Average Loans and Leases For the last twelve months ended ($ in thousands) June 30, 2025 Sep 30, 2025 Dec 31, 2025 Mar 31, 2026 June 30, 2026 Net charge-offs 72,733 74,991 56,507 55,969 65,872 Less: Tax services net charge-offs (recoveries) 20,677 22,093 19,121 16,182 16,679 Adjusted net charge-offs 52,056 52,898 37,386 39,787 49,193 Average loans and leases 4,776,636 4,840,354 4,928,773 5,038,259 5,139,815 Less: Average tax services loans 169,121 167,947 170,014 185,778 185,321 Adjusted average loans and leases 4,607,515 4,672,407 4,758,759 4,852,481 4,954,494 NCOs/average loans and leases 1.52% 1.55% 1.15% 1.11% 1.28% Adjusted NCOs/adjusted average loans and leases1 1.13% 1.13% 0.79% 0.82% 0.99% 1. Tax services NCOs and average loans are excluded to adjust for cyclicity of activity related to the overall economics of the Company’s tax services business line.
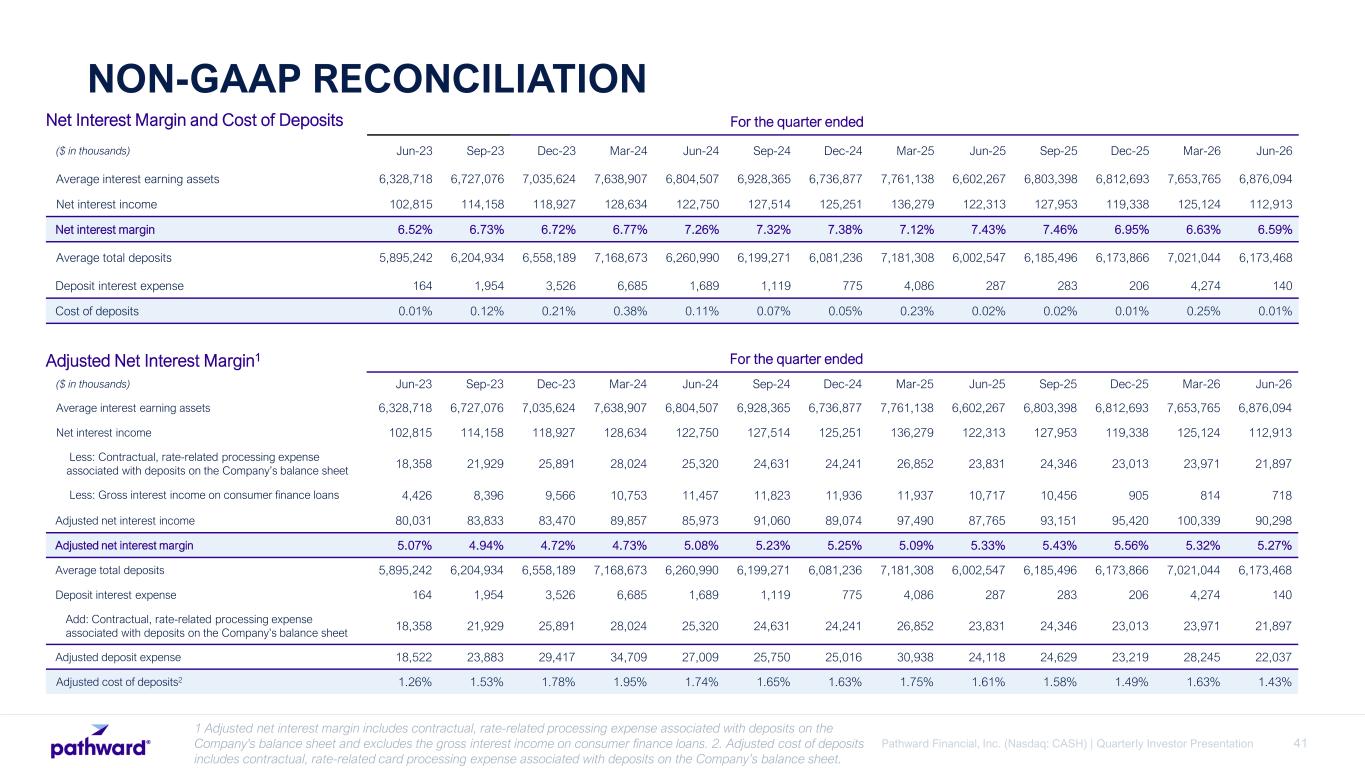
41Pathward Financial, Inc. (Nasdaq: CASH) | Quarterly Investor Presentation For the quarter ended ($ in thousands) Jun-23 Sep-23 Dec-23 Mar-24 Jun-24 Sep-24 Dec-24 Mar-25 Jun-25 Sep-25 Dec-25 Mar-26 Jun-26 Average interest earning assets 6,328,718 6,727,076 7,035,624 7,638,907 6,804,507 6,928,365 6,736,877 7,761,138 6,602,267 6,803,398 6,812,693 7,653,765 6,876,094 Net interest income 102,815 114,158 118,927 128,634 122,750 127,514 125,251 136,279 122,313 127,953 119,338 125,124 112,913 Less: Contractual, rate-related processing expense associated with deposits on the Company’s balance sheet 18,358 21,929 25,891 28,024 25,320 24,631 24,241 26,852 23,831 24,346 23,013 23,971 21,897 Less: Gross interest income on consumer finance loans 4,426 8,396 9,566 10,753 11,457 11,823 11,936 11,937 10,717 10,456 905 814 718 Adjusted net interest income 80,031 83,833 83,470 89,857 85,973 91,060 89,074 97,490 87,765 93,151 95,420 100,339 90,298 Adjusted net interest margin 5.07% 4.94% 4.72% 4.73% 5.08% 5.23% 5.25% 5.09% 5.33% 5.43% 5.56% 5.32% 5.27% Average total deposits 5,895,242 6,204,934 6,558,189 7,168,673 6,260,990 6,199,271 6,081,236 7,181,308 6,002,547 6,185,496 6,173,866 7,021,044 6,173,468 Deposit interest expense 164 1,954 3,526 6,685 1,689 1,119 775 4,086 287 283 206 4,274 140 Add: Contractual, rate-related processing expense associated with deposits on the Company’s balance sheet 18,358 21,929 25,891 28,024 25,320 24,631 24,241 26,852 23,831 24,346 23,013 23,971 21,897 Adjusted deposit expense 18,522 23,883 29,417 34,709 27,009 25,750 25,016 30,938 24,118 24,629 23,219 28,245 22,037 Adjusted cost of deposits2 1.26% 1.53% 1.78% 1.95% 1.74% 1.65% 1.63% 1.75% 1.61% 1.58% 1.49% 1.63% 1.43% NON-GAAP RECONCILIATION 1 Adjusted net interest margin includes contractual, rate-related processing expense associated with deposits on the Company's balance sheet and excludes the gross interest income on consumer finance loans. 2. Adjusted cost of deposits includes contractual, rate-related card processing expense associated with deposits on the Company’s balance sheet. For the quarter ended ($ in thousands) Jun-23 Sep-23 Dec-23 Mar-24 Jun-24 Sep-24 Dec-24 Mar-25 Jun-25 Sep-25 Dec-25 Mar-26 Jun-26 Average interest earning assets 6,328,718 6,727,076 7,035,624 7,638,907 6,804,507 6,928,365 6,736,877 7,761,138 6,602,267 6,803,398 6,812,693 7,653,765 6,876,094 Net interest income 102,815 114,158 118,927 128,634 122,750 127,514 125,251 136,279 122,313 127,953 119,338 125,124 112,913 Net interest margin 6.52% 6.73% 6.72% 6.77% 7.26% 7.32% 7.38% 7.12% 7.43% 7.46% 6.95% 6.63% 6.59% Average total deposits 5,895,242 6,204,934 6,558,189 7,168,673 6,260,990 6,199,271 6,081,236 7,181,308 6,002,547 6,185,496 6,173,866 7,021,044 6,173,468 Deposit interest expense 164 1,954 3,526 6,685 1,689 1,119 775 4,086 287 283 206 4,274 140 Cost of deposits 0.01% 0.12% 0.21% 0.38% 0.11% 0.07% 0.05% 0.23% 0.02% 0.02% 0.01% 0.25% 0.01% Net Interest Margin and Cost of Deposits Adjusted Net Interest Margin1
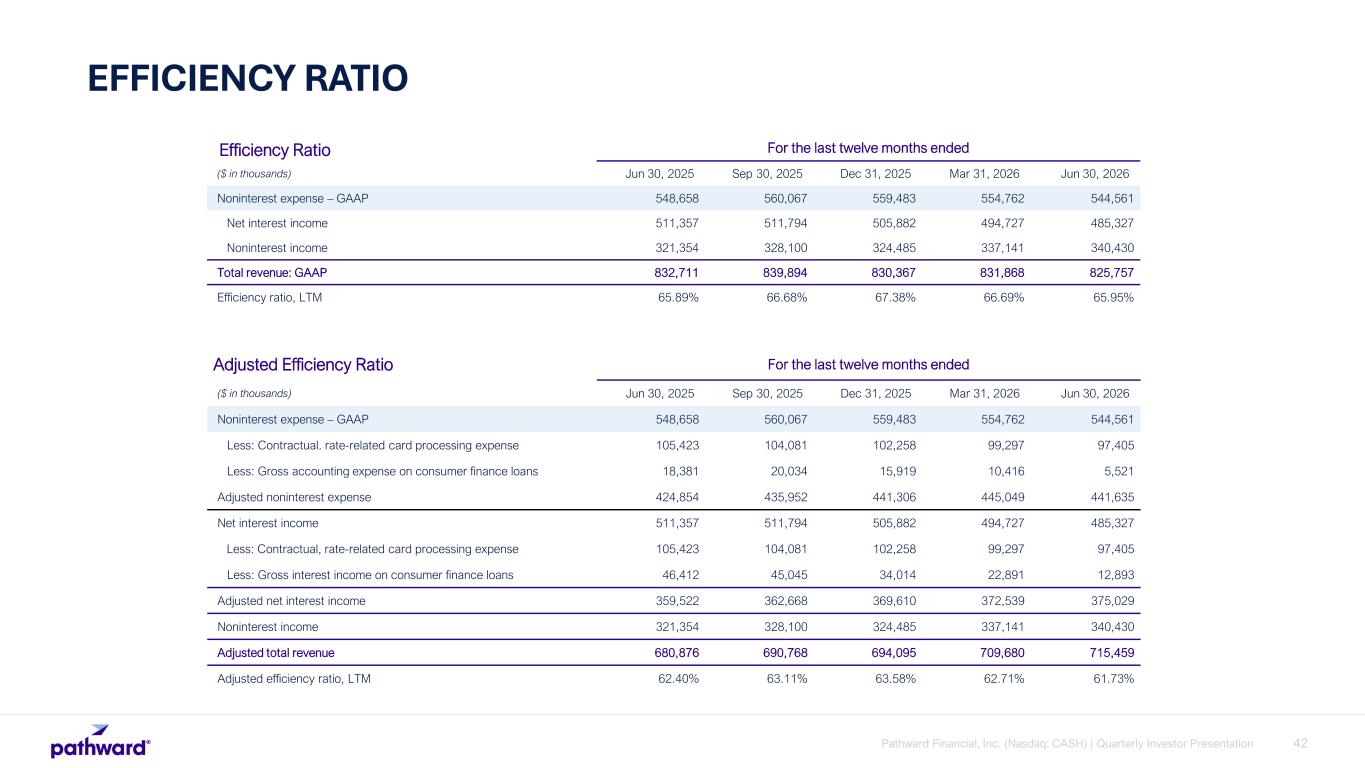
42Pathward Financial, Inc. (Nasdaq: CASH) | Quarterly Investor Presentation EFFICIENCY RATIO For the last twelve months ended ($ in thousands) Jun 30, 2025 Sep 30, 2025 Dec 31, 2025 Mar 31, 2026 Jun 30, 2026 Noninterest expense – GAAP 548,658 560,067 559,483 554,762 544,561 Net interest income 511,357 511,794 505,882 494,727 485,327 Noninterest income 321,354 328,100 324,485 337,141 340,430 Total revenue: GAAP 832,711 839,894 830,367 831,868 825,757 Efficiency ratio, LTM 65.89% 66.68% 67.38% 66.69% 65.95% Efficiency Ratio Adjusted Efficiency Ratio For the last twelve months ended ($ in thousands) Jun 30, 2025 Sep 30, 2025 Dec 31, 2025 Mar 31, 2026 Jun 30, 2026 Noninterest expense – GAAP 548,658 560,067 559,483 554,762 544,561 Less: Contractual. rate-related card processing expense 105,423 104,081 102,258 99,297 97,405 Less: Gross accounting expense on consumer finance loans 18,381 20,034 15,919 10,416 5,521 Adjusted noninterest expense 424,854 435,952 441,306 445,049 441,635 Net interest income 511,357 511,794 505,882 494,727 485,327 Less: Contractual, rate-related card processing expense 105,423 104,081 102,258 99,297 97,405 Less: Gross interest income on consumer finance loans 46,412 45,045 34,014 22,891 12,893 Adjusted net interest income 359,522 362,668 369,610 372,539 375,029 Noninterest income 321,354 328,100 324,485 337,141 340,430 Adjusted total revenue 680,876 690,768 694,095 709,680 715,459 Adjusted efficiency ratio, LTM 62.40% 63.11% 63.58% 62.71% 61.73%
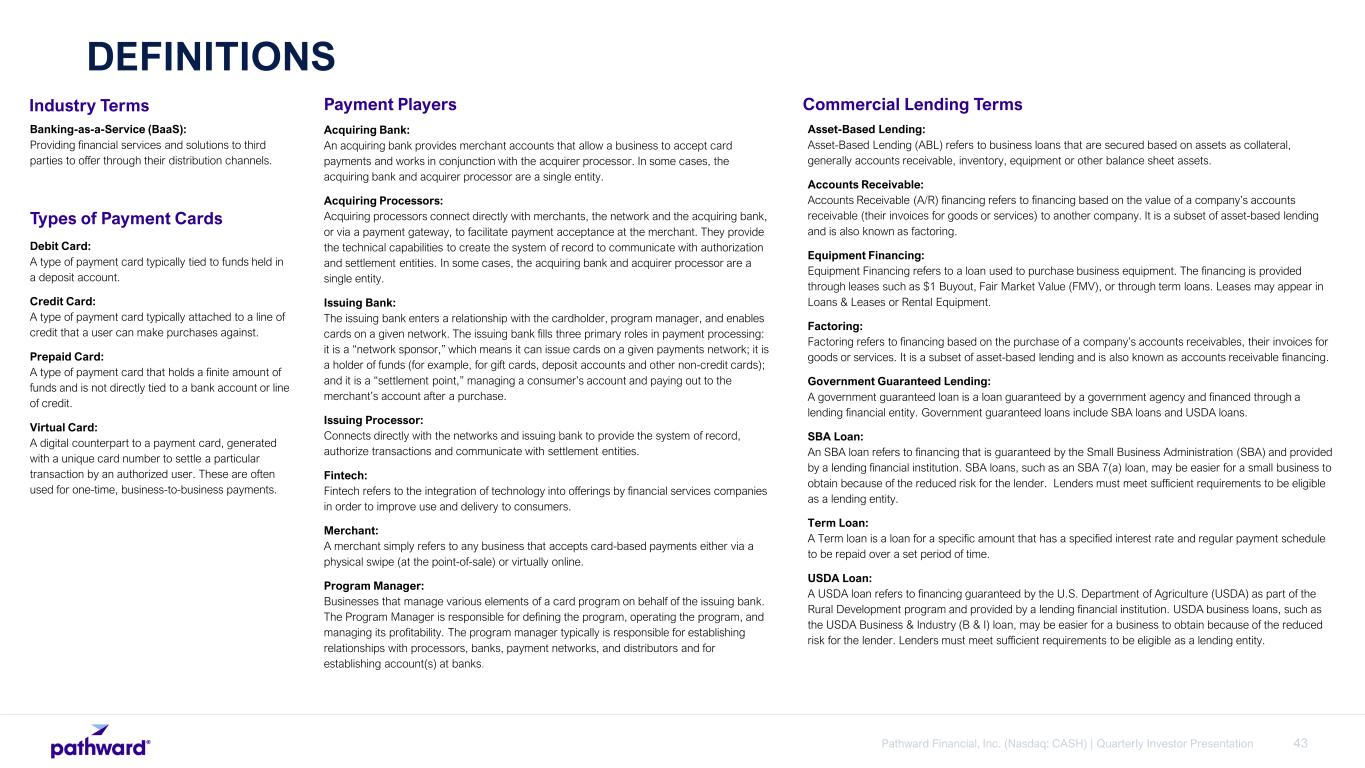
43Pathward Financial, Inc. (Nasdaq: CASH) | Quarterly Investor Presentation Industry Terms Types of Payment Cards Banking-as-a-Service (BaaS): Providing financial services and solutions to third parties to offer through their distribution channels. Debit Card: A type of payment card typically tied to funds held in a deposit account. Credit Card: A type of payment card typically attached to a line of credit that a user can make purchases against. Prepaid Card: A type of payment card that holds a finite amount of funds and is not directly tied to a bank account or line of credit. Virtual Card: A digital counterpart to a payment card, generated with a unique card number to settle a particular transaction by an authorized user. These are often used for one-time, business-to-business payments. Payment Players Acquiring Bank: An acquiring bank provides merchant accounts that allow a business to accept card payments and works in conjunction with the acquirer processor. In some cases, the acquiring bank and acquirer processor are a single entity. Acquiring Processors: Acquiring processors connect directly with merchants, the network and the acquiring bank, or via a payment gateway, to facilitate payment acceptance at the merchant. They provide the technical capabilities to create the system of record to communicate with authorization and settlement entities. In some cases, the acquiring bank and acquirer processor are a single entity. Issuing Bank: The issuing bank enters a relationship with the cardholder, program manager, and enables cards on a given network. The issuing bank fills three primary roles in payment processing: it is a “network sponsor,” which means it can issue cards on a given payments network; it is a holder of funds (for example, for gift cards, deposit accounts and other non-credit cards); and it is a “settlement point,” managing a consumer’s account and paying out to the merchant’s account after a purchase. Issuing Processor: Connects directly with the networks and issuing bank to provide the system of record, authorize transactions and communicate with settlement entities. Fintech: Fintech refers to the integration of technology into offerings by financial services companies in order to improve use and delivery to consumers. Merchant: A merchant simply refers to any business that accepts card-based payments either via a physical swipe (at the point-of-sale) or virtually online. Program Manager: Businesses that manage various elements of a card program on behalf of the issuing bank. The Program Manager is responsible for defining the program, operating the program, and managing its profitability. The program manager typically is responsible for establishing relationships with processors, banks, payment networks, and distributors and for establishing account(s) at banks. DEFINITIONS Commercial Lending Terms Asset-Based Lending: Asset-Based Lending (ABL) refers to business loans that are secured based on assets as collateral, generally accounts receivable, inventory, equipment or other balance sheet assets. Accounts Receivable: Accounts Receivable (A/R) financing refers to financing based on the value of a company’s accounts receivable (their invoices for goods or services) to another company. It is a subset of asset-based lending and is also known as factoring. Equipment Financing: Equipment Financing refers to a loan used to purchase business equipment. The financing is provided through leases such as $1 Buyout, Fair Market Value (FMV), or through term loans. Leases may appear in Loans & Leases or Rental Equipment. Factoring: Factoring refers to financing based on the purchase of a company’s accounts receivables, their invoices for goods or services. It is a subset of asset-based lending and is also known as accounts receivable financing. Government Guaranteed Lending: A government guaranteed loan is a loan guaranteed by a government agency and financed through a lending financial entity. Government guaranteed loans include SBA loans and USDA loans. SBA Loan: An SBA loan refers to financing that is guaranteed by the Small Business Administration (SBA) and provided by a lending financial institution. SBA loans, such as an SBA 7(a) loan, may be easier for a small business to obtain because of the reduced risk for the lender. Lenders must meet sufficient requirements to be eligible as a lending entity. Term Loan: A Term loan is a loan for a specific amount that has a specified interest rate and regular payment schedule to be repaid over a set period of time. USDA Loan: A USDA loan refers to financing guaranteed by the U.S. Department of Agriculture (USDA) as part of the Rural Development program and provided by a lending financial institution. USDA business loans, such as the USDA Business & Industry (B & I) loan, may be easier for a business to obtain because of the reduced risk for the lender. Lenders must meet sufficient requirements to be eligible as a lending entity.