Quarterly Financial Supplement Fiscal third quarter of 2026 results
TABLE OF CONTENTS PAGE Consolidated Statements of Income (Unaudited) 3 Consolidated Selected Key Metrics (Unaudited) 4 Segment Results Private Client Group (Unaudited) 6 Capital Markets (Unaudited) 7 Asset Management (Unaudited) 8 Bank (Unaudited) 9 Other (Unaudited) 10 Bank Segment Selected Key Metrics (Unaudited) 11 Reconciliation of non-GAAP financial measures to GAAP financial measures (Unaudited) 12 Footnotes 18 RAYMOND JAMES FINANCIAL, INC.
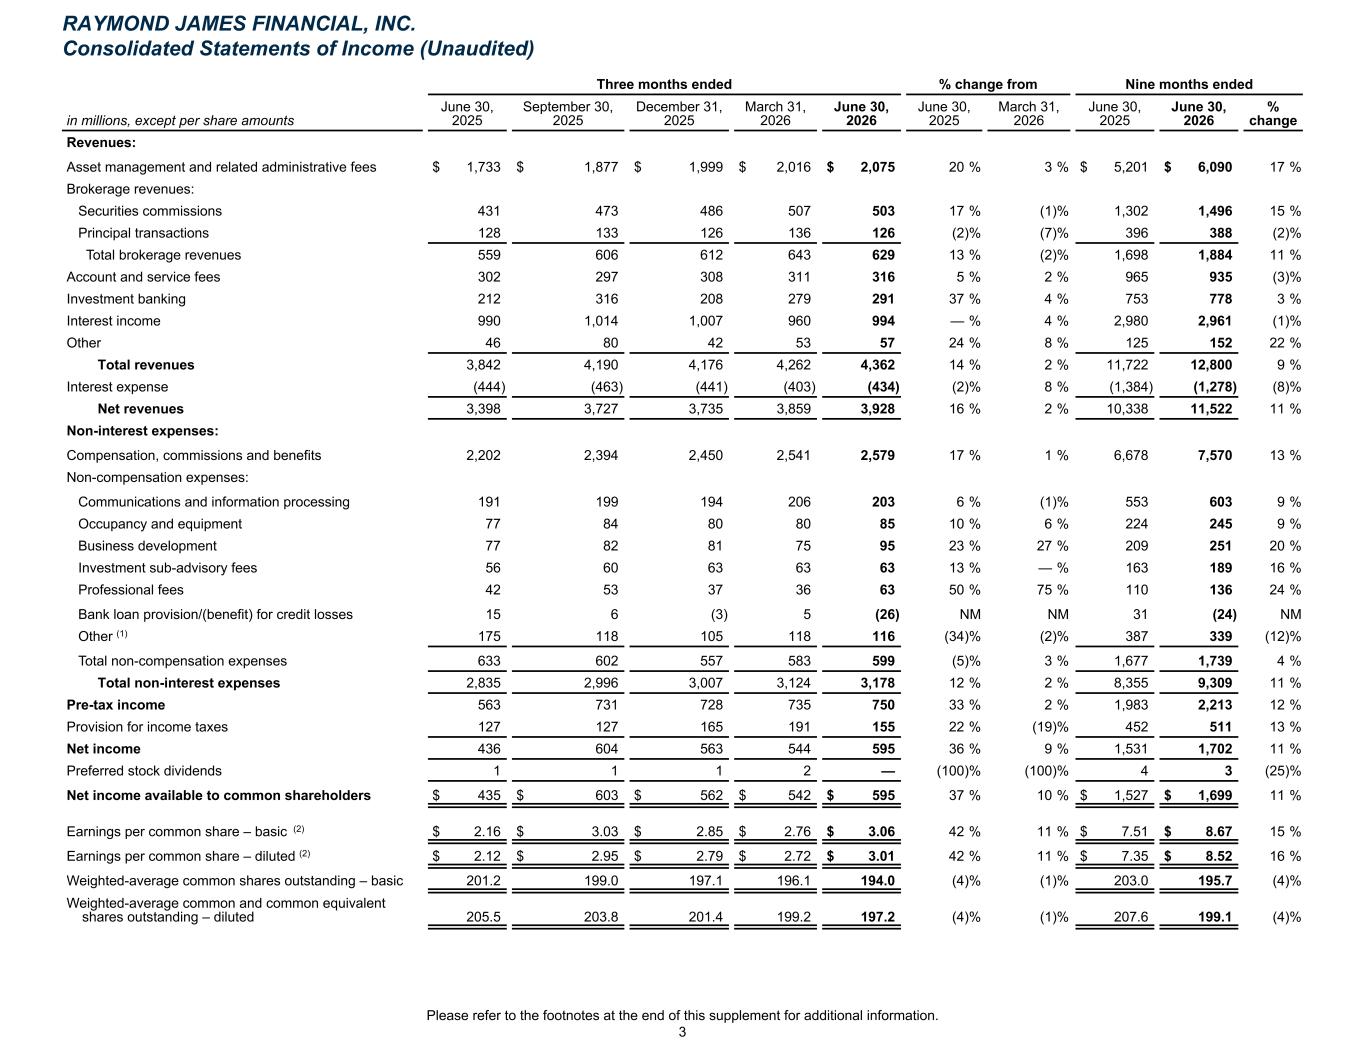
Three months ended % change from Nine months ended in millions, except per share amounts June 30, 2025 September 30, 2025 December 31, 2025 March 31, 2026 June 30, 2026 June 30, 2025 March 31, 2026 June 30, 2025 June 30, 2026 % change Revenues: Asset management and related administrative fees $ 1,733 $ 1,877 $ 1,999 $ 2,016 $ 2,075 20 % 3 % $ 5,201 $ 6,090 17 % Brokerage revenues: Securities commissions 431 473 486 507 503 17 % (1) % 1,302 1,496 15 % Principal transactions 128 133 126 136 126 (2) % (7) % 396 388 (2) % Total brokerage revenues 559 606 612 643 629 13 % (2) % 1,698 1,884 11 % Account and service fees 302 297 308 311 316 5 % 2 % 965 935 (3) % Investment banking 212 316 208 279 291 37 % 4 % 753 778 3 % Interest income 990 1,014 1,007 960 994 — % 4 % 2,980 2,961 (1) % Other 46 80 42 53 57 24 % 8 % 125 152 22 % Total revenues 3,842 4,190 4,176 4,262 4,362 14 % 2 % 11,722 12,800 9 % Interest expense (444) (463) (441) (403) (434) (2) % 8 % (1,384) (1,278) (8) % Net revenues 3,398 3,727 3,735 3,859 3,928 16 % 2 % 10,338 11,522 11 % Non-interest expenses: Compensation, commissions and benefits 2,202 2,394 2,450 2,541 2,579 17 % 1 % 6,678 7,570 13 % Non-compensation expenses: Communications and information processing 191 199 194 206 203 6 % (1) % 553 603 9 % Occupancy and equipment 77 84 80 80 85 10 % 6 % 224 245 9 % Business development 77 82 81 75 95 23 % 27 % 209 251 20 % Investment sub-advisory fees 56 60 63 63 63 13 % — % 163 189 16 % Professional fees 42 53 37 36 63 50 % 75 % 110 136 24 % Bank loan provision/(benefit) for credit losses 15 6 (3) 5 (26) NM NM 31 (24) NM Other (1) 175 118 105 118 116 (34) % (2) % 387 339 (12) % Total non-compensation expenses 633 602 557 583 599 (5) % 3 % 1,677 1,739 4 % Total non-interest expenses 2,835 2,996 3,007 3,124 3,178 12 % 2 % 8,355 9,309 11 % Pre-tax income 563 731 728 735 750 33 % 2 % 1,983 2,213 12 % Provision for income taxes 127 127 165 191 155 22 % (19) % 452 511 13 % Net income 436 604 563 544 595 36 % 9 % 1,531 1,702 11 % Preferred stock dividends 1 1 1 2 — (100) % (100) % 4 3 (25) % Net income available to common shareholders $ 435 $ 603 $ 562 $ 542 $ 595 37 % 10 % $ 1,527 $ 1,699 11 % Earnings per common share – basic (2) $ 2.16 $ 3.03 $ 2.85 $ 2.76 $ 3.06 42 % 11 % $ 7.51 $ 8.67 15 % Earnings per common share – diluted (2) $ 2.12 $ 2.95 $ 2.79 $ 2.72 $ 3.01 42 % 11 % $ 7.35 $ 8.52 16 % Weighted-average common shares outstanding – basic 201.2 199.0 197.1 196.1 194.0 (4) % (1) % 203.0 195.7 (4) % Weighted-average common and common equivalent shares outstanding – diluted 205.5 203.8 201.4 199.2 197.2 (4) % (1) % 207.6 199.1 (4) % RAYMOND JAMES FINANCIAL, INC. Consolidated Statements of Income (Unaudited) Please refer to the footnotes at the end of this supplement for additional information. 3
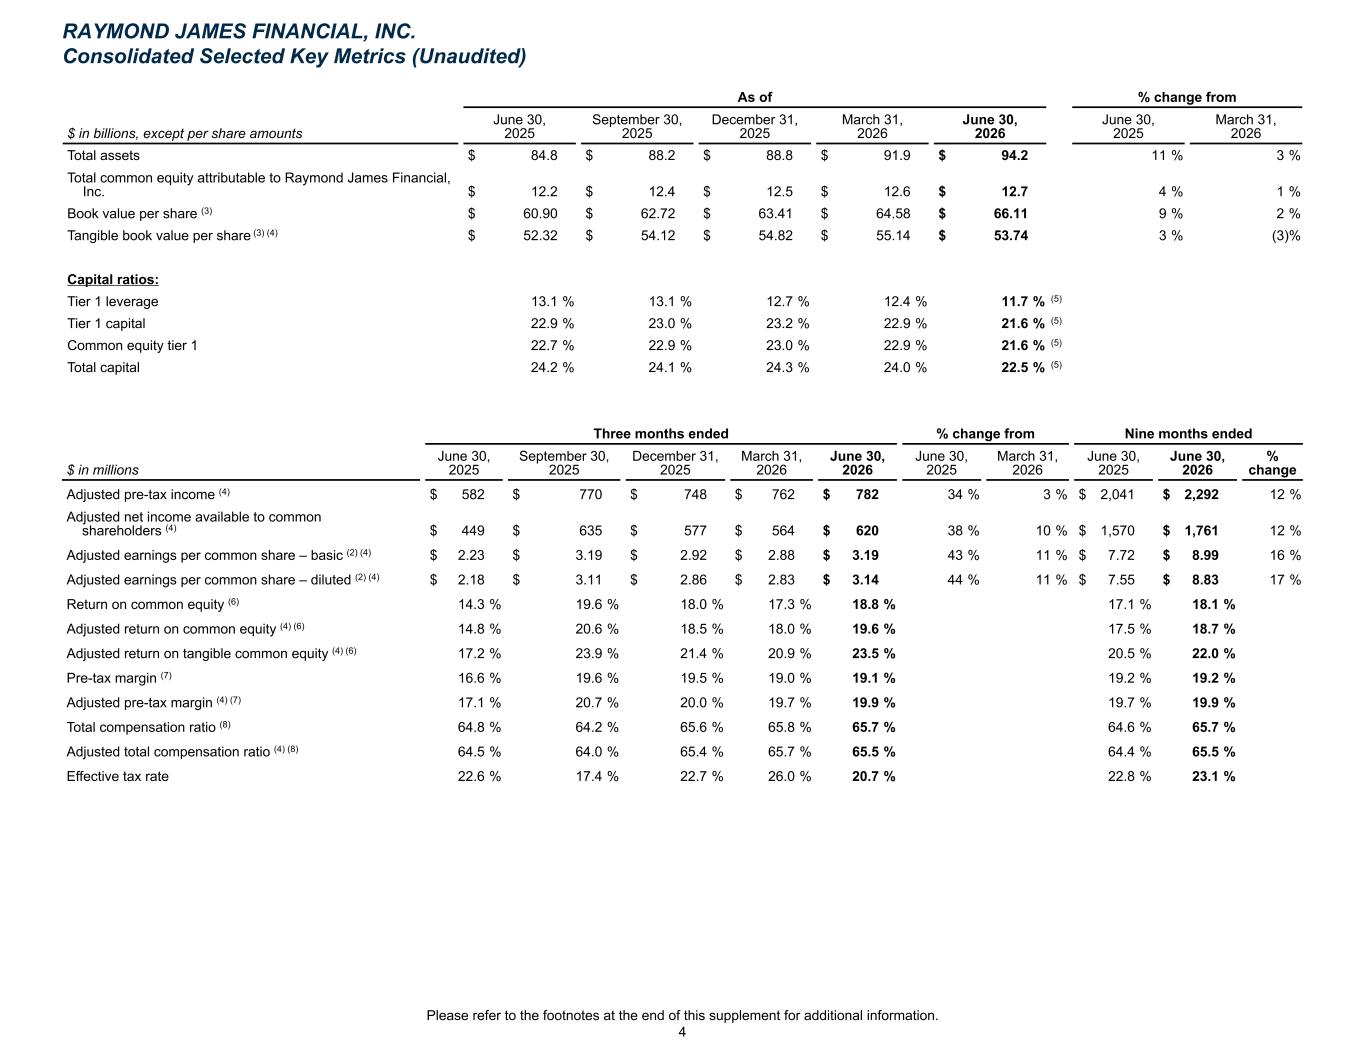
As of % change from $ in billions, except per share amounts June 30, 2025 September 30, 2025 December 31, 2025 March 31, 2026 June 30, 2026 June 30, 2025 March 31, 2026 Total assets $ 84.8 $ 88.2 $ 88.8 $ 91.9 $ 94.2 11 % 3 % Total common equity attributable to Raymond James Financial, Inc. $ 12.2 $ 12.4 $ 12.5 $ 12.6 $ 12.7 4 % 1 % Book value per share (3) $ 60.90 $ 62.72 $ 63.41 $ 64.58 $ 66.11 9 % 2 % Tangible book value per share (3) (4) $ 52.32 $ 54.12 $ 54.82 $ 55.14 $ 53.74 3 % (3) % Capital ratios: Tier 1 leverage 13.1 % 13.1 % 12.7 % 12.4 % 11.7 % (5) Tier 1 capital 22.9 % 23.0 % 23.2 % 22.9 % 21.6 % (5) Common equity tier 1 22.7 % 22.9 % 23.0 % 22.9 % 21.6 % (5) Total capital 24.2 % 24.1 % 24.3 % 24.0 % 22.5 % (5) $ in millions June 30, 2025 September 30, 2025 December 31, 2025 March 31, 2026 June 30, 2026 June 30, 2025 March 31, 2026 June 30, 2025 June 30, 2026 % change Adjusted pre-tax income (4) $ 582 $ 770 $ 748 $ 762 $ 782 34 % 3 % $ 2,041 $ 2,292 12 % Adjusted net income available to common shareholders (4) $ 449 $ 635 $ 577 $ 564 $ 620 38 % 10 % $ 1,570 $ 1,761 12 % Adjusted earnings per common share – basic (2) (4) $ 2.23 $ 3.19 $ 2.92 $ 2.88 $ 3.19 43 % 11 % $ 7.72 $ 8.99 16 % Adjusted earnings per common share – diluted (2) (4) $ 2.18 $ 3.11 $ 2.86 $ 2.83 $ 3.14 44 % 11 % $ 7.55 $ 8.83 17 % Return on common equity (6) 14.3 % 19.6 % 18.0 % 17.3 % 18.8 % 17.1 % 18.1 % Adjusted return on common equity (4) (6) 14.8 % 20.6 % 18.5 % 18.0 % 19.6 % 17.5 % 18.7 % Adjusted return on tangible common equity (4) (6) 17.2 % 23.9 % 21.4 % 20.9 % 23.5 % 20.5 % 22.0 % Pre-tax margin (7) 16.6 % 19.6 % 19.5 % 19.0 % 19.1 % 19.2 % 19.2 % Adjusted pre-tax margin (4) (7) 17.1 % 20.7 % 20.0 % 19.7 % 19.9 % 19.7 % 19.9 % Total compensation ratio (8) 64.8 % 64.2 % 65.6 % 65.8 % 65.7 % 64.6 % 65.7 % Adjusted total compensation ratio (4) (8) 64.5 % 64.0 % 65.4 % 65.7 % 65.5 % 64.4 % 65.5 % Effective tax rate 22.6 % 17.4 % 22.7 % 26.0 % 20.7 % 22.8 % 23.1 % Three months ended % change from Nine months ended RAYMOND JAMES FINANCIAL, INC. Consolidated Selected Key Metrics (Unaudited) Please refer to the footnotes at the end of this supplement for additional information. 4
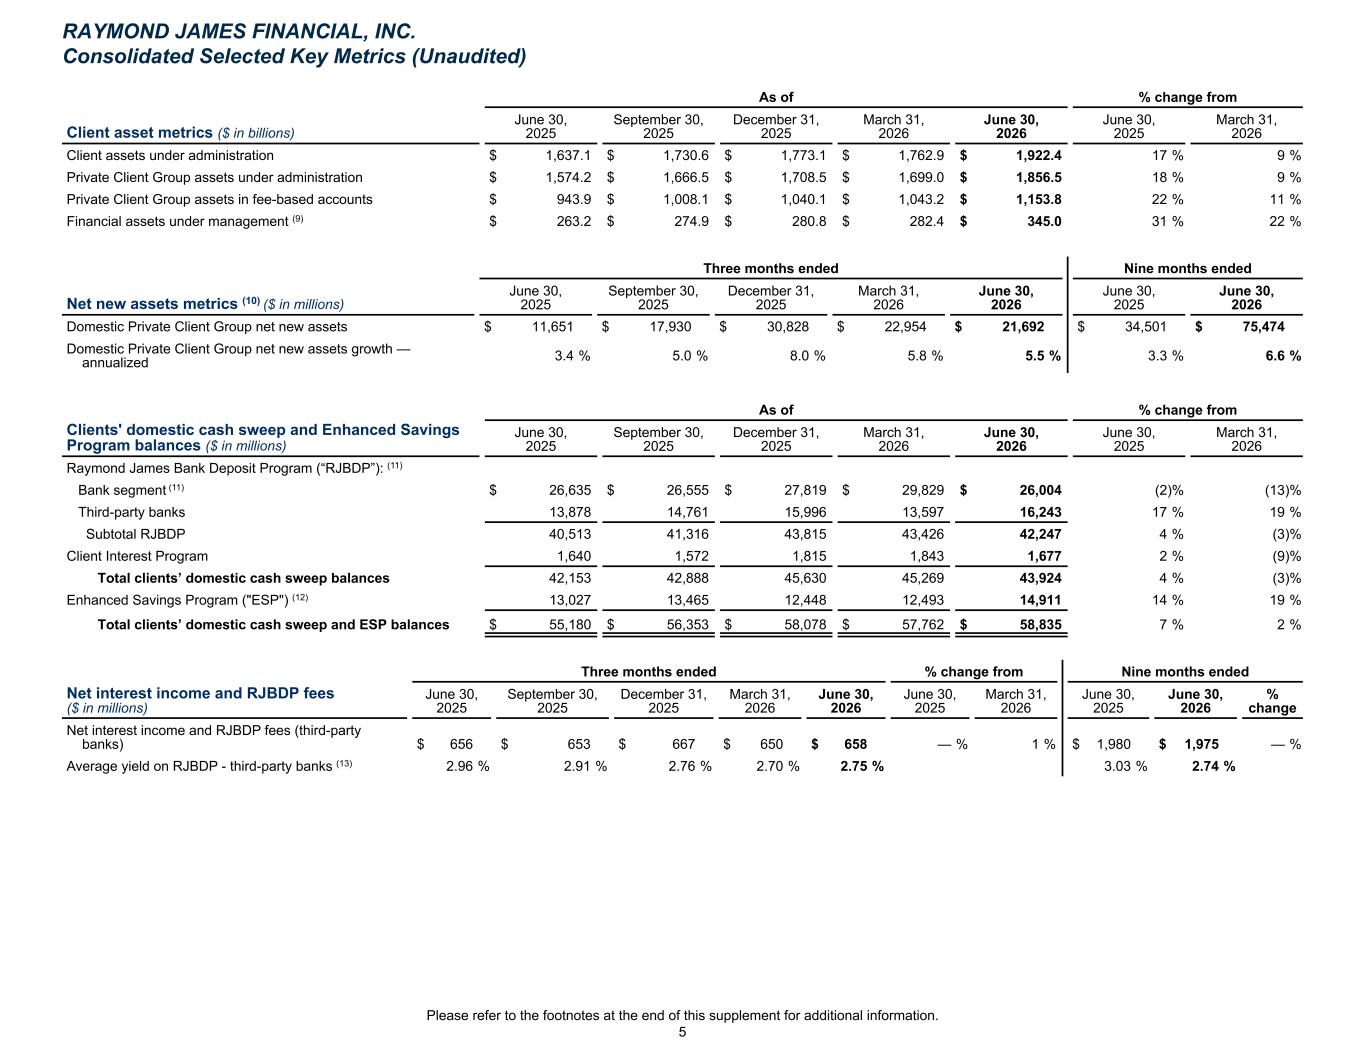
As of % change from Client asset metrics ($ in billions) June 30, 2025 September 30, 2025 December 31, 2025 March 31, 2026 June 30, 2026 June 30, 2025 March 31, 2026 Client assets under administration $ 1,637.1 $ 1,730.6 $ 1,773.1 $ 1,762.9 $ 1,922.4 17 % 9 % Private Client Group assets under administration $ 1,574.2 $ 1,666.5 $ 1,708.5 $ 1,699.0 $ 1,856.5 18 % 9 % Private Client Group assets in fee-based accounts $ 943.9 $ 1,008.1 $ 1,040.1 $ 1,043.2 $ 1,153.8 22 % 11 % Financial assets under management (9) $ 263.2 $ 274.9 $ 280.8 $ 282.4 $ 345.0 31 % 22 % Three months ended Nine months ended Net new assets metrics (10) ($ in millions) June 30, 2025 September 30, 2025 December 31, 2025 March 31, 2026 June 30, 2026 June 30, 2025 June 30, 2026 Domestic Private Client Group net new assets $ 11,651 $ 17,930 $ 30,828 $ 22,954 $ 21,692 $ 34,501 $ 75,474 Domestic Private Client Group net new assets growth — annualized 3.4 % 5.0 % 8.0 % 5.8 % 5.5 % 3.3 % 6.6 % As of % change from Clients' domestic cash sweep and Enhanced Savings Program balances ($ in millions) June 30, 2025 September 30, 2025 December 31, 2025 March 31, 2026 June 30, 2026 June 30, 2025 March 31, 2026 Raymond James Bank Deposit Program (“RJBDP”): (11) Bank segment (11) $ 26,635 $ 26,555 $ 27,819 $ 29,829 $ 26,004 (2) % (13) % Third-party banks 13,878 14,761 15,996 13,597 16,243 17 % 19 % Subtotal RJBDP 40,513 41,316 43,815 43,426 42,247 4 % (3) % Client Interest Program 1,640 1,572 1,815 1,843 1,677 2 % (9) % Total clients’ domestic cash sweep balances 42,153 42,888 45,630 45,269 43,924 4 % (3) % Enhanced Savings Program ("ESP") (12) 13,027 13,465 12,448 12,493 14,911 14 % 19 % Total clients’ domestic cash sweep and ESP balances $ 55,180 $ 56,353 $ 58,078 $ 57,762 $ 58,835 7 % 2 % Three months ended % change from Nine months ended Net interest income and RJBDP fees ($ in millions) June 30, 2025 September 30, 2025 December 31, 2025 March 31, 2026 June 30, 2026 June 30, 2025 March 31, 2026 June 30, 2025 June 30, 2026 % change Net interest income and RJBDP fees (third-party banks) $ 656 $ 653 $ 667 $ 650 $ 658 — % 1 % $ 1,980 $ 1,975 — % Average yield on RJBDP - third-party banks (13) 2.96 % 2.91 % 2.76 % 2.70 % 2.75 % 3.03 % 2.74 % RAYMOND JAMES FINANCIAL, INC. Consolidated Selected Key Metrics (Unaudited) Please refer to the footnotes at the end of this supplement for additional information. 5
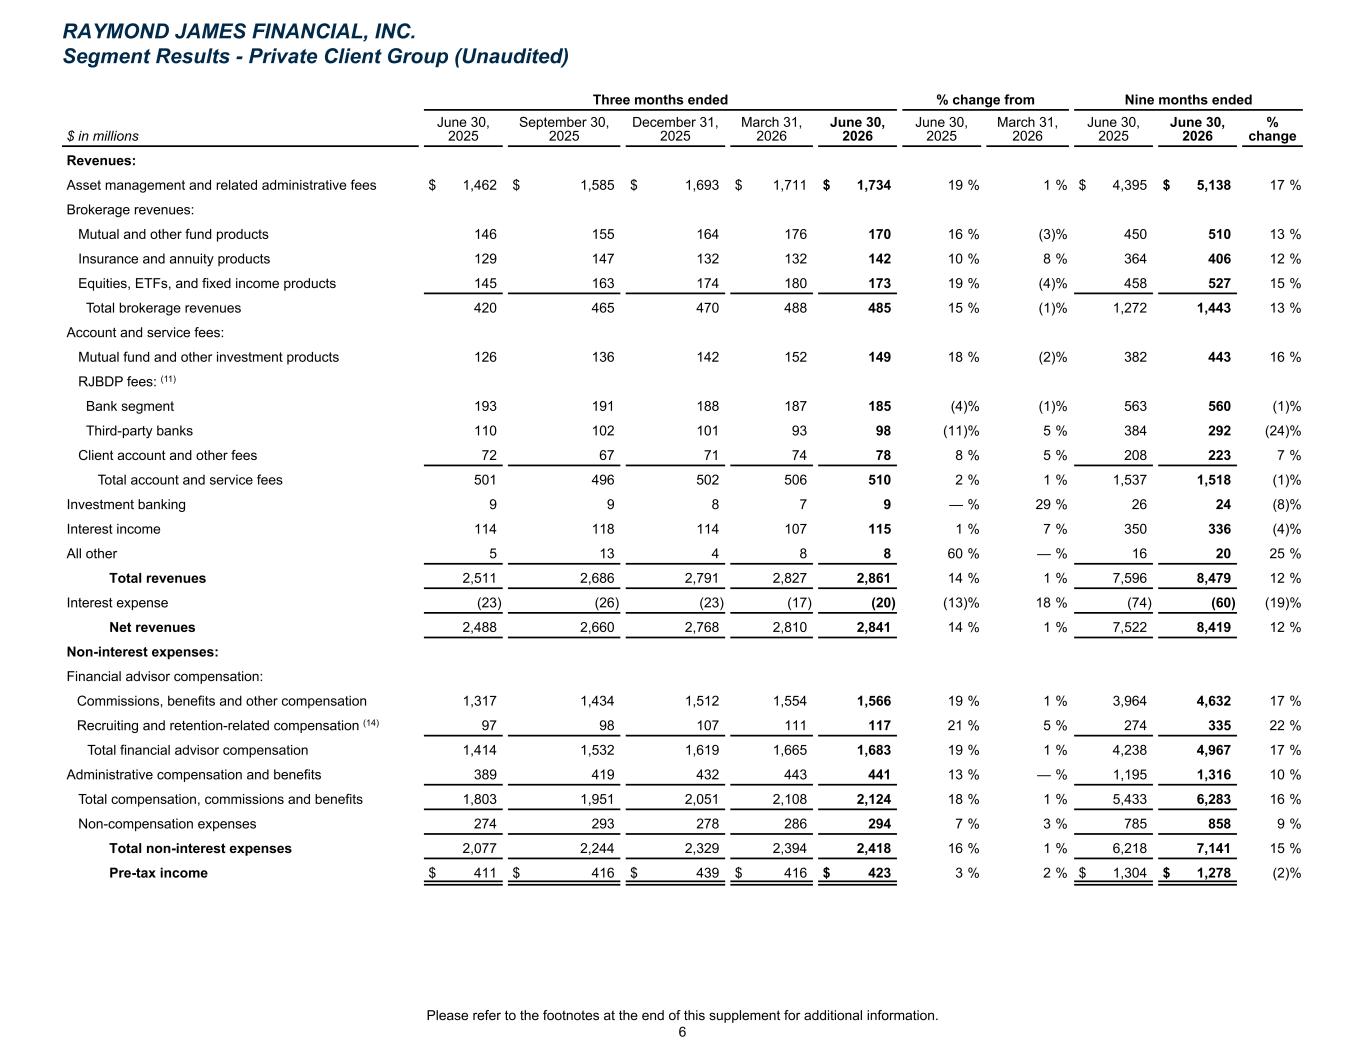
Three months ended % change from Nine months ended $ in millions June 30, 2025 September 30, 2025 December 31, 2025 March 31, 2026 June 30, 2026 June 30, 2025 March 31, 2026 June 30, 2025 June 30, 2026 % change Revenues: Asset management and related administrative fees $ 1,462 $ 1,585 $ 1,693 $ 1,711 $ 1,734 19 % 1 % $ 4,395 $ 5,138 17 % Brokerage revenues: Mutual and other fund products 146 155 164 176 170 16 % (3) % 450 510 13 % Insurance and annuity products 129 147 132 132 142 10 % 8 % 364 406 12 % Equities, ETFs, and fixed income products 145 163 174 180 173 19 % (4) % 458 527 15 % Total brokerage revenues 420 465 470 488 485 15 % (1) % 1,272 1,443 13 % Account and service fees: Mutual fund and other investment products 126 136 142 152 149 18 % (2) % 382 443 16 % RJBDP fees: (11) Bank segment 193 191 188 187 185 (4) % (1) % 563 560 (1) % Third-party banks 110 102 101 93 98 (11) % 5 % 384 292 (24) % Client account and other fees 72 67 71 74 78 8 % 5 % 208 223 7 % Total account and service fees 501 496 502 506 510 2 % 1 % 1,537 1,518 (1) % Investment banking 9 9 8 7 9 — % 29 % 26 24 (8) % Interest income 114 118 114 107 115 1 % 7 % 350 336 (4) % All other 5 13 4 8 8 60 % — % 16 20 25 % Total revenues 2,511 2,686 2,791 2,827 2,861 14 % 1 % 7,596 8,479 12 % Interest expense (23) (26) (23) (17) (20) (13) % 18 % (74) (60) (19) % Net revenues 2,488 2,660 2,768 2,810 2,841 14 % 1 % 7,522 8,419 12 % Non-interest expenses: Financial advisor compensation: Commissions, benefits and other compensation 1,317 1,434 1,512 1,554 1,566 19 % 1 % 3,964 4,632 17 % Recruiting and retention-related compensation (14) 97 98 107 111 117 21 % 5 % 274 335 22 % Total financial advisor compensation 1,414 1,532 1,619 1,665 1,683 19 % 1 % 4,238 4,967 17 % Administrative compensation and benefits 389 419 432 443 441 13 % — % 1,195 1,316 10 % Total compensation, commissions and benefits 1,803 1,951 2,051 2,108 2,124 18 % 1 % 5,433 6,283 16 % Non-compensation expenses 274 293 278 286 294 7 % 3 % 785 858 9 % Total non-interest expenses 2,077 2,244 2,329 2,394 2,418 16 % 1 % 6,218 7,141 15 % Pre-tax income $ 411 $ 416 $ 439 $ 416 $ 423 3 % 2 % $ 1,304 $ 1,278 (2) % RAYMOND JAMES FINANCIAL, INC. Segment Results - Private Client Group (Unaudited) Please refer to the footnotes at the end of this supplement for additional information. 6
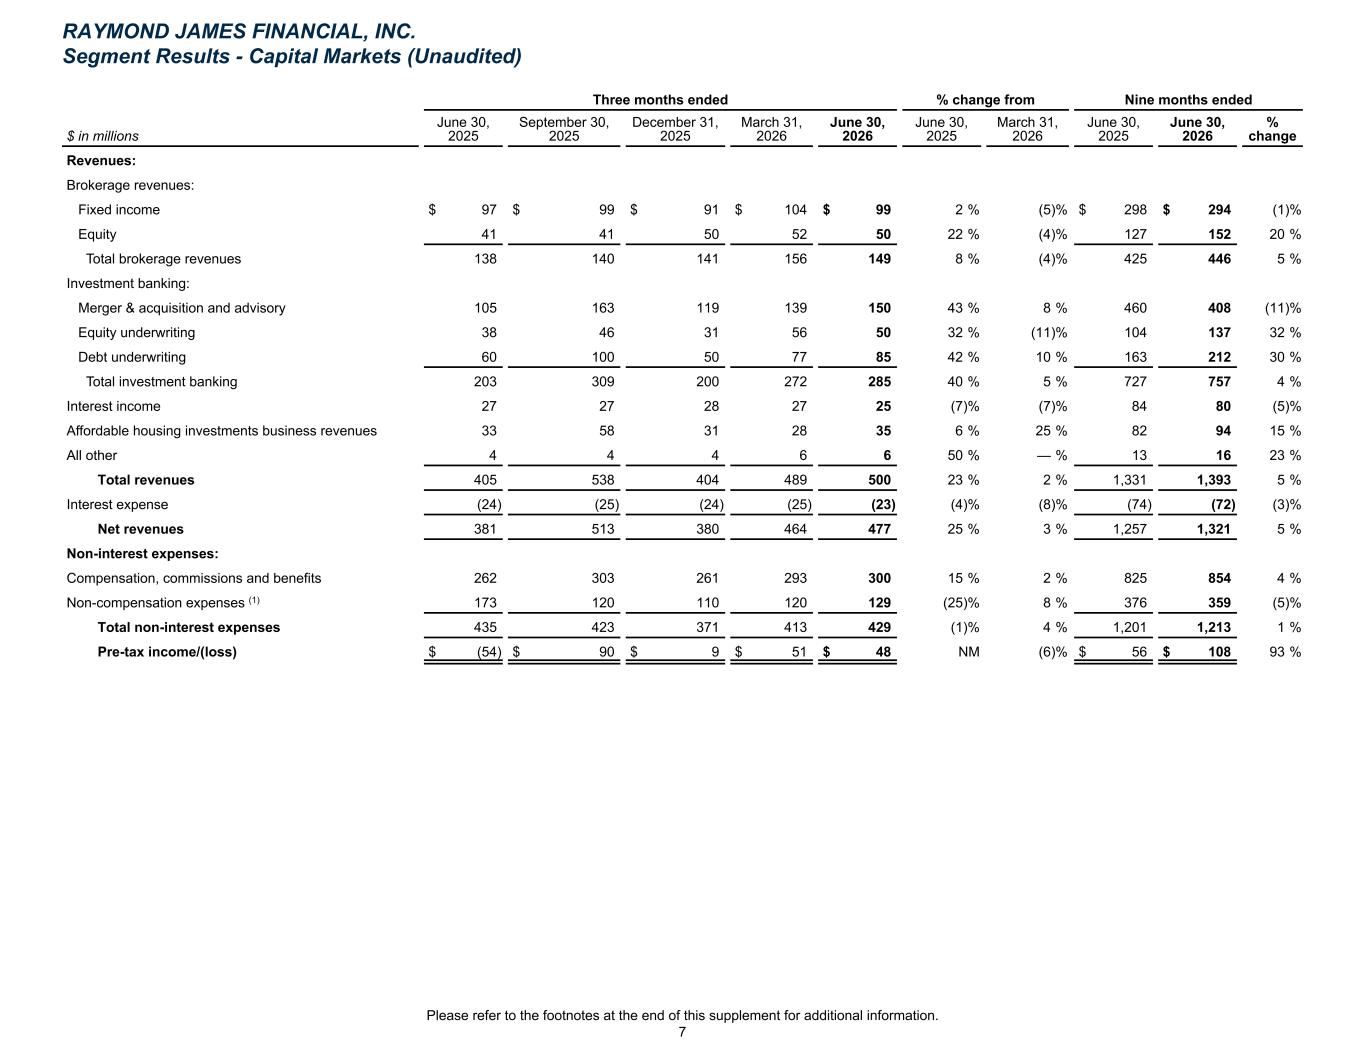
Three months ended % change from Nine months ended $ in millions June 30, 2025 September 30, 2025 December 31, 2025 March 31, 2026 June 30, 2026 June 30, 2025 March 31, 2026 June 30, 2025 June 30, 2026 % change Revenues: Brokerage revenues: Fixed income $ 97 $ 99 $ 91 $ 104 $ 99 2 % (5) % $ 298 $ 294 (1) % Equity 41 41 50 52 50 22 % (4) % 127 152 20 % Total brokerage revenues 138 140 141 156 149 8 % (4) % 425 446 5 % Investment banking: Merger & acquisition and advisory 105 163 119 139 150 43 % 8 % 460 408 (11) % Equity underwriting 38 46 31 56 50 32 % (11) % 104 137 32 % Debt underwriting 60 100 50 77 85 42 % 10 % 163 212 30 % Total investment banking 203 309 200 272 285 40 % 5 % 727 757 4 % Interest income 27 27 28 27 25 (7) % (7) % 84 80 (5) % Affordable housing investments business revenues 33 58 31 28 35 6 % 25 % 82 94 15 % All other 4 4 4 6 6 50 % — % 13 16 23 % Total revenues 405 538 404 489 500 23 % 2 % 1,331 1,393 5 % Interest expense (24) (25) (24) (25) (23) (4) % (8) % (74) (72) (3) % Net revenues 381 513 380 464 477 25 % 3 % 1,257 1,321 5 % Non-interest expenses: Compensation, commissions and benefits 262 303 261 293 300 15 % 2 % 825 854 4 % Non-compensation expenses (1) 173 120 110 120 129 (25) % 8 % 376 359 (5) % Total non-interest expenses 435 423 371 413 429 (1) % 4 % 1,201 1,213 1 % Pre-tax income/(loss) $ (54) $ 90 $ 9 $ 51 $ 48 NM (6) % $ 56 $ 108 93 % RAYMOND JAMES FINANCIAL, INC. Segment Results - Capital Markets (Unaudited) Please refer to the footnotes at the end of this supplement for additional information. 7
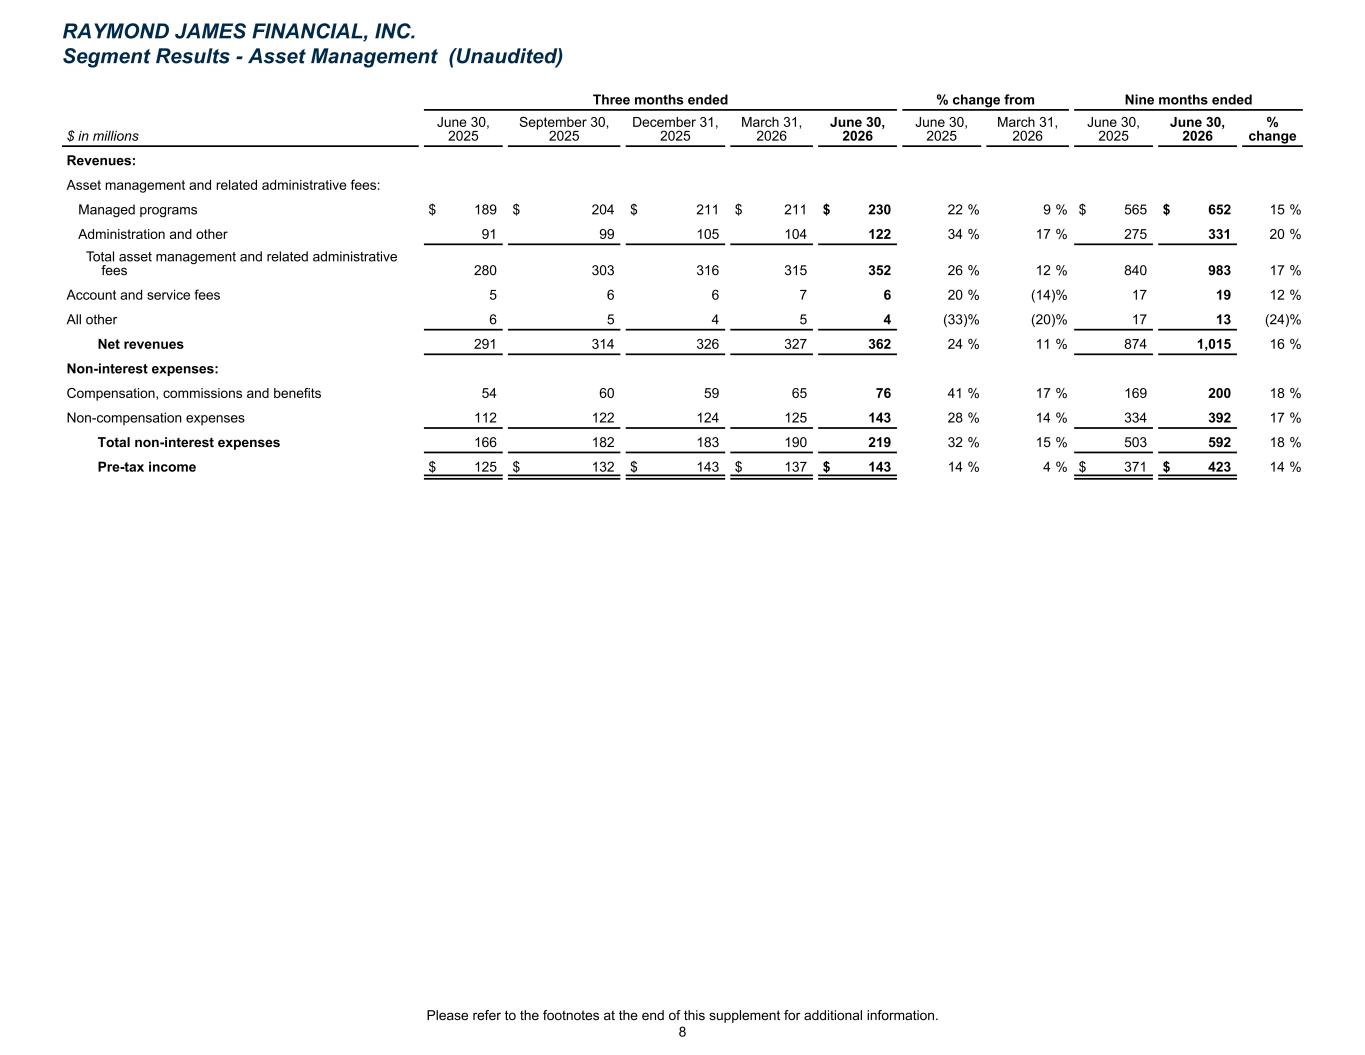
Three months ended % change from Nine months ended $ in millions June 30, 2025 September 30, 2025 December 31, 2025 March 31, 2026 June 30, 2026 June 30, 2025 March 31, 2026 June 30, 2025 June 30, 2026 % change Revenues: Asset management and related administrative fees: Managed programs $ 189 $ 204 $ 211 $ 211 $ 230 22 % 9 % $ 565 $ 652 15 % Administration and other 91 99 105 104 122 34 % 17 % 275 331 20 % Total asset management and related administrative fees 280 303 316 315 352 26 % 12 % 840 983 17 % Account and service fees 5 6 6 7 6 20 % (14) % 17 19 12 % All other 6 5 4 5 4 (33) % (20) % 17 13 (24) % Net revenues 291 314 326 327 362 24 % 11 % 874 1,015 16 % Non-interest expenses: Compensation, commissions and benefits 54 60 59 65 76 41 % 17 % 169 200 18 % Non-compensation expenses 112 122 124 125 143 28 % 14 % 334 392 17 % Total non-interest expenses 166 182 183 190 219 32 % 15 % 503 592 18 % Pre-tax income $ 125 $ 132 $ 143 $ 137 $ 143 14 % 4 % $ 371 $ 423 14 % RAYMOND JAMES FINANCIAL, INC. Segment Results - Asset Management (Unaudited) Please refer to the footnotes at the end of this supplement for additional information. 8
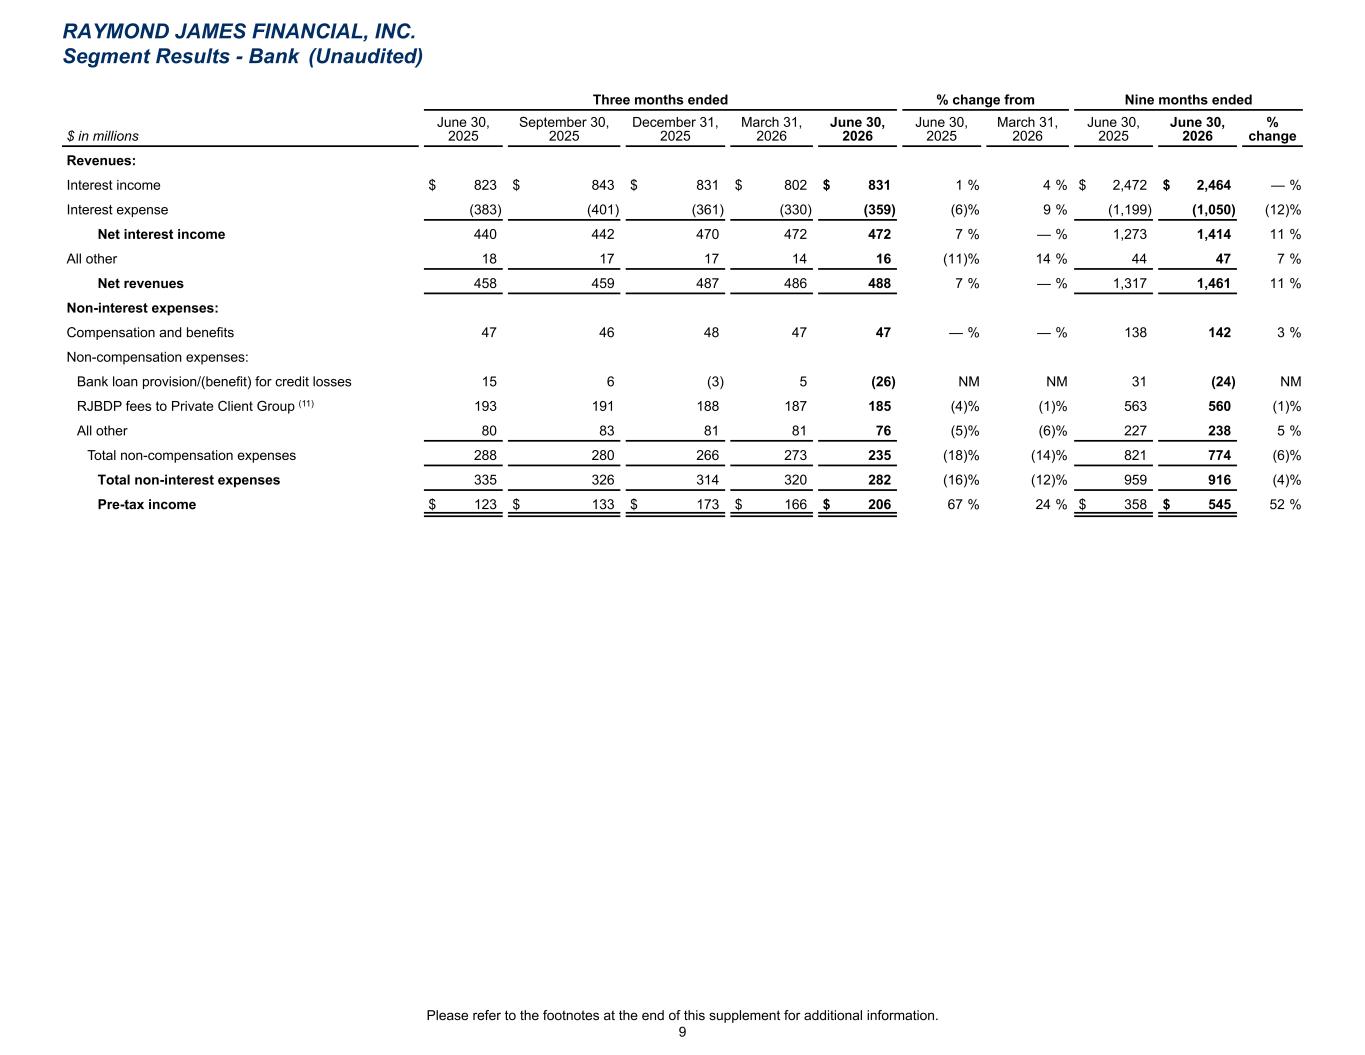
Three months ended % change from Nine months ended $ in millions June 30, 2025 September 30, 2025 December 31, 2025 March 31, 2026 June 30, 2026 June 30, 2025 March 31, 2026 June 30, 2025 June 30, 2026 % change Revenues: Interest income $ 823 $ 843 $ 831 $ 802 $ 831 1 % 4 % $ 2,472 $ 2,464 — % Interest expense (383) (401) (361) (330) (359) (6) % 9 % (1,199) (1,050) (12) % Net interest income 440 442 470 472 472 7 % — % 1,273 1,414 11 % All other 18 17 17 14 16 (11) % 14 % 44 47 7 % Net revenues 458 459 487 486 488 7 % — % 1,317 1,461 11 % Non-interest expenses: Compensation and benefits 47 46 48 47 47 — % — % 138 142 3 % Non-compensation expenses: Bank loan provision/(benefit) for credit losses 15 6 (3) 5 (26) NM NM 31 (24) NM RJBDP fees to Private Client Group (11) 193 191 188 187 185 (4) % (1) % 563 560 (1) % All other 80 83 81 81 76 (5) % (6) % 227 238 5 % Total non-compensation expenses 288 280 266 273 235 (18) % (14) % 821 774 (6) % Total non-interest expenses 335 326 314 320 282 (16) % (12) % 959 916 (4) % Pre-tax income $ 123 $ 133 $ 173 $ 166 $ 206 67 % 24 % $ 358 $ 545 52 % RAYMOND JAMES FINANCIAL, INC. Segment Results - Bank (Unaudited) Please refer to the footnotes at the end of this supplement for additional information. 9
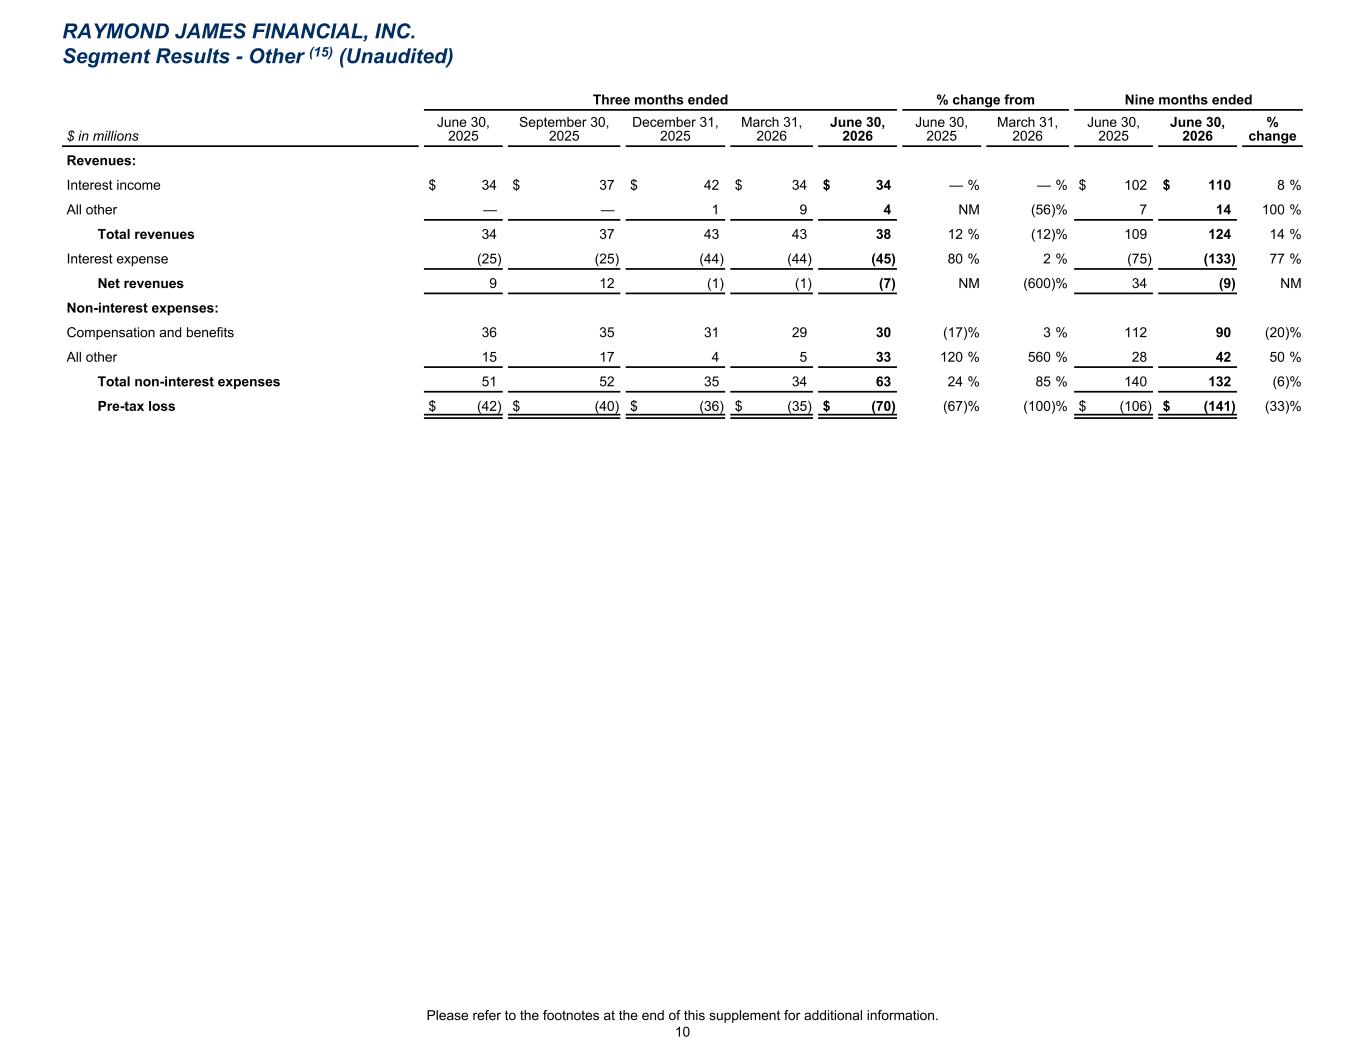
Three months ended % change from Nine months ended $ in millions June 30, 2025 September 30, 2025 December 31, 2025 March 31, 2026 June 30, 2026 June 30, 2025 March 31, 2026 June 30, 2025 June 30, 2026 % change Revenues: Interest income $ 34 $ 37 $ 42 $ 34 $ 34 — % — % $ 102 $ 110 8 % All other — — 1 9 4 NM (56) % 7 14 100 % Total revenues 34 37 43 43 38 12 % (12) % 109 124 14 % Interest expense (25) (25) (44) (44) (45) 80 % 2 % (75) (133) 77 % Net revenues 9 12 (1) (1) (7) NM (600) % 34 (9) NM Non-interest expenses: Compensation and benefits 36 35 31 29 30 (17) % 3 % 112 90 (20) % All other 15 17 4 5 33 120 % 560 % 28 42 50 % Total non-interest expenses 51 52 35 34 63 24 % 85 % 140 132 (6) % Pre-tax loss $ (42) $ (40) $ (36) $ (35) $ (70) (67) % (100) % $ (106) $ (141) (33) % RAYMOND JAMES FINANCIAL, INC. Segment Results - Other (15) (Unaudited) Please refer to the footnotes at the end of this supplement for additional information. 10
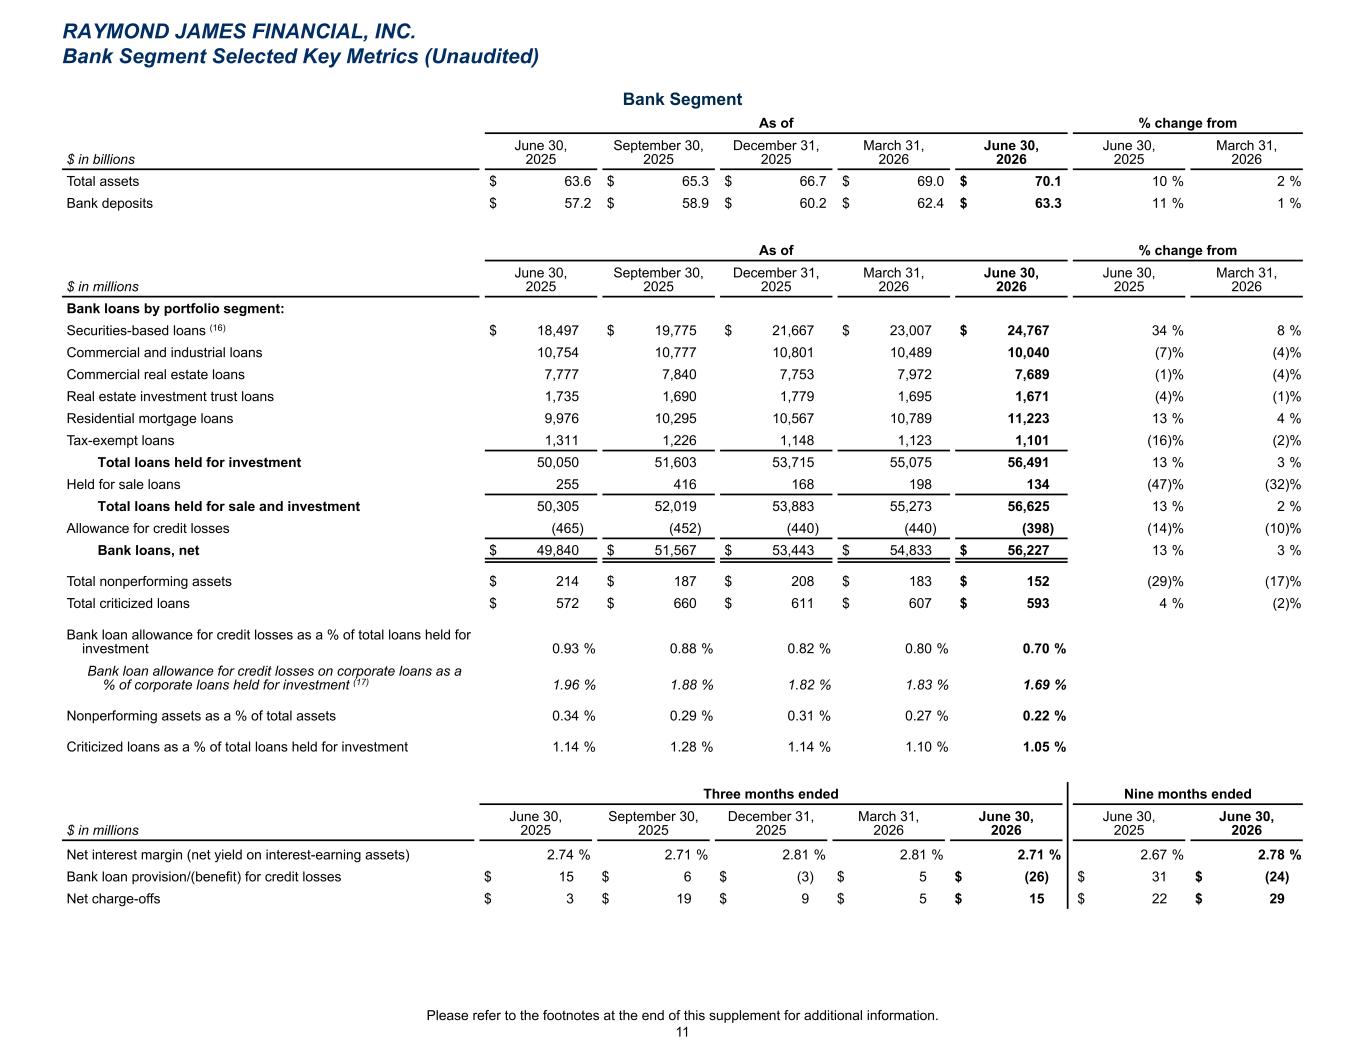
Bank Segment As of % change from $ in billions June 30, 2025 September 30, 2025 December 31, 2025 March 31, 2026 June 30, 2026 June 30, 2025 March 31, 2026 Total assets $ 63.6 $ 65.3 $ 66.7 $ 69.0 $ 70.1 10 % 2 % Bank deposits $ 57.2 $ 58.9 $ 60.2 $ 62.4 $ 63.3 11 % 1 % As of % change from $ in millions June 30, 2025 September 30, 2025 December 31, 2025 March 31, 2026 June 30, 2026 June 30, 2025 March 31, 2026 Bank loans by portfolio segment: Securities-based loans (16) $ 18,497 $ 19,775 $ 21,667 $ 23,007 $ 24,767 34 % 8 % Commercial and industrial loans 10,754 10,777 10,801 10,489 10,040 (7) % (4) % Commercial real estate loans 7,777 7,840 7,753 7,972 7,689 (1) % (4) % Real estate investment trust loans 1,735 1,690 1,779 1,695 1,671 (4) % (1) % Residential mortgage loans 9,976 10,295 10,567 10,789 11,223 13 % 4 % Tax-exempt loans 1,311 1,226 1,148 1,123 1,101 (16) % (2) % Total loans held for investment 50,050 51,603 53,715 55,075 56,491 13 % 3 % Held for sale loans 255 416 168 198 134 (47) % (32) % Total loans held for sale and investment 50,305 52,019 53,883 55,273 56,625 13 % 2 % Allowance for credit losses (465) (452) (440) (440) (398) (14) % (10) % Bank loans, net $ 49,840 $ 51,567 $ 53,443 $ 54,833 $ 56,227 13 % 3 % Total nonperforming assets $ 214 $ 187 $ 208 $ 183 $ 152 (29) % (17) % Total criticized loans $ 572 $ 660 $ 611 $ 607 $ 593 4 % (2) % Bank loan allowance for credit losses as a % of total loans held for investment 0.93 % 0.88 % 0.82 % 0.80 % 0.70 % Bank loan allowance for credit losses on corporate loans as a % of corporate loans held for investment (17) 1.96 % 1.88 % 1.82 % 1.83 % 1.69 % Nonperforming assets as a % of total assets 0.34 % 0.29 % 0.31 % 0.27 % 0.22 % Criticized loans as a % of total loans held for investment 1.14 % 1.28 % 1.14 % 1.10 % 1.05 % Three months ended Nine months ended $ in millions June 30, 2025 September 30, 2025 December 31, 2025 March 31, 2026 June 30, 2026 June 30, 2025 June 30, 2026 Net interest margin (net yield on interest-earning assets) 2.74 % 2.71 % 2.81 % 2.81 % 2.71 % 2.67 % 2.78 % Bank loan provision/(benefit) for credit losses $ 15 $ 6 $ (3) $ 5 $ (26) $ 31 $ (24) Net charge-offs $ 3 $ 19 $ 9 $ 5 $ 15 $ 22 $ 29 RAYMOND JAMES FINANCIAL, INC. Bank Segment Selected Key Metrics (Unaudited) Please refer to the footnotes at the end of this supplement for additional information. 11
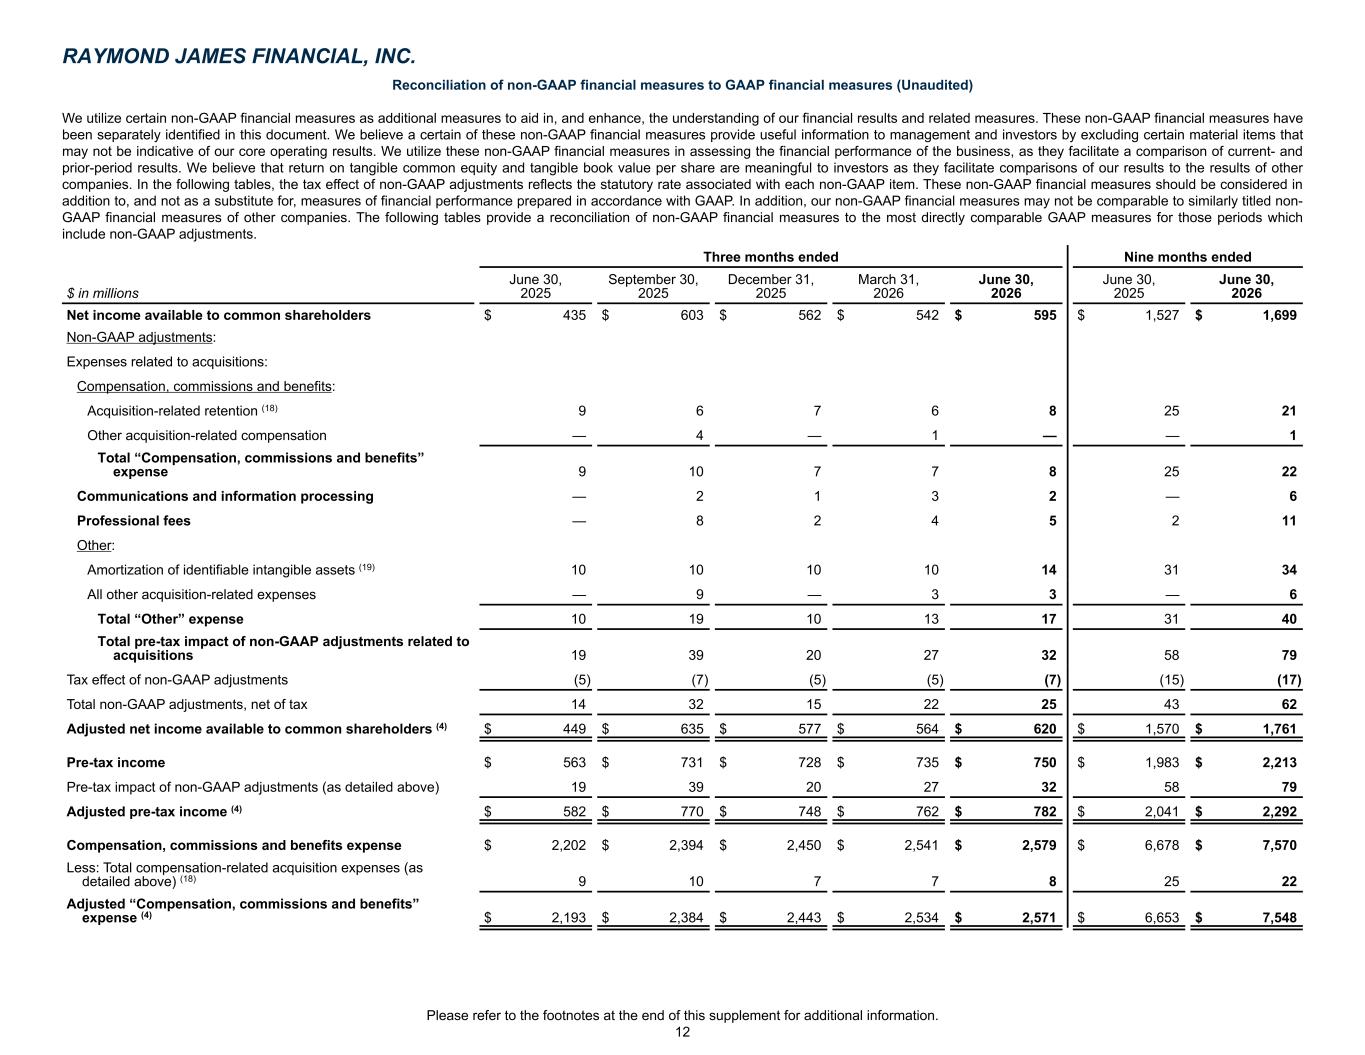
Reconciliation of non-GAAP financial measures to GAAP financial measures (Unaudited) We utilize certain non-GAAP financial measures as additional measures to aid in, and enhance, the understanding of our financial results and related measures. These non-GAAP financial measures have been separately identified in this document. We believe a certain of these non-GAAP financial measures provide useful information to management and investors by excluding certain material items that may not be indicative of our core operating results. We utilize these non-GAAP financial measures in assessing the financial performance of the business, as they facilitate a comparison of current- and prior-period results. We believe that return on tangible common equity and tangible book value per share are meaningful to investors as they facilitate comparisons of our results to the results of other companies. In the following tables, the tax effect of non-GAAP adjustments reflects the statutory rate associated with each non-GAAP item. These non-GAAP financial measures should be considered in addition to, and not as a substitute for, measures of financial performance prepared in accordance with GAAP. In addition, our non-GAAP financial measures may not be comparable to similarly titled non- GAAP financial measures of other companies. The following tables provide a reconciliation of non-GAAP financial measures to the most directly comparable GAAP measures for those periods which include non-GAAP adjustments. Three months ended Nine months ended $ in millions June 30, 2025 September 30, 2025 December 31, 2025 March 31, 2026 June 30, 2026 June 30, 2025 June 30, 2026 Net income available to common shareholders $ 435 $ 603 $ 562 $ 542 $ 595 $ 1,527 $ 1,699 Non-GAAP adjustments: Expenses related to acquisitions: Compensation, commissions and benefits: Acquisition-related retention (18) 9 6 7 6 8 25 21 Other acquisition-related compensation — 4 — 1 — — 1 Total “Compensation, commissions and benefits” expense 9 10 7 7 8 25 22 Communications and information processing — 2 1 3 2 — 6 Professional fees — 8 2 4 5 2 11 Other: Amortization of identifiable intangible assets (19) 10 10 10 10 14 31 34 All other acquisition-related expenses — 9 — 3 3 — 6 Total “Other” expense 10 19 10 13 17 31 40 Total pre-tax impact of non-GAAP adjustments related to acquisitions 19 39 20 27 32 58 79 Tax effect of non-GAAP adjustments (5) (7) (5) (5) (7) (15) (17) Total non-GAAP adjustments, net of tax 14 32 15 22 25 43 62 Adjusted net income available to common shareholders (4) $ 449 $ 635 $ 577 $ 564 $ 620 $ 1,570 $ 1,761 Pre-tax income $ 563 $ 731 $ 728 $ 735 $ 750 $ 1,983 $ 2,213 Pre-tax impact of non-GAAP adjustments (as detailed above) 19 39 20 27 32 58 79 Adjusted pre-tax income (4) $ 582 $ 770 $ 748 $ 762 $ 782 $ 2,041 $ 2,292 Compensation, commissions and benefits expense $ 2,202 $ 2,394 $ 2,450 $ 2,541 $ 2,579 $ 6,678 $ 7,570 Less: Total compensation-related acquisition expenses (as detailed above) (18) 9 10 7 7 8 25 22 Adjusted “Compensation, commissions and benefits” expense (4) $ 2,193 $ 2,384 $ 2,443 $ 2,534 $ 2,571 $ 6,653 $ 7,548 RAYMOND JAMES FINANCIAL, INC. Please refer to the footnotes at the end of this supplement for additional information. 12
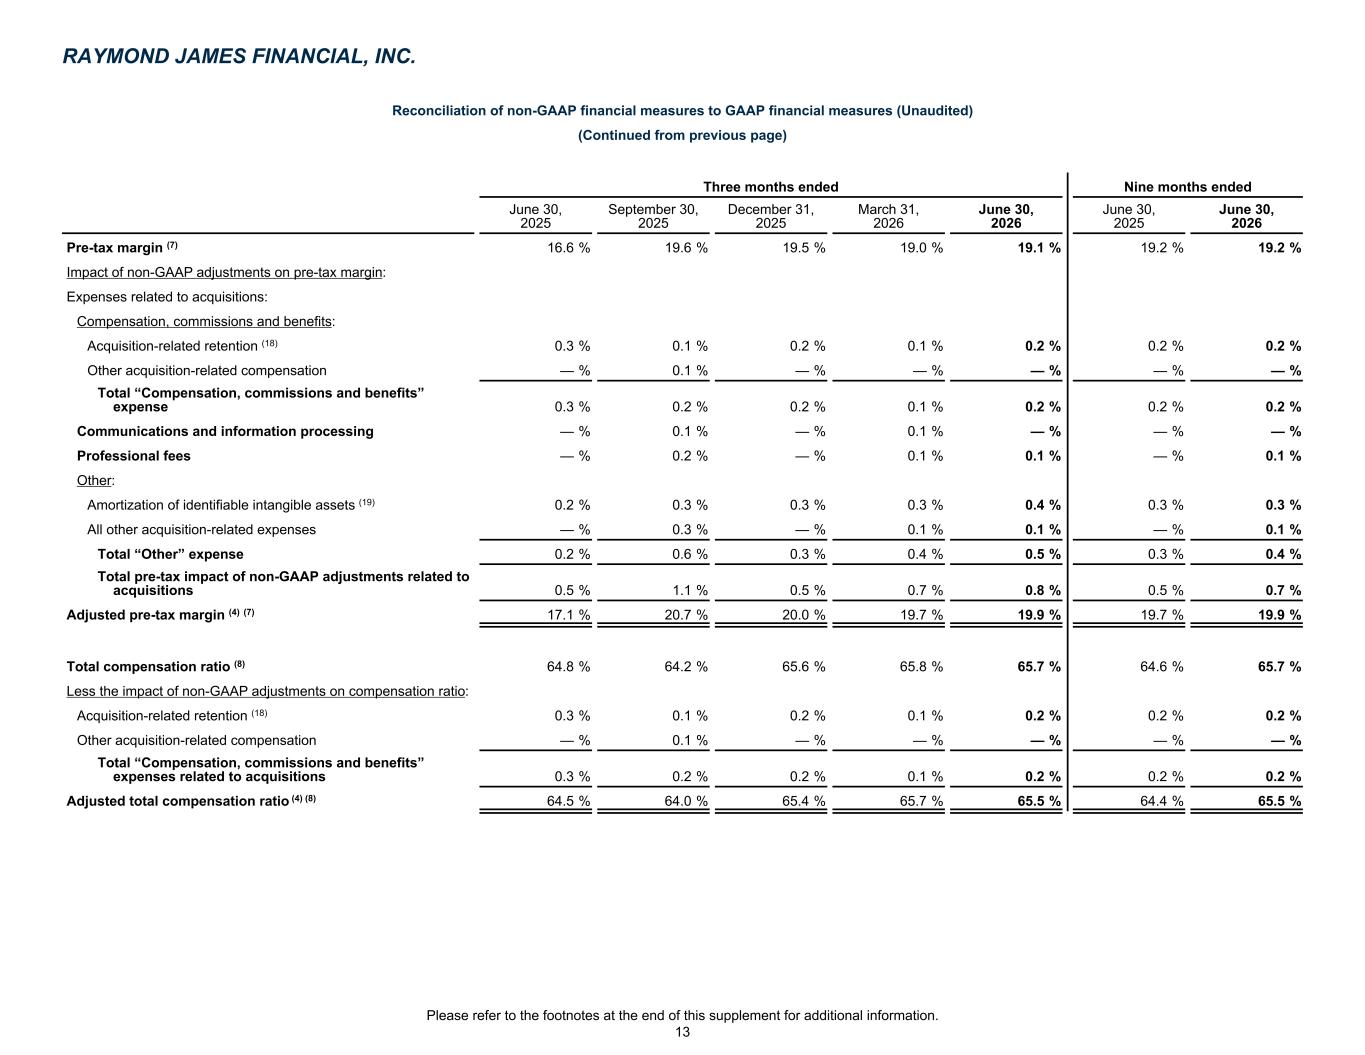
Reconciliation of non-GAAP financial measures to GAAP financial measures (Unaudited) (Continued from previous page) Three months ended Nine months ended June 30, 2025 September 30, 2025 December 31, 2025 March 31, 2026 June 30, 2026 June 30, 2025 June 30, 2026 Pre-tax margin (7) 16.6 % 19.6 % 19.5 % 19.0 % 19.1 % 19.2 % 19.2 % Impact of non-GAAP adjustments on pre-tax margin: Expenses related to acquisitions: Compensation, commissions and benefits: Acquisition-related retention (18) 0.3 % 0.1 % 0.2 % 0.1 % 0.2 % 0.2 % 0.2 % Other acquisition-related compensation — % 0.1 % — % — % — % — % — % Total “Compensation, commissions and benefits” expense 0.3 % 0.2 % 0.2 % 0.1 % 0.2 % 0.2 % 0.2 % Communications and information processing — % 0.1 % — % 0.1 % — % — % — % Professional fees — % 0.2 % — % 0.1 % 0.1 % — % 0.1 % Other: Amortization of identifiable intangible assets (19) 0.2 % 0.3 % 0.3 % 0.3 % 0.4 % 0.3 % 0.3 % All other acquisition-related expenses — % 0.3 % — % 0.1 % 0.1 % — % 0.1 % Total “Other” expense 0.2 % 0.6 % 0.3 % 0.4 % 0.5 % 0.3 % 0.4 % Total pre-tax impact of non-GAAP adjustments related to acquisitions 0.5 % 1.1 % 0.5 % 0.7 % 0.8 % 0.5 % 0.7 % Adjusted pre-tax margin (4) (7) 17.1 % 20.7 % 20.0 % 19.7 % 19.9 % 19.7 % 19.9 % Total compensation ratio (8) 64.8 % 64.2 % 65.6 % 65.8 % 65.7 % 64.6 % 65.7 % Less the impact of non-GAAP adjustments on compensation ratio: Acquisition-related retention (18) 0.3 % 0.1 % 0.2 % 0.1 % 0.2 % 0.2 % 0.2 % Other acquisition-related compensation — % 0.1 % — % — % — % — % — % Total “Compensation, commissions and benefits” expenses related to acquisitions 0.3 % 0.2 % 0.2 % 0.1 % 0.2 % 0.2 % 0.2 % Adjusted total compensation ratio (4) (8) 64.5 % 64.0 % 65.4 % 65.7 % 65.5 % 64.4 % 65.5 % RAYMOND JAMES FINANCIAL, INC. Please refer to the footnotes at the end of this supplement for additional information. 13
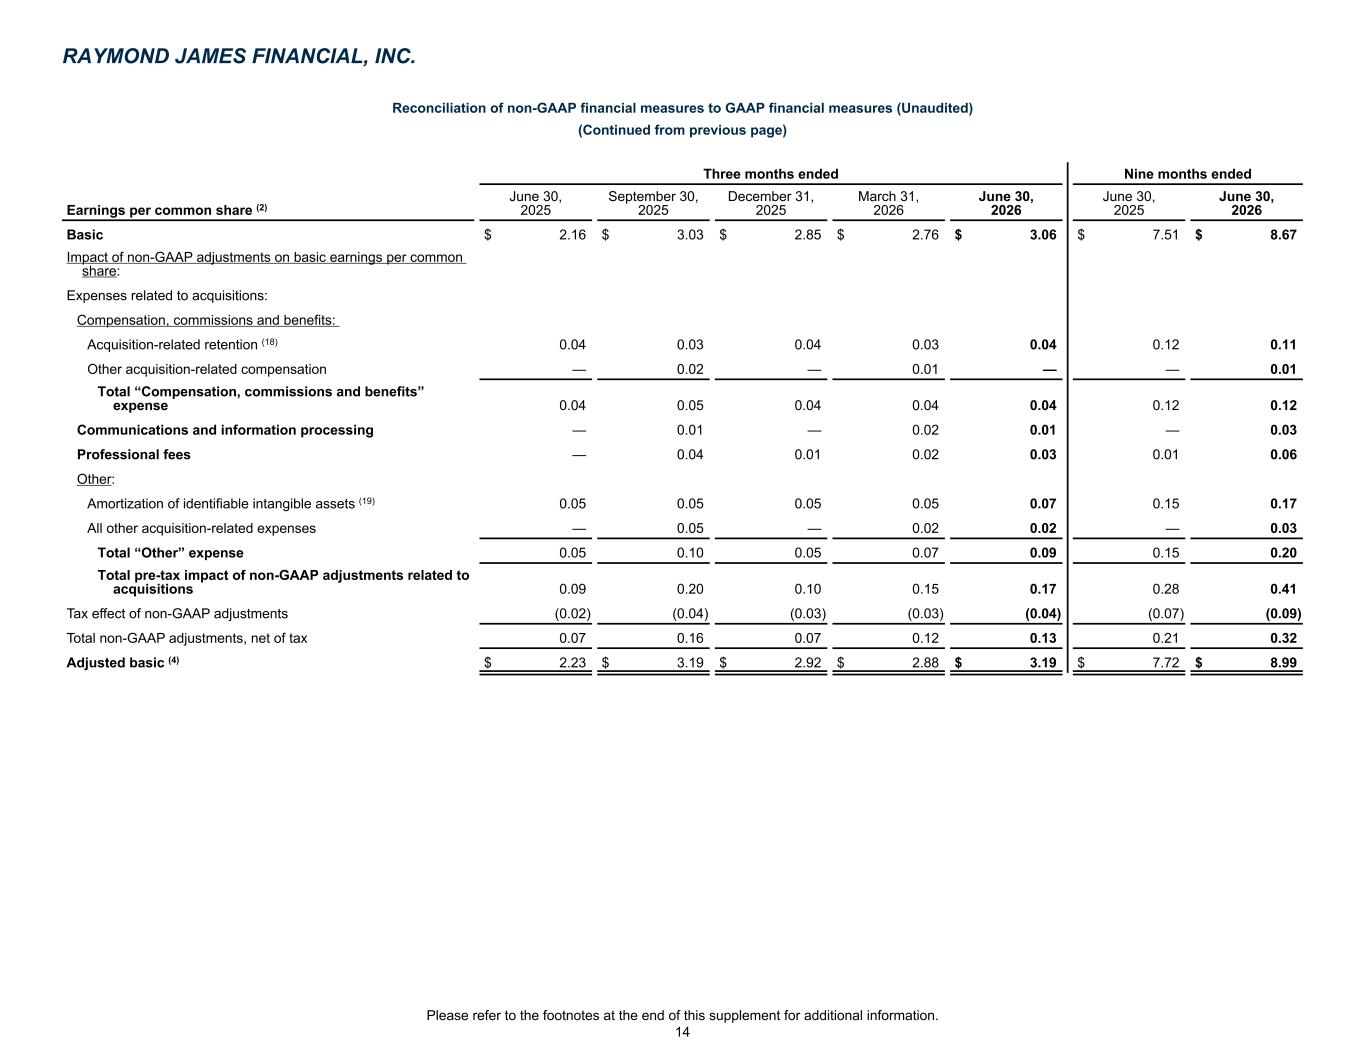
Reconciliation of non-GAAP financial measures to GAAP financial measures (Unaudited) (Continued from previous page) Three months ended Nine months ended Earnings per common share (2) June 30, 2025 September 30, 2025 December 31, 2025 March 31, 2026 June 30, 2026 June 30, 2025 June 30, 2026 Basic $ 2.16 $ 3.03 $ 2.85 $ 2.76 $ 3.06 $ 7.51 $ 8.67 Impact of non-GAAP adjustments on basic earnings per common share: Expenses related to acquisitions: Compensation, commissions and benefits: Acquisition-related retention (18) 0.04 0.03 0.04 0.03 0.04 0.12 0.11 Other acquisition-related compensation — 0.02 — 0.01 — — 0.01 Total “Compensation, commissions and benefits” expense 0.04 0.05 0.04 0.04 0.04 0.12 0.12 Communications and information processing — 0.01 — 0.02 0.01 — 0.03 Professional fees — 0.04 0.01 0.02 0.03 0.01 0.06 Other: Amortization of identifiable intangible assets (19) 0.05 0.05 0.05 0.05 0.07 0.15 0.17 All other acquisition-related expenses — 0.05 — 0.02 0.02 — 0.03 Total “Other” expense 0.05 0.10 0.05 0.07 0.09 0.15 0.20 Total pre-tax impact of non-GAAP adjustments related to acquisitions 0.09 0.20 0.10 0.15 0.17 0.28 0.41 Tax effect of non-GAAP adjustments (0.02) (0.04) (0.03) (0.03) (0.04) (0.07) (0.09) Total non-GAAP adjustments, net of tax 0.07 0.16 0.07 0.12 0.13 0.21 0.32 Adjusted basic (4) $ 2.23 $ 3.19 $ 2.92 $ 2.88 $ 3.19 $ 7.72 $ 8.99 RAYMOND JAMES FINANCIAL, INC. Please refer to the footnotes at the end of this supplement for additional information. 14
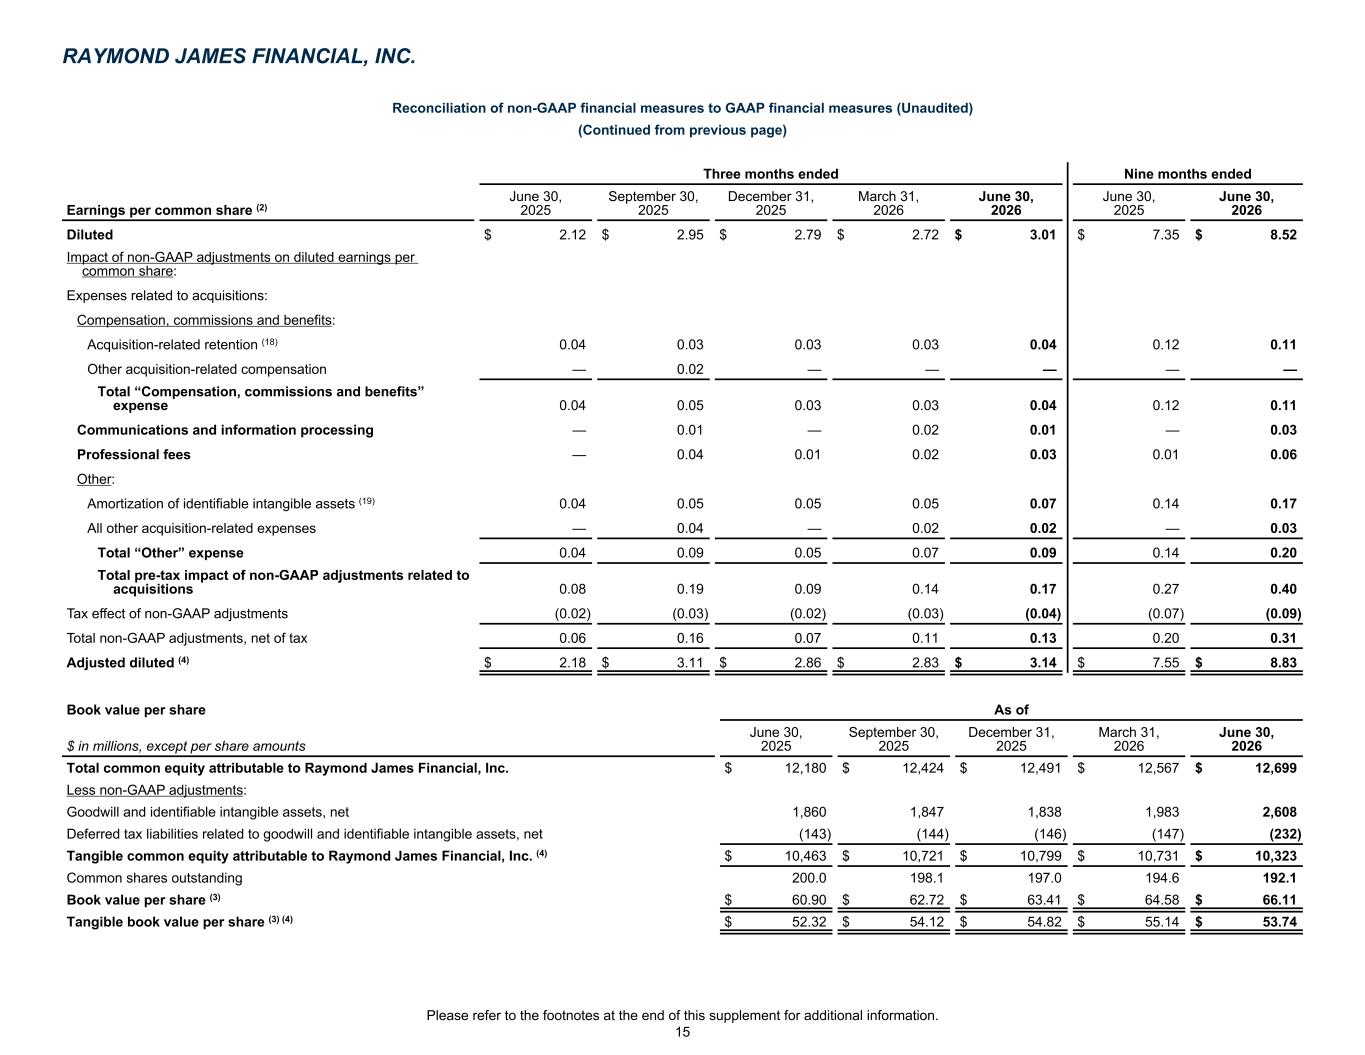
Reconciliation of non-GAAP financial measures to GAAP financial measures (Unaudited) (Continued from previous page) Three months ended Nine months ended Earnings per common share (2) June 30, 2025 September 30, 2025 December 31, 2025 March 31, 2026 June 30, 2026 June 30, 2025 June 30, 2026 Diluted $ 2.12 $ 2.95 $ 2.79 $ 2.72 $ 3.01 $ 7.35 $ 8.52 Impact of non-GAAP adjustments on diluted earnings per common share: Expenses related to acquisitions: Compensation, commissions and benefits: Acquisition-related retention (18) 0.04 0.03 0.03 0.03 0.04 0.12 0.11 Other acquisition-related compensation — 0.02 — — — — — Total “Compensation, commissions and benefits” expense 0.04 0.05 0.03 0.03 0.04 0.12 0.11 Communications and information processing — 0.01 — 0.02 0.01 — 0.03 Professional fees — 0.04 0.01 0.02 0.03 0.01 0.06 Other: Amortization of identifiable intangible assets (19) 0.04 0.05 0.05 0.05 0.07 0.14 0.17 All other acquisition-related expenses — 0.04 — 0.02 0.02 — 0.03 Total “Other” expense 0.04 0.09 0.05 0.07 0.09 0.14 0.20 Total pre-tax impact of non-GAAP adjustments related to acquisitions 0.08 0.19 0.09 0.14 0.17 0.27 0.40 Tax effect of non-GAAP adjustments (0.02) (0.03) (0.02) (0.03) (0.04) (0.07) (0.09) Total non-GAAP adjustments, net of tax 0.06 0.16 0.07 0.11 0.13 0.20 0.31 Adjusted diluted (4) $ 2.18 $ 3.11 $ 2.86 $ 2.83 $ 3.14 $ 7.55 $ 8.83 Book value per share As of $ in millions, except per share amounts June 30, 2025 September 30, 2025 December 31, 2025 March 31, 2026 June 30, 2026 Total common equity attributable to Raymond James Financial, Inc. $ 12,180 $ 12,424 $ 12,491 $ 12,567 $ 12,699 Less non-GAAP adjustments: Goodwill and identifiable intangible assets, net 1,860 1,847 1,838 1,983 2,608 Deferred tax liabilities related to goodwill and identifiable intangible assets, net (143) (144) (146) (147) (232) Tangible common equity attributable to Raymond James Financial, Inc. (4) $ 10,463 $ 10,721 $ 10,799 $ 10,731 $ 10,323 Common shares outstanding 200.0 198.1 197.0 194.6 192.1 Book value per share (3) $ 60.90 $ 62.72 $ 63.41 $ 64.58 $ 66.11 Tangible book value per share (3) (4) $ 52.32 $ 54.12 $ 54.82 $ 55.14 $ 53.74 RAYMOND JAMES FINANCIAL, INC. Please refer to the footnotes at the end of this supplement for additional information. 15
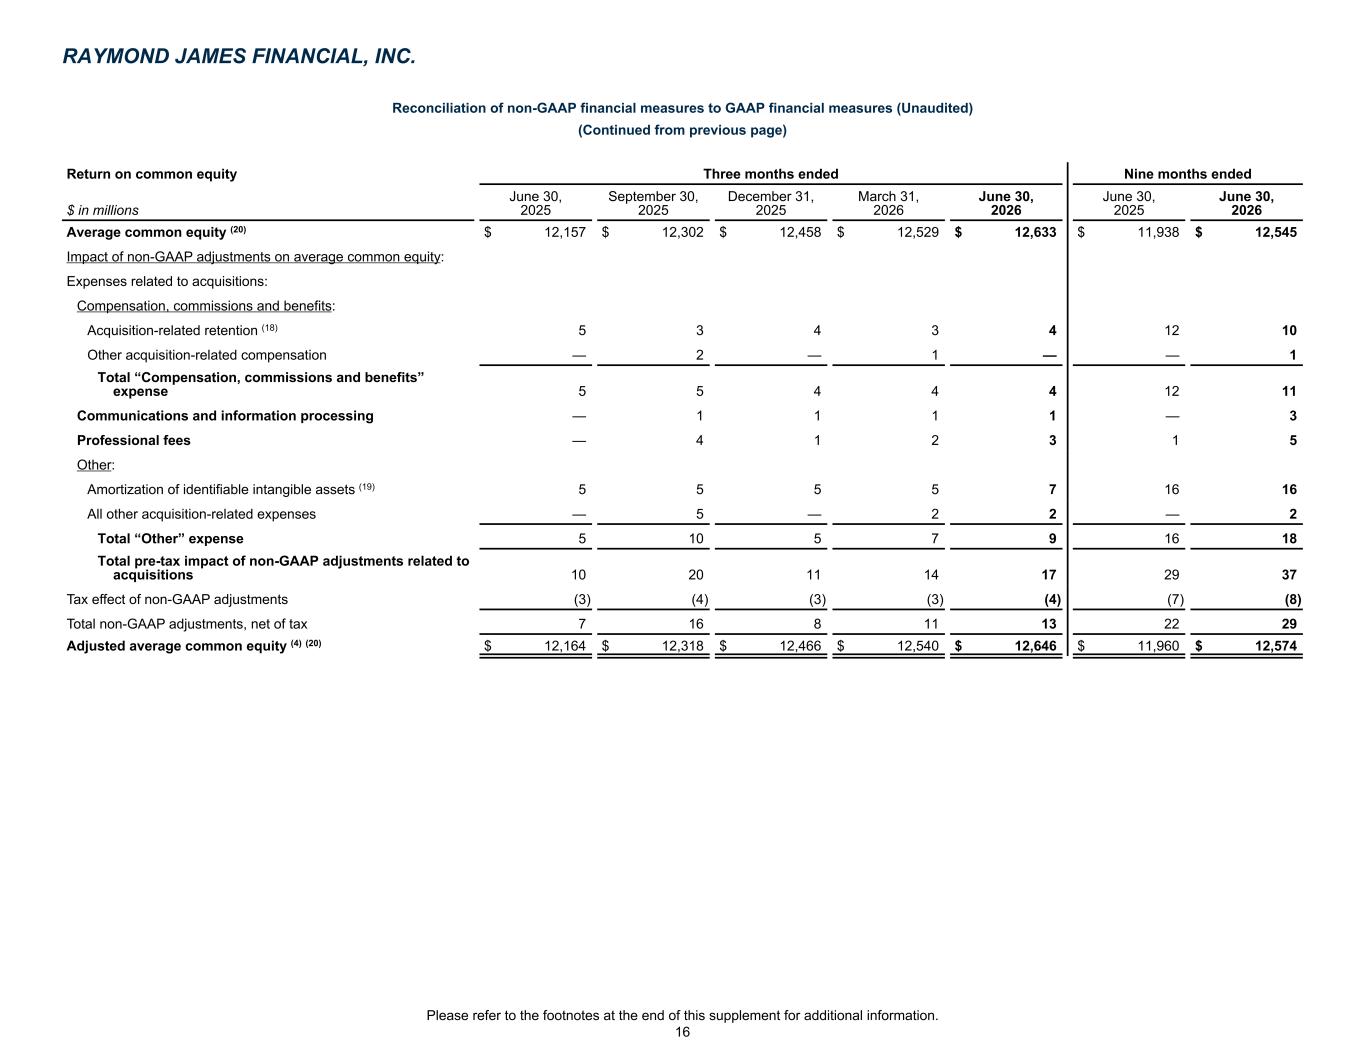
Reconciliation of non-GAAP financial measures to GAAP financial measures (Unaudited) (Continued from previous page) Return on common equity Three months ended Nine months ended $ in millions June 30, 2025 September 30, 2025 December 31, 2025 March 31, 2026 June 30, 2026 June 30, 2025 June 30, 2026 Average common equity (20) $ 12,157 $ 12,302 $ 12,458 $ 12,529 $ 12,633 $ 11,938 $ 12,545 Impact of non-GAAP adjustments on average common equity: Expenses related to acquisitions: Compensation, commissions and benefits: Acquisition-related retention (18) 5 3 4 3 4 12 10 Other acquisition-related compensation — 2 — 1 — — 1 Total “Compensation, commissions and benefits” expense 5 5 4 4 4 12 11 Communications and information processing — 1 1 1 1 — 3 Professional fees — 4 1 2 3 1 5 Other: Amortization of identifiable intangible assets (19) 5 5 5 5 7 16 16 All other acquisition-related expenses — 5 — 2 2 — 2 Total “Other” expense 5 10 5 7 9 16 18 Total pre-tax impact of non-GAAP adjustments related to acquisitions 10 20 11 14 17 29 37 Tax effect of non-GAAP adjustments (3) (4) (3) (3) (4) (7) (8) Total non-GAAP adjustments, net of tax 7 16 8 11 13 22 29 Adjusted average common equity (4) (20) $ 12,164 $ 12,318 $ 12,466 $ 12,540 $ 12,646 $ 11,960 $ 12,574 RAYMOND JAMES FINANCIAL, INC. Please refer to the footnotes at the end of this supplement for additional information. 16
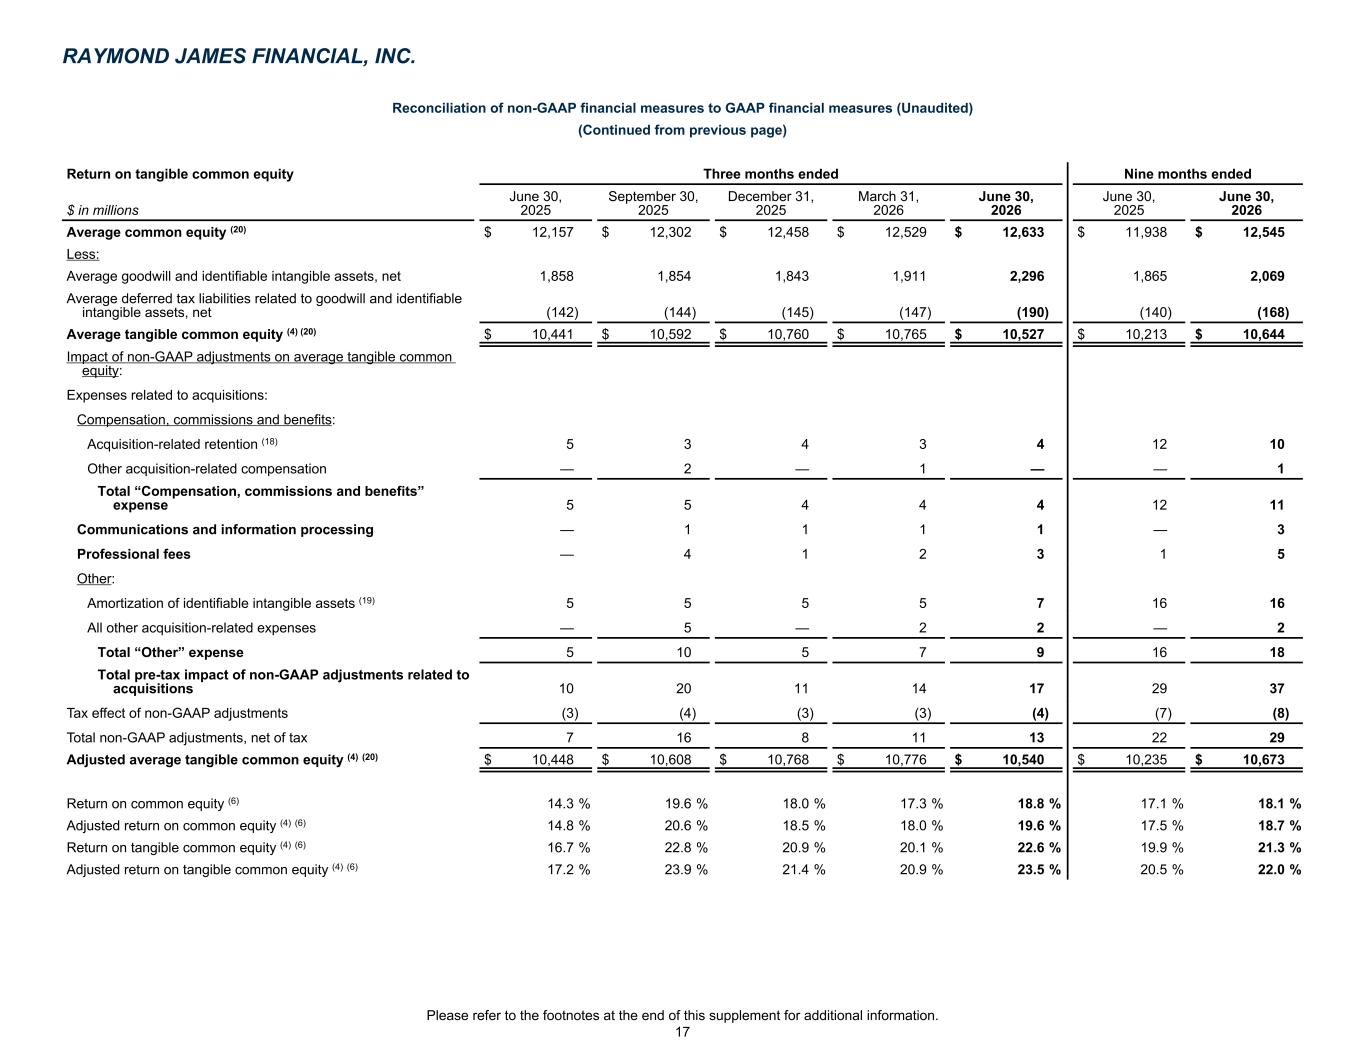
Reconciliation of non-GAAP financial measures to GAAP financial measures (Unaudited) (Continued from previous page) Return on tangible common equity Three months ended Nine months ended $ in millions June 30, 2025 September 30, 2025 December 31, 2025 March 31, 2026 June 30, 2026 June 30, 2025 June 30, 2026 Average common equity (20) $ 12,157 $ 12,302 $ 12,458 $ 12,529 $ 12,633 $ 11,938 $ 12,545 Less: Average goodwill and identifiable intangible assets, net 1,858 1,854 1,843 1,911 2,296 1,865 2,069 Average deferred tax liabilities related to goodwill and identifiable intangible assets, net (142) (144) (145) (147) (190) (140) (168) Average tangible common equity (4) (20) $ 10,441 $ 10,592 $ 10,760 $ 10,765 $ 10,527 $ 10,213 $ 10,644 Impact of non-GAAP adjustments on average tangible common equity: Expenses related to acquisitions: Compensation, commissions and benefits: Acquisition-related retention (18) 5 3 4 3 4 12 10 Other acquisition-related compensation — 2 — 1 — — 1 Total “Compensation, commissions and benefits” expense 5 5 4 4 4 12 11 Communications and information processing — 1 1 1 1 — 3 Professional fees — 4 1 2 3 1 5 Other: Amortization of identifiable intangible assets (19) 5 5 5 5 7 16 16 All other acquisition-related expenses — 5 — 2 2 — 2 Total “Other” expense 5 10 5 7 9 16 18 Total pre-tax impact of non-GAAP adjustments related to acquisitions 10 20 11 14 17 29 37 Tax effect of non-GAAP adjustments (3) (4) (3) (3) (4) (7) (8) Total non-GAAP adjustments, net of tax 7 16 8 11 13 22 29 Adjusted average tangible common equity (4) (20) $ 10,448 $ 10,608 $ 10,768 $ 10,776 $ 10,540 $ 10,235 $ 10,673 Return on common equity (6) 14.3 % 19.6 % 18.0 % 17.3 % 18.8 % 17.1 % 18.1 % Adjusted return on common equity (4) (6) 14.8 % 20.6 % 18.5 % 18.0 % 19.6 % 17.5 % 18.7 % Return on tangible common equity (4) (6) 16.7 % 22.8 % 20.9 % 20.1 % 22.6 % 19.9 % 21.3 % Adjusted return on tangible common equity (4) (6) 17.2 % 23.9 % 21.4 % 20.9 % 23.5 % 20.5 % 22.0 % RAYMOND JAMES FINANCIAL, INC. Please refer to the footnotes at the end of this supplement for additional information. 17
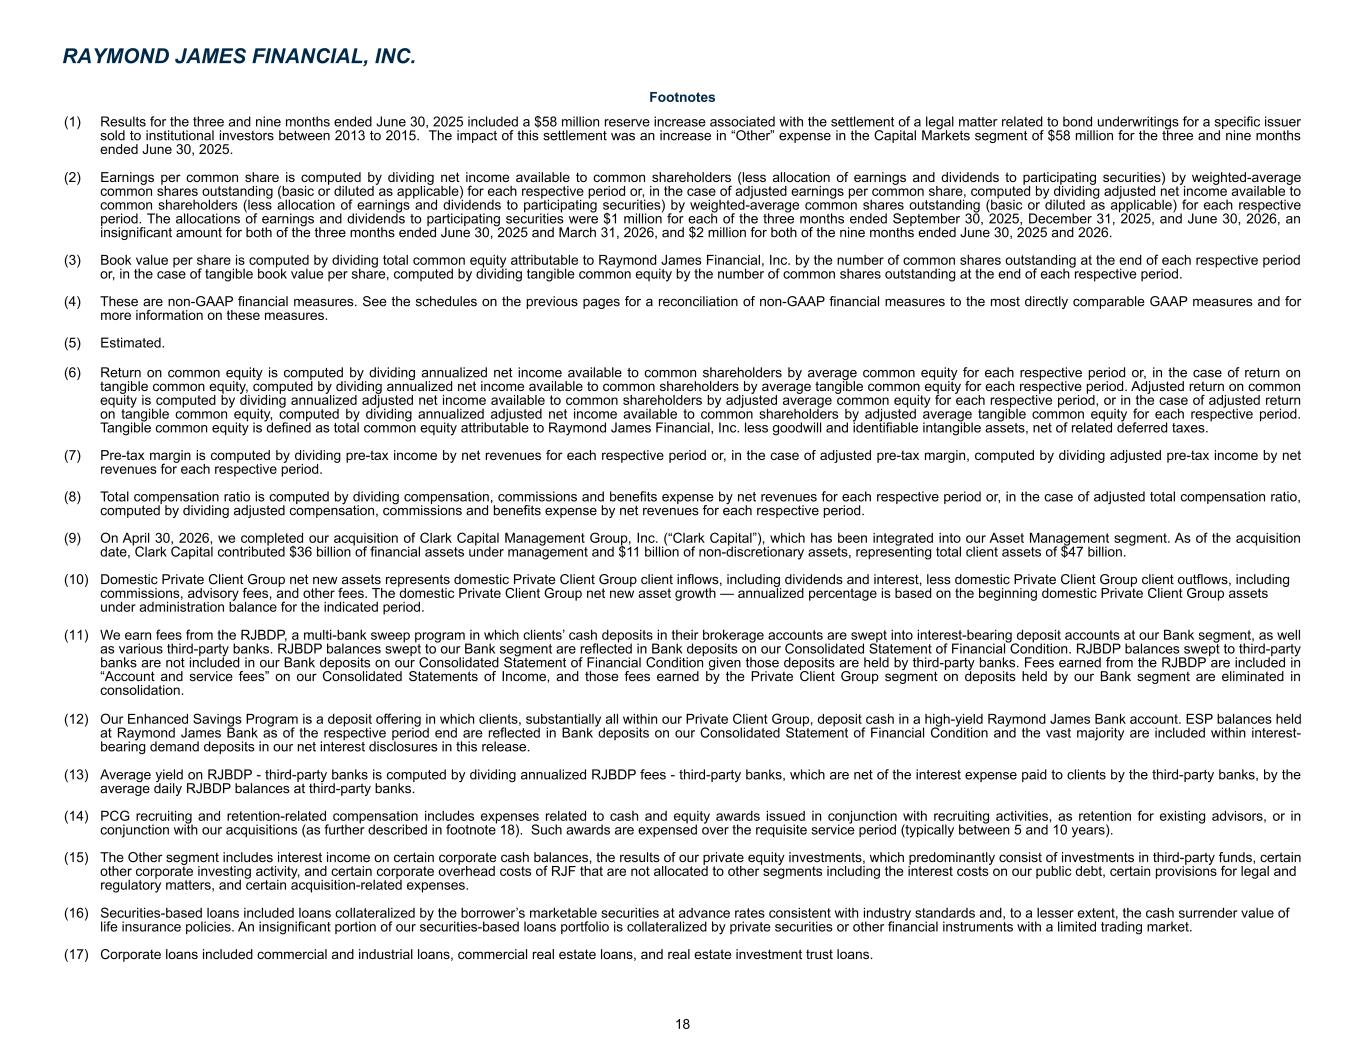
Footnotes (1) Results for the three and nine months ended June 30, 2025 included a $58 million reserve increase associated with the settlement of a legal matter related to bond underwritings for a specific issuer sold to institutional investors between 2013 to 2015. The impact of this settlement was an increase in “Other” expense in the Capital Markets segment of $58 million for the three and nine months ended June 30, 2025. (2) Earnings per common share is computed by dividing net income available to common shareholders (less allocation of earnings and dividends to participating securities) by weighted-average common shares outstanding (basic or diluted as applicable) for each respective period or, in the case of adjusted earnings per common share, computed by dividing adjusted net income available to common shareholders (less allocation of earnings and dividends to participating securities) by weighted-average common shares outstanding (basic or diluted as applicable) for each respective period. The allocations of earnings and dividends to participating securities were $1 million for each of the three months ended September 30, 2025, December 31, 2025, and June 30, 2026, an insignificant amount for both of the three months ended June 30, 2025 and March 31, 2026, and $2 million for both of the nine months ended June 30, 2025 and 2026. (3) Book value per share is computed by dividing total common equity attributable to Raymond James Financial, Inc. by the number of common shares outstanding at the end of each respective period or, in the case of tangible book value per share, computed by dividing tangible common equity by the number of common shares outstanding at the end of each respective period. (4) These are non-GAAP financial measures. See the schedules on the previous pages for a reconciliation of non-GAAP financial measures to the most directly comparable GAAP measures and for more information on these measures. (5) Estimated. (6) Return on common equity is computed by dividing annualized net income available to common shareholders by average common equity for each respective period or, in the case of return on tangible common equity, computed by dividing annualized net income available to common shareholders by average tangible common equity for each respective period. Adjusted return on common equity is computed by dividing annualized adjusted net income available to common shareholders by adjusted average common equity for each respective period, or in the case of adjusted return on tangible common equity, computed by dividing annualized adjusted net income available to common shareholders by adjusted average tangible common equity for each respective period. Tangible common equity is defined as total common equity attributable to Raymond James Financial, Inc. less goodwill and identifiable intangible assets, net of related deferred taxes. (7) Pre-tax margin is computed by dividing pre-tax income by net revenues for each respective period or, in the case of adjusted pre-tax margin, computed by dividing adjusted pre-tax income by net revenues for each respective period. (8) Total compensation ratio is computed by dividing compensation, commissions and benefits expense by net revenues for each respective period or, in the case of adjusted total compensation ratio, computed by dividing adjusted compensation, commissions and benefits expense by net revenues for each respective period. (9) On April 30, 2026, we completed our acquisition of Clark Capital Management Group, Inc. (“Clark Capital”), which has been integrated into our Asset Management segment. As of the acquisition date, Clark Capital contributed $36 billion of financial assets under management and $11 billion of non-discretionary assets, representing total client assets of $47 billion. (10) Domestic Private Client Group net new assets represents domestic Private Client Group client inflows, including dividends and interest, less domestic Private Client Group client outflows, including commissions, advisory fees, and other fees. The domestic Private Client Group net new asset growth — annualized percentage is based on the beginning domestic Private Client Group assets under administration balance for the indicated period. (11) We earn fees from the RJBDP, a multi-bank sweep program in which clients’ cash deposits in their brokerage accounts are swept into interest-bearing deposit accounts at our Bank segment, as well as various third-party banks. RJBDP balances swept to our Bank segment are reflected in Bank deposits on our Consolidated Statement of Financial Condition. RJBDP balances swept to third-party banks are not included in our Bank deposits on our Consolidated Statement of Financial Condition given those deposits are held by third-party banks. Fees earned from the RJBDP are included in “Account and service fees” on our Consolidated Statements of Income, and those fees earned by the Private Client Group segment on deposits held by our Bank segment are eliminated in consolidation. (12) Our Enhanced Savings Program is a deposit offering in which clients, substantially all within our Private Client Group, deposit cash in a high-yield Raymond James Bank account. ESP balances held at Raymond James Bank as of the respective period end are reflected in Bank deposits on our Consolidated Statement of Financial Condition and the vast majority are included within interest- bearing demand deposits in our net interest disclosures in this release. (13) Average yield on RJBDP - third-party banks is computed by dividing annualized RJBDP fees - third-party banks, which are net of the interest expense paid to clients by the third-party banks, by the average daily RJBDP balances at third-party banks. (14) PCG recruiting and retention-related compensation includes expenses related to cash and equity awards issued in conjunction with recruiting activities, as retention for existing advisors, or in conjunction with our acquisitions (as further described in footnote 18). Such awards are expensed over the requisite service period (typically between 5 and 10 years). (15) The Other segment includes interest income on certain corporate cash balances, the results of our private equity investments, which predominantly consist of investments in third-party funds, certain other corporate investing activity, and certain corporate overhead costs of RJF that are not allocated to other segments including the interest costs on our public debt, certain provisions for legal and regulatory matters, and certain acquisition-related expenses. (16) Securities-based loans included loans collateralized by the borrower’s marketable securities at advance rates consistent with industry standards and, to a lesser extent, the cash surrender value of life insurance policies. An insignificant portion of our securities-based loans portfolio is collateralized by private securities or other financial instruments with a limited trading market. (17) Corporate loans included commercial and industrial loans, commercial real estate loans, and real estate investment trust loans. RAYMOND JAMES FINANCIAL, INC. 18

(18) Includes acquisition-related compensation expenses primarily arising from equity and cash-based retention awards issued in conjunction with acquisitions. Such retention awards are generally contingent upon the post-closing continuation of service of certain associates who joined the firm as part of such acquisitions and are expensed over the requisite service period. (19) Amortization of identifiable intangible assets, which was included in “Other” expense, includes amortization of identifiable intangible assets arising from our acquisitions. (20) Average common equity for the quarter-to-date period is computed by adding the total common equity attributable to Raymond James Financial, Inc. as of the date indicated to the prior quarter-end total, and dividing by two, or in the case of average tangible common equity, computed by adding tangible common equity as of the date indicated to the prior quarter-end total, and dividing by two. For the year-to-date period, average common equity is computed by adding the total common equity attributable to Raymond James Financial, Inc. as of each quarter-end date during the indicated period to the beginning of year total, and dividing by four, or in the case of average tangible common equity, computed by adding tangible common equity as of each quarter-end date during the indicated period to the beginning of year total, and dividing by four. Adjusted average common equity is computed by adjusting for the impact on average common equity of the non-GAAP adjustments, as applicable for each respective period. Adjusted average tangible common equity is computed by adjusting for the impact on average tangible common equity of the non-GAAP adjustments, as applicable for each respective period. RAYMOND JAMES FINANCIAL, INC. 19