
Exhibit 99.2
A Merger to Create a Top-Tier American Clean Power Platform Combining two leading American renewable power producers — delivering power where it's needed, fast. 1
DISCLOSURE Important Disclosures No Offer or Solicitation Participants in the Solicitation This presentation relates to a proposed merger (the “Merger”) involving MN8 Energy Holdings LLC (“MN8”) and Greenbacker Renewable Energy Company LLC (“Greenbacker” or “GREC”). This presentation is for informational purposes MN8, its directors and executive officers and Greenbacker and its directors and executive officers may be deemed to be only and does not constitute an offer to sell or the solicitation of an offer to buy any securities or a solicitation of any vote participants in the solicitation of proxies in respect to the Merger. or approval, in any jurisdiction, pursuant to the Merger or otherwise, nor shall there be any sale, issuance, exchange or transfer of the securities referred to in this document in any jurisdiction in contravention of applicable law. No offer of Information regarding directors and executive officers of MN8, including a description of their direct or indirect interests, by securities shall be made except by means of a prospectus meeting the requirements of Section 10 of the Securities Act of security holdings or otherwise, will be set forth in the Registration Statement on Form S-4, once it becomes available. 1933, as amended. Information regarding Greenbacker’s executive officers and directors, including a description of their direct or indirect interests, by security holdings or otherwise, is set forth in Greenbacker’s Annual report on Form 10-K filed with the SEC on Important Additional Information March 9, 2026, Greenbacker’s Form 10-K/A filed with the SEC on April 30, 2026 and other documents subsequently filed by Greenbacker with the SEC. In connection with the Merger, MN8 will file with the U.S. Securities and Exchange Commission (“SEC”) a registration statement on Form S-4, that will include a proxy statement of Greenbacker and a prospectus of MN8. The Merger will be Investors may obtain additional information regarding the interests of those persons and other persons who may be submitted to Greenbacker’s shareholders for their consideration. MN8 and Greenbacker may also file other documents with deemed participants in the Merger by reading the proxy statement/prospectus regarding the Merger when it becomes the SEC regarding the Merger. The definitive proxy statement/prospectus will be sent to the shareholders of Greenbacker. available. You may obtain free copies of this document as described above. This document is not intended to be, and is not, a substitute for the registration statement and proxy statement/prospectus Market and Industry that will be filed with the SEC or any other documents that MN8 or Greenbacker may file with the SEC or send to security holders of MN8 or Greenbacker in connection with the Merger. INVESTORS AND SECURITY HOLDERS OF MN8 AND This presentation includes market and industry data and forecasts that we have derived from independent consultant GREENBACKER ARE URGED TO READ THE REGISTRATION STATEMENT AND THE PROXY STATEMENT/PROSPECTUS reports, publicly available information, various industry publications, other published industry sources and our internal data REGARDING THE MERGER WHEN IT BECOMES AVAILABLE AND ALL OTHER RELEVANT DOCUMENTS THAT ARE FILED OR and estimates. Independent consultant reports, industry publications and other published industry sources generally WILL BE FILED WITH THE SEC, AS WELL AS ANY AMENDMENTS OR SUPPLEMENTS TO THESE DOCUMENTS, CAREFULLY AND indicate that the information contained therein was obtained from sources believed to be reliable. The inclusion of market IN THEIR ENTIRETY BECAUSE THEY WILL CONTAIN IMPORTANT INFORMATION ABOUT THE MERGER AND RELATED estimations, rankings and industry data in this presentation is based upon such reports, publications and other sources, our MATTERS. internal data and estimates and our understanding of industry conditions. Although we believe that such information is reliable, we have not had this information verified by any independent sources. You are cautioned not to give undue weight Investors and security holders will be able to obtain free copies of the registration statement and the proxy to such estimates. statement/prospectus (when available) and all other documents, in each case if and when such documents are filed, with the SEC by MN8 or Greenbacker through the website maintained by the SEC at http://www.sec.gov. Copies of documents filed with the SEC by MN8 are available by directing a request to Investor Relations, MN8 Energy Holdings LLC, c/o MN8 Energy, LLC, 1155 Avenue of the Americas, 27th Floor, New York, NY 10036, Tel. No. (332) 245-4052. Copies of documents filed with the SEC by Greenbacker will be made available free of charge on Greenbacker’s website at www.greenbackercapital.com/greenbacker-renewable-energy-company/ under “Public filings and investor materials”. 2
DISCLOSURE Important Disclosures Forward-Looking Statements and Cautionary Statements This presentation contains “forward-looking statements” within the meaning of Section 27A of the Securities Act of 1933 and Section 21E All forward-looking statements are based on assumptions that MN8 or Greenbacker believe to be reasonable but that may not prove to be of the Securities Exchange Act of 1934, as amended. These statements are based on current expectations. Forward-looking statements are accurate. Any forward-looking statement speaks only as of the date on which such statement is made, and MN8 and Greenbacker undertake statements that are not statements of historical fact, including statements about beliefs, opinions and expectations. Such statements are no obligation to correct or update any forward-looking statement, whether as a result of new information, future events or otherwise, subject to a number of assumptions, risks and uncertainties, many of which are beyond the control of MN8 and Greenbacker. The words except as required by applicable law. Readers are cautioned not to place undue reliance on these forward-looking statements that speak and phrases “should,” “could,” “may,” “will,” “believe,” “plan,” “intend,” “expect,” “potential,” “possible,” “anticipate,” “estimate,” only as of the date hereof. “forecast,” “view,” “efforts,” “goal,” and similar expressions identify forward-looking statements and express expectations about future events. However, the absence of these words does not mean that the statements are not forward-looking. These forward-looking Non-GAAP Measures statements include, but are not limited to statements regarding the Merger, pro forma descriptions of the combined company and its operations, integration and transition plans, synergies, opportunities and anticipated future performance. This presentation references certain non-GAAP financial measures, including Adjusted EBITDA, Combined Adjusted EBITDA and Pro Forma FY Run-Rate Adjusted EBITDA, which management uses as supplemental indicators of operating performance. These measures have limitations, There are a number of risks and uncertainties that could cause actual results to differ materially from the forward-looking statements are not defined uniformly across companies, and should not be considered substitutes for measures prepared in accordance with GAAP. Pro included in this communication. Forward-looking statements are not guarantees of future performance, and we cannot assure any forma and projected figures are preliminary, illustrative and unaudited, and remain subject to confirmation in the definitive proxy statement reader that such statements will prove correct or that the forward-looking events and circumstances will occur. Actual results may differ / prospectus. MN8 has not provided projected net income from the assets to be acquired, the most comparable financial measure calculated materially from those anticipated or implied in the forward-looking statements due to the numerous risks in accordance with GAAP, or a reconciliation of Combined Adjusted EBITDA to projected net income of the assets to be acquired. MN8 does and uncertainties. These include the expected timing and likelihood of completion of the Merger, including the timing, receipt and terms not control the assets to be acquired or prepare the related financial statements. MN8 is unable to provide projected net income of the and conditions of any required governmental and regulatory approvals of the Merger that could reduce anticipated benefits or cause the assets to be acquired or a reconciliation of the Combined Adjusted EBITDA of the assets to be acquired to projected net income from those parties to abandon the Merger, the ability to successfully integrate the businesses, the occurrence of any event, change or other assets because the calculation of Combined Adjusted EBITDA was based on, among other things, projected generation and rate information circumstances that could give rise to the termination of the merger agreement, including in circumstances that would require combined with high-level operating expense assumptions related to the assets to be acquired. As such, MN8 does not have sufficient Greenbacker to pay a termination fee pursuant to the merger agreement, the possibility that competing offers or transaction proposals information to project net income from the assets to be acquired, nor does MN8 have sufficient information regarding all of the reconciling may be made, the risk of member or security holder litigation relating to the proposed transaction, including resulting expense or delay, items that may exist between Combined Adjusted EBITDA and projected net income for the assets to be acquired. Therefore, projected net the possibility that the proposed transaction will not be completed in the expected timeframe or at all, the possibility that shareholders income of the assets to be acquired and a reconciliation of Combined Adjusted EBITDA of the assets to projected net income from those of Greenbacker may not approve the merger agreement, the risk that the parties may not be able to satisfy the conditions to the Merger assets are not available without unreasonable effort. in a timely manner or at all, risks related to disruption of management time from ongoing business operations due to the Merger, the risk that the Merger and its announcement could have an adverse effect on the ability of MN8 and Greenbacker to retain customers and Similarly, Pro Forma FY Run-Rate Adjusted EBITDA is reconciled to Operating Income rather than net income, the most comparable financial retain and hire key personnel and maintain relationships with their suppliers, customers and others with whom MN8 and measure calculated in accordance with GAAP. Pro Forma FY Run-Rate Adjusted EBITDA is calculated in part using estimated annualized Greenbacker conduct business and on their operating results and businesses generally, employee departures, the risk the pending Merger revenue and operating expense assumptions for certain combined assets under construction, and MN8 does not have sufficient information could distract management of both entities and they will incur substantial costs, the risk that problems may arise in successfully regarding all of the reconciling items, including estimated combined interest expense, income tax expense, and other items, that would be integrating the businesses of the companies, which may result in the combined company not operating as effectively and efficiently as necessary to project net income for the combined company on a pro forma run-rate basis. Therefore, a reconciliation of Pro Forma FY Run- expected, certain restrictions during the pendency of the Merger that may impact MN8’s or Greenbacker’s ability to pursue certain Rate Adjusted EBITDA to net income is not available without unreasonable effort. business opportunities or strategic transactions, the risk that the combined company may be unable to achieve synergies and other strategic benefits or it may take longer than expected to achieve those synergies, the risks related to non-achievement of any See the Appendix for definitions of, and reconciliations to the most directly comparable GAAP financial measures for, each non-GAAP milestone on which the amount of earned additional consideration depends and that Greenbacker shareholders will not receive any or financial measure referenced in this presentation, where applicable. all of the additional consideration holdback amount and other important factors that could cause actual results to differ materially from those projected, and the risk that the completion of any liquidity event by MN8, including any initial public offering or other Trademarks transaction described herein, does not occur within the timeframe contemplated by the merger agreement or at all. Our registered or common law trademarks, tradenames and service marks appearing in this presentation are our property. Solely for All such factors are difficult to predict and are beyond MN8’s or Greenbacker’s control, including those detailed in Greenbacker’s annual convenience, our trademarks, tradenames and service marks referred to in this presentation may appear without the ®, TM and SM reports on Form 10-K, quarterly reports on Form 10-Q and current reports on Form 8-K that are available on Greenbacker’s website at symbols, but those references are not intended to indicate, in any way, that we will not assert, to the fullest extent under applicable law, www.greenbackercapital.com/greenbacker-renewable-energy-company/ and on the SEC’s website at http://www.sec.gov. our rights to these trademarks, tradenames and service marks. This presentation contains additional trademarks, tradenames and service marks of other companies that are the property of their respective owners. We do not intend our use or display of other companies’ trademarks, tradenames and service marks to imply relationships with, or endorsement or sponsorship of us by, these other companies. 3
What Was Just Announced The summary of key terms, the combined platform, and why both Boards have approved the transaction PRESENTED BY Dan de Boer Chief Executive Officer, Greenbacker 4
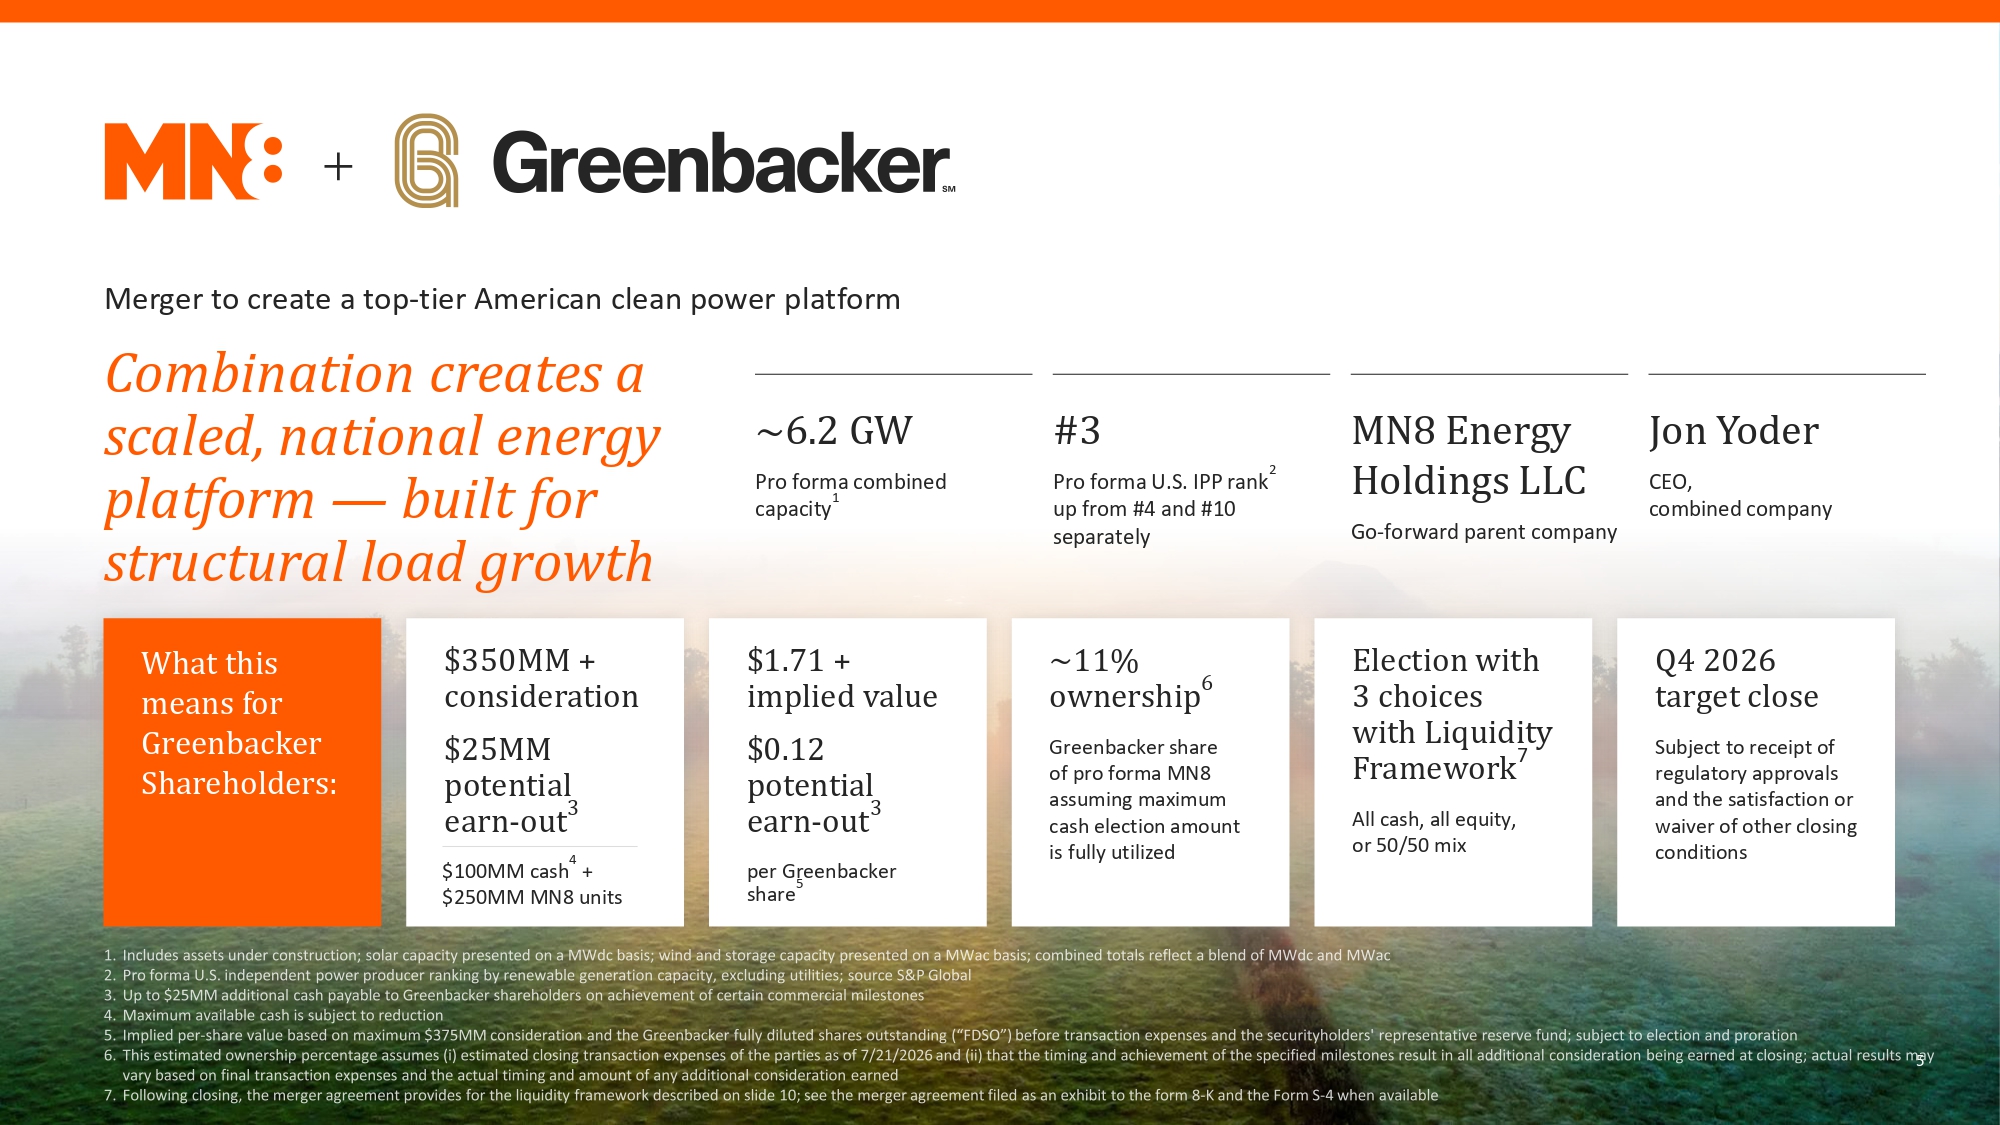
Merger to create a top-tier American clean power platform Combination creates a scaled, national energy ~6.2 GW #3 MN8 Energy Jon Yoder Holdings LLC platform — built for 2 Pro forma combined Pro forma U.S. IPP rank CEO, 1 capacity up from #4 and #10 combined company separately Go-forward parent company structural load growth What this $350MM + $1.71 + ~11% Election with Q4 2026 6 means for consideration implied value ownership 3 choices target close Greenbacker with Liquidity $25MM $0.12 Greenbacker share 7 Subject to receipt of Shareholders: of pro forma MN8 Framework regulatory approvals potential potential assuming maximum and the satisfaction or 3 3 earn-out earn-out cash election amount All cash, all equity, waiver of other closing is fully utilized or 50/50 mix conditions 4 $100MM cash + per Greenbacker 5 $250MM MN8 units share 5
A Rigorous, Greenbacker Board- Led Process This combination is the outcome of a competitive, multi-stage review designed to maximize value for Greenbacker shareholders PRESENTED BY Dan de Boer Chief Executive Officer, Greenbacker Carl Weatherley-White Chief Financial Officer, Greenbacker 6
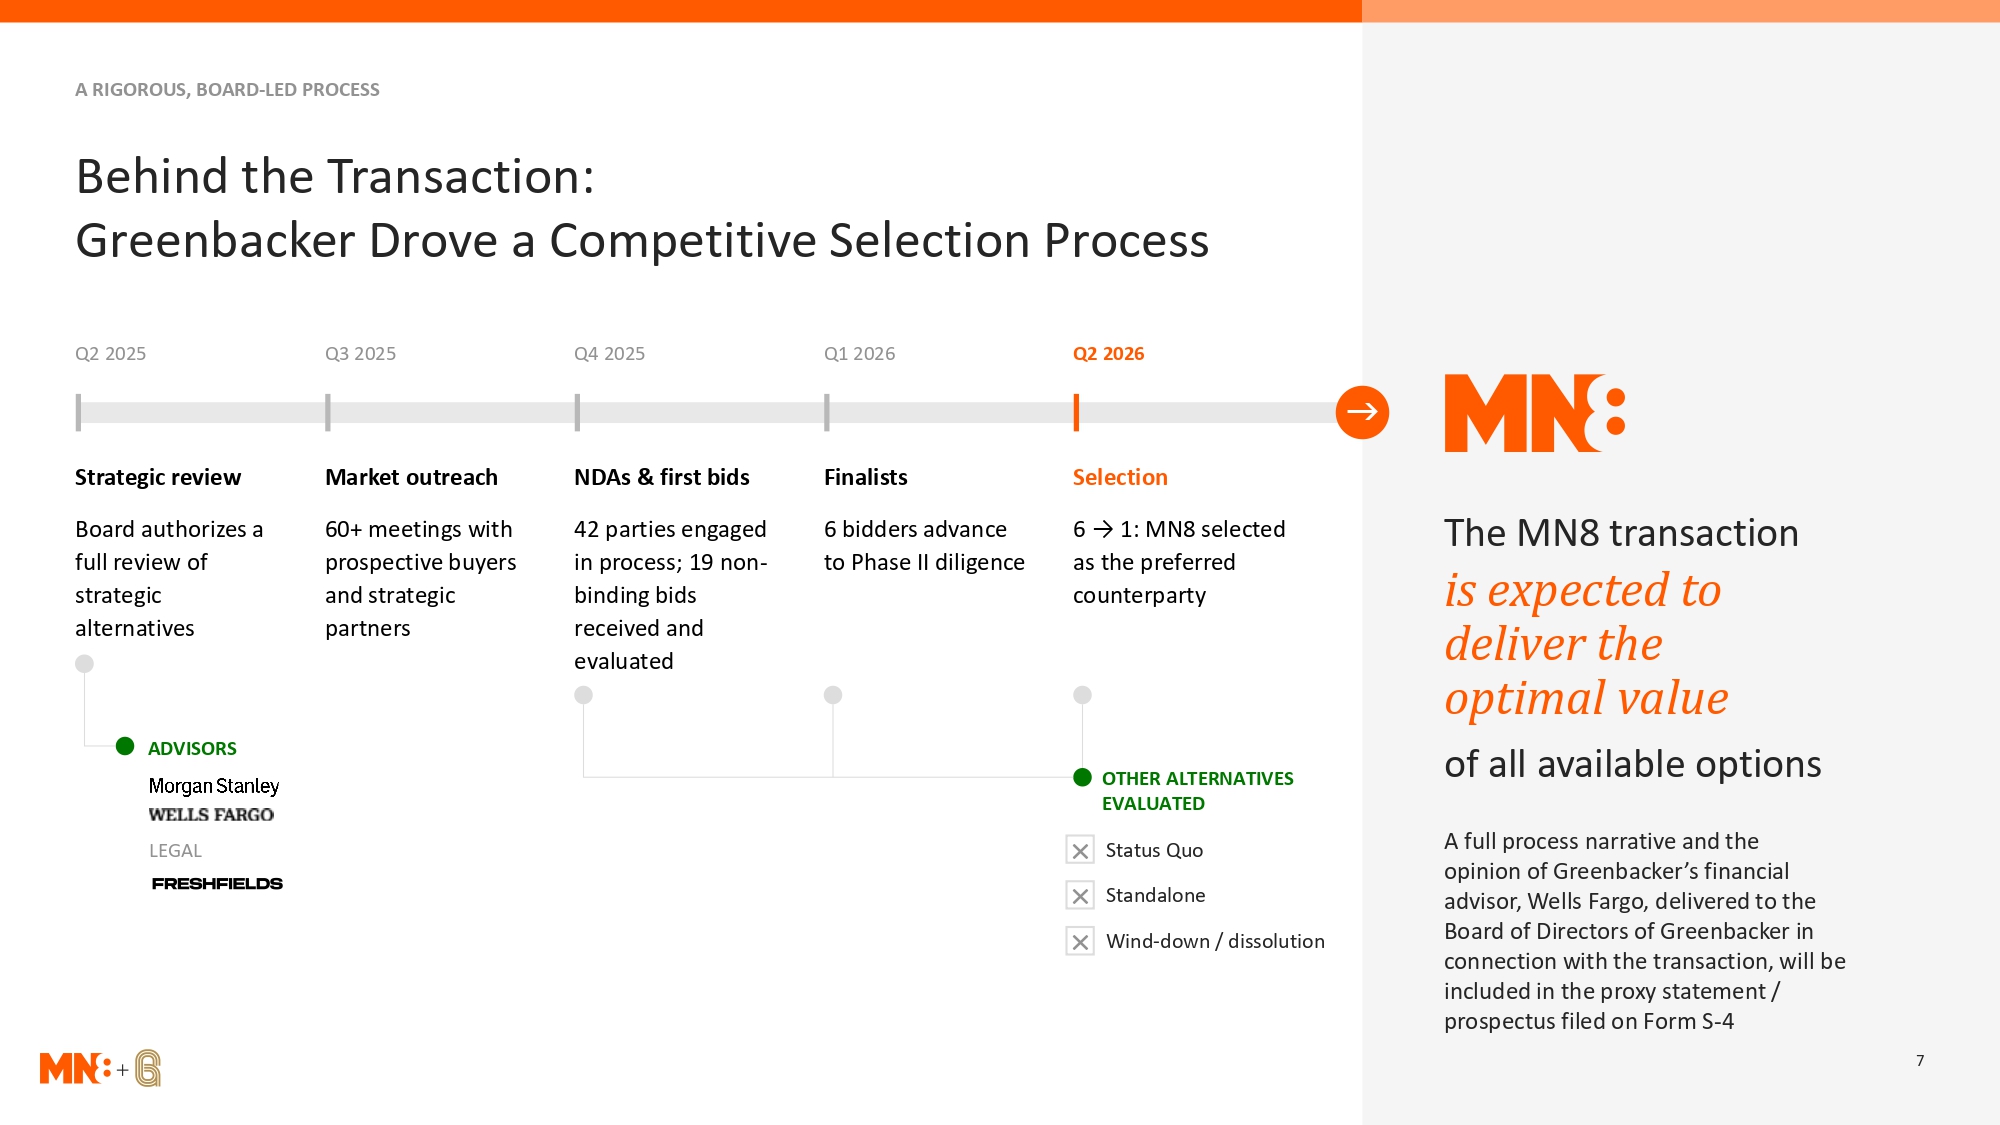
A RIGOROUS, BOARD-LED PROCESS Behind the Transaction: Greenbacker Drove a Competitive Selection Process Q2 2025 Q3 2025 Q4 2025 Q1 2026 Q2 2026 Strategic review Market outreach NDAs & first bids Finalists Selection Board authorizes a 60+ meetings with 42 parties engaged 6 bidders advance 6 → 1: MN8 selected The MN8 transaction full review of prospective buyers in process; 19 non- to Phase II diligence as the preferred strategic and strategic binding bids counterparty is expected to alternatives partners received and evaluated deliver the optimal value ADVISORS OTHER ALTERNATIVES of all available options EVALUATED A full process narrative and the LEGAL × Status Quo opinion of Greenbacker’s financial × Standalone advisor, Wells Fargo, delivered to the Board of Directors of Greenbacker in × Wind-down / dissolution connection with the transaction, will be included in the proxy statement / prospectus filed on Form S-4 7
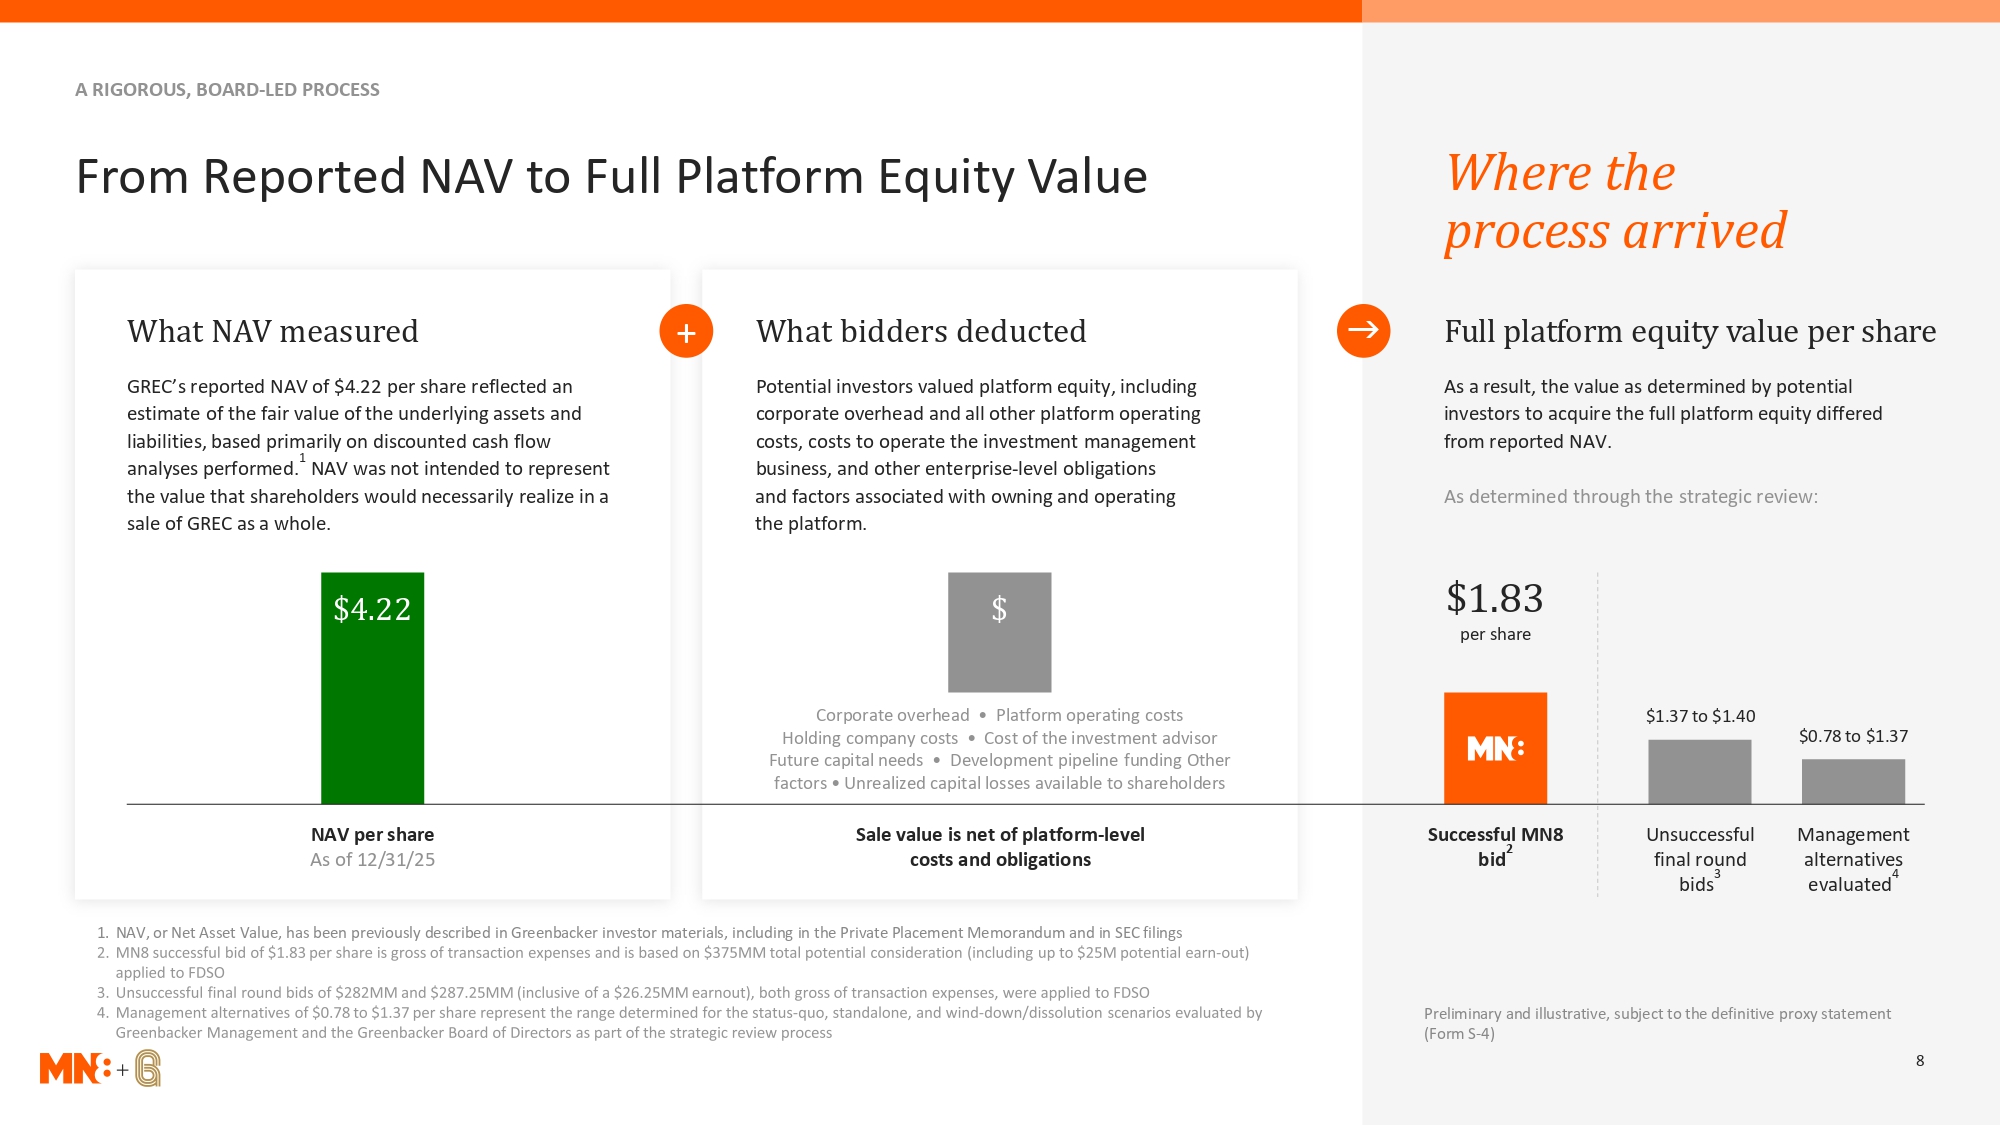
A RIGOROUS, BOARD-LED PROCESS From Reported NAV to Full Platform Equity Value Where the process arrived What NAV measured + What bidders deducted Full platform equity value per share GREC’s reported NAV of $4.22 per share reflected an Potential investors valued platform equity, including As a result, the value as determined by potential estimate of the fair value of the underlying assets and corporate overhead and all other platform operating investors to acquire the full platform equity differed liabilities, based primarily on discounted cash flow costs, costs to operate the investment management from reported NAV. 1 analyses performed. NAV was not intended to represent business, and other enterprise-level obligations the value that shareholders would necessarily realize in a and factors associated with owning and operating As determined through the strategic review: sale of GREC as a whole. the platform. $4.22 $ $1.83 per share Corporate overhead • Platform operating costs $1.37 to $1.40 Holding company costs • Cost of the investment advisor $0.78 to $1.37 Future capital needs • Development pipeline funding Other factors • Unrealized capital losses available to shareholders NAV per share Sale value is net of platform-level Successful MN8 Unsuccessful Management 2 As of 12/31/25 costs and obligations bid final round alternatives 3 4 bids evaluated 1. NAV, or Net Asset Value, has been previously described in Greenbacker investor materials, including in the Private Placement Memorandum and in SEC filings Preliminary and illustrative, subject to the definitive proxy statement (Form S-4) 8
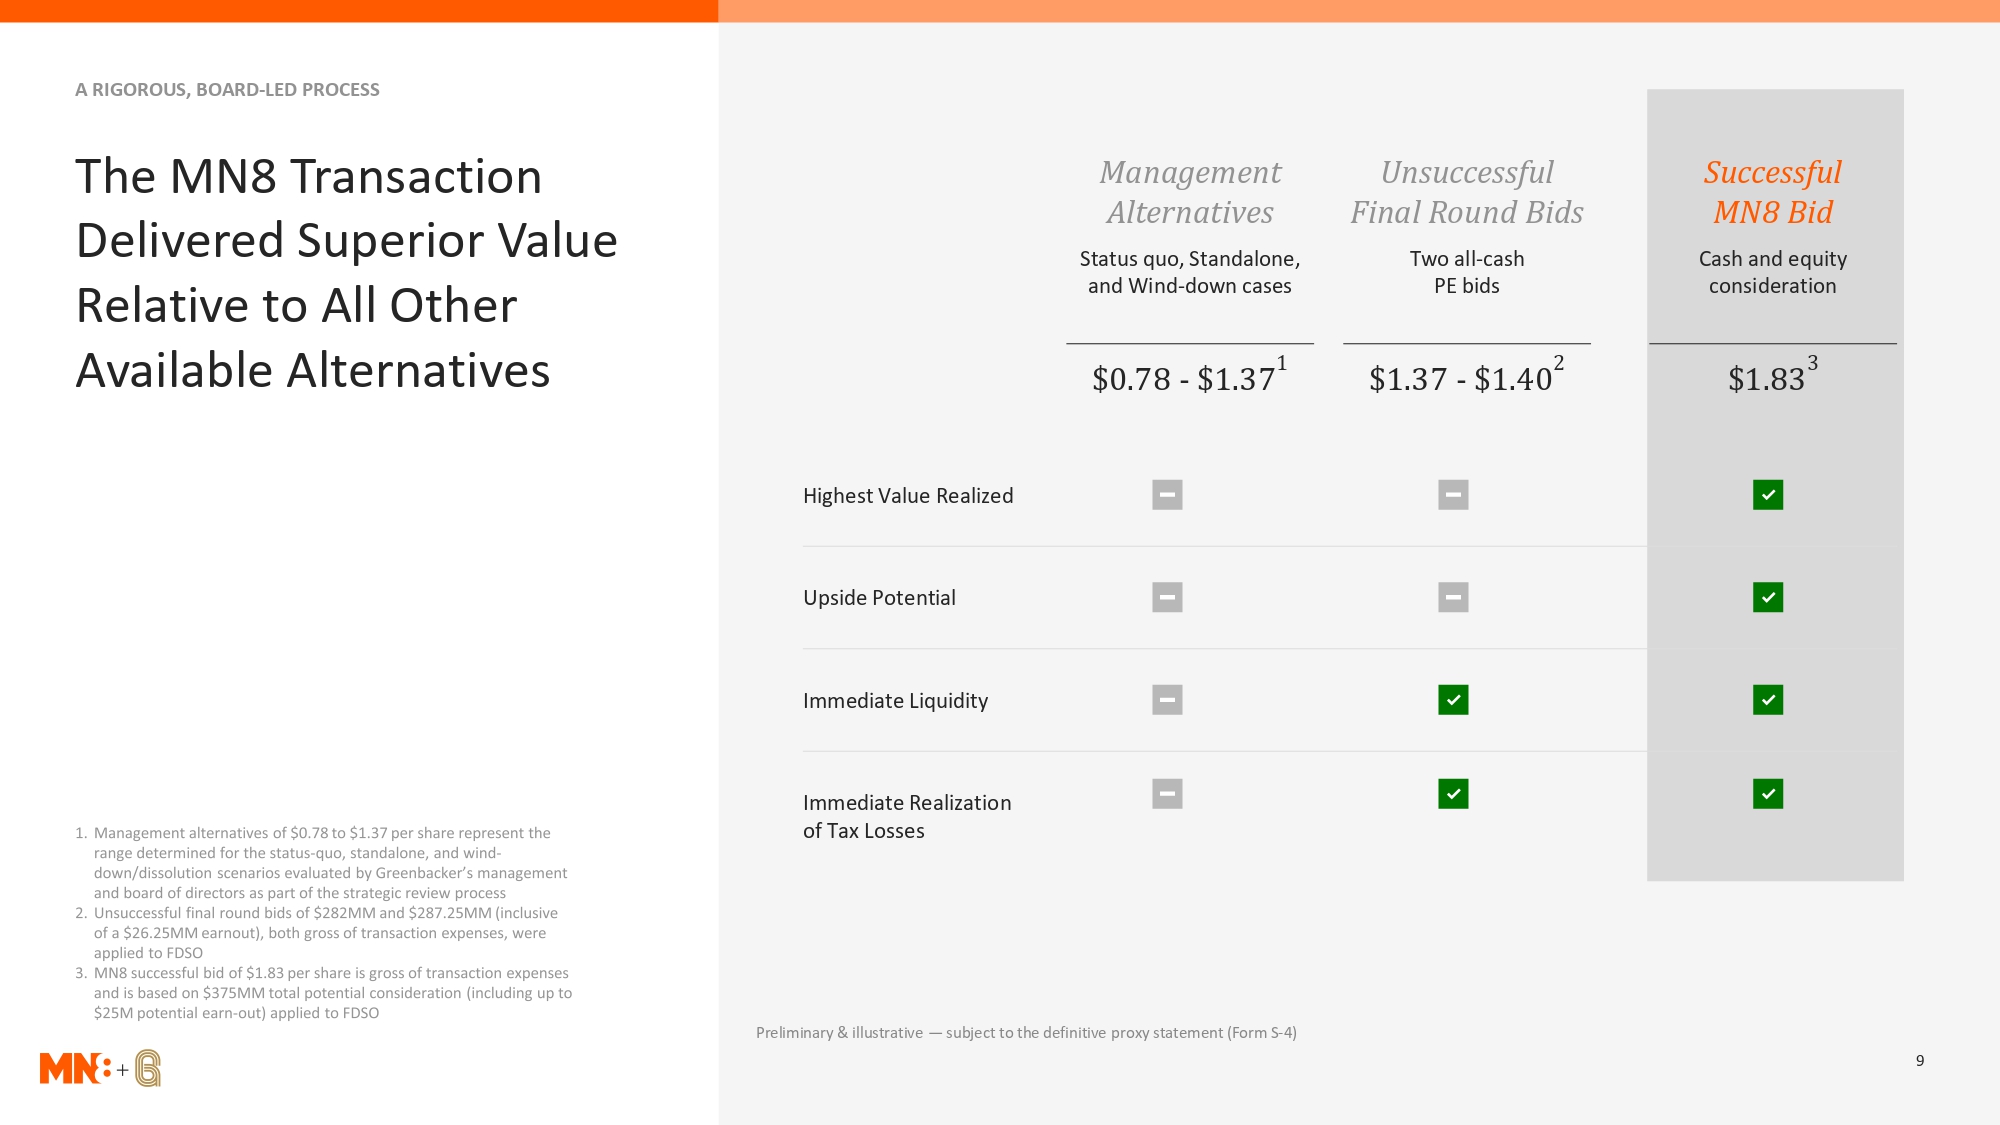
A RIGOROUS, BOARD-LED PROCESS The MN8 Transaction Management Unsuccessful Successful Alternatives Final Round Bids MN8 Bid Delivered Superior Value Status quo, Standalone, Two all-cash Cash and equity Relative to All Other and Wind-down cases PE bids consideration Available Alternatives $0.78 - $1.37 1 $1.37 - $1.40 2 $1.83 3 Highest Value Realized Upside Potential Immediate Liquidity Immediate Realization of Tax Losses Preliminary & illustrative — subject to the definitive proxy statement (Form S-4) 9
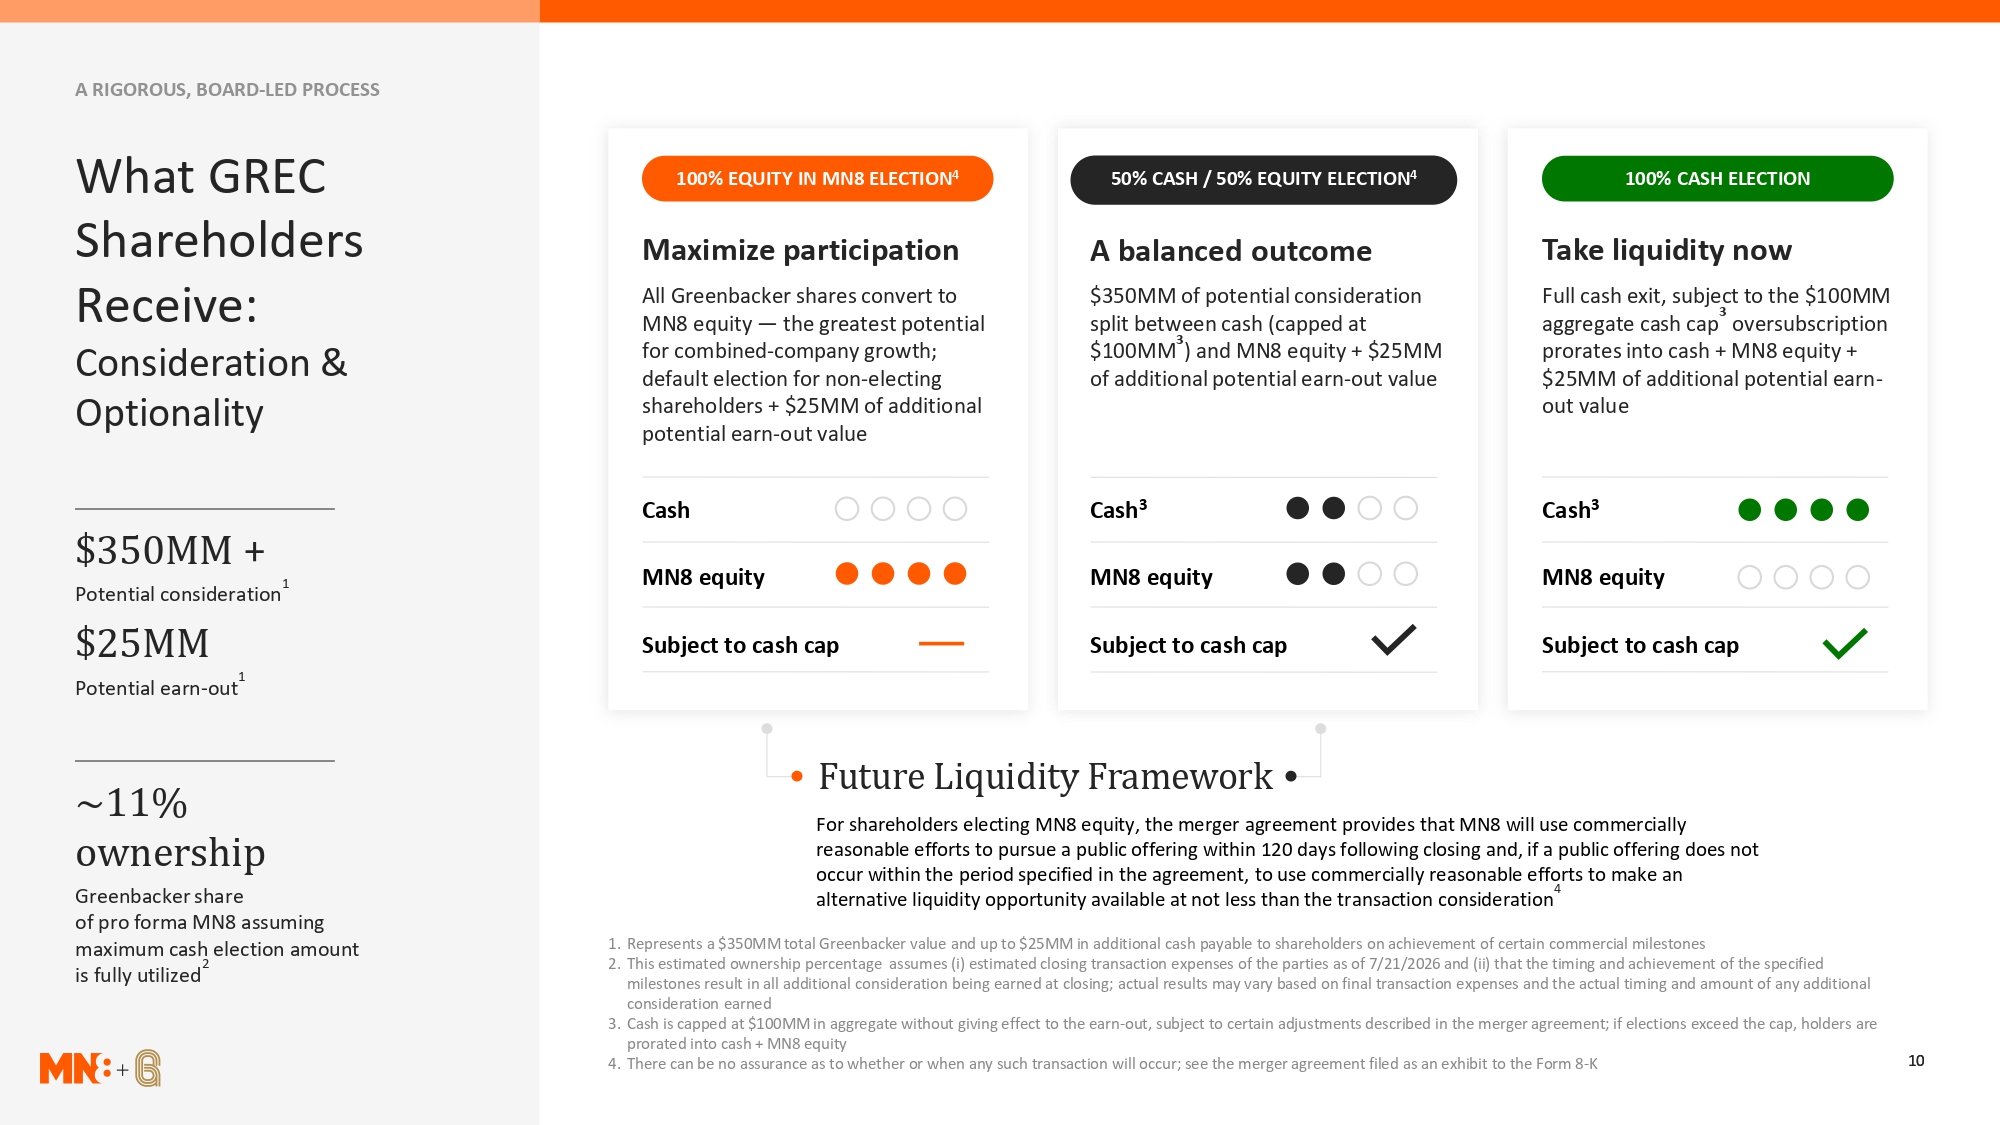
A RIGOROUS, BOARD-LED PROCESS What GREC 100% EQUITY IN MN8 ELECTION4 50% CASH / 50% EQUITY ELECTION4 100% CASH ELECTION Shareholders Maximize participation A balanced outcome Take liquidity now Receive: All Greenbacker shares convert to MN8 equity — the greatest potential $350MM of potential consideration split between cash (capped at 3 Full cash exit, subject to the $100MM 3 aggregate cash cap oversubscription Consideration & for combined-company growth; default election for non-electing $100MM ) and MN8 equity + $25MM of additional potential earn-out value prorates into cash + MN8 equity + $25MM of additional potential earn- Optionality shareholders + $25MM of additional potential earn-out value out value Cash Cash3 Cash3 $350MM + 1 MN8 equity MN8 equity MN8 equity Potential consideration $25MM Subject to cash cap Subject to cash cap Subject to cash cap 1 Potential earn-out Future Liquidity Framework ~11% For shareholders electing MN8 equity, the merger agreement provides that MN8 will use commercially ownership reasonable efforts to pursue a public offering within 120 days following closing and, if a public offering does not occur within the period specified in the agreement, to use commercially reasonable efforts to make an 4 Greenbacker share alternative liquidity opportunity available at not less than the transaction consideration of pro forma MN8 assuming maximum cash election amount 1. Represents a $350MM total Greenbacker value and up to $25MM in additional cash payable to shareholders on achievement of certain commercial milestones 2 2. This estimated ownership percentage assumes (i) estimated closing transaction expenses of the parties as of 7/21/2026 and (ii) that the timing and achievement of the specified is fully utilized milestones result in all additional consideration being earned at closing; actual results may vary based on final transaction expenses and the actual timing and amount of any additional consideration earned 3. Cash is capped at $100MM in aggregate without giving effect to the earn-out, subject to certain adjustments described in the merger agreement; if elections exceed the cap, holders are prorated into cash + MN8 equity 4. There can be no assurance as to whether or when any such transaction will occur; see the merger agreement filed as an exhibit to the Form 8-K 10

Two Strong Platforms, Better Together Each company brings substantial assets, deep capability, and a distinct footprint with minimal overlap PRESENTED BY Dan de Boer CEO, Greenbacker (presents Greenbacker) Jon Yoder President & CEO, MN8 (presents MN8 and the combination) 11
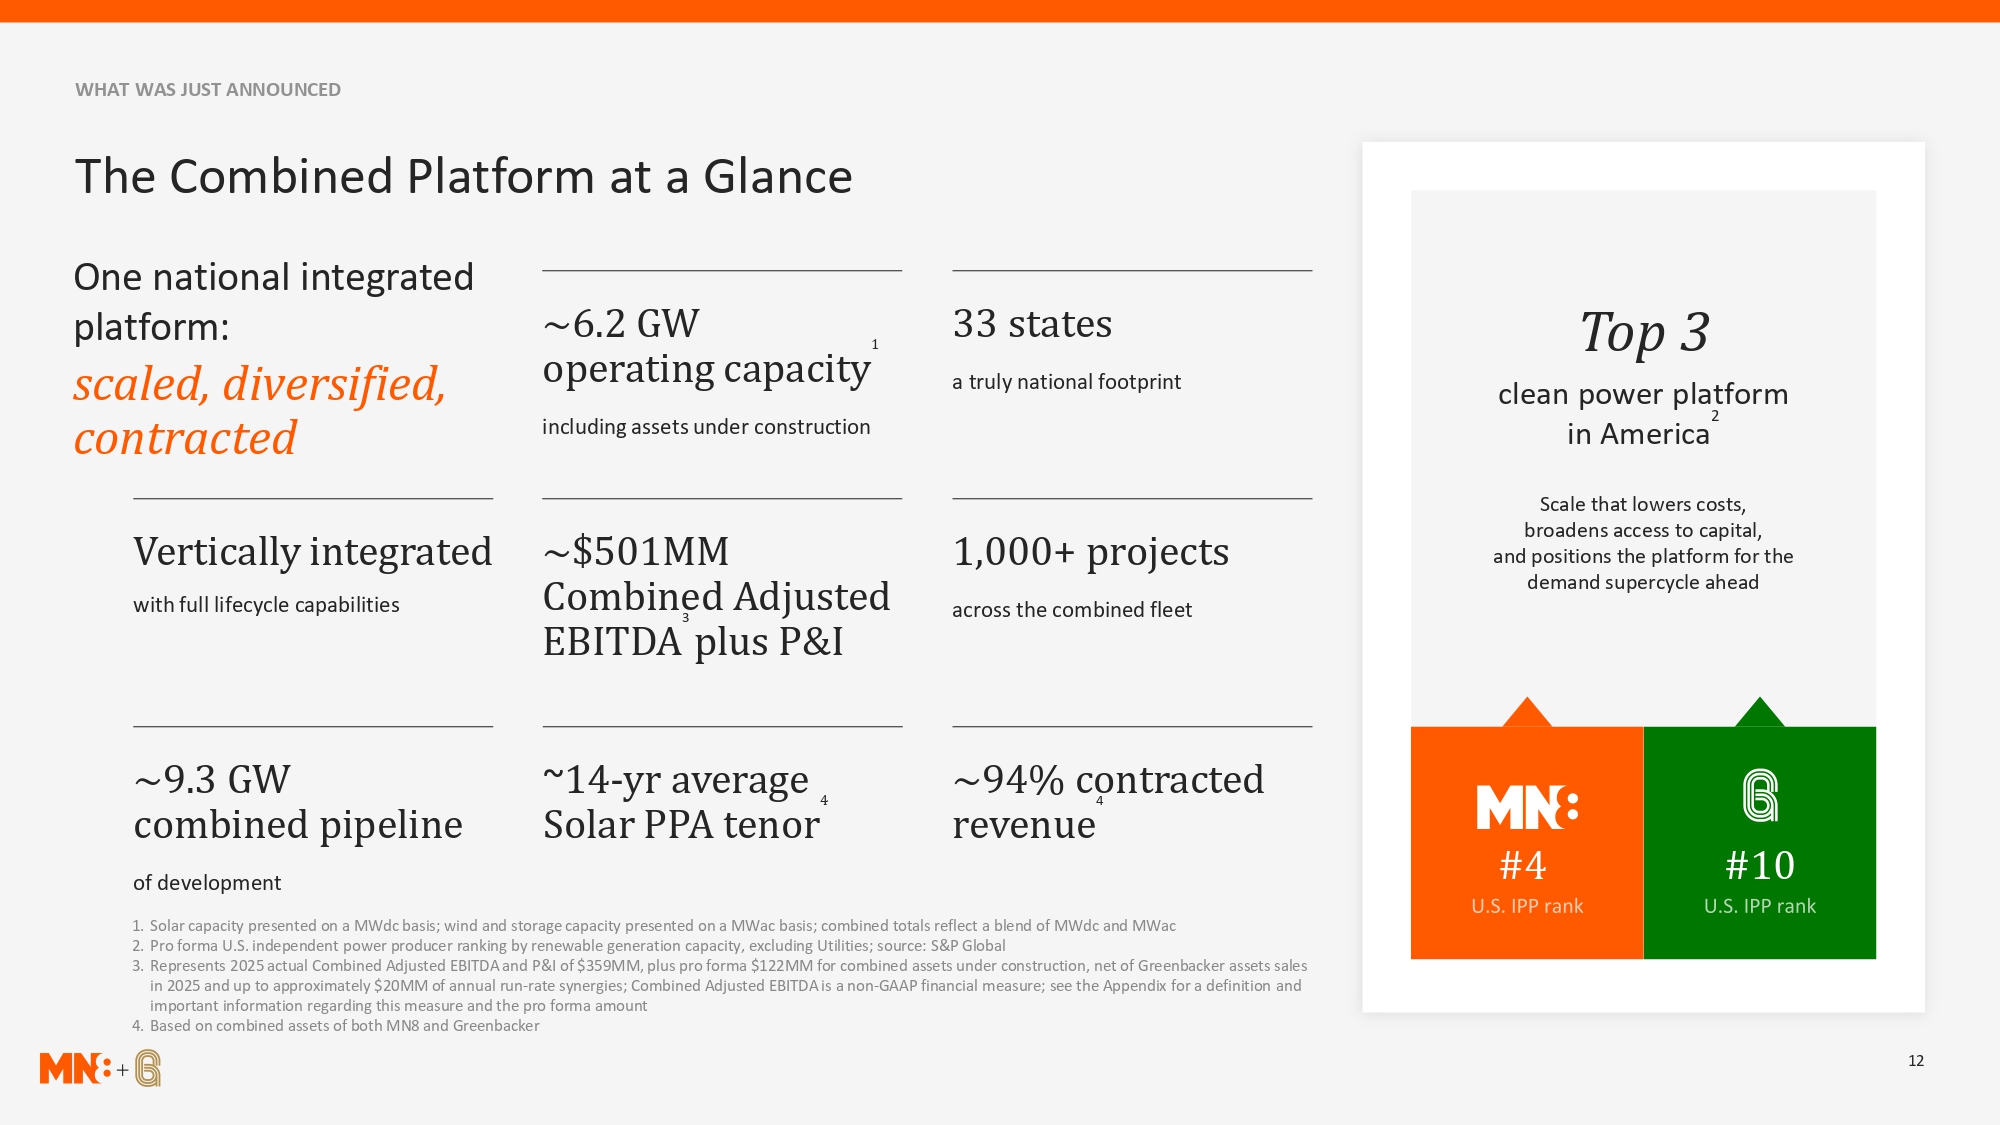
WHAT WAS JUST ANNOUNCED The Combined Platform at a Glance One national integrated platform: ~6.2 GW 1 33 states Top 3 scaled, diversified, operating capacity a truly national footprint clean power platform contracted 2 including assets under construction in America Scale that lowers costs, broadens access to capital, Vertically integrated ~$501MM 1,000+ projects and positions the platform for the demand supercycle ahead with full lifecycle capabilities Combined Adjusted 3 across the combined fleet EBITDA plus P&I ~9.3 GW ~14-yr average 4 ~94% contracted 4 combined pipeline Solar PPA tenor revenue of development #4 #10 1. Solar capacity presented on a MWdc basis; wind and storage capacity presented on a MWac basis; combined totals reflect a blend of MWdc and MWac 2. Pro forma U.S. independent power producer ranking by renewable generation capacity, excluding Utilities; source: S&P Global 3. Represents 2025 actual Combined Adjusted EBITDA and P&I of $359MM, plus pro forma $122MM for combined assets under construction, net of Greenbacker assets sales in 2025 and up to approximately $20MM of annual run-rate synergies; Combined Adjusted EBITDA is a non-GAAP financial measure; see the Appendix for a definition and important information regarding this measure and the pro forma amount 4. Based on combined assets of both MN8 and Greenbacker 12
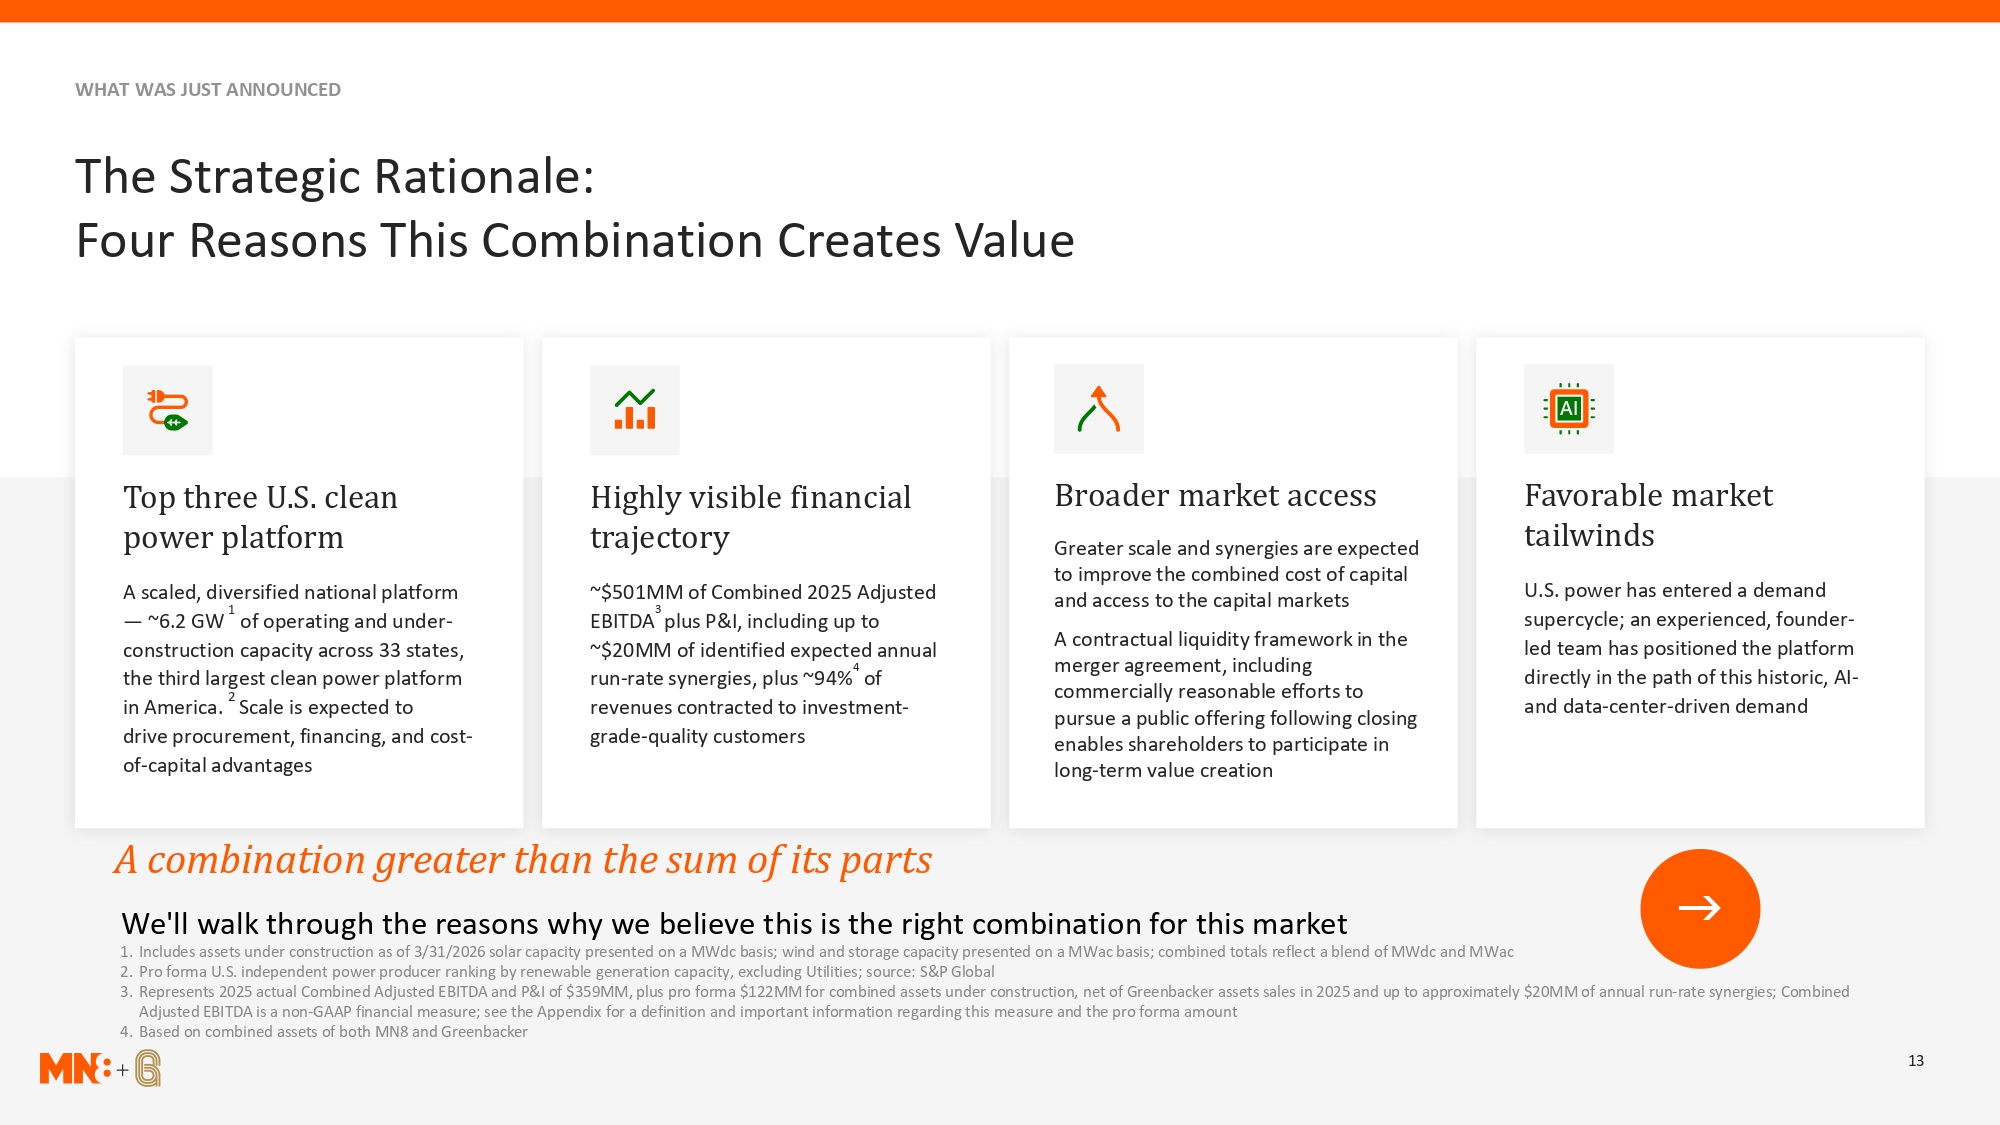
WHAT WAS JUST ANNOUNCED The Strategic Rationale: Four Reasons This Combination Creates Value Top three U.S. clean Highly visible financial Broader market access Favorable market power platform trajectory Greater scale and synergies are expected tailwinds to improve the combined cost of capital A scaled, diversified national platform ~$501MM of Combined 2025 Adjusted and access to the capital markets U.S. power has entered a demand 1 3 — ~6.2 GW of operating and under- EBITDA plus P&I, including up to supercycle; an experienced, founder- construction capacity across 33 states, ~$20MM of identified expected annual A contractual liquidity framework in the led team has positioned the platform 4 merger agreement, including the third largest clean power platform run-rate synergies, plus ~94% of directly in the path of this historic, AI- 2 commercially reasonable efforts to in America. Scale is expected to revenues contracted to investment- and data-center-driven demand pursue a public offering following closing drive procurement, financing, and cost- grade-quality customers enables shareholders to participate in of-capital advantages long-term value creation A combination greater than the sum of its parts We'll walk through the reasons why we believe this is the right combination for this market 1. Includes assets under construction as of 3/31/2026 solar capacity presented on a MWdc basis; wind and storage capacity presented on a MWac basis; combined totals reflect a blend of MWdc and MWac 2. Pro forma U.S. independent power producer ranking by renewable generation capacity, excluding Utilities; source: S&P Global 3. Represents 2025 actual Combined Adjusted EBITDA and P&I of $359MM, plus pro forma $122MM for combined assets under construction, net of Greenbacker assets sales in 2025 and up to approximately $20MM of annual run-rate synergies; Combined Adjusted EBITDA is a non-GAAP financial measure; see the Appendix for a definition and important information regarding this measure and the pro forma amount 4. Based on combined assets of both MN8 and Greenbacker 13
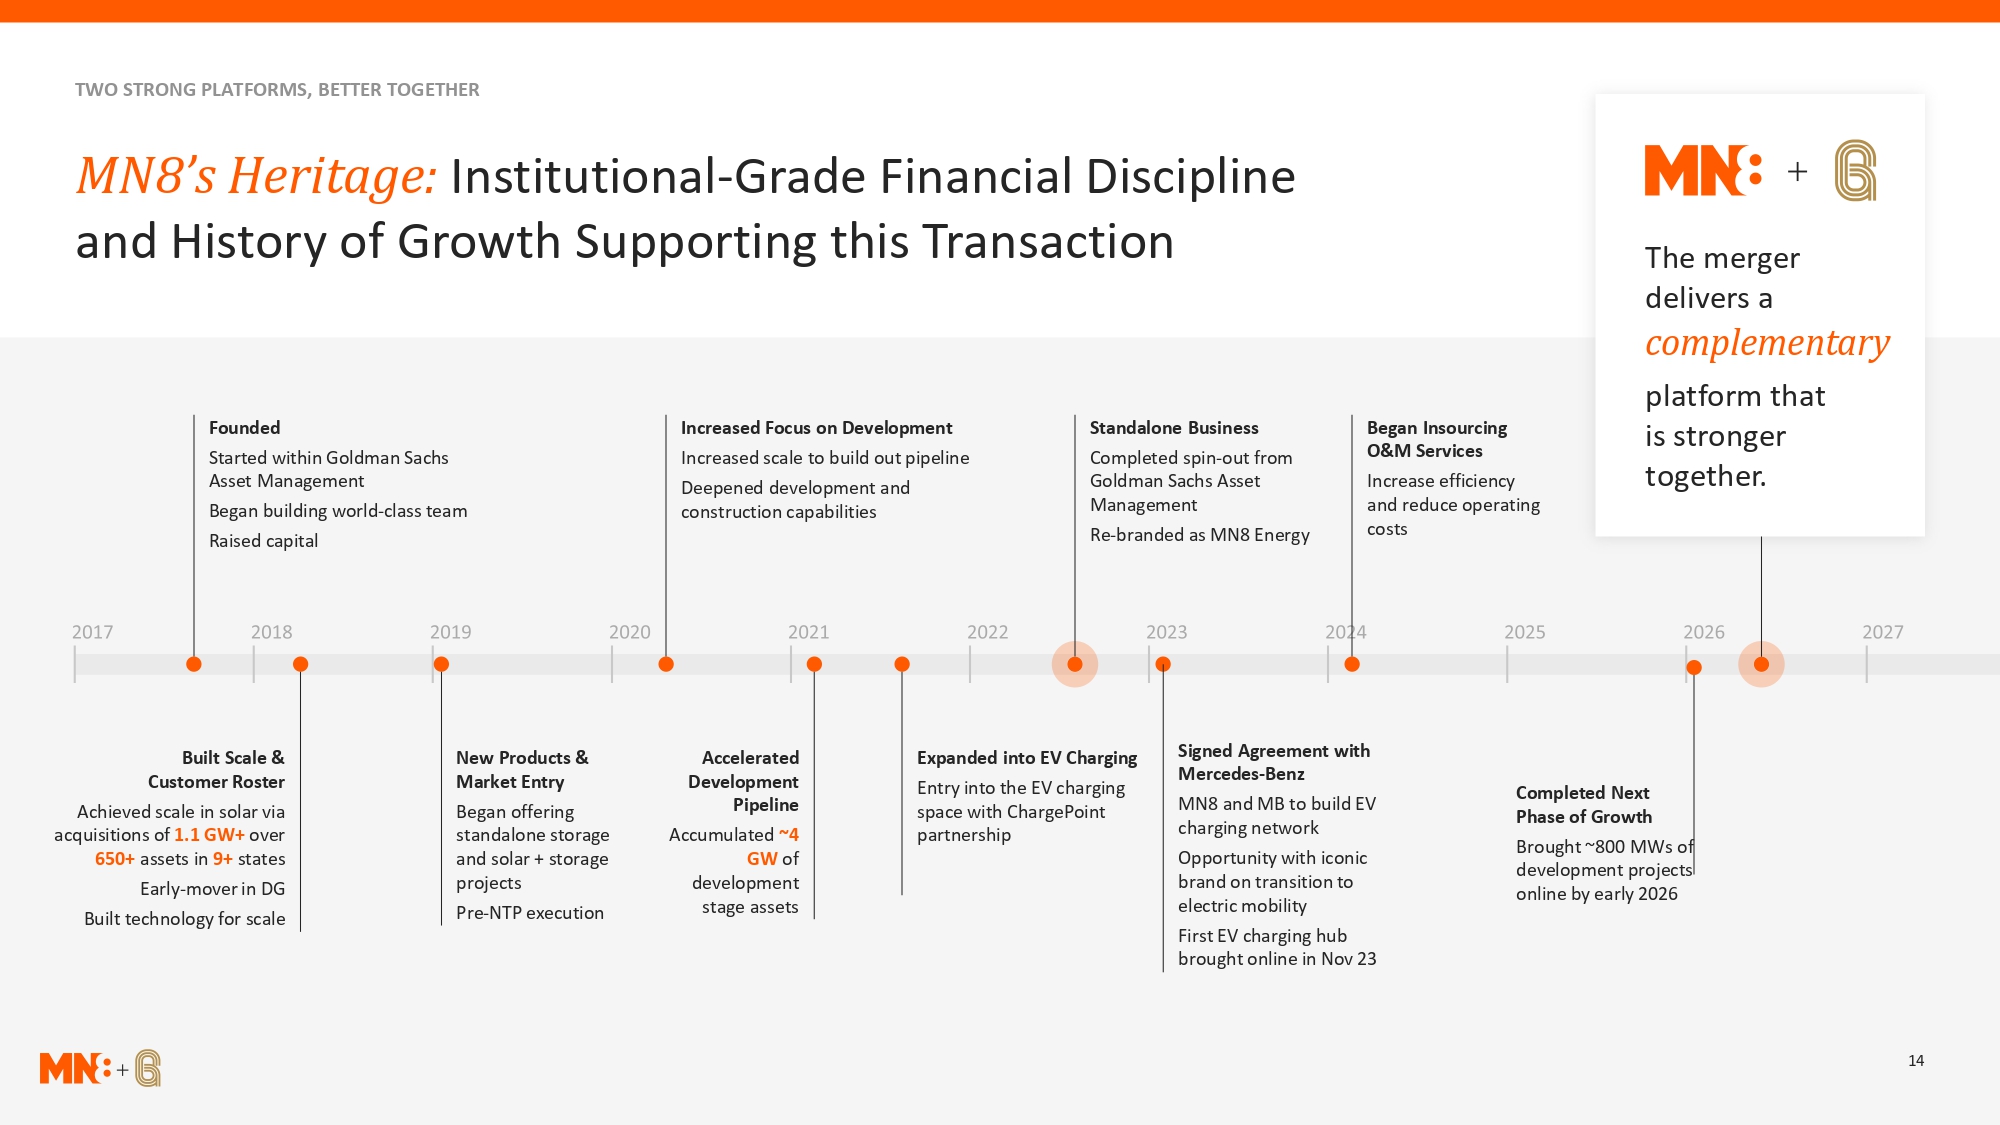
TWO STRONG PLATFORMS, BETTER TOGETHER MN8’s Heritage: Institutional-Grade Financial Discipline and History of Growth Supporting this Transaction The merger delivers a complementary platform that Founded Increased Focus on Development Standalone Business Began Insourcing O&M Services is stronger Started within Goldman Sachs Increased scale to build out pipeline Completed spin-out from Asset Management Deepened development and Goldman Sachs Asset Increase efficiency together. Began building world-class team construction capabilities Management and reduce operating Re-branded as MN8 Energy costs Raised capital Built Scale & New Products & Accelerated Expanded into EV Charging Signed Agreement with Customer Roster Market Entry Development Mercedes-Benz Entry into the EV charging Completed Next Achieved scale in solar via Began offering Pipeline space with ChargePoint MN8 and MB to build EV Phase of Growth acquisitions of 1.1 GW+ over standalone storage Accumulated ~4 partnership charging network Brought ~800 MWs of 650+ assets in 9+ states and solar + storage GW of Opportunity with iconic development projects Early-mover in DG projects development brand on transition to online by early 2026 Pre-NTP execution stage assets electric mobility Built technology for scale First EV charging hub brought online in Nov 23 14
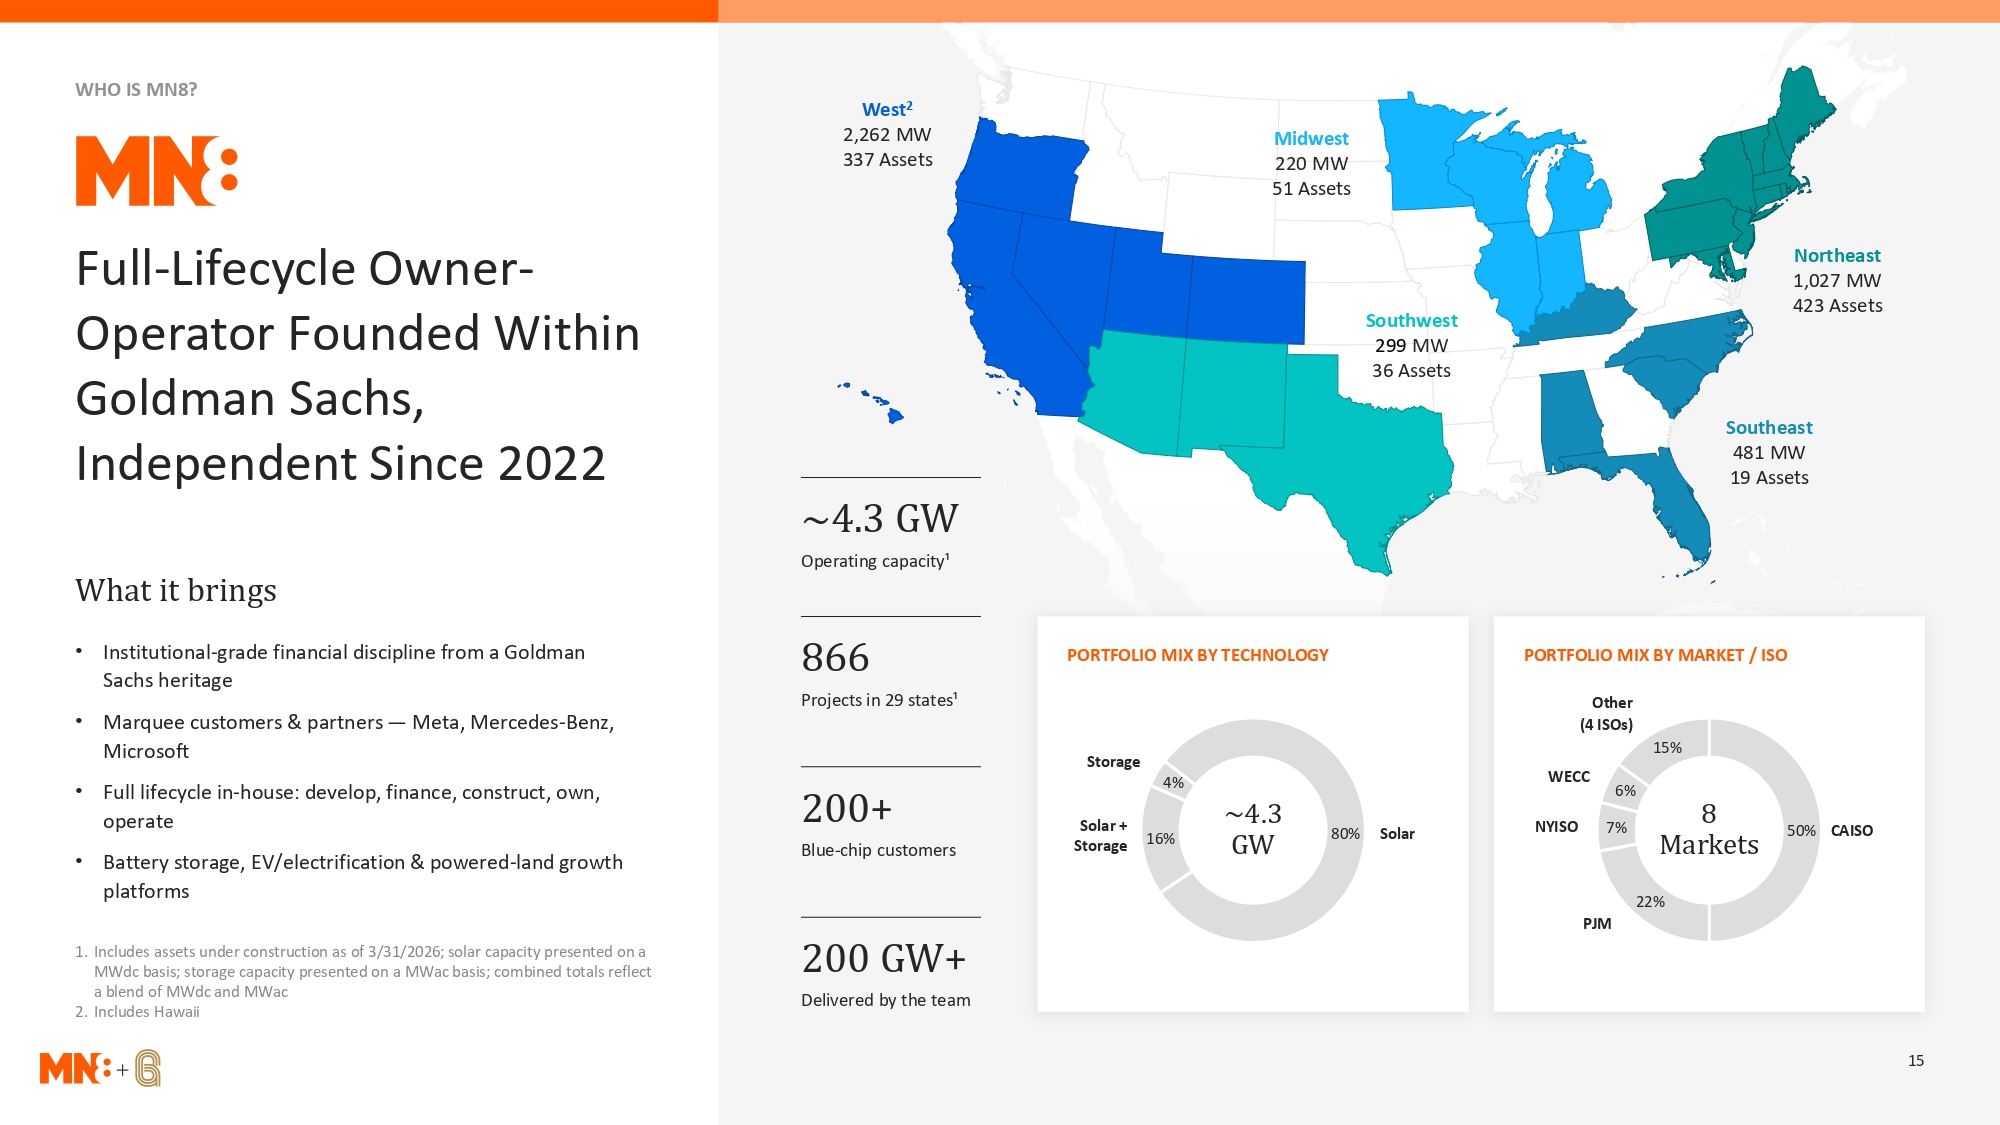
WHO IS MN8? West2 2,262 MW Midwest 337 Assets 220 MW 51 Assets Full-Lifecycle Owner- Northeast 1,027 MW 423 Assets Operator Founded Within Southwest 299 MW 36 Assets Goldman Sachs, Southeast Independent Since 2022 481 MW 19 Assets ~4.3 GW Operating capacity¹ What it brings • Institutional-grade financial discipline from a Goldman Sachs heritage 866 PORTFOLIO MIX BY TECHNOLOGY PORTFOLIO MIX BY MARKET / ISO Projects in 29 states¹ Other • Marquee customers & partners — Meta, Mercedes-Benz, (4 ISOs) Microsoft Storage 15% 4% WECC • Full lifecycle in-house: develop, finance, construct, own, 6% operate 200+ Solar + ~4.3 80% Solar NYISO 7% 8 50% CAISO • Battery storage, EV/electrification & powered-land growth Blue-chip customers Storage 16% GW Markets platforms 22% PJM 1. Includes assets under construction as of 3/31/2026; solar capacity presented on a MWdc basis; storage capacity presented on a MWac basis; combined totals reflect 200 GW+ a blend of MWdc and MWac Delivered by the team 2. Includes Hawaii 15
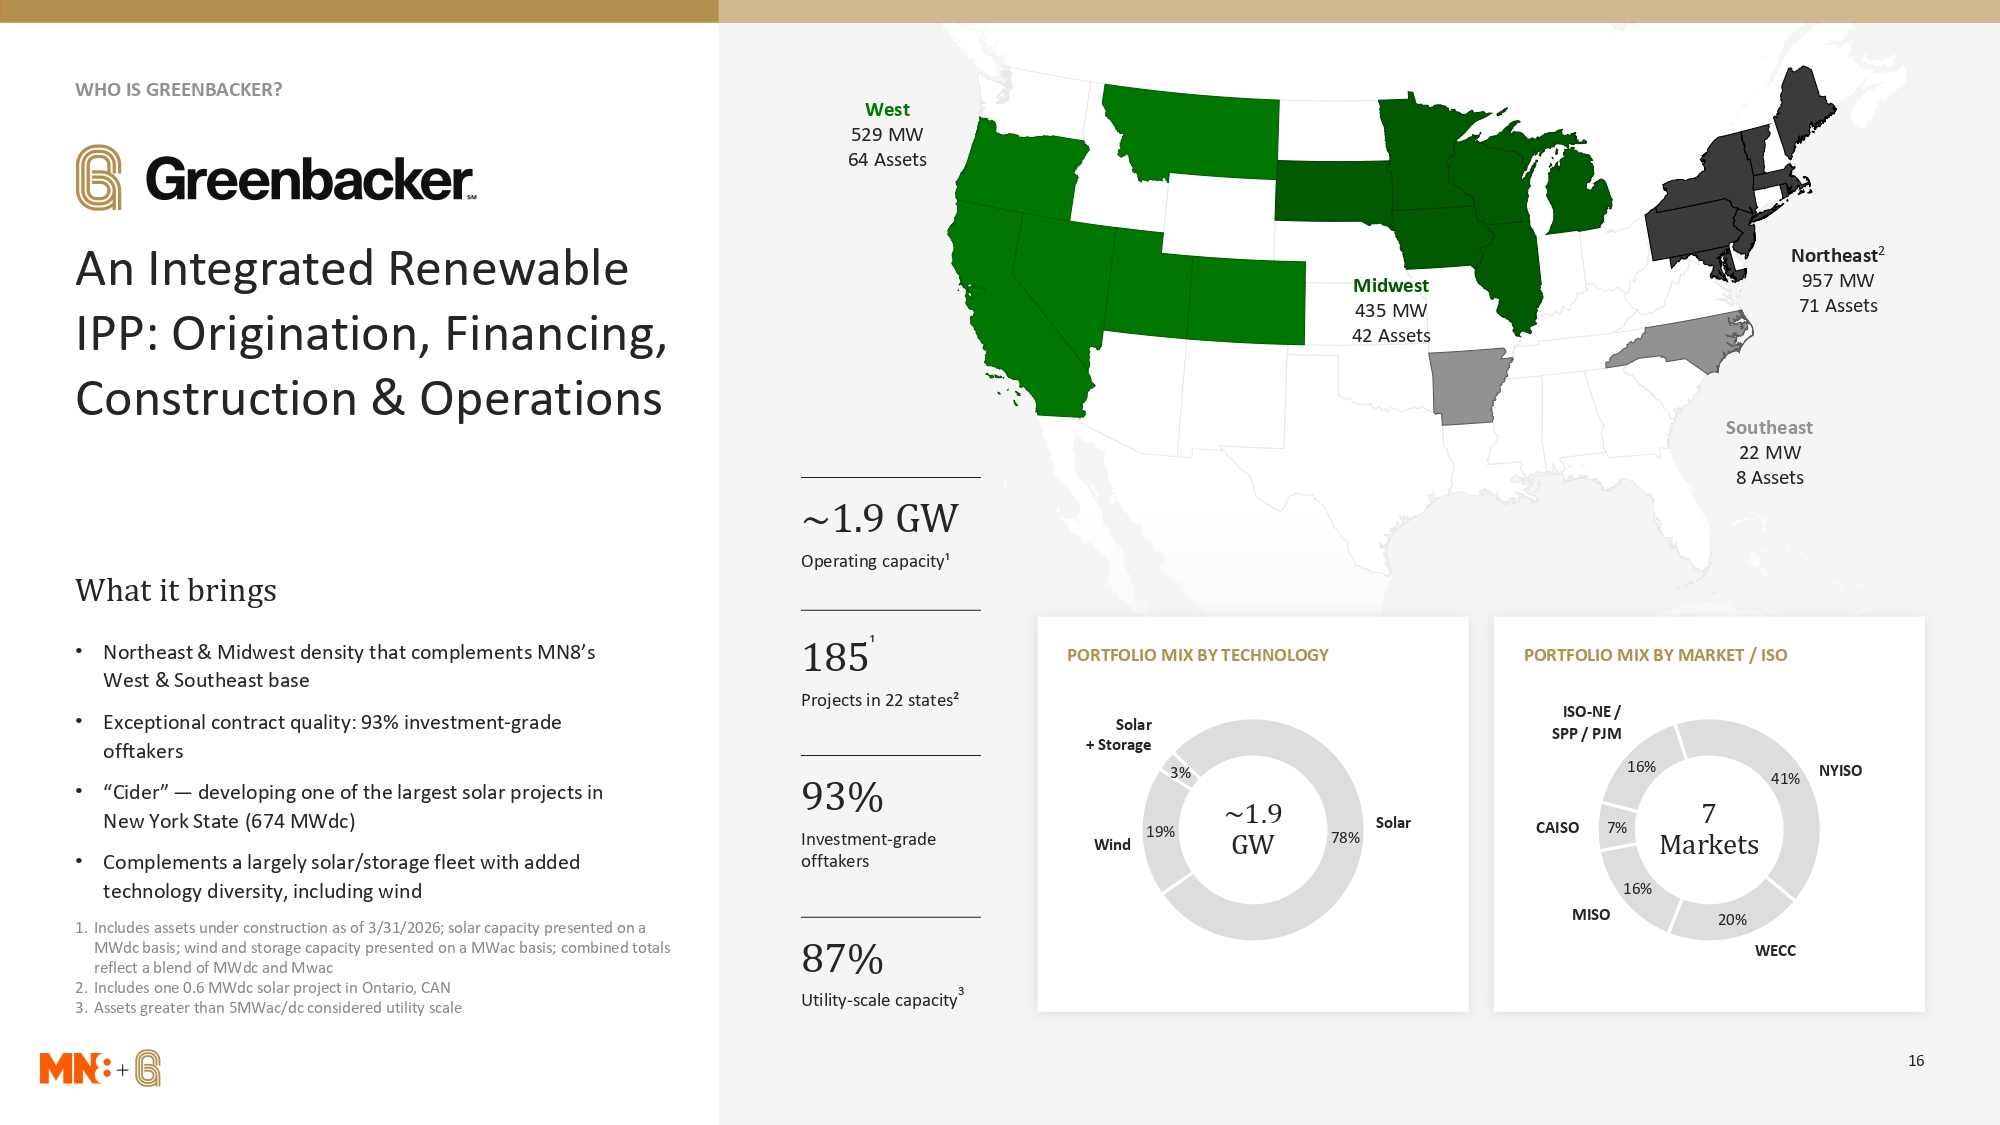
WHO IS GREENBACKER? West 529 MW 64 Assets An Integrated Renewable Midwest Northeast2 957 MW 71 Assets IPP: Origination, Financing, 435 MW 42 Assets Construction & Operations Southeast 22 MW 8 Assets ~1.9 GW Operating capacity¹ What it brings ¹ • Northeast & Midwest density that complements MN8’s West & Southeast base 185 PORTFOLIO MIX BY TECHNOLOGY PORTFOLIO MIX BY MARKET / ISO Projects in 22 states² ISO-NE / • Exceptional contract quality: 93% investment-grade Solar SPP / PJM offtakers + Storage 3% 16% NYISO 41% • “Cider” — developing one of the largest solar projects in New York State (674 MWdc) 93% ~1.9 Solar 7 19% CAISO 7% Investment-grade 78% • Complements a largely solar/storage fleet with added offtakers Wind GW Markets technology diversity, including wind 16% MISO 20% 1. Includes assets under construction as of 3/31/2026; solar capacity presented on a MWdc basis; wind and storage capacity presented on a MWac basis; combined totals reflect a blend of MWdc and Mwac 87% WECC 2. Includes one 0.6 MWdc solar project in Ontario, CAN 3 3. Assets greater than 5MWac/dc considered utility scale Utility-scale capacity 16
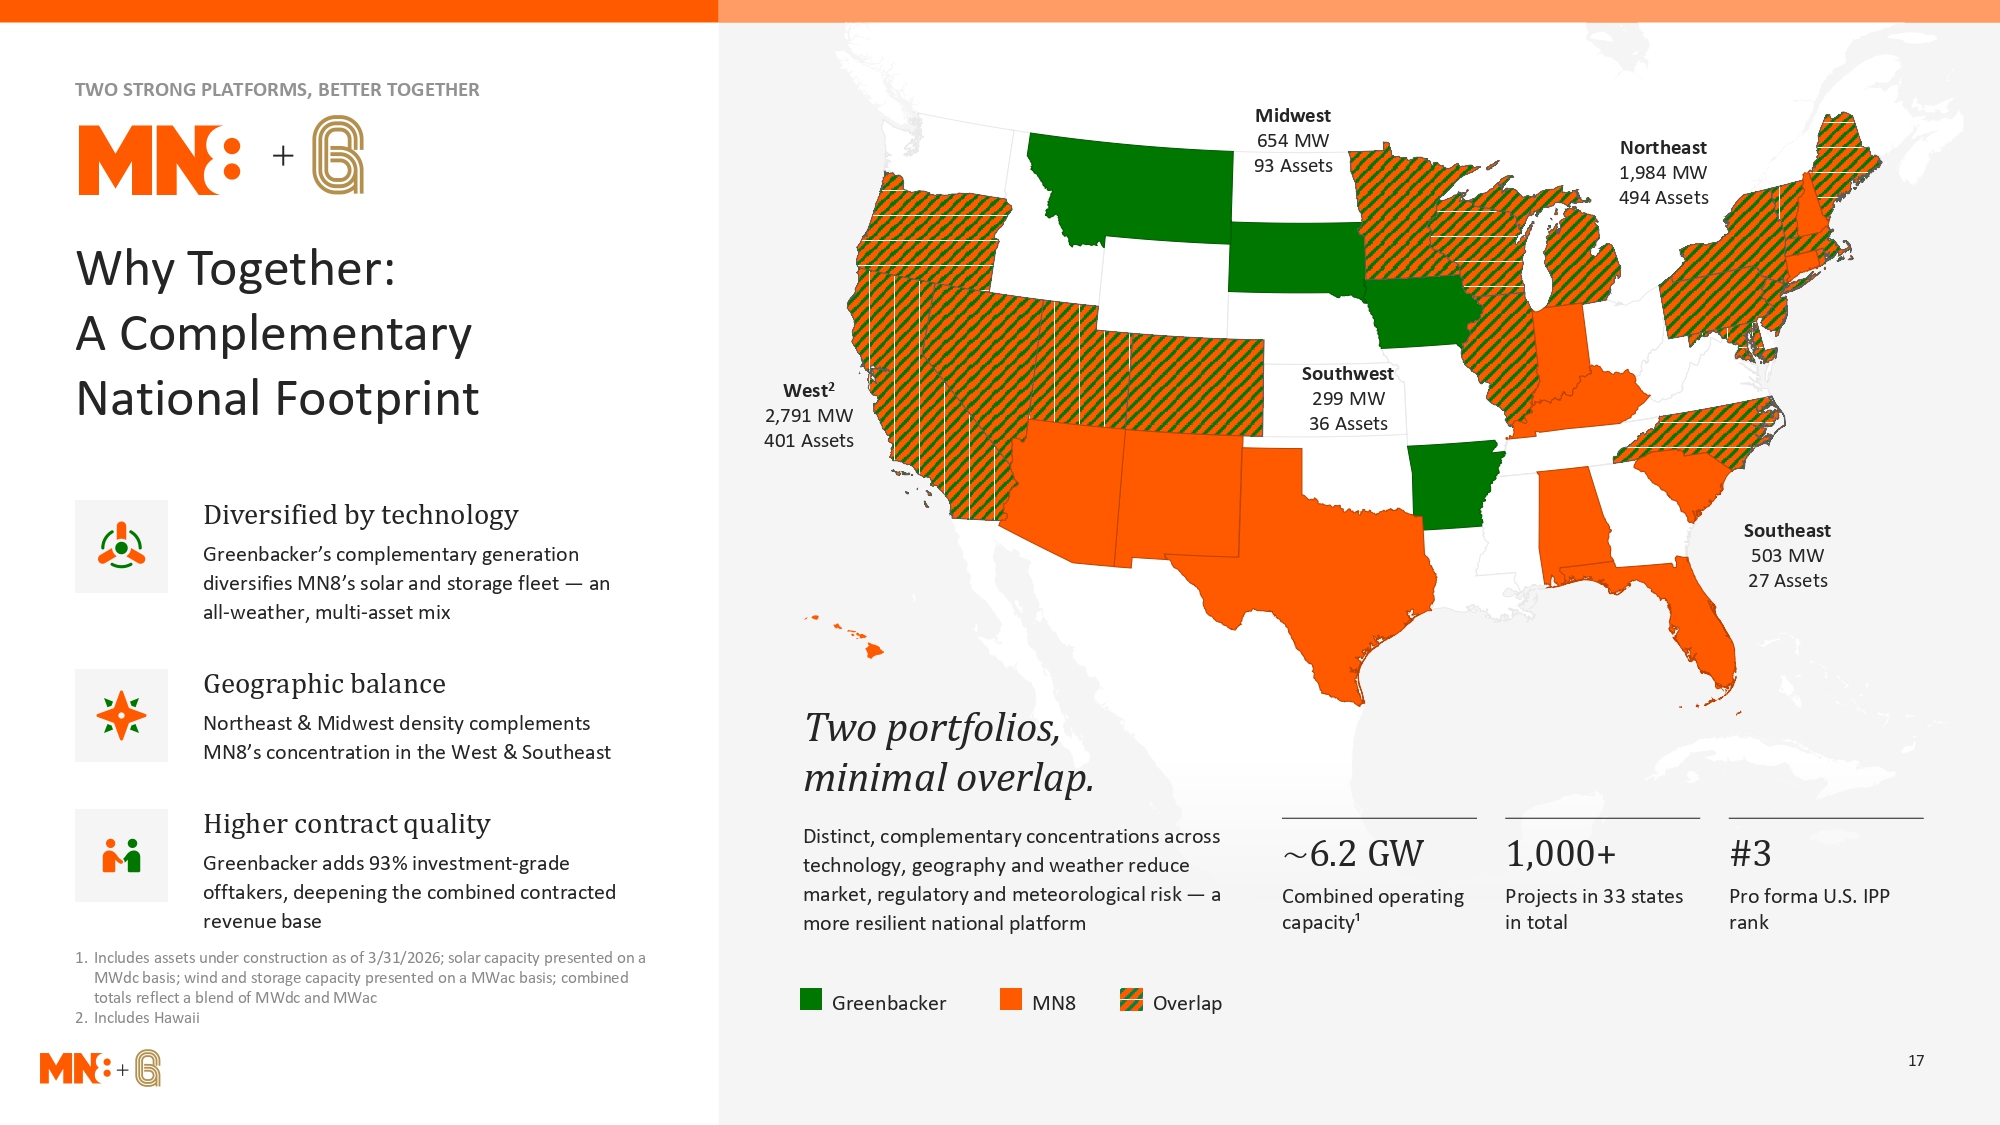
TWO STRONG PLATFORMS, BETTER TOGETHER Midwest 654 MW Northeast 93 Assets 1,984 MW 494 Assets Why Together: A Complementary Southwest National Footprint West2 2,791 MW 299 MW 36 Assets 401 Assets Diversified by technology Southeast Greenbacker’s complementary generation 503 MW diversifies MN8’s solar and storage fleet — an 27 Assets all-weather, multi-asset mix Geographic balance Northeast & Midwest density complements MN8’s concentration in the West & Southeast Two portfolios, minimal overlap. Higher contract quality Distinct, complementary concentrations across Greenbacker adds 93% investment-grade technology, geography and weather reduce ~6.2 GW 1,000+ #3 offtakers, deepening the combined contracted market, regulatory and meteorological risk — a Combined operating Projects in 33 states Pro forma U.S. IPP revenue base more resilient national platform capacity¹ in total rank 1. Includes assets under construction as of 3/31/2026; solar capacity presented on a MWdc basis; wind and storage capacity presented on a MWac basis; combined totals reflect a blend of MWdc and MWac Greenbacker MN8 Overlap 2. Includes Hawaii 17
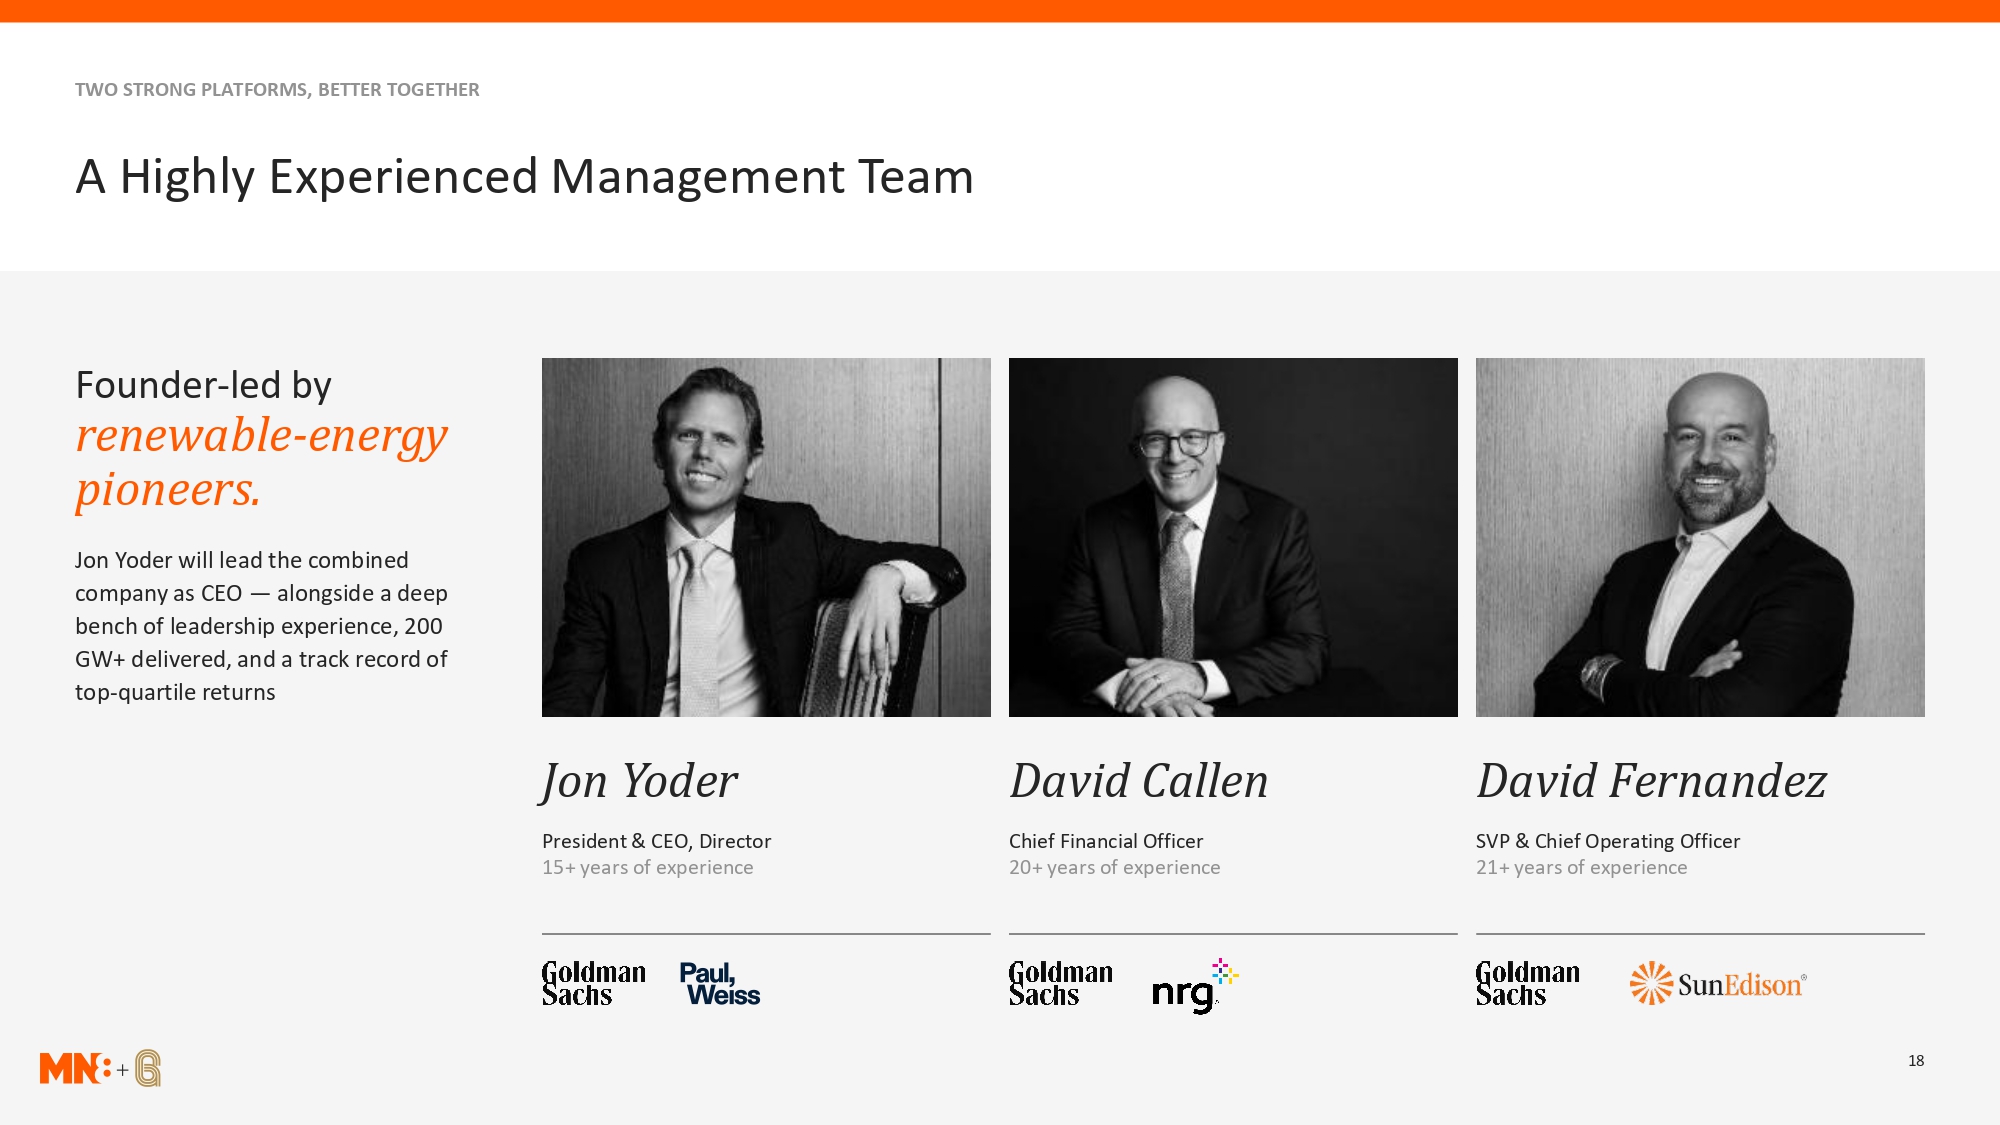
TWO STRONG PLATFORMS, BETTER TOGETHER A Highly Experienced Management Team Founder-led by renewable-energy pioneers. Jon Yoder will lead the combined company as CEO — alongside a deep bench of leadership experience, 200 GW+ delivered, and a track record of top-quartile returns Jon Yoder David Callen David Fernandez President & CEO, Director Chief Financial Officer SVP & Chief Operating Officer 15+ years of experience 20+ years of experience 21+ years of experience 18
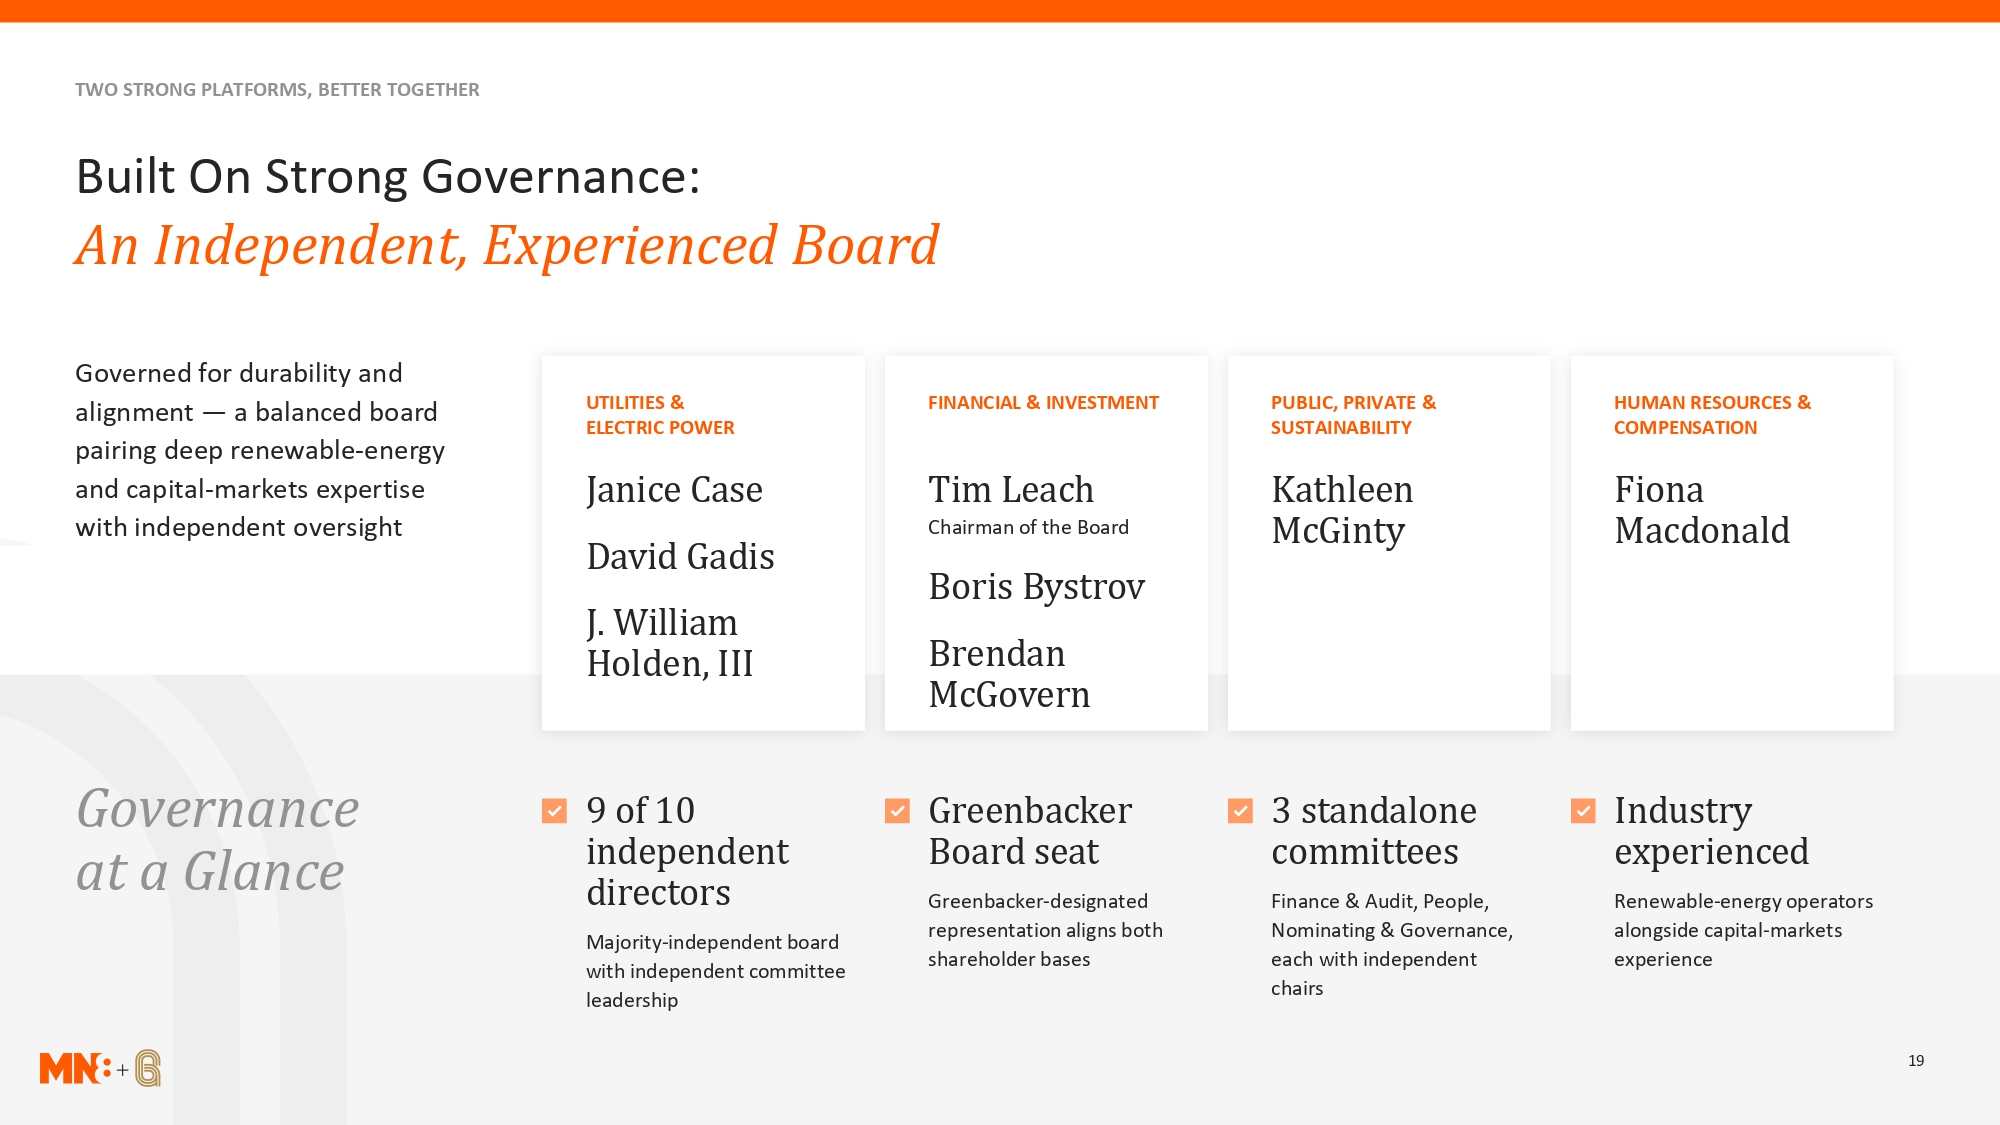
TWO STRONG PLATFORMS, BETTER TOGETHER Built On Strong Governance: An Independent, Experienced Board Governed for durability and UTILITIES & FINANCIAL & INVESTMENT PUBLIC, PRIVATE & HUMAN RESOURCES & alignment — a balanced board ELECTRIC POWER SUSTAINABILITY COMPENSATION pairing deep renewable-energy and capital-markets expertise Janice Case Tim Leach Kathleen Fiona with independent oversight Chairman of the Board McGinty Macdonald David Gadis Boris Bystrov J. William Holden, III Brendan McGovern Governance 9 of 10 Greenbacker 3 standalone Industry independent Board seat committees experienced at a Glance directors Greenbacker-designated Finance & Audit, People, Renewable-energy operators representation aligns both Nominating & Governance, alongside capital-markets Majority-independent board shareholder bases each with independent experience with independent committee chairs leadership 19
Not Just Bigger—Better Contracted, long-tenor, investment-grade cash flows; a credible synergy build-up; and a funded path to value maximization PRESENTED BY David Callen Chief Financial Officer, MN8 Carl Weatherley-White Chief Financial Officer, Greenbacker 20
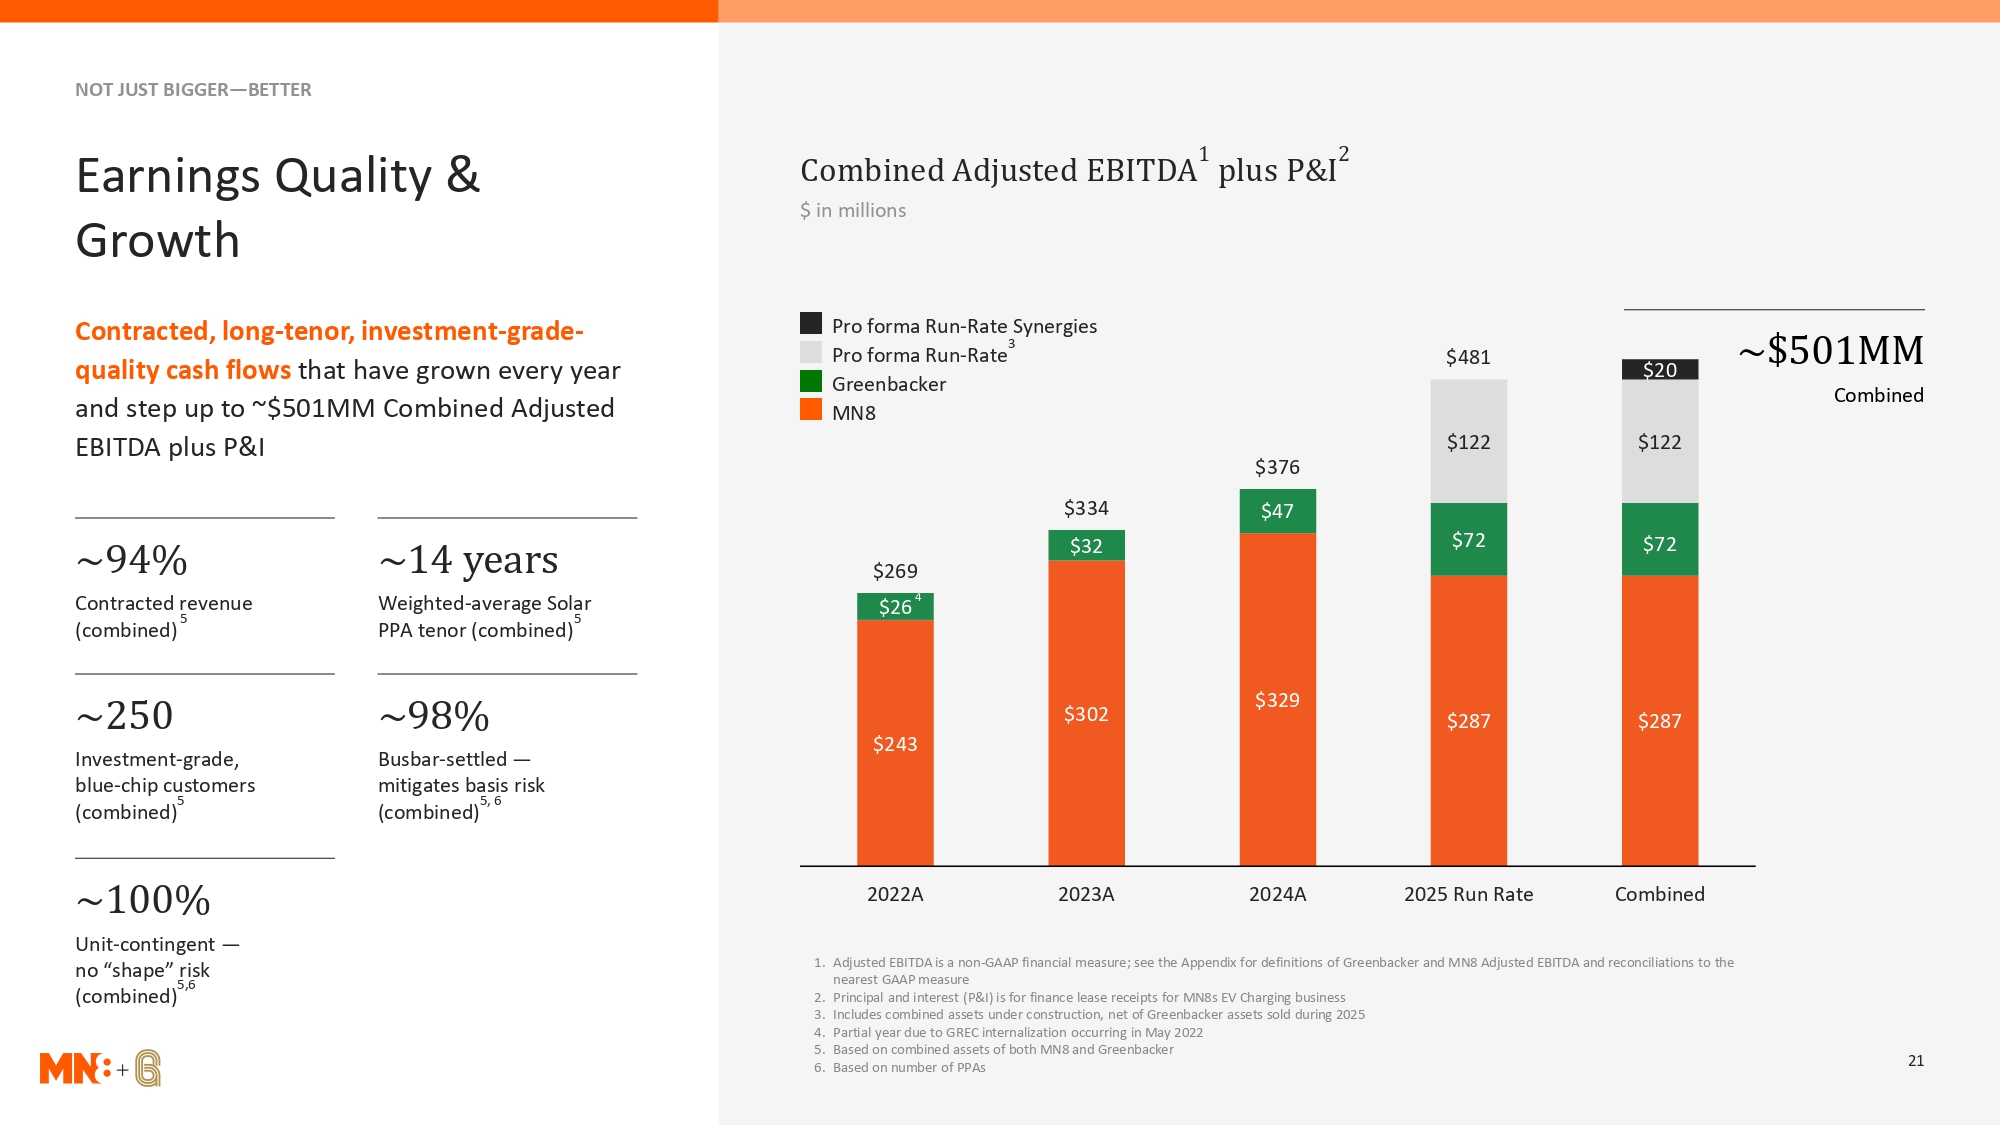
NOT JUST BIGGER—BETTER Earnings Quality & 1 2 Combined Adjusted EBITDA plus P&I $ in millions Growth Contracted, long-tenor, investment-grade- Pro forma Run-Rate Synergies quality cash flows that have grown every year Pro forma Run-Rate3 $481 $20 ~$501MM Greenbacker Combined and step up to ~$501MM Combined Adjusted MN8 EBITDA plus P&I $122 $122 $376 $334 $47 $32 $72 $72 ~94% ~14 years $269 Contracted revenue Weighted-average Solar $26 4 5 5 (combined) PPA tenor (combined) $329 ~250 ~98% $302 $287 $287 $243 Investment-grade, Busbar-settled — blue-chip customers mitigates basis risk 5 5, 6 (combined) (combined) ~100% 2022A 2023A 2024A 2025 Run Rate Combined Unit-contingent — 1. Adjusted EBITDA is a non-GAAP financial measure; see the Appendix for definitions of Greenbacker and MN8 Adjusted EBITDA and reconciliations to the no “shape” risk nearest GAAP measure 5,6 (combined) 2. Principal and interest (P&I) is for finance lease receipts for MN8s EV Charging business 3. Includes combined assets under construction, net of Greenbacker assets sold during 2025 4. Partial year due to GREC internalization occurring in May 2022 5. Based on combined assets of both MN8 and Greenbacker 6. Based on number of PPAs 21
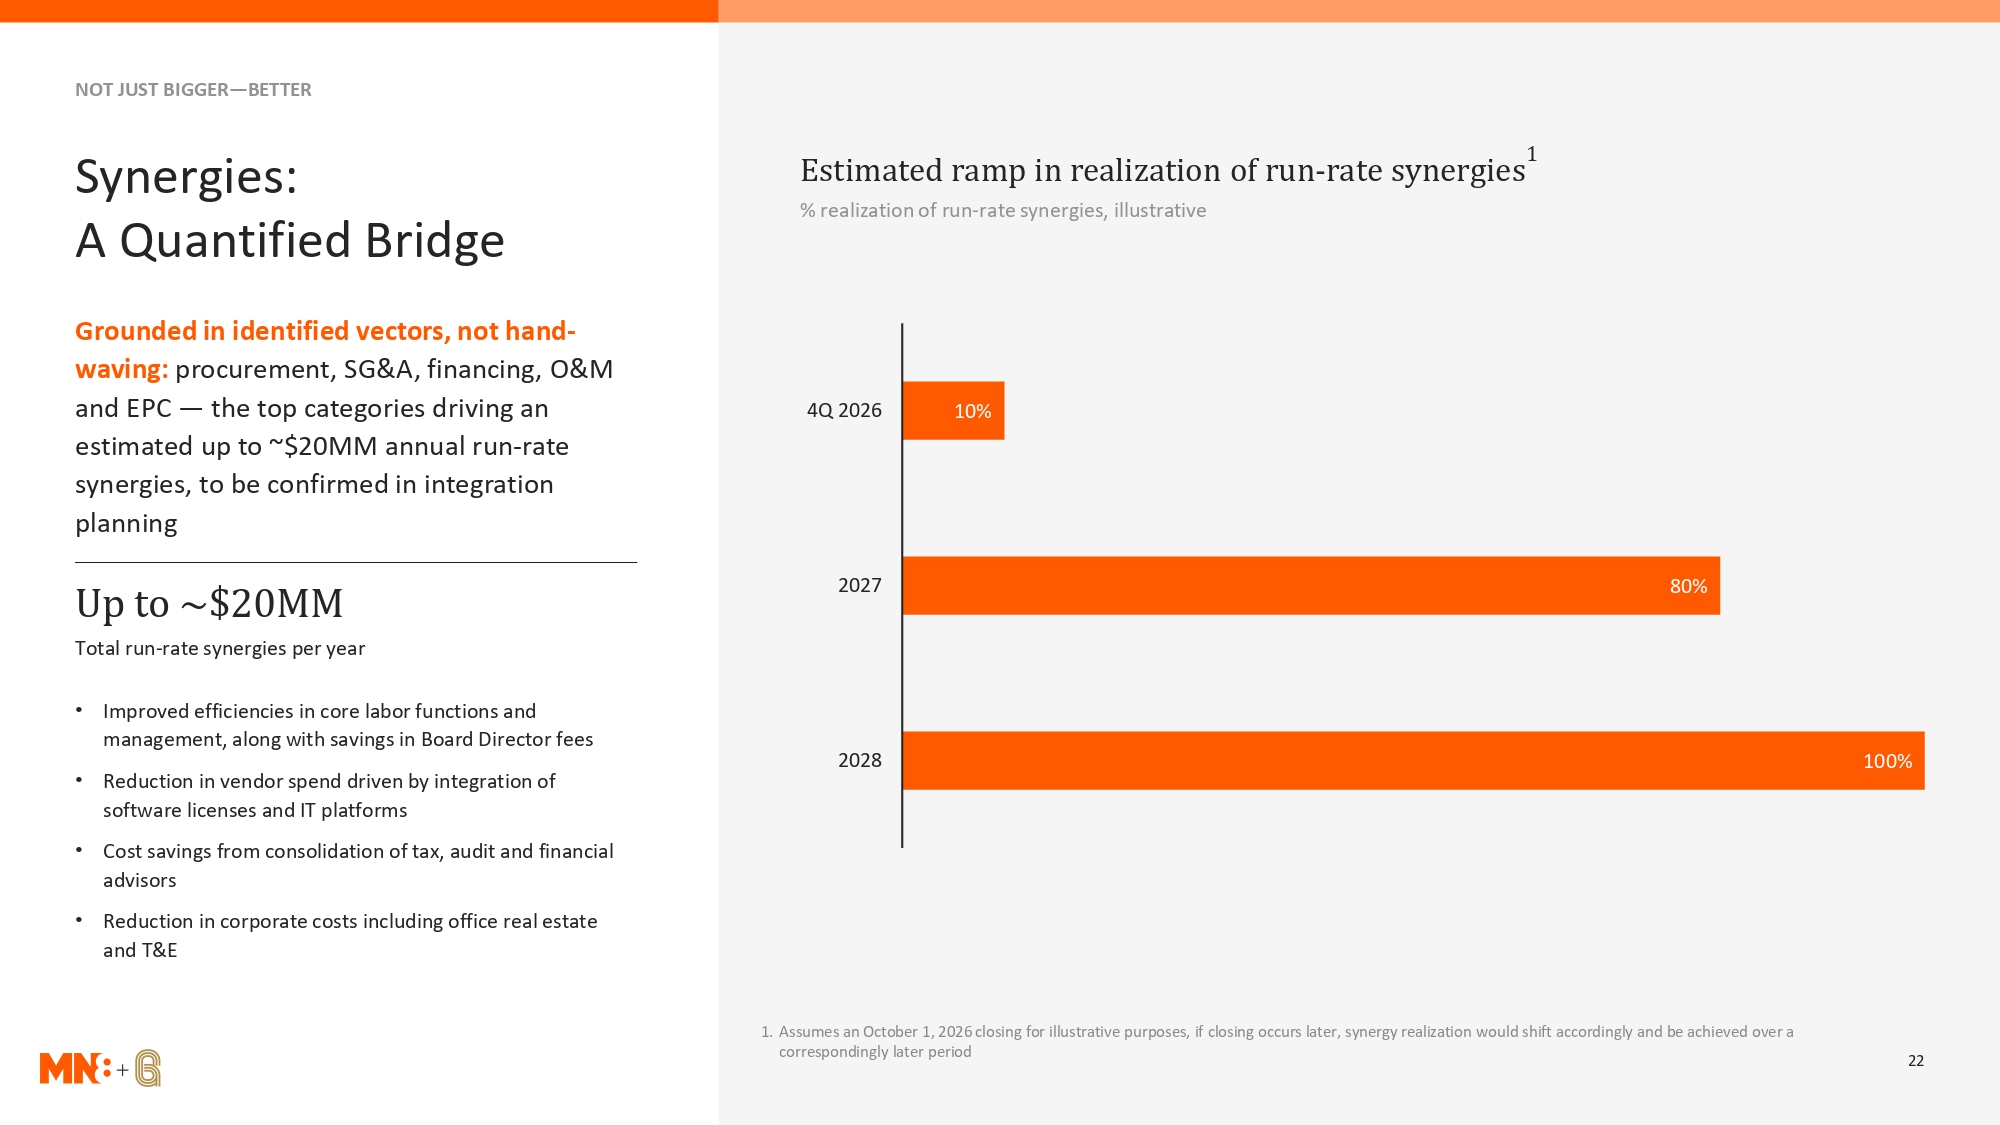
NOT JUST BIGGER—BETTER Synergies: 1 Estimated ramp in realization of run-rate synergies % realization of run-rate synergies, illustrative A Quantified Bridge Grounded in identified vectors, not hand- waving: procurement, SG&A, financing, O&M and EPC — the top categories driving an 4Q 2026 10% estimated up to ~$20MM annual run-rate synergies, to be confirmed in integration planning 2027 80% Up to ~$20MM Total run-rate synergies per year • Improved efficiencies in core labor functions and management, along with savings in Board Director fees 2028 100% • Reduction in vendor spend driven by integration of software licenses and IT platforms • Cost savings from consolidation of tax, audit and financial advisors • Reduction in corporate costs including office real estate and T&E 1. Assumes an October 1, 2026 closing for illustrative purposes, if closing occurs later, synergy realization would shift accordingly and be achieved over a correspondingly later period 22
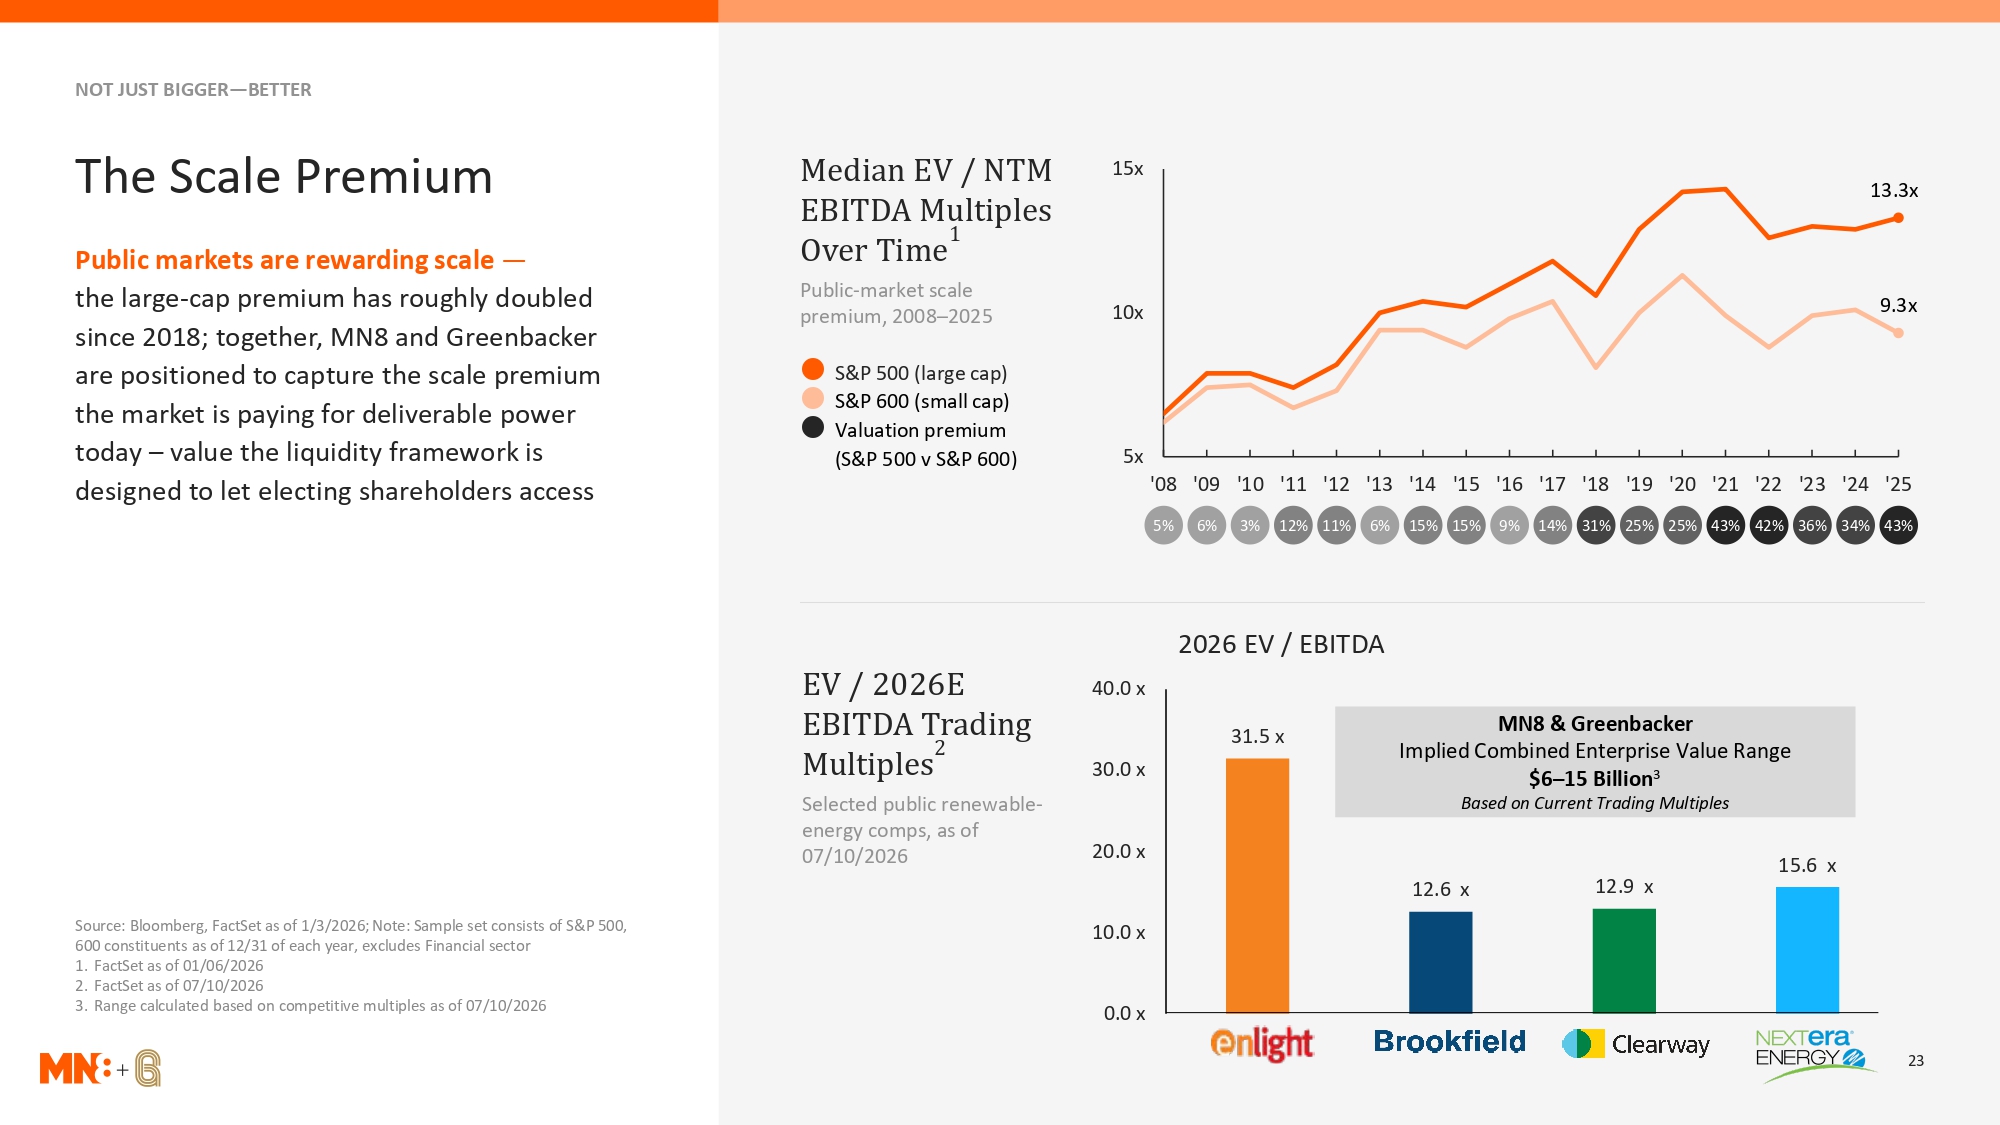
NOT JUST BIGGER—BETTER The Scale Premium Median EV / NTM 15x 13.3x EBITDA Multiples 1 Public markets are rewarding scale — Over Time the large-cap premium has roughly doubled Public-market scale premium, 2008–2025 10x 9.3x since 2018; together, MN8 and Greenbacker are positioned to capture the scale premium S&P 500 (large cap) S&P 600 (small cap) the market is paying for deliverable power Valuation premium today – value the liquidity framework is (S&P 500 v S&P 600) 5x designed to let electing shareholders access '08 '09 '10 '11 '12 '13 '14 '15 '16 '17 '18 '19 '20 '21 '22 '23 '24 '25 5% 6% 3% 12% 11% 6% 15% 15% 9% 14% 31% 25% 25% 43% 42% 36% 34% 43% 2026 EV / EBITDA EV / 2026E 40.0 x EBITDA Trading 31.5 x MN8 & Greenbacker 2 Implied Combined Enterprise Value Range Multiples 30.0 x $6–15 Billion3 Selected public renewable- Based on Current Trading Multiples energy comps, as of 07/10/2026 20.0 x 15.6 x 12.6 x 12.9 x Source: Bloomberg, FactSet as of 1/3/2026; Note: Sample set consists of S&P 500, 10.0 x 600 constituents as of 12/31 of each year, excludes Financial sector 1. FactSet as of 01/06/2026 2. FactSet as of 07/10/2026 3. Range calculated based on competitive multiples as of 07/10/2026 0.0 x 23

A Once-in-a-Generation Demand Inflection After two decades of flat demand, U.S. electricity demand is accelerating. The scarce asset is no longer generation — it is deliverable power, at scale, near load PRESENTED BY Jon Yoder President & CEO, MN8 24
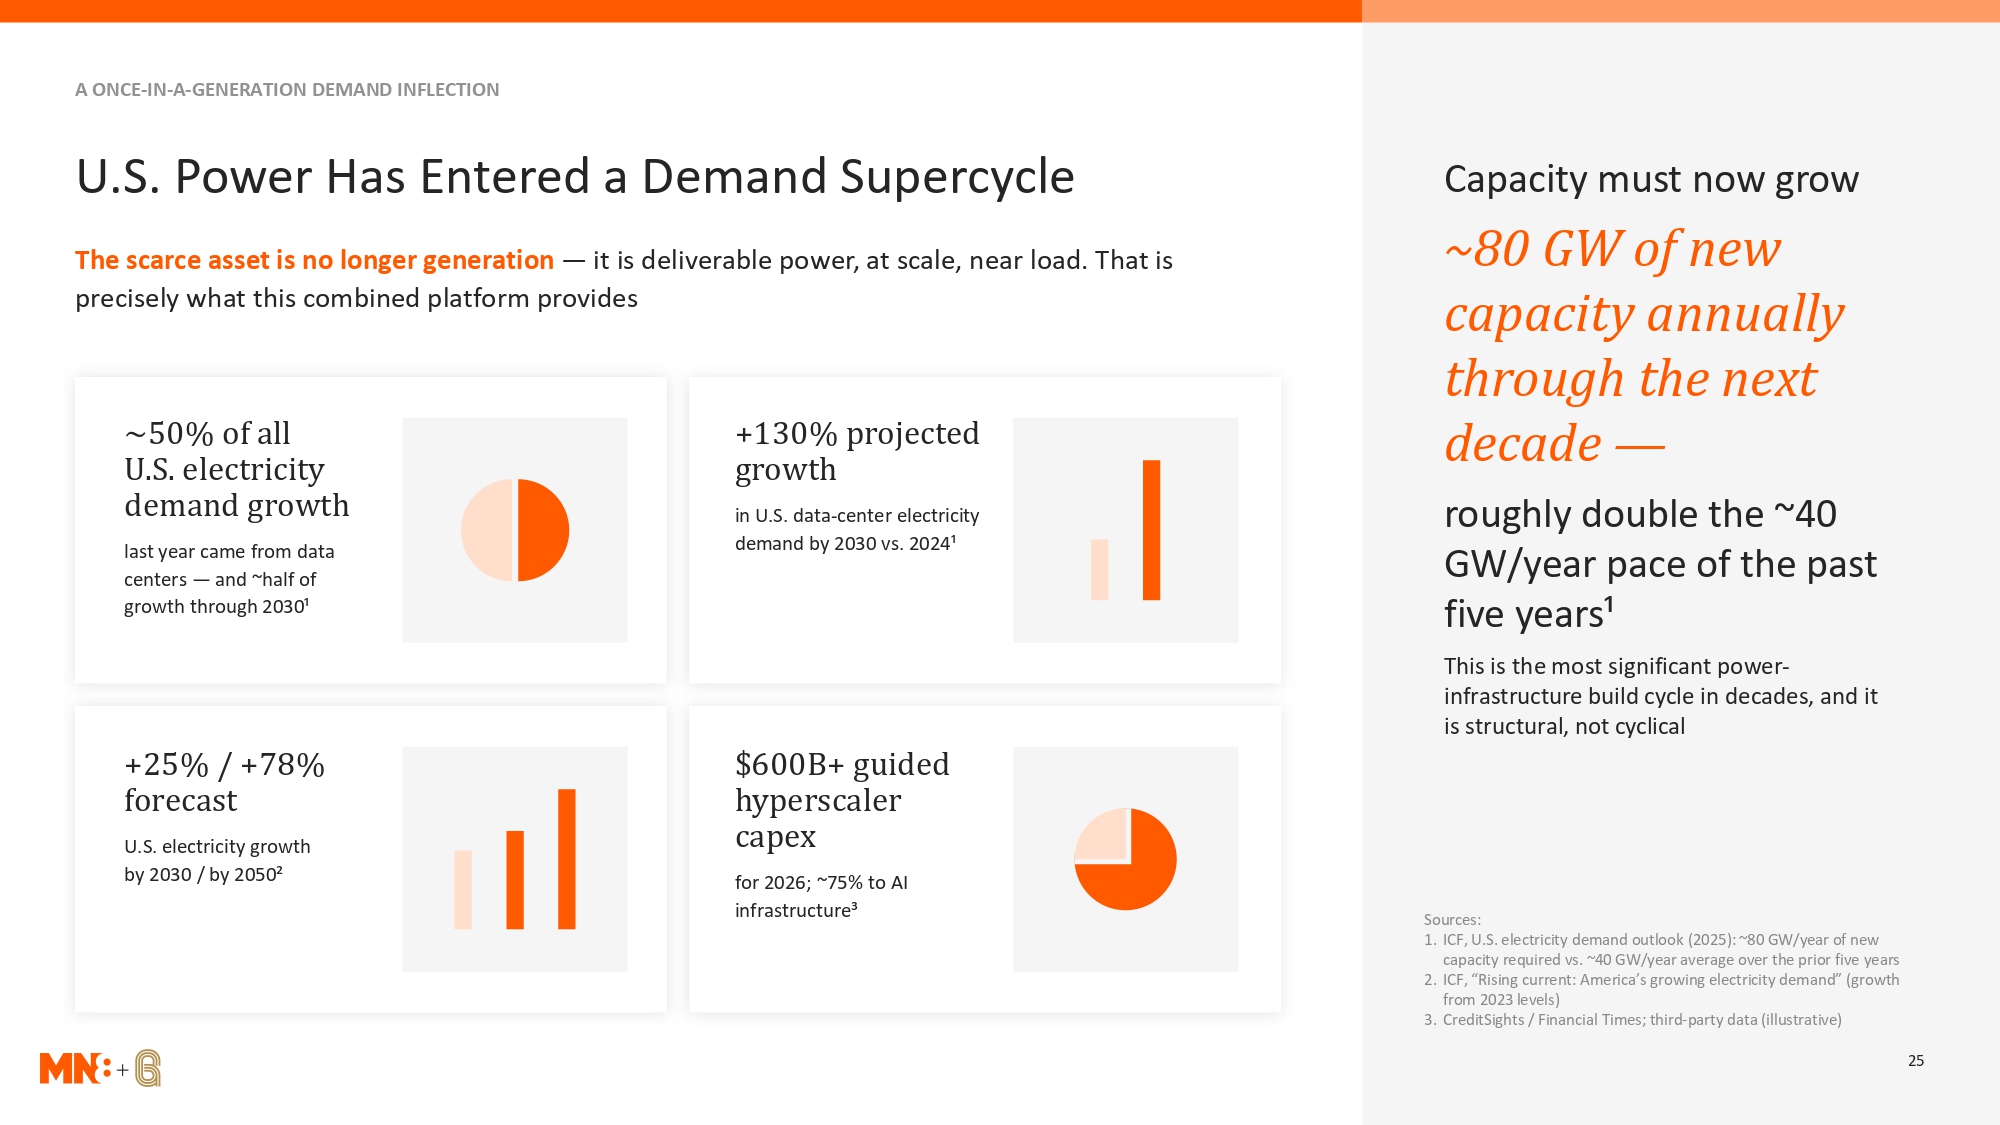
A ONCE-IN-A-GENERATION DEMAND INFLECTION U.S. Power Has Entered a Demand Supercycle Capacity must now grow The scarce asset is no longer generation — it is deliverable power, at scale, near load. That is ~80 GW of new precisely what this combined platform provides capacity annually through the next ~50% of all U.S. electricity +130% projected growth decade — demand growth in U.S. data-center electricity roughly double the ~40 demand by 2030 vs. 2024¹ last year came from data centers — and ~half of GW/year pace of the past growth through 2030¹ five years¹ This is the most significant power- infrastructure build cycle in decades, and it is structural, not cyclical +25% / +78% $600B+ guided forecast hyperscaler U.S. electricity growth capex by 2030 / by 2050² for 2026; ~75% to AI infrastructure³ Sources: 1. ICF, U.S. electricity demand outlook (2025): ~80 GW/year of new capacity required vs. ~40 GW/year average over the prior five years 2. ICF, “Rising current: America’s growing electricity demand” (growth from 2023 levels) 3. CreditSights / Financial Times; third-party data (illustrative) 25
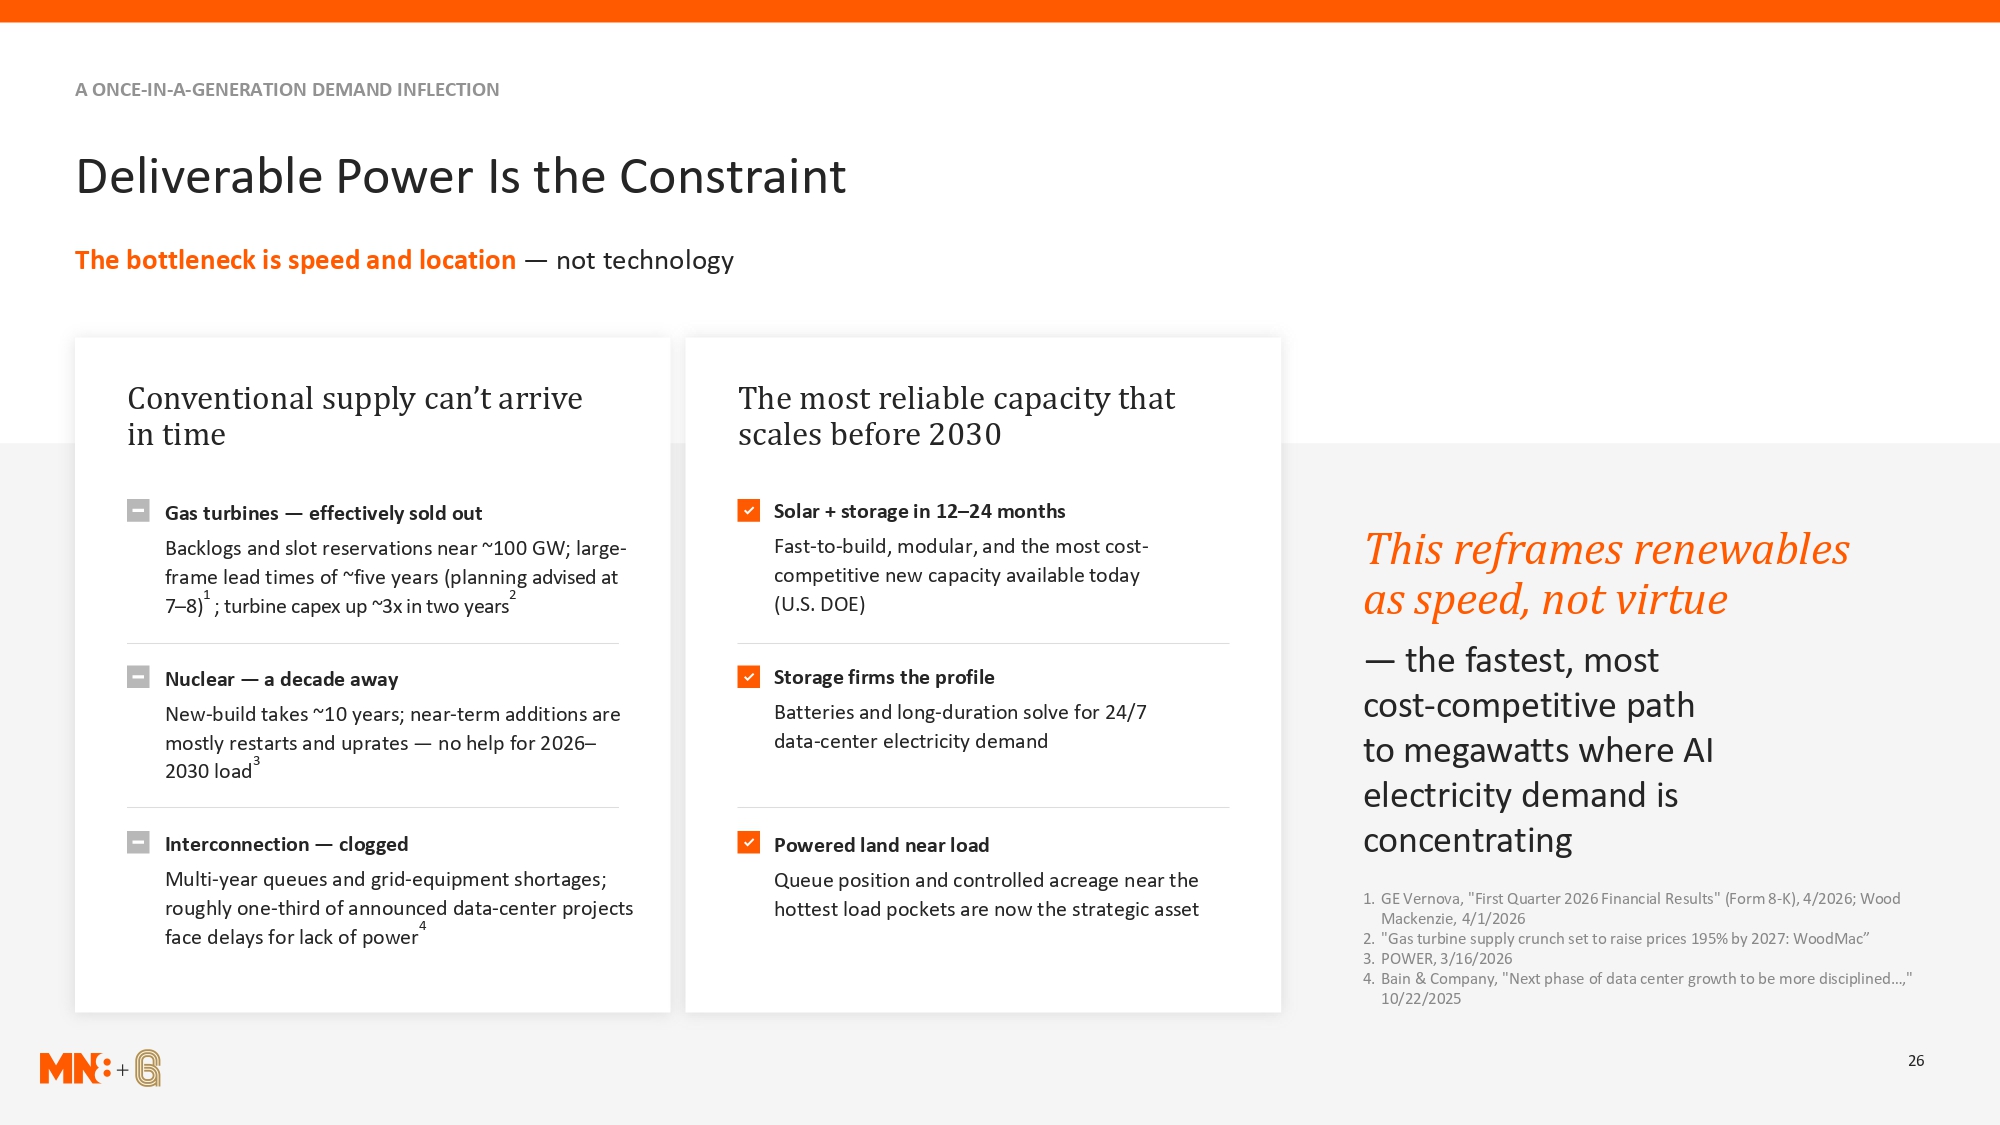
A ONCE-IN-A-GENERATION DEMAND INFLECTION Deliverable Power Is the Constraint The bottleneck is speed and location — not technology Conventional supply can’t arrive The most reliable capacity that in time scales before 2030 Gas turbines — effectively sold out Solar + storage in 12–24 months Backlogs and slot reservations near ~100 GW; large- frame lead times of ~five years (planning advised at Fast-to-build, modular, and the most cost- competitive new capacity available today This reframes renewables 1 7–8) ; turbine capex up ~3x in two years 2 (U.S. DOE) as speed, not virtue Nuclear — a decade away Storage firms the profile — the fastest, most New-build takes ~10 years; near-term additions are Batteries and long-duration solve for 24/7 cost-competitive path mostly restarts and uprates — no help for 2026– 2030 load 3 data-center electricity demand to megawatts where AI electricity demand is Interconnection — clogged Powered land near load concentrating Multi-year queues and grid-equipment shortages; Queue position and controlled acreage near the 1. GE Vernova, "First Quarter 2026 Financial Results" (Form 8-K), 4/2026; Wood roughly one-third of announced data-center projects hottest load pockets are now the strategic asset Mackenzie, 4/1/2026 4 face delays for lack of power 2. "Gas turbine supply crunch set to raise prices 195% by 2027: WoodMac” 3. POWER, 3/16/2026 4. Bain & Company, "Next phase of data center growth to be more disciplined…," 10/22/2025 26
Key Takeaways Ways this combination provides stability and performance through all market cycles PRESENTED BY Jon Yoder President & CEO, MN8 Dan de Boer CEO, Greenbacker 27
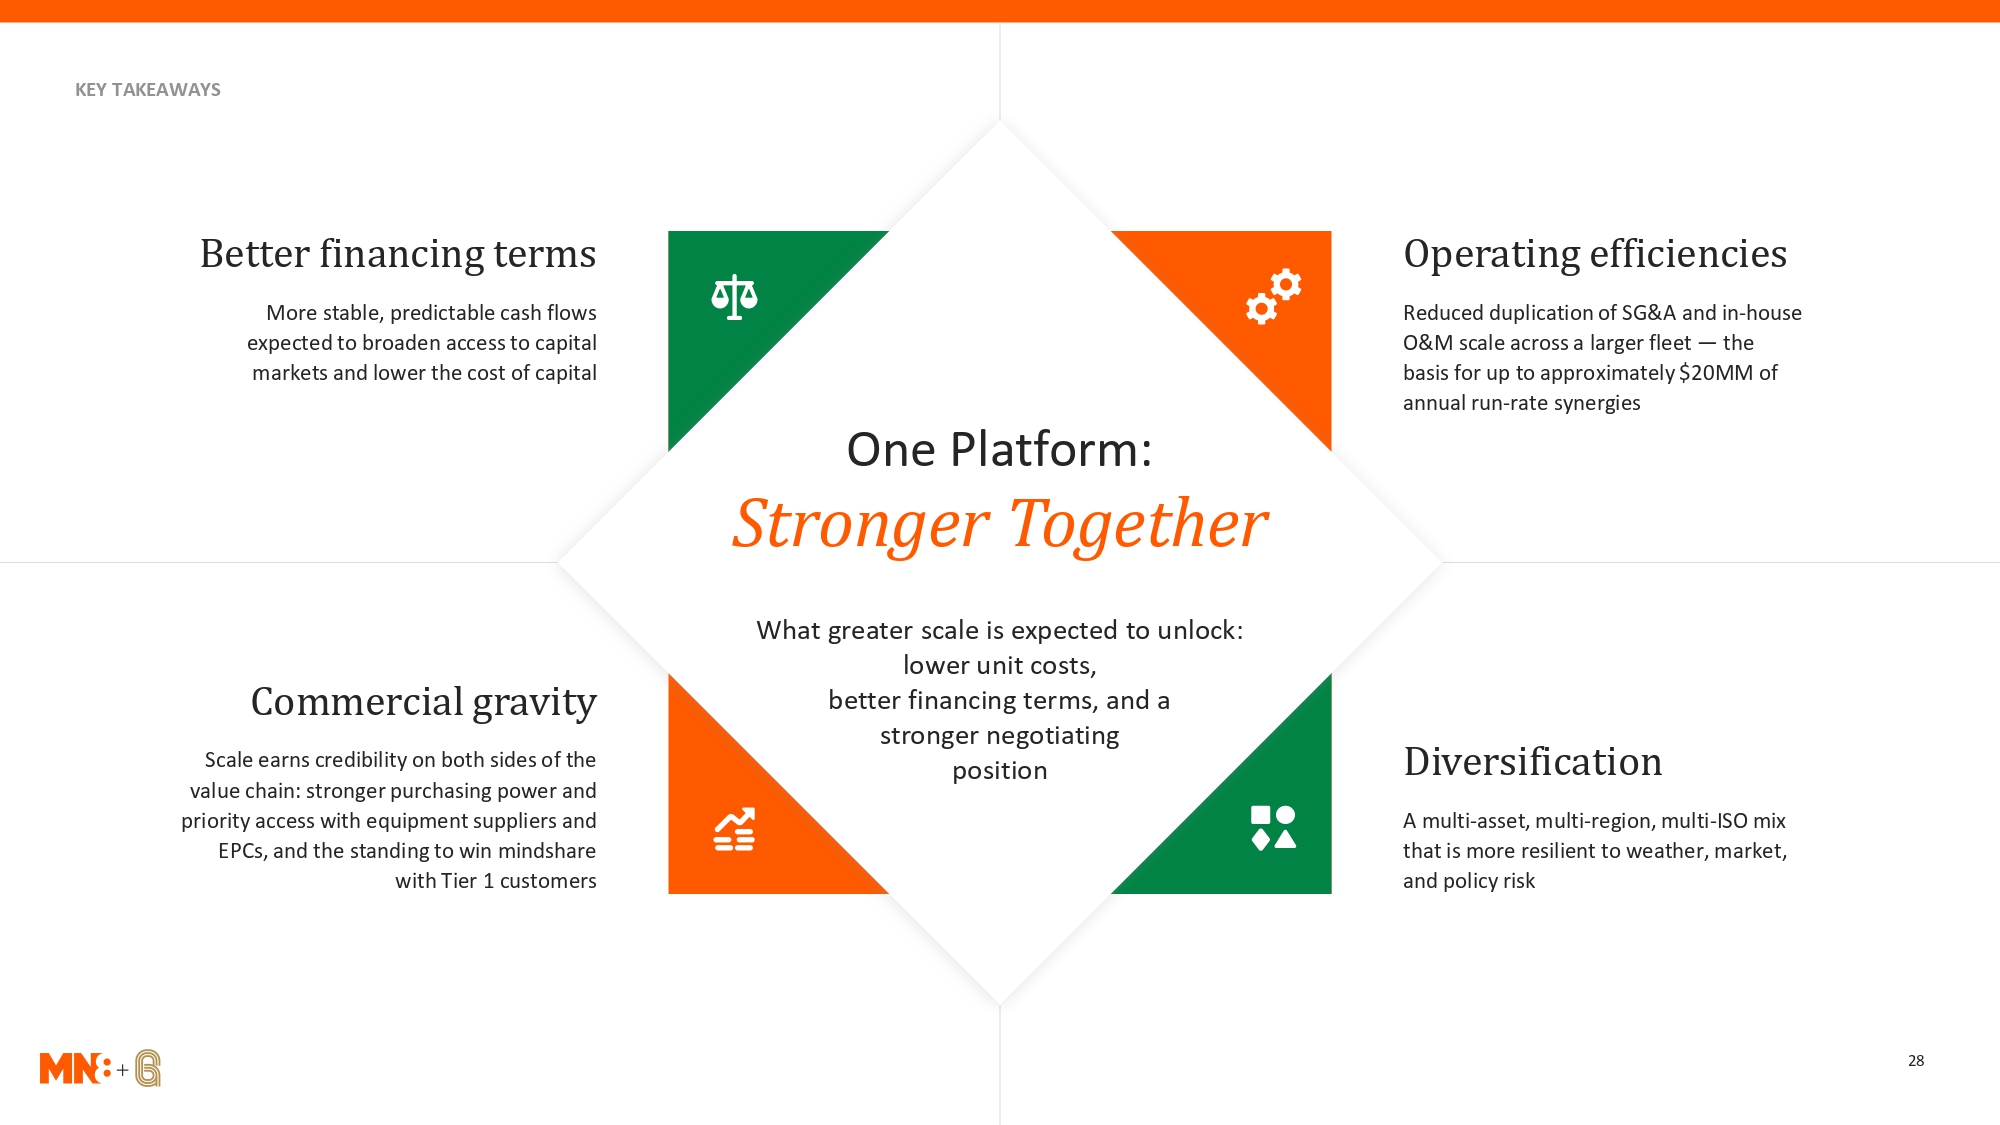
KEY TAKEAWAYS Better financing terms Operating efficiencies More stable, predictable cash flows Reduced duplication of SG&A and in-house expected to broaden access to capital O&M scale across a larger fleet — the markets and lower the cost of capital basis for up to approximately $20MM of annual run-rate synergies One Platform: Stronger Together What greater scale is expected to unlock: lower unit costs, Commercial gravity better financing terms, and a stronger negotiating Scale earns credibility on both sides of the position Diversification value chain: stronger purchasing power and priority access with equipment suppliers and A multi-asset, multi-region, multi-ISO mix EPCs, and the standing to win mindshare that is more resilient to weather, market, with Tier 1 customers and policy risk 28
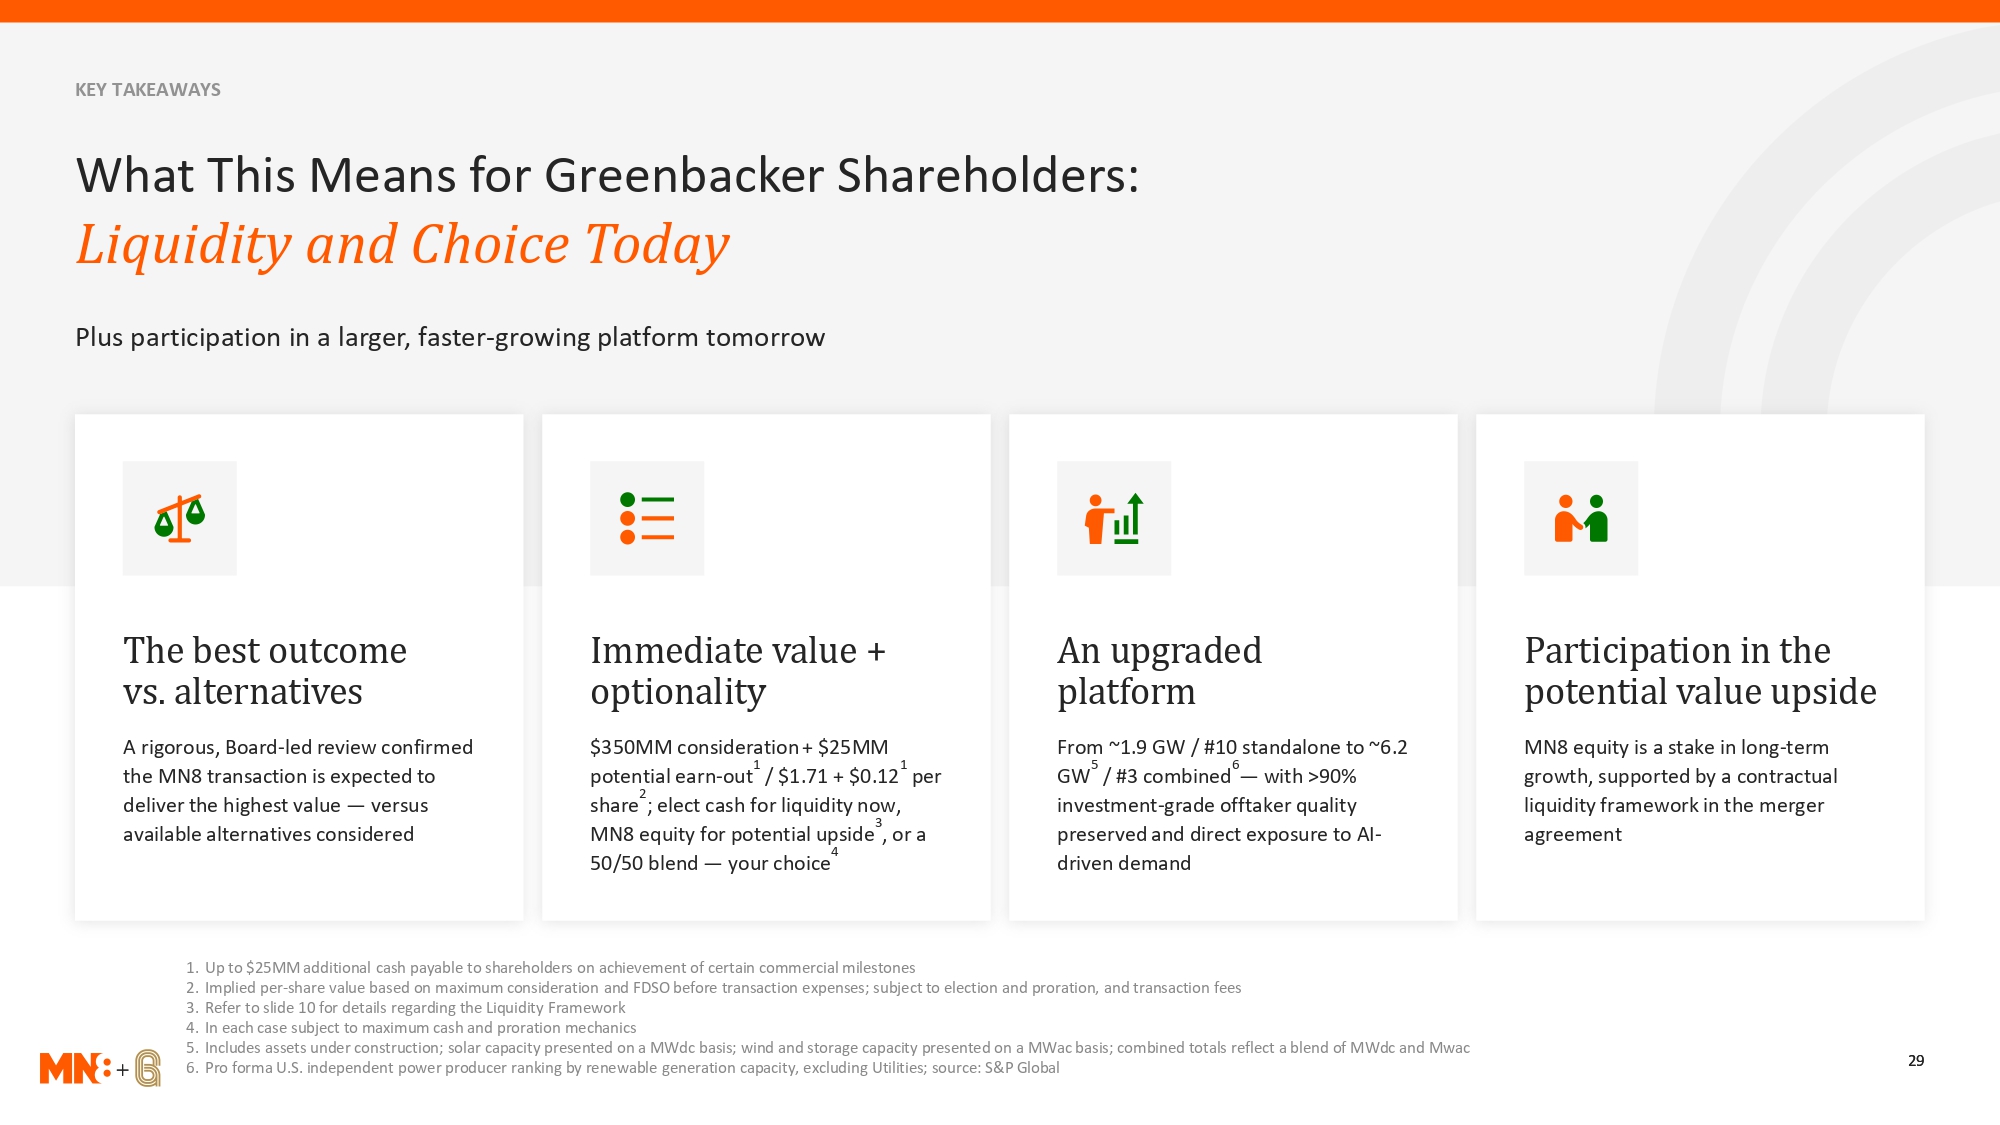
KEY TAKEAWAYS What This Means for Greenbacker Shareholders: Liquidity and Choice Today Plus participation in a larger, faster-growing platform tomorrow The best outcome Immediate value + An upgraded Participation in the vs. alternatives optionality platform potential value upside A rigorous, Board-led review confirmed $350MM consideration + $25MM From ~1.9 GW / #10 standalone to ~6.2 MN8 equity is a stake in long-term 1 1 5 6 the MN8 transaction is expected to potential earn-out / $1.71 + $0.12 per GW / #3 combined — with >90% growth, supported by a contractual 2 deliver the highest value — versus share ; elect cash for liquidity now, investment-grade offtaker quality liquidity framework in the merger 3 available alternatives considered MN8 equity for potential upside , or a preserved and direct exposure to AI- agreement 4 50/50 blend — your choice driven demand 1. Up to $25MM additional cash payable to shareholders on achievement of certain commercial milestones 2. Implied per-share value based on maximum consideration and FDSO before transaction expenses; subject to election and proration, and transaction fees 3. Refer to slide 10 for details regarding the Liquidity Framework 4. In each case subject to maximum cash and proration mechanics 5. Includes assets under construction; solar capacity presented on a MWdc basis; wind and storage capacity presented on a MWac basis; combined totals reflect a blend of MWdc and Mwac 6. Pro forma U.S. independent power producer ranking by renewable generation capacity, excluding Utilities; source: S&P Global 29

What Happens Next A clean, de-risked path to a Q4 2026 close PRESENTED BY Carl Weatherley-White CFO, Greenbacker Dan de Boer CEO, Greenbacker 30
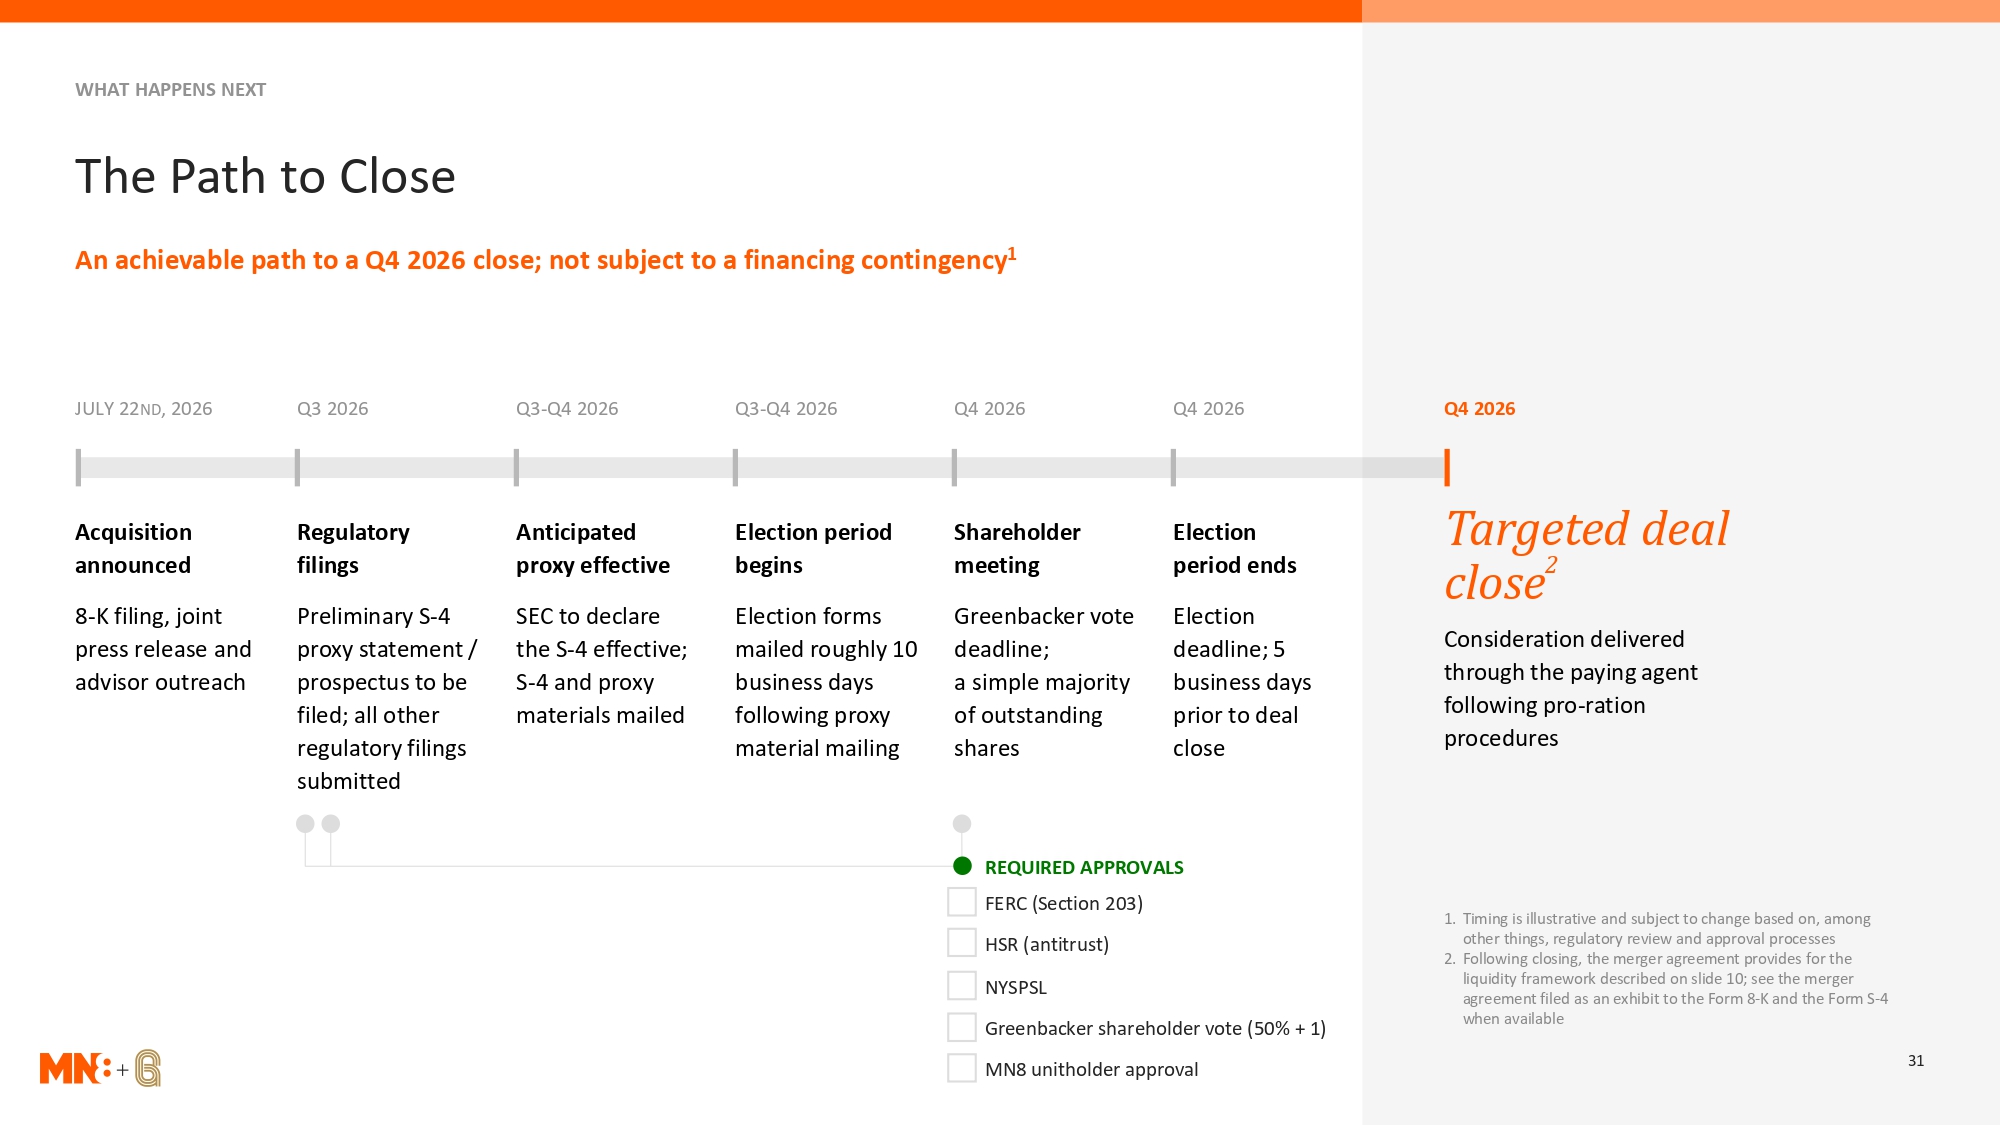
WHAT HAPPENS NEXT The Path to Close An achievable path to a Q4 2026 close; not subject to a financing contingency1 JULY 22ND, 2026 Q3 2026 Q3-Q4 2026 Q3-Q4 2026 Q4 2026 Q4 2026 Q4 2026 Acquisition Regulatory Anticipated Election period Shareholder Election Targeted deal close announced filings proxy effective begins meeting period ends 2 8-K filing, joint Preliminary S-4 SEC to declare Election forms Greenbacker vote Election press release and proxy statement / the S-4 effective; mailed roughly 10 deadline; deadline; 5 Consideration delivered advisor outreach prospectus to be S-4 and proxy business days a simple majority business days through the paying agent filed; all other materials mailed following proxy of outstanding prior to deal following pro-ration regulatory filings material mailing shares close procedures submitted REQUIRED APPROVALS FERC (Section 203) 1. Timing is illustrative and subject to change based on, among HSR (antitrust) other things, regulatory review and approval processes 2. Following closing, the merger agreement provides for the liquidity framework described on slide 10; see the merger NYSPSL agreement filed as an exhibit to the Form 8-K and the Form S-4 when available Greenbacker shareholder vote (50% + 1) 31 MN8 unitholder approval
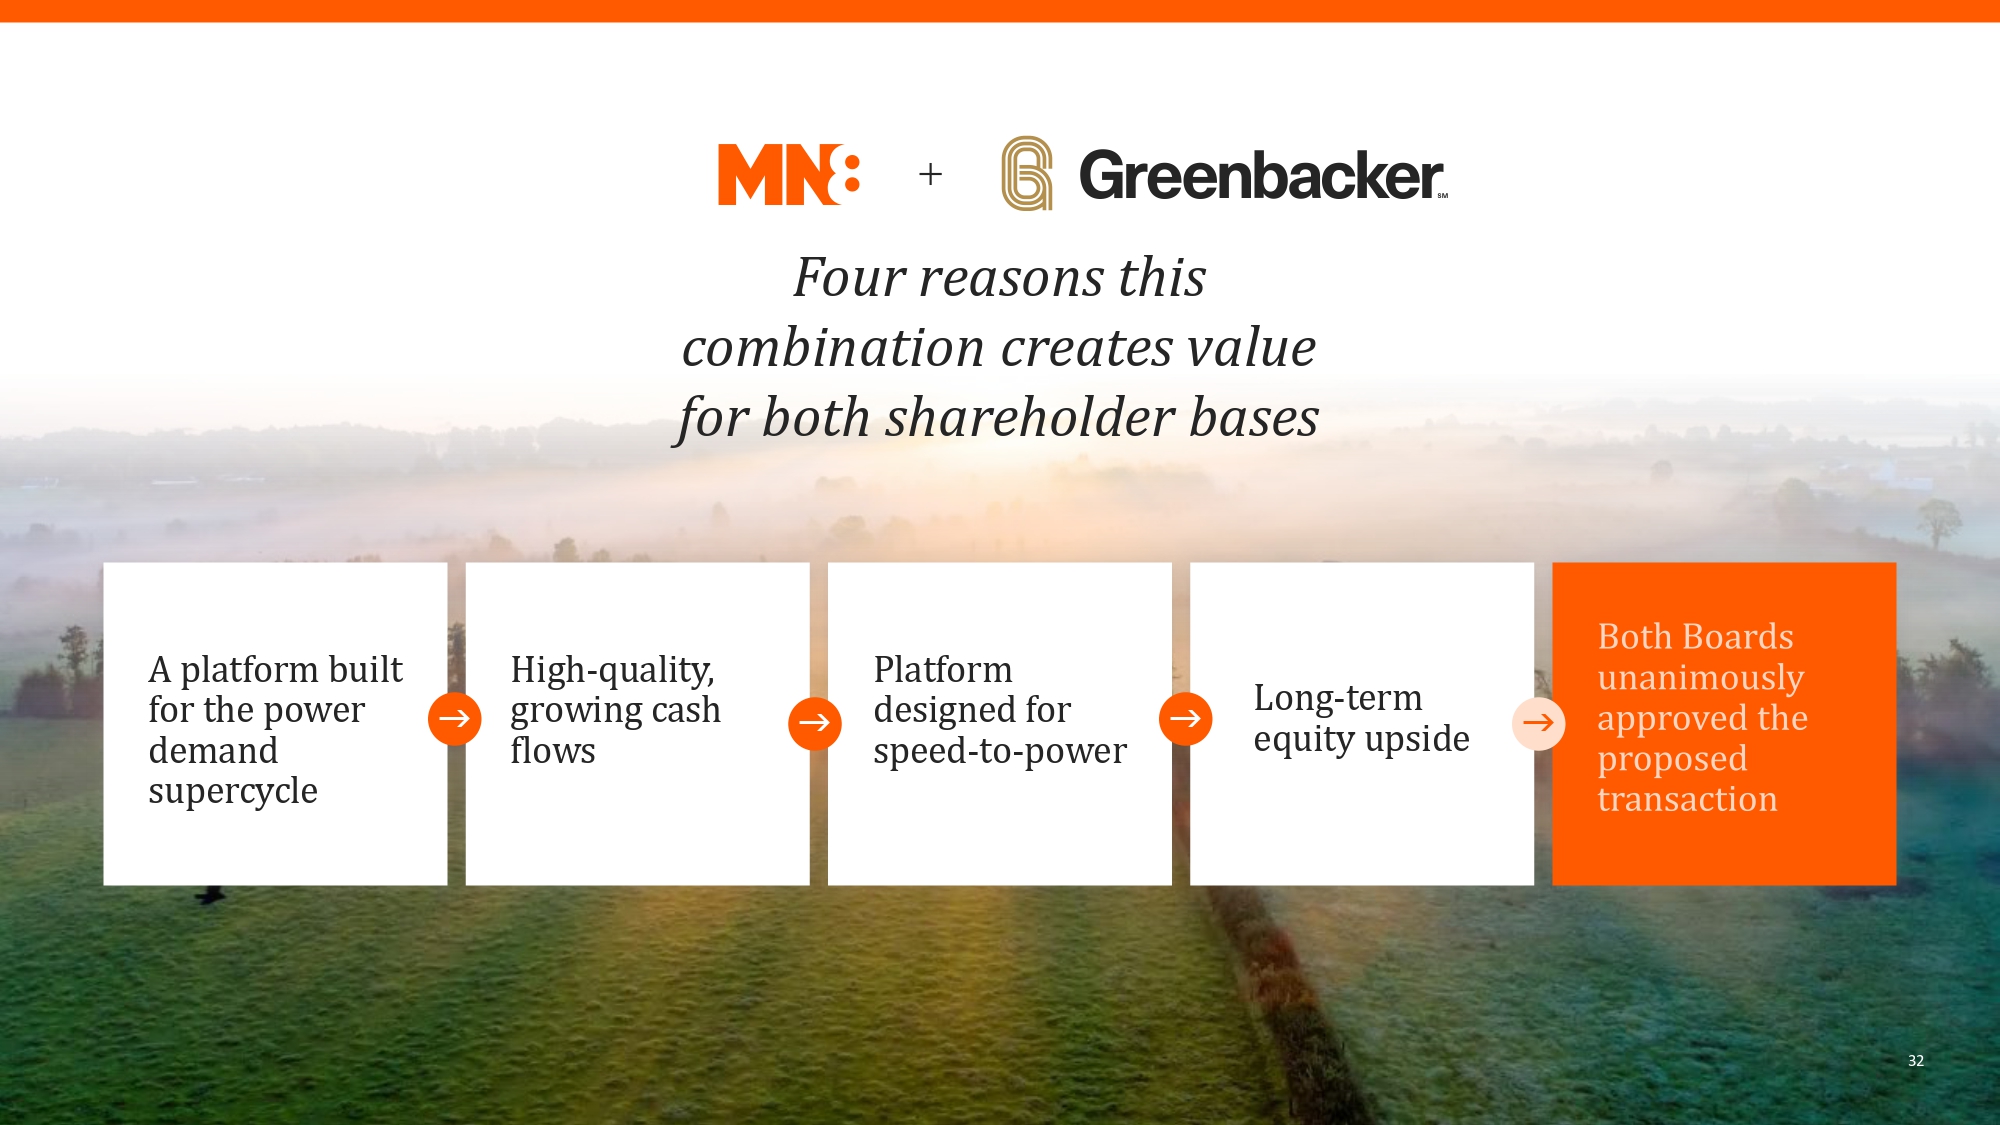
Four reasons this combination creates value for both shareholder bases A platform built High-quality, Platform for the power Long-term growing cash designed for equity upside demand flows speed-to-power supercycle 32

Next Steps READ THE MATERIALS BRING US YOUR QUESTIONS PLAN TO VOTE The definitive proxy statement / Your IR and management teams are When the voting window opens, an prospectus filed on Form S-4 will available for follow-up calls, asset affirmative vote (50% + 1) approves contain the complete terms, including detail, and one-on-one client the transaction and unlocks each the post-close liquidity framework, conversations Greenbacker holder’s consideration process narrative, and fairness opinion election delivered to the Greenbacker board; we encourage securityholders to review it when filed INVESTOR RELATIONS Brandon Praznik · transactionsupport@greenbackercapital.com Candice Adams · IR@mn8.com 33
Appendix Materials 34
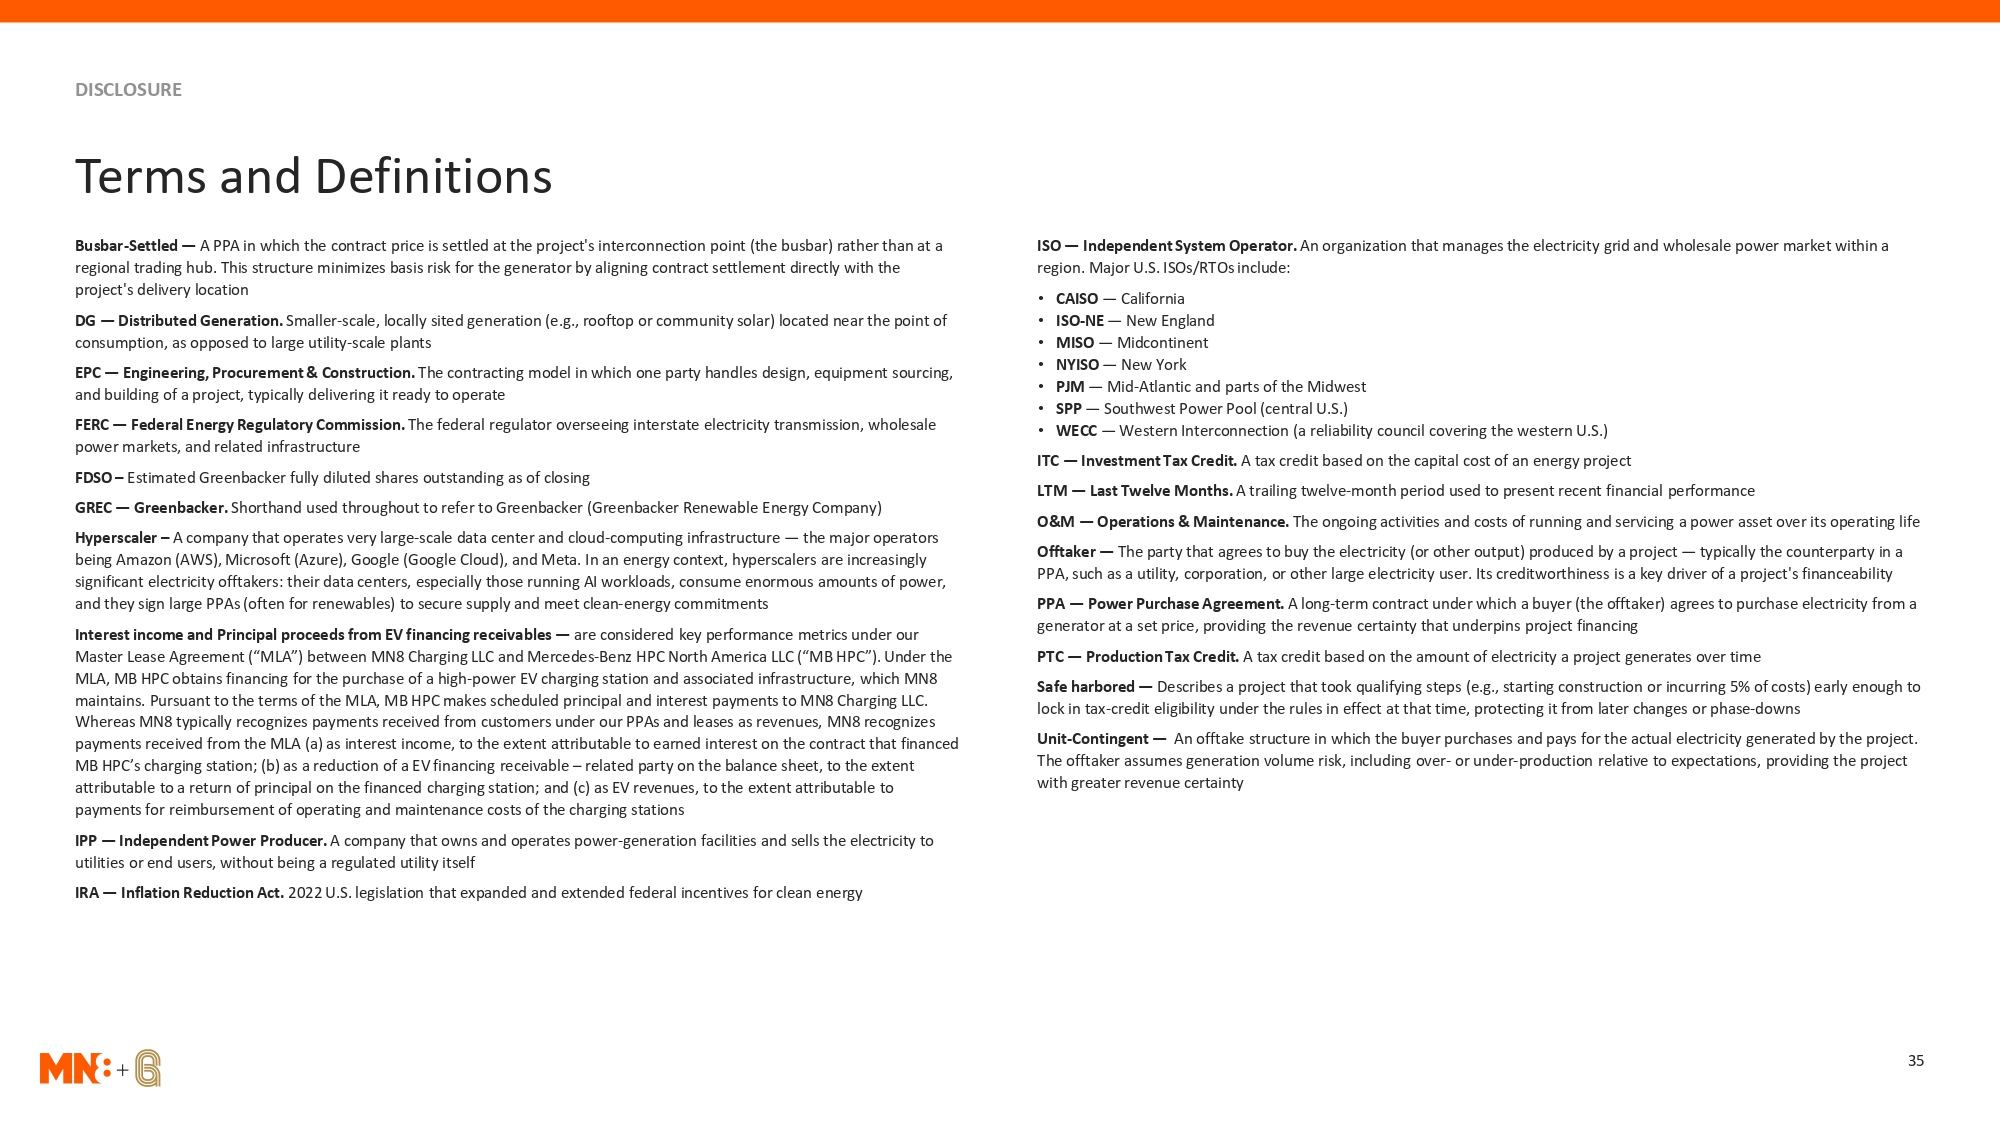
DISCLOSURE Terms and Definitions Busbar-Settled — A PPA in which the contract price is settled at the project's interconnection point (the busbar) rather than at a ISO — Independent System Operator. An organization that manages the electricity grid and wholesale power market within a regional trading hub. This structure minimizes basis risk for the generator by aligning contract settlement directly with the region. Major U.S. ISOs/RTOs include: project's delivery location • CAISO — California DG — Distributed Generation. Smaller-scale, locally sited generation (e.g., rooftop or community solar) located near the point of • ISO-NE — New England consumption, as opposed to large utility-scale plants • MISO — Midcontinent • NYISO — New York EPC — Engineering, Procurement & Construction. The contracting model in which one party handles design, equipment sourcing, • PJM — Mid-Atlantic and parts of the Midwest and building of a project, typically delivering it ready to operate • SPP — Southwest Power Pool (central U.S.) FERC — Federal Energy Regulatory Commission. The federal regulator overseeing interstate electricity transmission, wholesale • WECC — Western Interconnection (a reliability council covering the western U.S.) power markets, and related infrastructure ITC — Investment Tax Credit. A tax credit based on the capital cost of an energy project FDSO – Estimated Greenbacker fully diluted shares outstanding as of closing LTM — Last Twelve Months. A trailing twelve-month period used to present recent financial performance GREC — Greenbacker. Shorthand used throughout to refer to Greenbacker (Greenbacker Renewable Energy Company) O&M — Operations & Maintenance. The ongoing activities and costs of running and servicing a power asset over its operating life Hyperscaler – A company that operates very large-scale data center and cloud-computing infrastructure — the major operators being Amazon (AWS), Microsoft (Azure), Google (Google Cloud), and Meta. In an energy context, hyperscalers are increasingly Offtaker — The party that agrees to buy the electricity (or other output) produced by a project — typically the counterparty in a significant electricity offtakers: their data centers, especially those running AI workloads, consume enormous amounts of power, PPA, such as a utility, corporation, or other large electricity user. Its creditworthiness is a key driver of a project's financeability and they sign large PPAs (often for renewables) to secure supply and meet clean-energy commitments PPA — Power Purchase Agreement. A long-term contract under which a buyer (the offtaker) agrees to purchase electricity from a Interest income and Principal proceeds from EV financing receivables — are considered key performance metrics under our generator at a set price, providing the revenue certainty that underpins project financing Master Lease Agreement (“MLA”) between MN8 Charging LLC and Mercedes-Benz HPC North America LLC (“MB HPC”). Under the PTC — Production Tax Credit. A tax credit based on the amount of electricity a project generates over time MLA, MB HPC obtains financing for the purchase of a high-power EV charging station and associated infrastructure, which MN8 Safe harbored — Describes a project that took qualifying steps (e.g., starting construction or incurring 5% of costs) early enough to maintains. Pursuant to the terms of the MLA, MB HPC makes scheduled principal and interest payments to MN8 Charging LLC. lock in tax-credit eligibility under the rules in effect at that time, protecting it from later changes or phase-downs Whereas MN8 typically recognizes payments received from customers under our PPAs and leases as revenues, MN8 recognizes payments received from the MLA (a) as interest income, to the extent attributable to earned interest on the contract that financed Unit-Contingent — An offtake structure in which the buyer purchases and pays for the actual electricity generated by the project. MB HPC’s charging station; (b) as a reduction of a EV financing receivable – related party on the balance sheet, to the extent The offtaker assumes generation volume risk, including over- or under-production relative to expectations, providing the project attributable to a return of principal on the financed charging station; and (c) as EV revenues, to the extent attributable to with greater revenue certainty payments for reimbursement of operating and maintenance costs of the charging stations IPP — Independent Power Producer. A company that owns and operates power-generation facilities and sells the electricity to utilities or end users, without being a regulated utility itself IRA — Inflation Reduction Act. 2022 U.S. legislation that expanded and extended federal incentives for clean energy 35
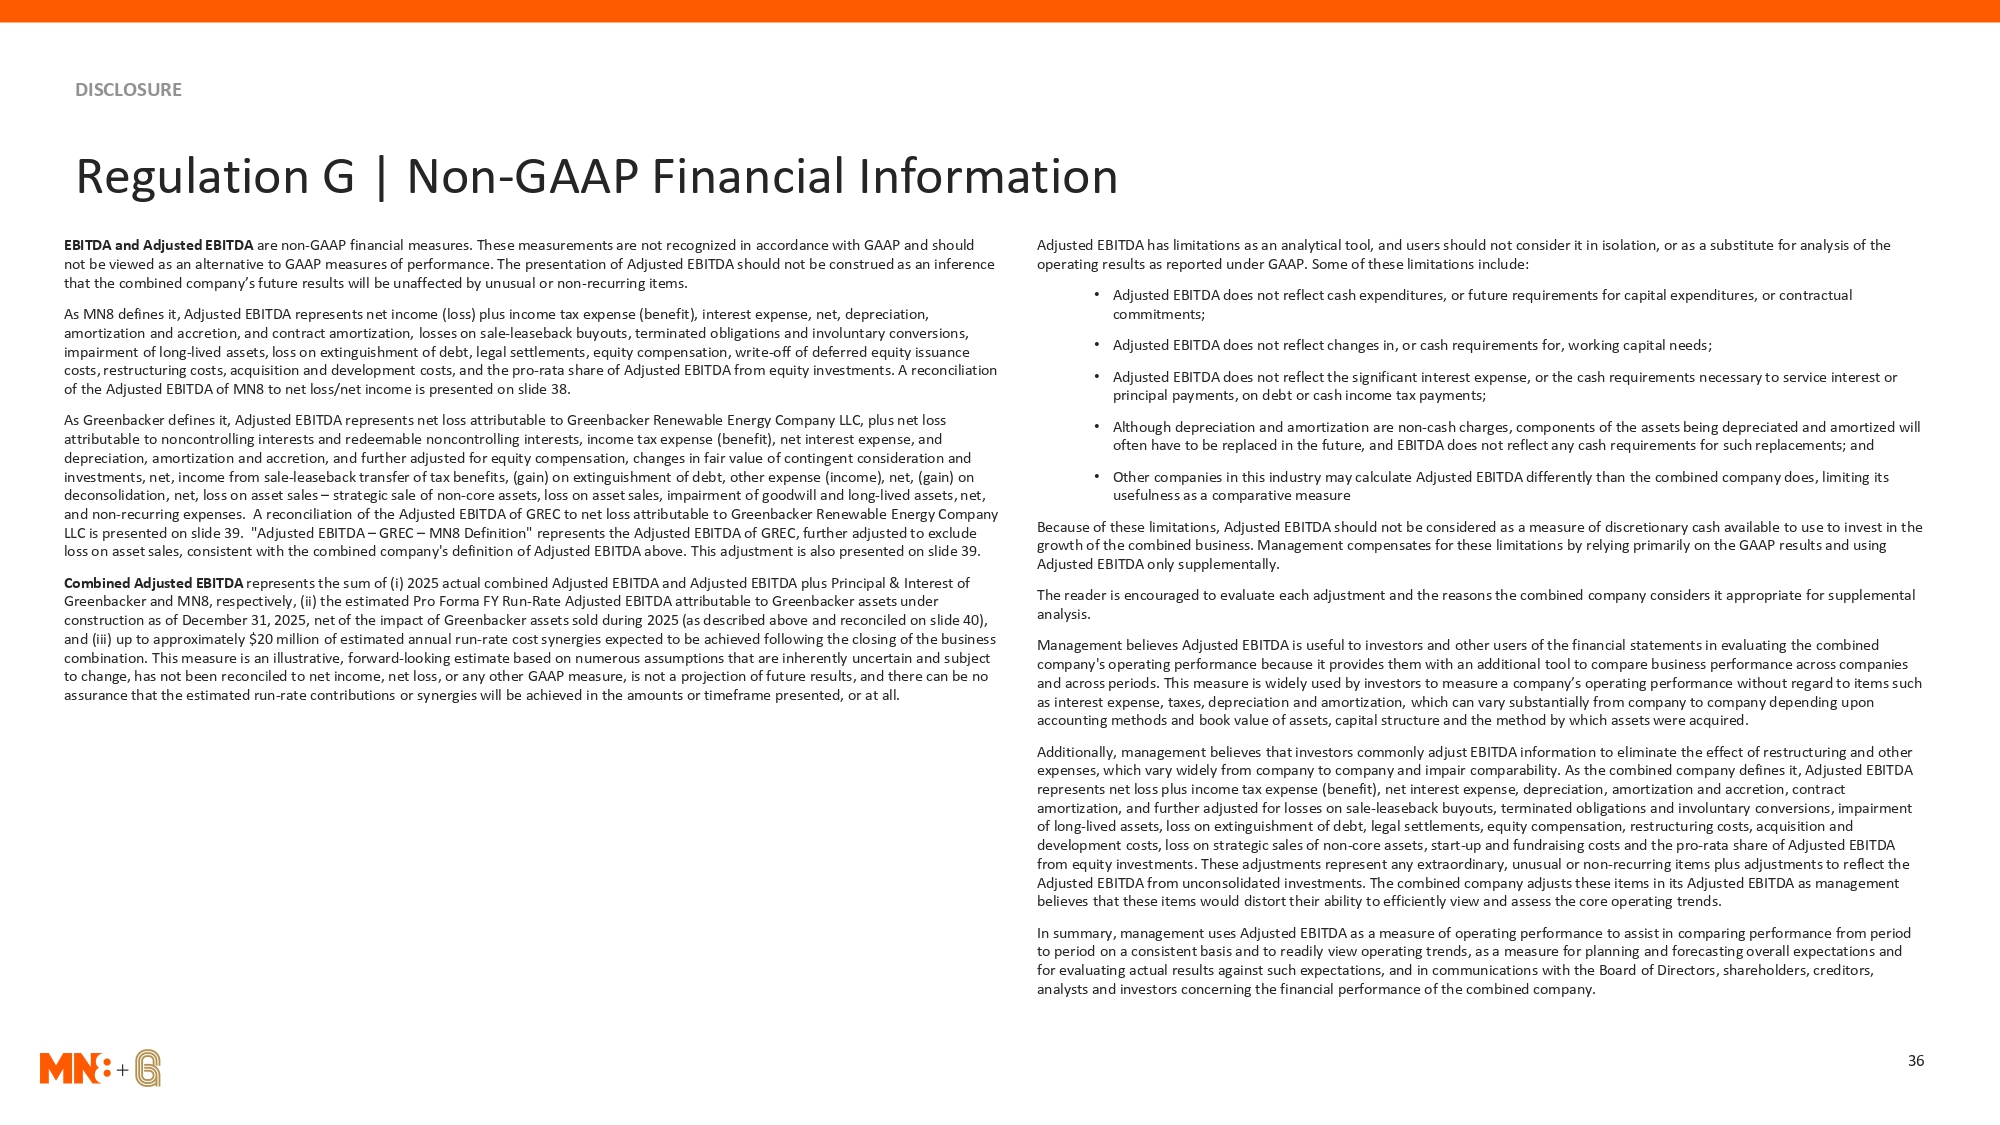
DISCLOSURE Regulation G | Non-GAAP Financial Information EBITDA and Adjusted EBITDA are non-GAAP financial measures. These measurements are not recognized in accordance with GAAP and should Adjusted EBITDA has limitations as an analytical tool, and users should not consider it in isolation, or as a substitute for analysis of the not be viewed as an alternative to GAAP measures of performance. The presentation of Adjusted EBITDA should not be construed as an inference operating results as reported under GAAP. Some of these limitations include: that the combined company’s future results will be unaffected by unusual or non-recurring items. • Adjusted EBITDA does not reflect cash expenditures, or future requirements for capital expenditures, or contractual As MN8 defines it, Adjusted EBITDA represents net income (loss) plus income tax expense (benefit), interest expense, net, depreciation, commitments; amortization and accretion, and contract amortization, losses on sale-leaseback buyouts, terminated obligations and involuntary conversions, impairment of long-lived assets, loss on extinguishment of debt, legal settlements, equity compensation, write-off of deferred equity issuance • Adjusted EBITDA does not reflect changes in, or cash requirements for, working capital needs; costs, restructuring costs, acquisition and development costs, and the pro-rata share of Adjusted EBITDA from equity investments. A reconciliation • Adjusted EBITDA does not reflect the significant interest expense, or the cash requirements necessary to service interest or of the Adjusted EBITDA of MN8 to net loss/net income is presented on slide 38. principal payments, on debt or cash income tax payments; As Greenbacker defines it, Adjusted EBITDA represents net loss attributable to Greenbacker Renewable Energy Company LLC, plus net loss • Although depreciation and amortization are non-cash charges, components of the assets being depreciated and amortized will attributable to noncontrolling interests and redeemable noncontrolling interests, income tax expense (benefit), net interest expense, and often have to be replaced in the future, and EBITDA does not reflect any cash requirements for such replacements; and depreciation, amortization and accretion, and further adjusted for equity compensation, changes in fair value of contingent consideration and investments, net, income from sale-leaseback transfer of tax benefits, (gain) on extinguishment of debt, other expense (income), net, (gain) on • Other companies in this industry may calculate Adjusted EBITDA differently than the combined company does, limiting its deconsolidation, net, loss on asset sales – strategic sale of non-core assets, loss on asset sales, impairment of goodwill and long-lived assets, net, usefulness as a comparative measure and non-recurring expenses. A reconciliation of the Adjusted EBITDA of GREC to net loss attributable to Greenbacker Renewable Energy Company LLC is presented on slide 39. "Adjusted EBITDA – GREC – MN8 Definition" represents the Adjusted EBITDA of GREC, further adjusted to exclude Because of these limitations, Adjusted EBITDA should not be considered as a measure of discretionary cash available to use to invest in the loss on asset sales, consistent with the combined company's definition of Adjusted EBITDA above. This adjustment is also presented on slide 39. growth of the combined business. Management compensates for these limitations by relying primarily on the GAAP results and using Adjusted EBITDA only supplementally. Combined Adjusted EBITDA represents the sum of (i) 2025 actual combined Adjusted EBITDA and Adjusted EBITDA plus Principal & Interest of Greenbacker and MN8, respectively, (ii) the estimated Pro Forma FY Run-Rate Adjusted EBITDA attributable to Greenbacker assets under The reader is encouraged to evaluate each adjustment and the reasons the combined company considers it appropriate for supplemental construction as of December 31, 2025, net of the impact of Greenbacker assets sold during 2025 (as described above and reconciled on slide 40), analysis. and (iii) up to approximately $20 million of estimated annual run-rate cost synergies expected to be achieved following the closing of the business Management believes Adjusted EBITDA is useful to investors and other users of the financial statements in evaluating the combined combination. This measure is an illustrative, forward-looking estimate based on numerous assumptions that are inherently uncertain and subject company's operating performance because it provides them with an additional tool to compare business performance across companies to change, has not been reconciled to net income, net loss, or any other GAAP measure, is not a projection of future results, and there can be no and across periods. This measure is widely used by investors to measure a company’s operating performance without regard to items such assurance that the estimated run-rate contributions or synergies will be achieved in the amounts or timeframe presented, or at all. as interest expense, taxes, depreciation and amortization, which can vary substantially from company to company depending upon accounting methods and book value of assets, capital structure and the method by which assets were acquired. Additionally, management believes that investors commonly adjust EBITDA information to eliminate the effect of restructuring and other expenses, which vary widely from company to company and impair comparability. As the combined company defines it, Adjusted EBITDA represents net loss plus income tax expense (benefit), net interest expense, depreciation, amortization and accretion, contract amortization, and further adjusted for losses on sale-leaseback buyouts, terminated obligations and involuntary conversions, impairment of long-lived assets, loss on extinguishment of debt, legal settlements, equity compensation, restructuring costs, acquisition and development costs, loss on strategic sales of non-core assets, start-up and fundraising costs and the pro-rata share of Adjusted EBITDA from equity investments. These adjustments represent any extraordinary, unusual or non-recurring items plus adjustments to reflect the Adjusted EBITDA from unconsolidated investments. The combined company adjusts these items in its Adjusted EBITDA as management believes that these items would distort their ability to efficiently view and assess the core operating trends. In summary, management uses Adjusted EBITDA as a measure of operating performance to assist in comparing performance from period to period on a consistent basis and to readily view operating trends, as a measure for planning and forecasting overall expectations and for evaluating actual results against such expectations, and in communications with the Board of Directors, shareholders, creditors, analysts and investors concerning the financial performance of the combined company. 36
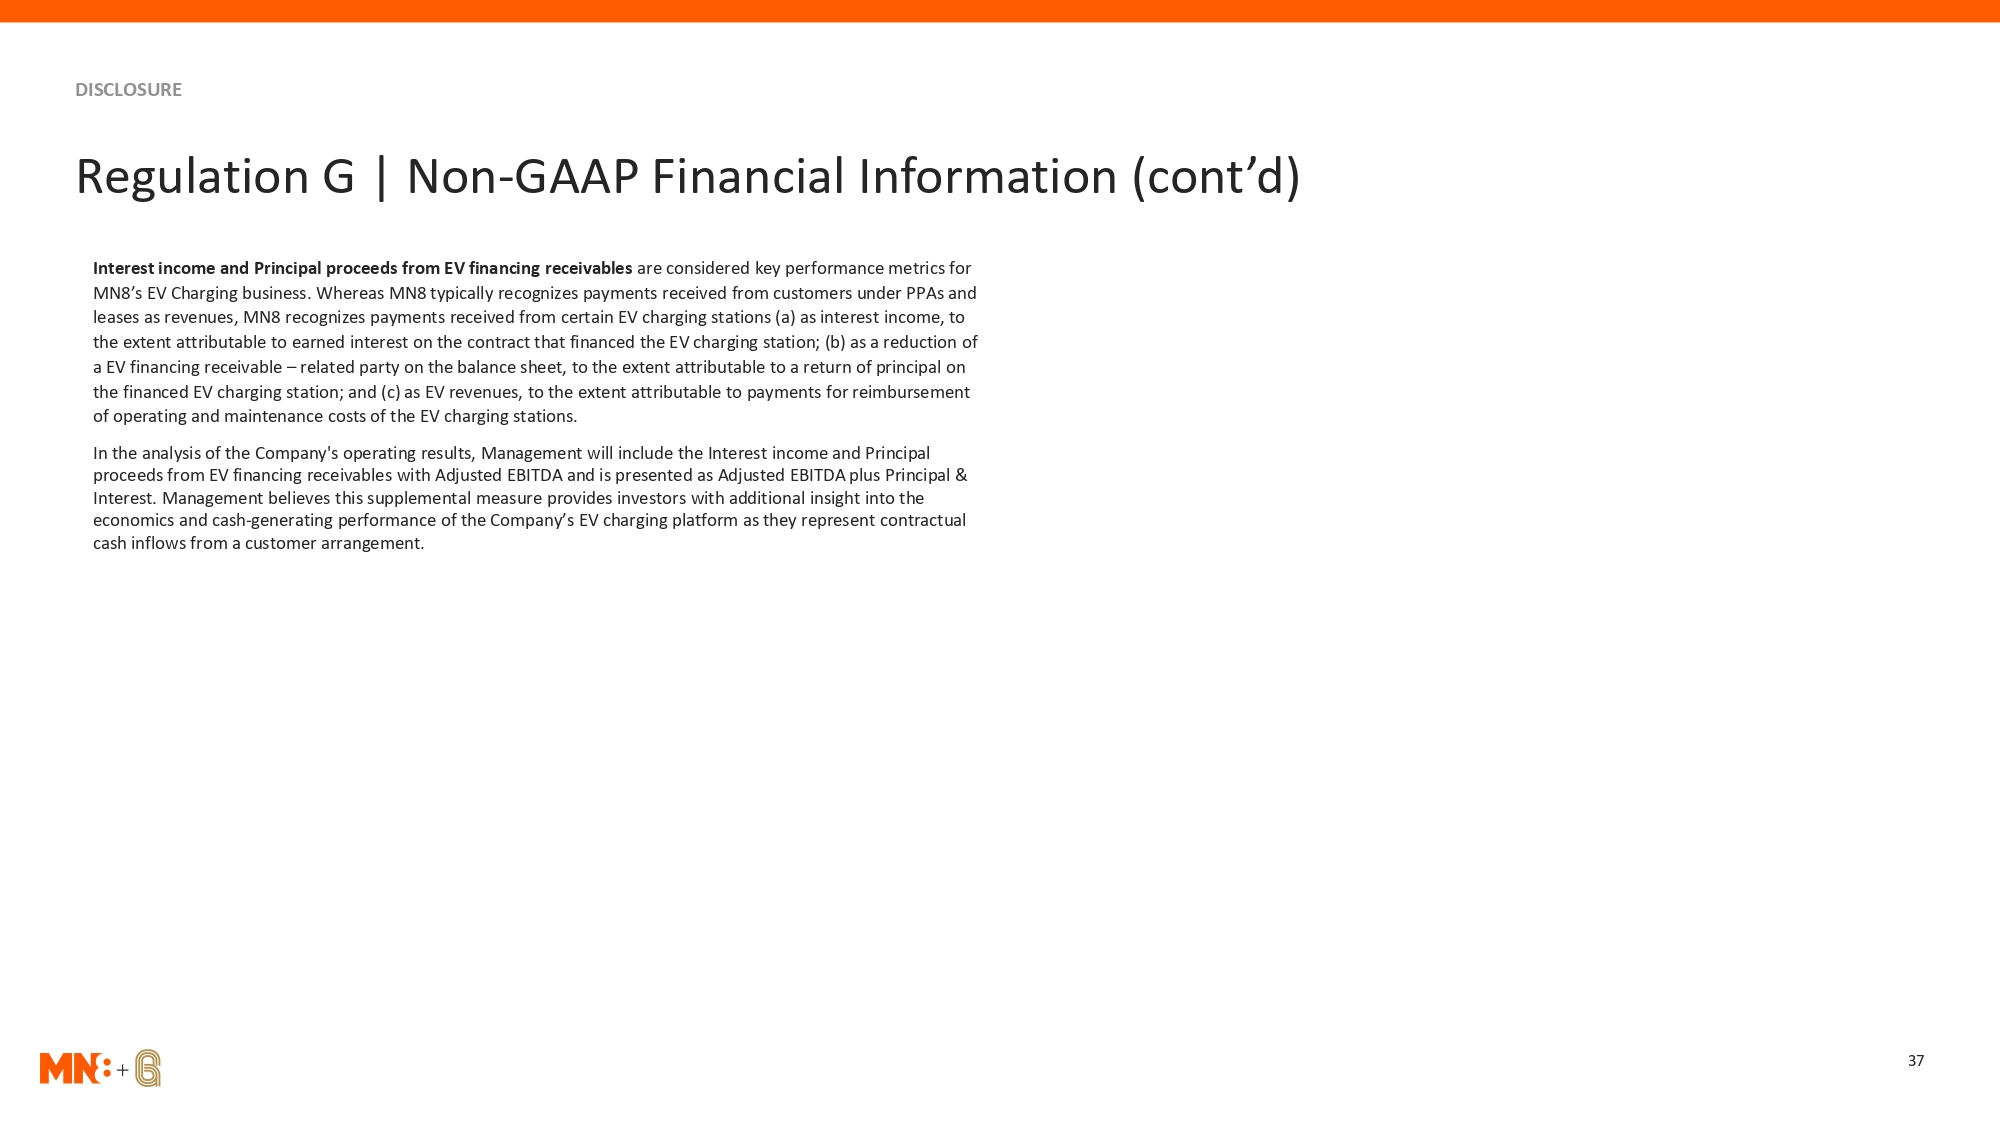
DISCLOSURE Regulation G | Non-GAAP Financial Information (cont’d) Interest income and Principal proceeds from EV financing receivables are considered key performance metrics for MN8’s EV Charging business. Whereas MN8 typically recognizes payments received from customers under PPAs and leases as revenues, MN8 recognizes payments received from certain EV charging stations (a) as interest income, to the extent attributable to earned interest on the contract that financed the EV charging station; (b) as a reduction of a EV financing receivable – related party on the balance sheet, to the extent attributable to a return of principal on the financed EV charging station; and (c) as EV revenues, to the extent attributable to payments for reimbursement of operating and maintenance costs of the EV charging stations. In the analysis of the Company's operating results, Management will include the Interest income and Principal proceeds from EV financing receivables with Adjusted EBITDA and is presented as Adjusted EBITDA plus Principal & Interest. Management believes this supplemental measure provides investors with additional insight into the economics and cash-generating performance of the Company’s EV charging platform as they represent contractual cash inflows from a customer arrangement. 37
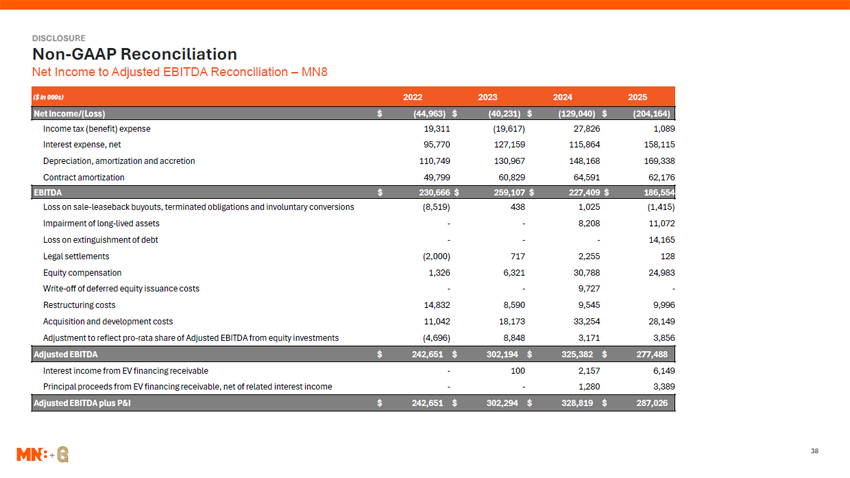
DISCLOSURE Non-GAAP Reconciliation Net Income to Adjusted EBITDA Reconciliation – MN8 ($ in 000s) 2022 2023 2024 2025 $ $ $ $ Net Income/(Loss) (44,963) (40,231) (129,040) (204,164) Income tax (benefit) expense 19,311 (19,617) 27,826 1,089 Interest expense, net 95,770 127,159 115,864 158,115 Depreciation, amortization and accretion 110,749 130,967 148,168 169,338 Contract amortization 49,799 60,829 64,591 62,176 $ $ $ $ EBITDA 230,666 259,107 227,409 186,554 Loss on sale-leaseback buyouts, terminated obligations and involuntary conversions (8,519) 438 1,025 (1,415) Impairment of long-lived assets - - 8,208 11,072 Loss on extinguishment of debt - - - 14,165 Legal settlements (2,000) 717 2,255 128 Equity compensation 1,326 6,321 30,788 24,983 Write-off of deferred equity issuance costs - - 9,727 - Restructuring costs 14,832 8,590 9,545 9,996 Acquisition and development costs 11,042 18,173 33,254 28,149 Adjustment to reflect pro-rata share of Adjusted EBITDA from equity investments (4,696) 8,848 3,171 3,856 $ $ $ $ Adjusted EBITDA 242,651 302,194 325,382 277,488 38 Interest income from EV financing receivable - 100 2,157 6,149
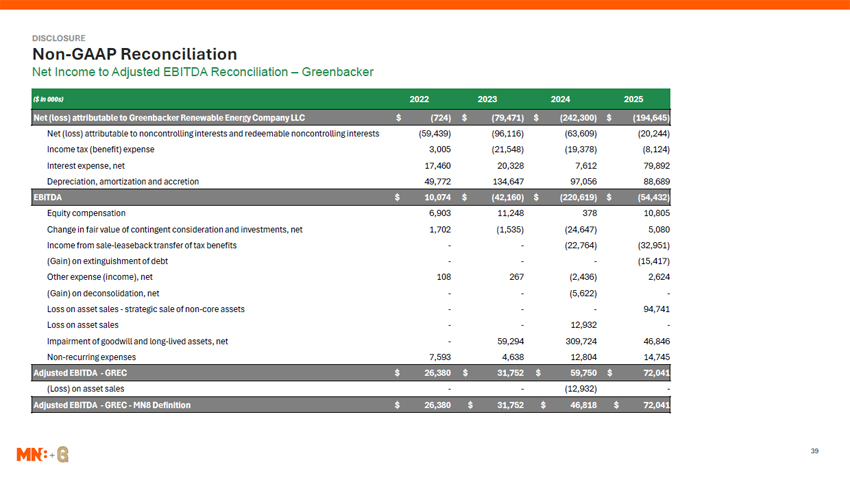
DISCLOSURE Non-GAAP Reconciliation Net Income to Adjusted EBITDA Reconciliation – Greenbacker ($ in 000s) 2022 2023 2024 2025 $ Net (loss) attributable to Greenbacker Renewable Energy Company LLC $ (79,471) $ (242,300) $ (194,645) (724) Net (loss) attributable to noncontrolling interests and redeemable noncontrolling (59,439) (96,116) (63,609) (20,244) interests Income tax (benefit) expense (21,548) (19,378) (8,124) 3,005 Interest expense, net 20,328 7,612 79,892 17,460 Depreciation, amortization and accretion 134,647 97,056 88,689 49,772 $ EBITDA $ (42,160) $ (220,619) $ (54,432) 10,074 Equity compensation 11,248 378 10,805 6,903 Change in fair value of contingent consideration and investments, net (1,535) (24,647) 5,080 1,702 Income from sale-leaseback transfer of tax benefits - (22,764) (32,951) - (Gain) on extinguishment of debt - - (15,417) - Other expense (income), net 267 (2,436) 2,624 108 (Gain) on deconsolidation, net - (5,622) - - Loss on asset sales - strategic sale of non-core assets - - 94,741 - Loss on asset sales - 12,932 - - Impairment of goodwill and long-lived assets, net 59,294 309,724 46,846 - 39 Non-recurring expenses 4,638 12,804 14,745 7,593 $ $
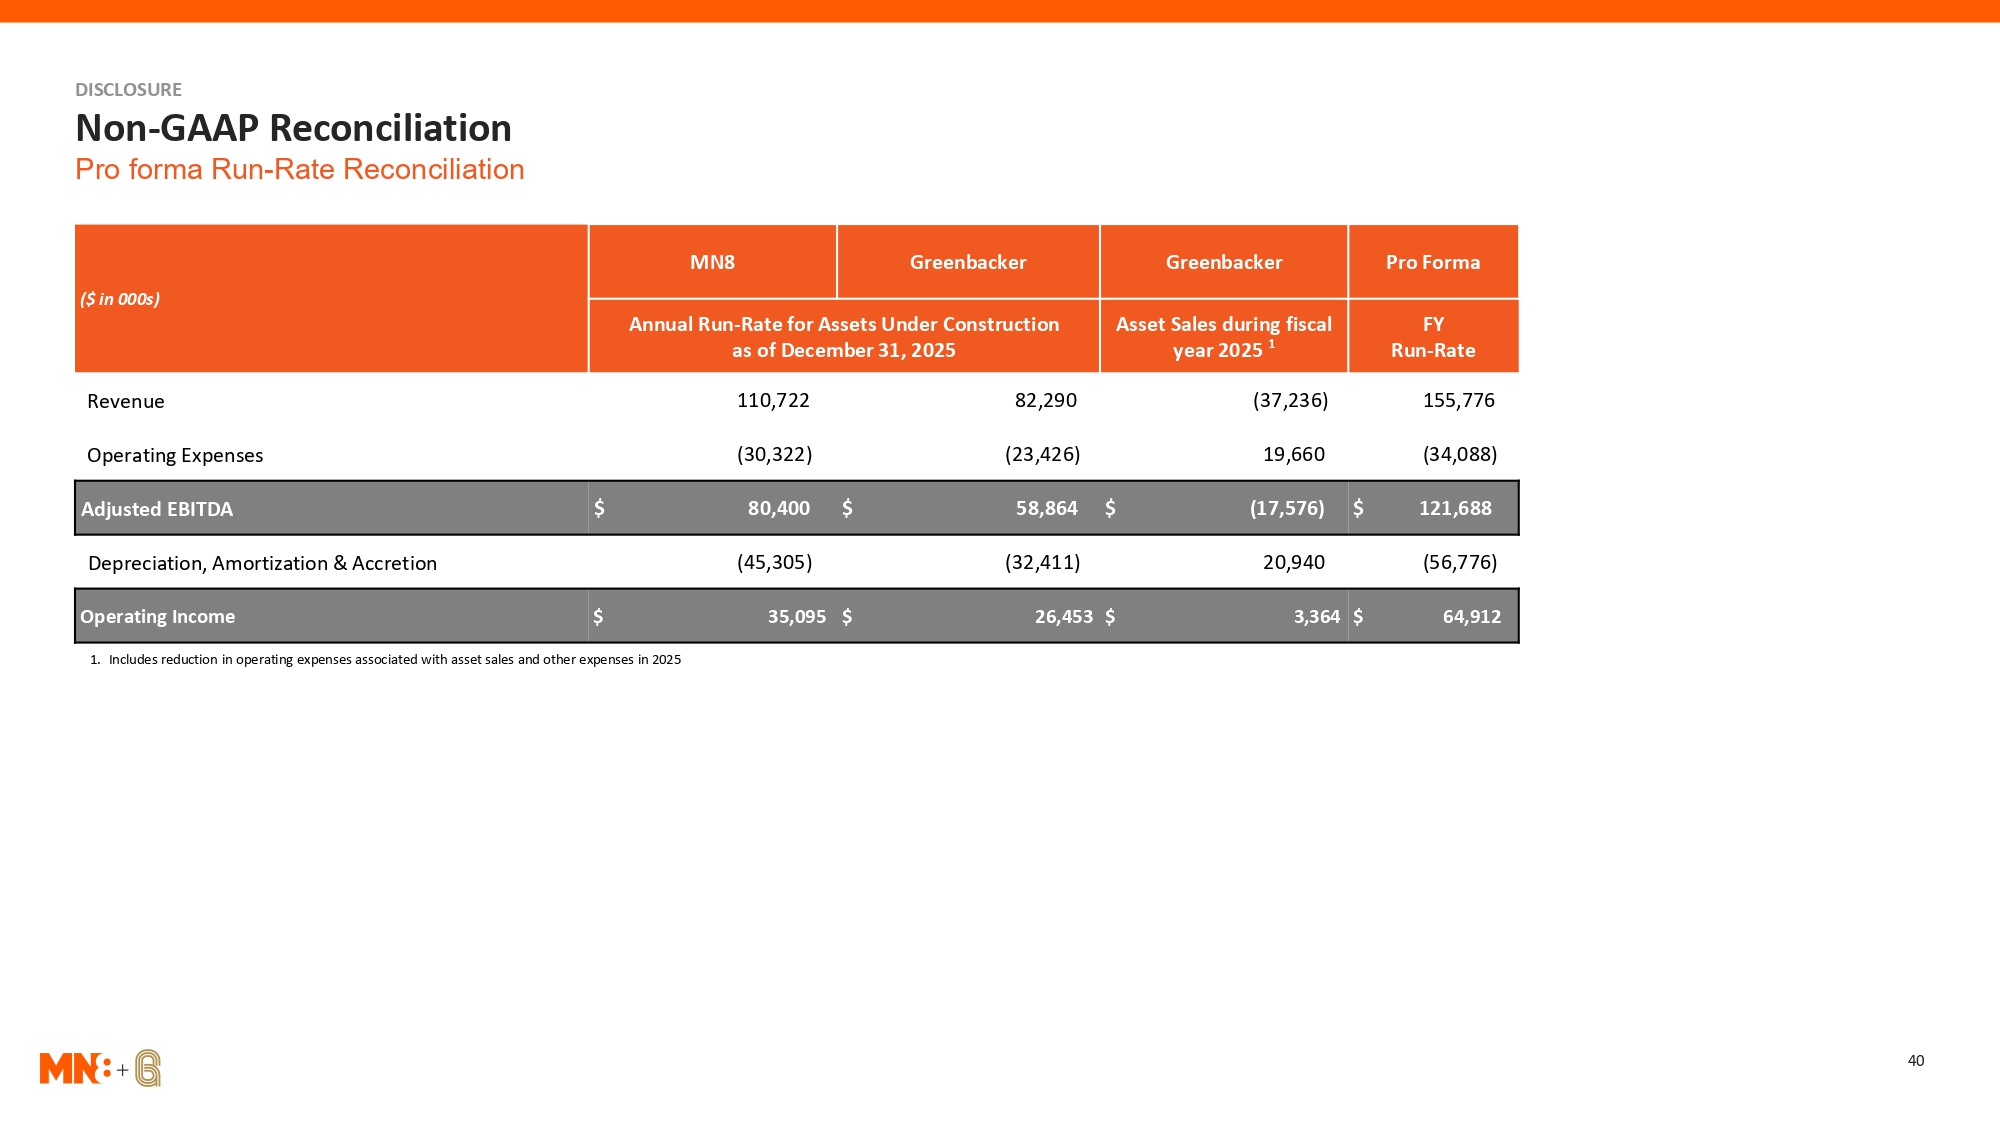
DISCLOSURE Non-GAAP Reconciliation Pro forma Run-Rate Reconciliation MN8 Greenbacker Greenbacker Pro Forma ($ in 000s) Annual Run-Rate for Assets Under Construction Asset Sales during fiscal FY as of December 31, 2025 year 2025 1 Run-Rate Revenue 110,722 82,290 (37,236) 155,776 Operating Expenses (30,322) (23,426) 19,660 (34,088) Adjusted EBITDA $ 80,400 $ 58,864 $ (17,576) $ 121,688 Depreciation, Amortization & Accretion (45,305) (32,411) 20,940 (56,776) Operating Income $ 35,095 $ 26,453 $ 3,364 $ 64,912 1. Includes reduction in operating expenses associated with asset sales and other expenses in 2025 40