SEI Investments Company (NASDAQ: SEIC) Q2 2026 Earnings Presentation
This presentation contains forward-looking statements within the meaning or the rules and regulations of the Securities and Exchange Commission. In some cases you can identify forward-looking statements by terminology, such as "may," "will," "expect," "believe," ”remain” and "continue" or "appear." Our forward-looking statements include our current expectations as to: • the impact, if any, that our activation and execution of our strategic goals will have on our financial results; • whether the investments we have made in the future of our business will become meaningful contributors to our next phase of growth; • the expansion of private markets into retail and retirement channels and the degree to which we will benefit from this expansion, if any; • the degree to which our strategic and tactical direction will make our asset management business stronger and more competitive; • the benefits to us and our clients of embedding Artificial Intelligence into our workflows; • our ability to expand our client opportunities into larger, more strategic, enterprise-wide engagements; • our ability to win large opportunities that leverage existing capabilities, require less incremental investment and contribute more quickly to financial results; • our level of engagement with the largest and most sophisticated firms in our target markets; • our ability to convert sales events into revenue as well as the speed of this conversion; • the benefits, if any, of our operating discipline and cost controls; • the repeatability of our sales success; • the contributions to revenue from two large Investment Manager Services relationships announced last year; • the durability of and growth in demand for alternative investments; • the success of our re-contracting activity; • the repeatability of our quarterly results; • our ability to consistently execute against our strategy; • strength of the sales momentum in our businesses and whether this momentum will continue; • our strategic priorities and focus; • how we will use and deploy our capital and the reasons for our capital allocation methodologies; • the opportunities for us in the area of Artificial Intelligence and the effect our investments and experiments in Artificial Intelligence will expand our addressable markets; • the level of demand for outsourcing, investment advice and the margin sensitivity of these services; • the benefits that we and our stakeholders will receive as a consequence of our partnership with Stratos Wealth Management; • the potential consequences resulting from our exposure to private credit and the demand for our services from our private credit clients; • our 2026 priorities and commitment to these priorities; • the market dynamics affecting our businesses; • our ability to improve our consolidated margins • our ability to deliver strong financial performance and fund future growth initiatives • our growth outpacing our expenses; • the expansion of our enterprise engagement; • the robustness of activity in our IMS business; • the revenue we derive from alternative investment mandates; • the strength of our pipelines; • the level at which we return capital to shareholders and repurchase our stock; • the demand for our products and services; and • our ability to deliver long-term value for clients, employees and shareholders. You should not place undue reliance on our forward-looking statements, as they are based on the current beliefs and expectations of our management and subject to significant risks and uncertainties, many of which are beyond our control or are subject to change. Although we believe the assumptions upon which we base our forward-looking statements are reasonable, they could be inaccurate. Some of the risks and important factors that could cause actual results to differ from those described in our forward-looking statements can be found in the "Risk Factors" section of our Annual Report on Form 10-K for the year ended Dec. 31, 2025, filed with the Securities and Exchange Commission. Past performance does not guarantee future results. Safe Harbor Statement 2 SEI Earnings PresentationQ2 2026
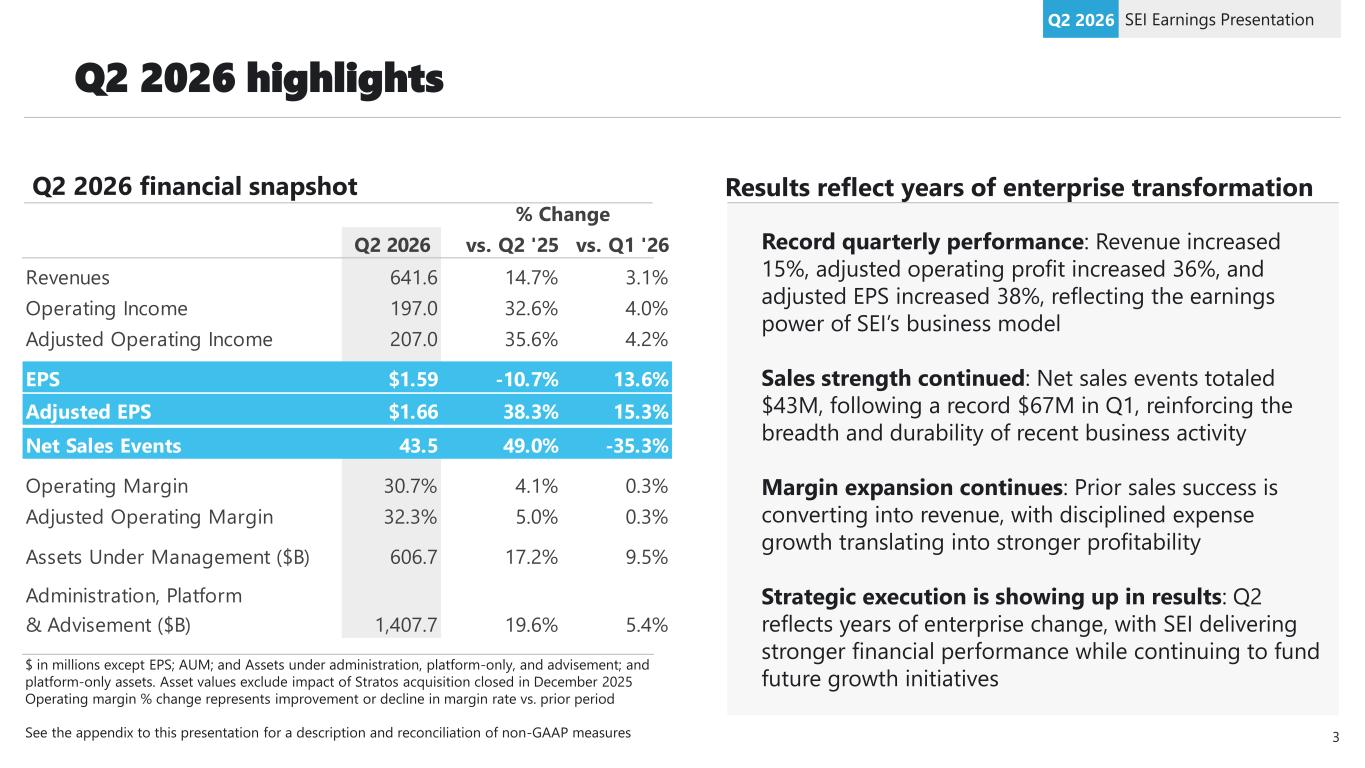
Q2 2026 vs. Q2 '25 vs. Q1 '26 Revenues 641.6 14.7% 3.1% Operating Income 197.0 32.6% 4.0% Adjusted Operating Income 207.0 35.6% 4.2% EPS $1.59 -10.7% 13.6% Adjusted EPS $1.66 38.3% 15.3% Net Sales Events 43.5 49.0% -35.3% Operating Margin 30.7% 4.1% 0.3% Adjusted Operating Margin 32.3% 5.0% 0.3% Assets Under Management ($B) 606.7 17.2% 9.5% Administration, Platform & Advisement ($B) 1,407.7 19.6% 5.4% % Change Q2 2026 highlights SEI Earnings PresentationQ2 2026 Record quarterly performance: Revenue increased 15%, adjusted operating profit increased 36%, and adjusted EPS increased 38%, reflecting the earnings power of SEI’s business model Sales strength continued: Net sales events totaled $43M, following a record $67M in Q1, reinforcing the breadth and durability of recent business activity Margin expansion continues: Prior sales success is converting into revenue, with disciplined expense growth translating into stronger profitability Strategic execution is showing up in results: Q2 reflects years of enterprise change, with SEI delivering stronger financial performance while continuing to fund future growth initiatives $ in millions except EPS; AUM; and Assets under administration, platform-only, and advisement; and platform-only assets. Asset values exclude impact of Stratos acquisition closed in December 2025 Operating margin % change represents improvement or decline in margin rate vs. prior period Results reflect years of enterprise transformationQ2 2026 financial snapshot 3See the appendix to this presentation for a description and reconciliation of non-GAAP measures
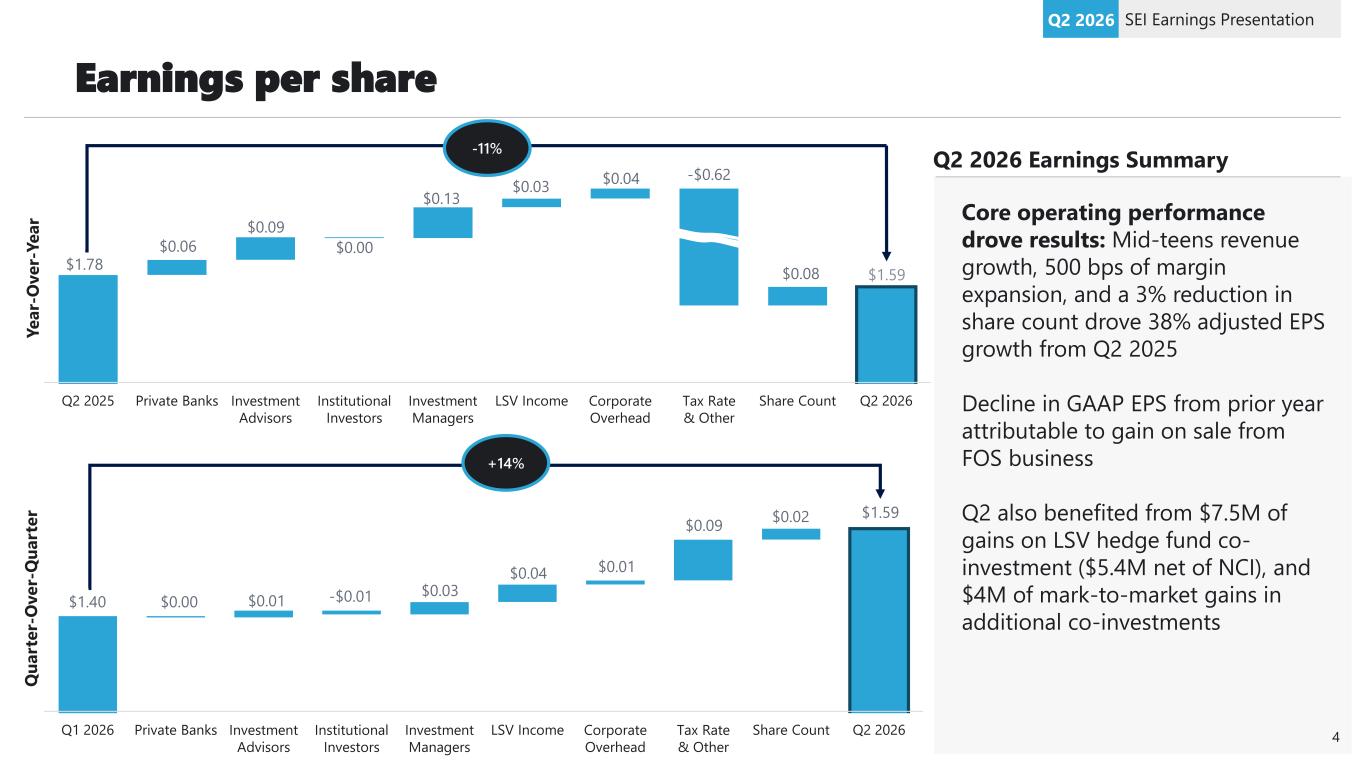
Earnings per share SEI Earnings PresentationQ2 2026 Core operating performance drove results: Mid-teens revenue growth, 500 bps of margin expansion, and a 3% reduction in share count drove 38% adjusted EPS growth from Q2 2025 Decline in GAAP EPS from prior year attributable to gain on sale from FOS business Q2 also benefited from $7.5M of gains on LSV hedge fund co- investment ($5.4M net of NCI), and $4M of mark-to-market gains in additional co-investments Q2 2026 Earnings Summary Q2 2025 Private Banks Investment Advisors Institutional Investors Investment Managers LSV Income Corporate Overhead Tax Rate & Other Share Count Q2 2026 -11% Q1 2026 Private Banks Investment Advisors Institutional Investors Investment Managers LSV Income Corporate Overhead Tax Rate & Other Share Count Q2 2026 +14% Y e a r- O v e r- Y e a r Q u a rt e r- O v e r- Q u a rt e r 4 $1.78 $0.06 $0.09 $0.00 $0.13 $0.03 $0.04 -$0.62 $0.08 $1.59 $1.40 $0.00 $0.01 -$0.01 $0.03 $0.04 $0.01 $0.09 $0.02 $1.59
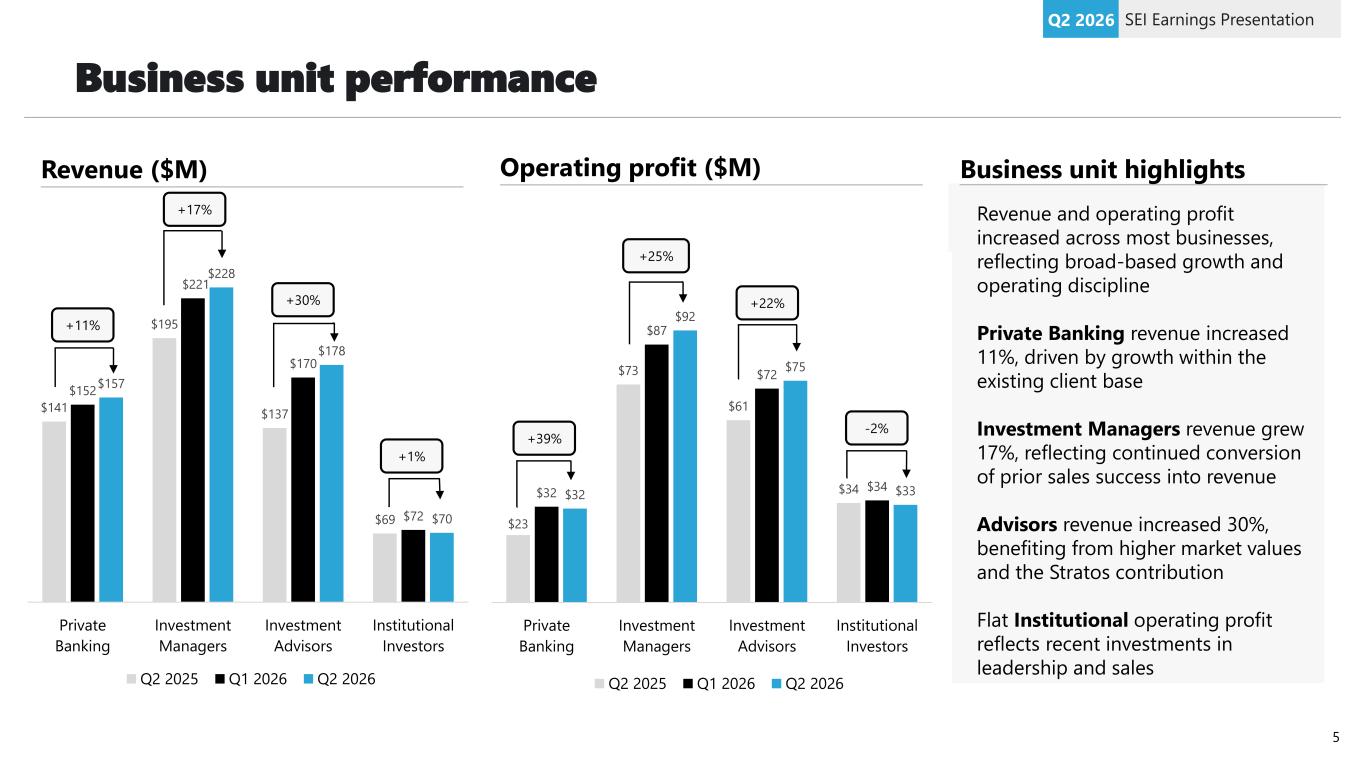
Business unit performance SEI Earnings PresentationQ2 2026 Revenue ($M) Revenue and operating profit increased across most businesses, reflecting broad-based growth and operating discipline Private Banking revenue increased 11%, driven by growth within the existing client base Investment Managers revenue grew 17%, reflecting continued conversion of prior sales success into revenue Advisors revenue increased 30%, benefiting from higher market values and the Stratos contribution Flat Institutional operating profit reflects recent investments in leadership and sales Business unit highlightsOperating profit ($M) $141 $195 $137 $69 $152 $221 $170 $72 $157 $228 $178 $70 Private Banking Investment Managers Investment Advisors Institutional Investors Q2 2025 Q1 2026 Q2 2026 $23 $73 $61 $34$32 $87 $72 $34 $32 $92 $75 $33 Private Banking Investment Managers Investment Advisors Institutional Investors Q2 2025 Q1 2026 Q2 2026 +11% +17% +30% +1% +39% +25% +22% -2% 5
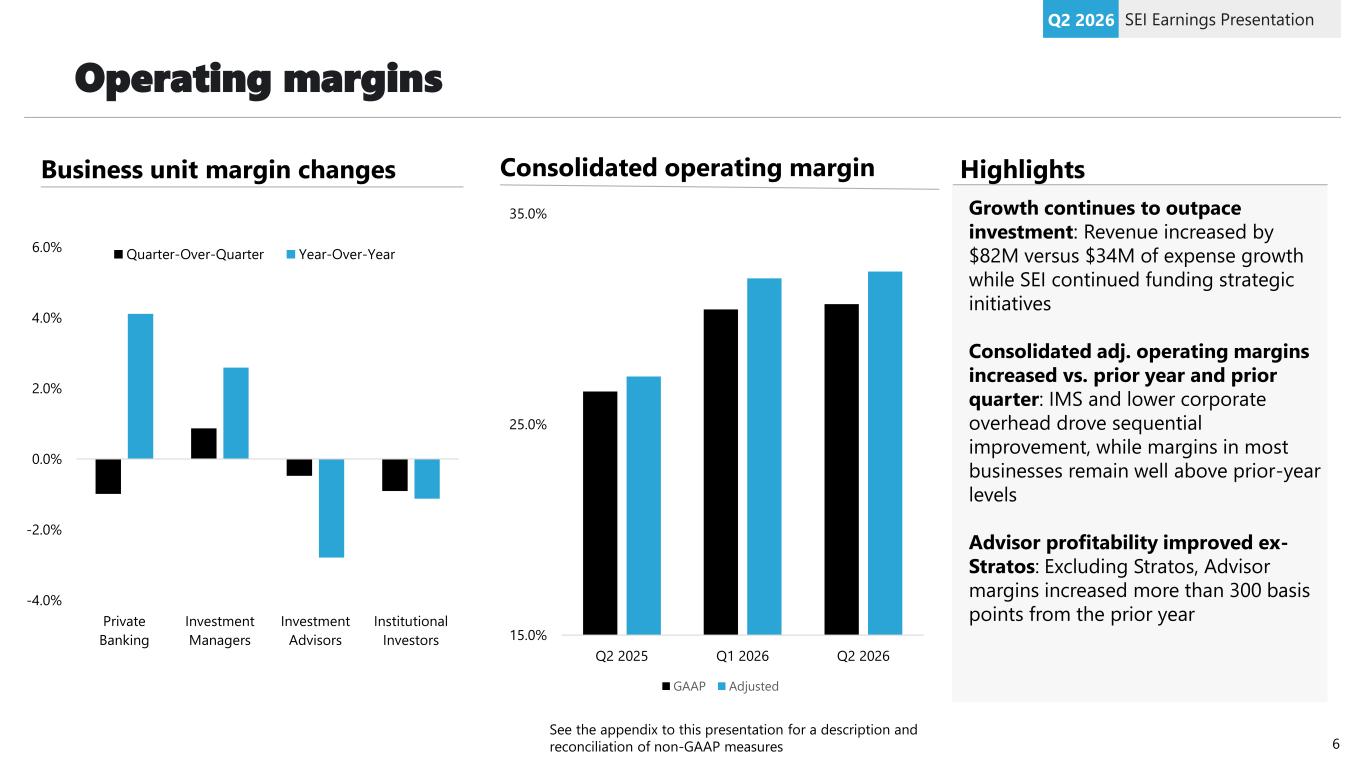
Operating margins SEI Earnings PresentationQ2 2026 -4.0% -2.0% 0.0% 2.0% 4.0% 6.0% Private Banking Investment Managers Investment Advisors Institutional Investors Quarter-Over-Quarter Year-Over-Year Business unit margin changes HighlightsConsolidated operating margin 15.0% 25.0% 35.0% Q2 2025 Q1 2026 Q2 2026 GAAP Adjusted Growth continues to outpace investment: Revenue increased by $82M versus $34M of expense growth while SEI continued funding strategic initiatives Consolidated adj. operating margins increased vs. prior year and prior quarter: IMS and lower corporate overhead drove sequential improvement, while margins in most businesses remain well above prior-year levels Advisor profitability improved ex- Stratos: Excluding Stratos, Advisor margins increased more than 300 basis points from the prior year 6 See the appendix to this presentation for a description and reconciliation of non-GAAP measures
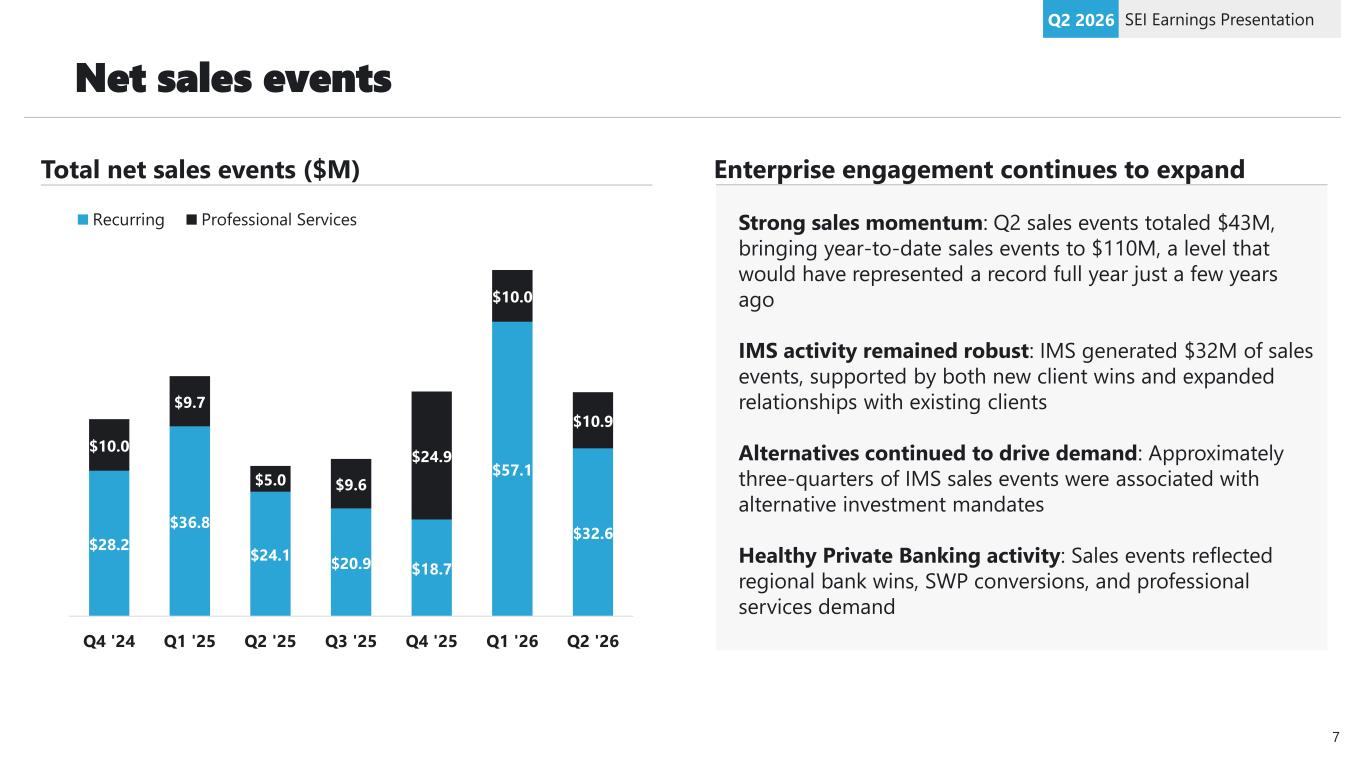
Net sales events SEI Earnings PresentationQ2 2026 $28.2 $36.8 $24.1 $20.9 $18.7 $57.1 $32.6 $10.0 $9.7 $5.0 $9.6 $24.9 $10.0 $10.9 Q4 '24 Q1 '25 Q2 '25 Q3 '25 Q4 '25 Q1 '26 Q2 '26 Recurring Professional Services Total net sales events ($M) Strong sales momentum: Q2 sales events totaled $43M, bringing year-to-date sales events to $110M, a level that would have represented a record full year just a few years ago IMS activity remained robust: IMS generated $32M of sales events, supported by both new client wins and expanded relationships with existing clients Alternatives continued to drive demand: Approximately three-quarters of IMS sales events were associated with alternative investment mandates Healthy Private Banking activity: Sales events reflected regional bank wins, SWP conversions, and professional services demand Enterprise engagement continues to expand 7
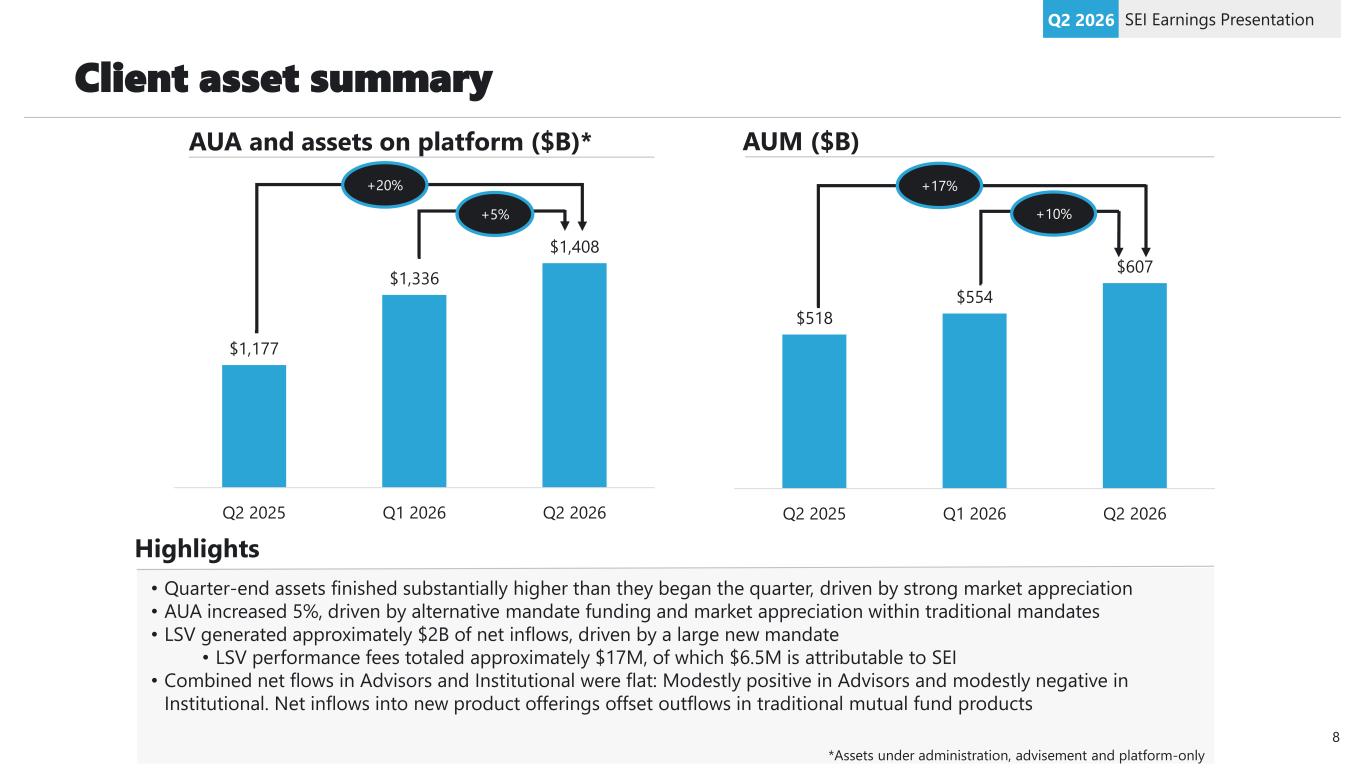
Client asset summary SEI Earnings PresentationQ2 2026 AUA and assets on platform ($B)* AUM ($B) $1,177 $1,336 $1,408 Q2 2025 Q1 2026 Q2 2026 +20% +5% $518 $554 $607 Q2 2025 Q1 2026 Q2 2026 +17% +10% Highlights • Quarter-end assets finished substantially higher than they began the quarter, driven by strong market appreciation • AUA increased 5%, driven by alternative mandate funding and market appreciation within traditional mandates • LSV generated approximately $2B of net inflows, driven by a large new mandate • LSV performance fees totaled approximately $17M, of which $6.5M is attributable to SEI • Combined net flows in Advisors and Institutional were flat: Modestly positive in Advisors and modestly negative in Institutional. Net inflows into new product offerings offset outflows in traditional mutual fund products *Assets under administration, advisement and platform-only 8
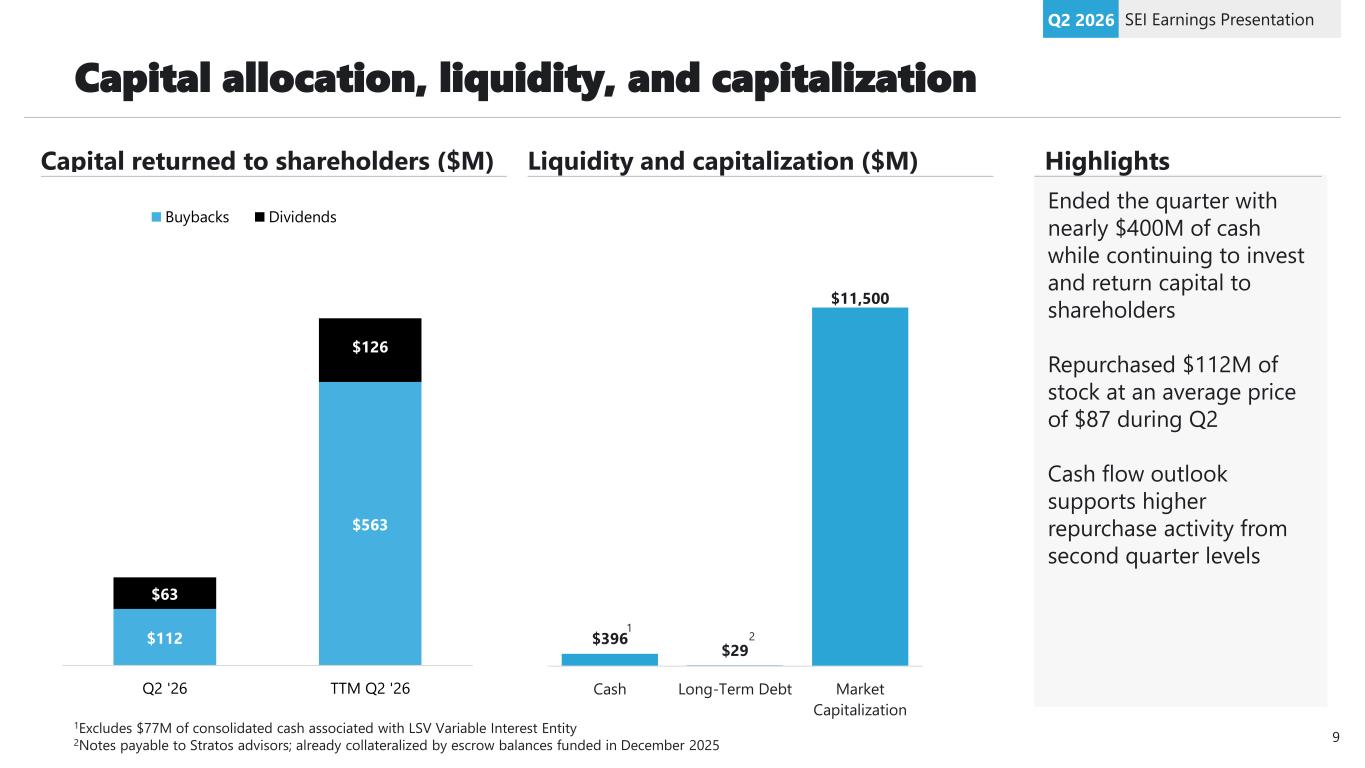
Capital allocation, liquidity, and capitalization SEI Earnings PresentationQ2 2026 Capital returned to shareholders ($M) Liquidity and capitalization ($M) $396 $29 $11,500 Cash Long-Term Debt Market Capitalization Ended the quarter with nearly $400M of cash while continuing to invest and return capital to shareholders Repurchased $112M of stock at an average price of $87 during Q2 Cash flow outlook supports higher repurchase activity from second quarter levels Highlights 9 $112 $563 $63 $126 Q2 '26 TTM Q2 '26 Buybacks Dividends 1Excludes $77M of consolidated cash associated with LSV Variable Interest Entity 2Notes payable to Stratos advisors; already collateralized by escrow balances funded in December 2025 1 2
For institutional investor and financial advisor use only. Not for distribution to general public. Thank you 10
For institutional investor and financial advisor use only. Not for distribution to general public. Appendix 11
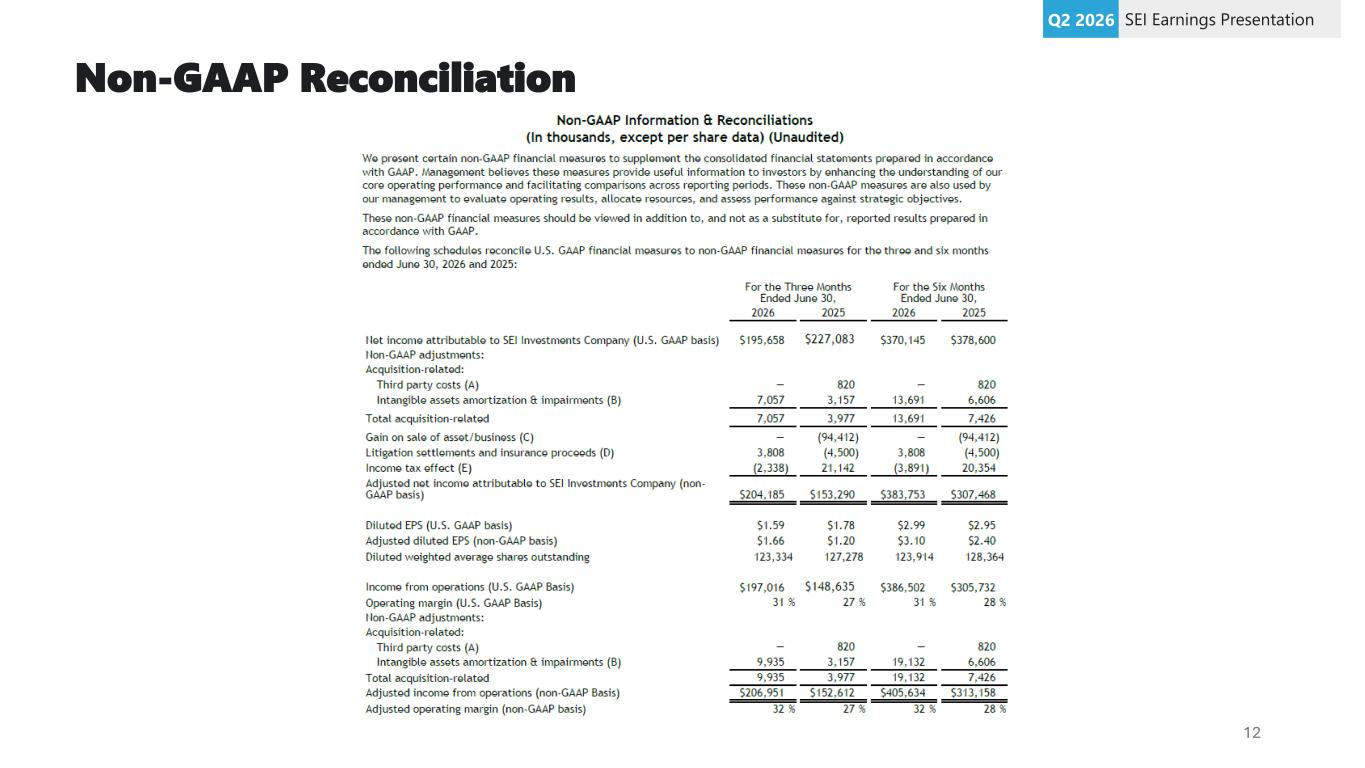
Non-GAAP Reconciliation SEI Earnings PresentationQ2 2026 12
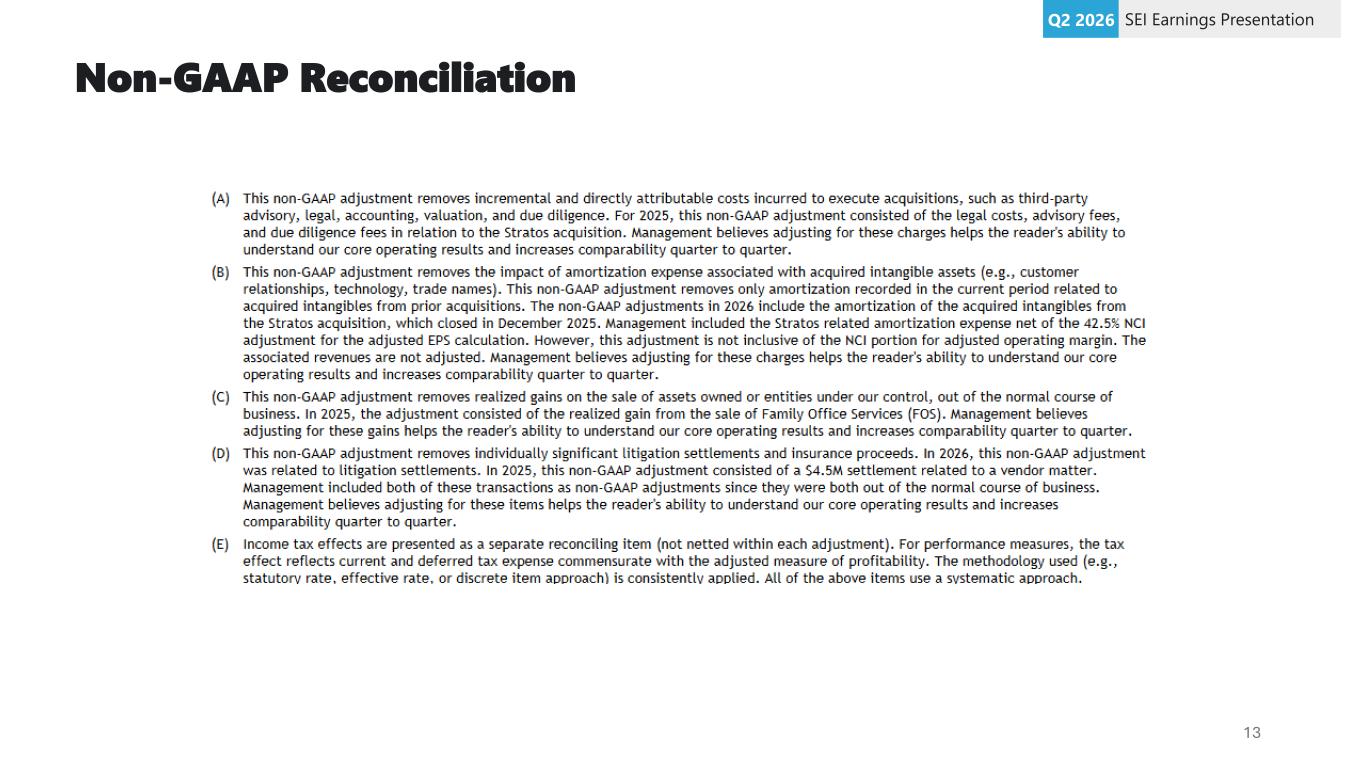
Non-GAAP Reconciliation SEI Earnings PresentationQ2 2026 13