Shareholder Report
|
12 Months Ended |
|
May 31, 2026
USD ($)
Holding
|
|---|
| Shareholder Report [Line Items] |
|
| Document Type |
N-CSR
|
| Amendment Flag |
false
|
| Registrant Name |
T. ROWE PRICE RETIREMENT FUNDS, INC.
|
| Entity Central Index Key |
0001177017
|
| Entity Investment Company Type |
N-1A
|
| Document Period End Date |
May 31, 2026
|
| Shareholder Report Annual or Semi-Annual |
Annual Shareholder Report
|
| C000129662 |
|
| Shareholder Report [Line Items] |
|
| Fund Name |
Target 2015 Fund
|
| Class Name |
Investor Class
|
| Trading Symbol |
TRRTX
|
| Annual or Semi-Annual Statement [Text Block] |
This annual shareholder report contains important information about Target 2015 Fund (the "fund") for the period of June 1, 2025 to May 31, 2026.
|
| Additional Information [Text Block] |
You can find the fund’s prospectus, financial information on Form N‑CSR (which includes required tax information for dividends), holdings, proxy voting information, and other information atwww.troweprice.com/prospectus. You can also request this information without charge by contacting T. Rowe Price at 1‑800‑638‑5660 or info@troweprice.com or contacting your intermediary.
|
| Material Fund Change Notice [Text Block] |
|
| Additional Information Phone Number |
1‑800‑638‑5660
|
| Additional Information Email |
<span style="box-sizing: border-box; color: rgb(0, 0, 0); display: inline; flex-wrap: nowrap; font-size: 13.3333px; font-weight: 400; grid-area: auto; line-height: 17.3333px; margin: 0px; overflow: visible; text-align: justify; text-align-last: left; white-space-collapse: preserve-breaks;">info@troweprice.com</span>
|
| Additional Information Website |
www.troweprice.com/prospectus
|
| Expenses [Text Block] |
What were the fund costs for the last year? (based on a hypothetical $10,000 investment)
Table Summary
|
Costs of a $10,000 investment |
Costs paid as a percentage of a $10,000 investment |
Target 2015 Fund - Investor Class |
$48 |
0.45% | |
| Expenses Paid, Amount |
$ 48
|
| Expense Ratio, Percent |
0.45%
|
| Factors Affecting Performance [Text Block] |
What drove fund performance during the past 12 months?Global stock indexes and fixed income markets generated strong returns for the 12 months ended May 31, 2026. Equities were supported by solid corporate earnings, enthusiasm for artificial intelligence and semiconductor-related investments, and periods of easing monetary policy as major central banks, including the Federal Reserve, reduced interest rates in late 2025. Despite volatility from shifting U.S. tariff policies and the U.S.-Iran conflict, markets recovered as ceasefire progress reduced energy-price pressures and improved investor sentiment, while fixed income benefited from declining yields, resilient credit markets, and easing geopolitical risks. Compared with the style-specific S&P Target Date 2015 Index, glide path effect contributed to results for the period. Despite bouts of volatility, global equity markets advanced significantly over the year, and the fund’s greater total equity exposure versus the benchmark was beneficial. Additionally, an overweight allocation to emerging markets equities, which strongly outpaced international developed markets, had a positive impact on relative results. Conversely, security selection within some of the underlying portfolios detracted from relative results, including allocations to U.S. large-cap value, core, and growth stocks. The fund seeks the highest total return over time consistent with an emphasis on both capital growth and income. The fund invests in a diversified portfolio of other T. Rowe Price stock and bond mutual funds that represent various asset classes and sectors. Its allocation among T. Rowe Price funds will change over time in relation to its target retirement date.
|
| Performance Past Does Not Indicate Future [Text] |
The fund’s past performance is not a good predictor of the fund’s future performance.
|
| Line Graph [Table Text Block] |
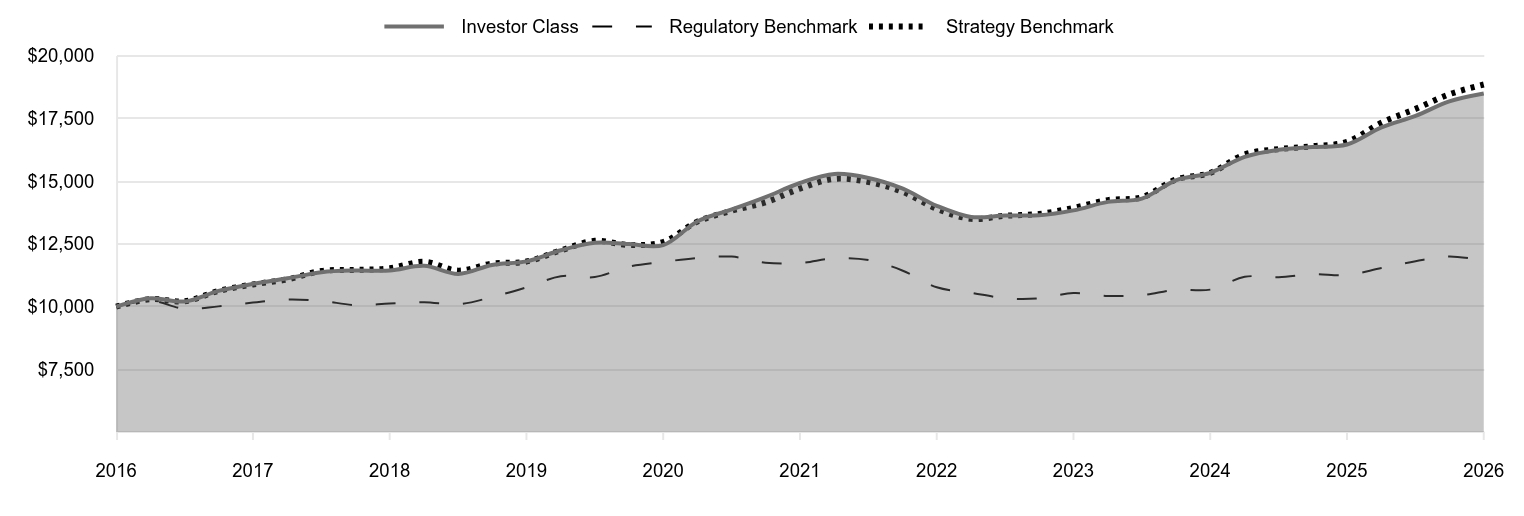
Table Summary
|
Investor Class |
Regulatory Benchmark |
Strategy Benchmark |
2016 |
10,000 |
10,000 |
10,000 |
2016 |
10,331 |
10,232 |
10,296 |
2016 |
10,203 |
9,908 |
10,211 |
2017 |
10,625 |
10,008 |
10,622 |
2017 |
10,908 |
10,158 |
10,883 |
2017 |
11,126 |
10,283 |
11,084 |
2017 |
11,371 |
10,227 |
11,422 |
2018 |
11,438 |
10,059 |
11,458 |
2018 |
11,438 |
10,120 |
11,524 |
2018 |
11,624 |
10,175 |
11,784 |
2018 |
11,301 |
10,089 |
11,433 |
2019 |
11,660 |
10,378 |
11,716 |
2019 |
11,803 |
10,768 |
11,794 |
2019 |
12,244 |
11,210 |
12,243 |
2019 |
12,542 |
11,178 |
12,621 |
2020 |
12,493 |
11,590 |
12,457 |
2020 |
12,450 |
11,781 |
12,575 |
2020 |
13,405 |
11,936 |
13,391 |
2020 |
13,871 |
11,992 |
13,821 |
2021 |
14,363 |
11,750 |
14,156 |
2021 |
14,926 |
11,734 |
14,704 |
2021 |
15,286 |
11,925 |
15,091 |
2021 |
15,128 |
11,854 |
14,967 |
2022 |
14,711 |
11,440 |
14,582 |
2022 |
14,017 |
10,769 |
13,899 |
2022 |
13,573 |
10,552 |
13,500 |
2022 |
13,633 |
10,332 |
13,621 |
2023 |
13,640 |
10,328 |
13,691 |
2023 |
13,835 |
10,538 |
13,936 |
2023 |
14,174 |
10,426 |
14,244 |
2023 |
14,305 |
10,454 |
14,357 |
2024 |
15,035 |
10,671 |
15,065 |
2024 |
15,333 |
10,676 |
15,329 |
2024 |
15,969 |
11,187 |
16,064 |
2024 |
16,253 |
11,173 |
16,279 |
2025 |
16,361 |
11,291 |
16,392 |
2025 |
16,461 |
11,258 |
16,566 |
2025 |
17,144 |
11,538 |
17,329 |
2025 |
17,600 |
11,809 |
17,881 |
2026 |
18,180 |
11,998 |
18,464 |
2026 |
18,496 |
11,836 |
18,854 |
|
| Average Annual Return [Table Text Block] |
Table Summary
|
1 Year |
5 Years |
10 Years |
Target 2015 Fund (Investor Class) |
12.37% |
4.38% |
6.34% |
Bloomberg U.S. Aggregate Bond Index (Regulatory Benchmark) |
5.13 |
0.17 |
1.70 |
S&P Target Date 2015 Index (Strategy Benchmark) |
13.81 |
5.10 |
6.55 | |
| No Deduction of Taxes [Text Block] |
Neither the fund’s returns nor the index returns reflect the deduction of taxes that a shareholder would pay on fund distributions or redemptions of fund shares.
|
| Updated Performance Information Location [Text Block] |
Updated performance information can be found at www.troweprice.com.
|
| Distribution of Capital [Text Block] |
The fund's total return figures reflect the reinvestment of dividends and capital gains, if any.
|
| AssetsNet |
$ 156,651,000
|
| Holdings Count | Holding |
26
|
| Advisory Fees Paid, Amount |
$ 552,000
|
| InvestmentCompanyPortfolioTurnover |
23.30%
|
| Additional Fund Statistics Significance or Limits [Text Block] |
What are some fund statistics? - Total Net Assets (000s)$156,651
- Number of Portfolio Holdings26
|
| Holdings [Text Block] |
Table Summary
Domestic Bond Funds |
45.1% |
Domestic Equity Funds |
27.0 |
International Bond Funds |
17.0 |
International Equity Funds |
9.6 |
Short-Term and Other |
1.3 | |
| Largest Holdings [Text Block] |
Table Summary
T. Rowe Price Limited Duration Inflation Focused Bond Fund |
20.4% |
T. Rowe Price New Income Fund |
18.2 |
T. Rowe Price International Bond Fund (USD Hedged) |
6.9 |
T. Rowe Price Growth Stock Fund |
5.7 |
T. Rowe Price Value Fund |
5.5 |
T. Rowe Price Dynamic Global Bond Fund |
4.2 |
T. Rowe Price Emerging Markets Bond Fund |
4.1 |
T. Rowe Price Hedged Equity Fund |
3.6 |
T. Rowe Price High Yield Fund |
3.1 |
T. Rowe Price U.S. Large-Cap Core Fund |
3.1 | |
| Material Fund Change [Text Block] |
|
| Updated Prospectus Web Address |
www.troweprice.com/paperless
|
| C000129663 |
|
| Shareholder Report [Line Items] |
|
| Fund Name |
Target 2015 Fund
|
| Class Name |
Advisor Class
|
| Trading Symbol |
PAHRX
|
| Annual or Semi-Annual Statement [Text Block] |
This annual shareholder report contains important information about Target 2015 Fund (the "fund") for the period of June 1, 2025 to May 31, 2026.
|
| Additional Information [Text Block] |
You can find the fund’s prospectus, financial information on Form N‑CSR (which includes required tax information for dividends), holdings, proxy voting information, and other information atwww.troweprice.com/prospectus. You can also request this information without charge by contacting T. Rowe Price at 1‑800‑638‑5660 or info@troweprice.com or contacting your intermediary.
|
| Material Fund Change Notice [Text Block] |
|
| Additional Information Phone Number |
1‑800‑638‑5660
|
| Additional Information Email |
<span style="box-sizing: border-box; color: rgb(0, 0, 0); display: inline; flex-wrap: nowrap; font-size: 13.3333px; font-weight: 400; grid-area: auto; line-height: 17.3333px; margin: 0px; overflow: visible; text-align: justify; text-align-last: left; white-space-collapse: preserve-breaks;">info@troweprice.com</span>
|
| Additional Information Website |
www.troweprice.com/prospectus
|
| Expenses [Text Block] |
What were the fund costs for the last year? (based on a hypothetical $10,000 investment)
Table Summary
|
Costs of a $10,000 investment |
Costs paid as a percentage of a $10,000 investment |
Target 2015 Fund - Advisor Class |
$74 |
0.70% | |
| Expenses Paid, Amount |
$ 74
|
| Expense Ratio, Percent |
0.70%
|
| Factors Affecting Performance [Text Block] |
What drove fund performance during the past 12 months?Global stock indexes and fixed income markets generated strong returns for the 12 months ended May 31, 2026. Equities were supported by solid corporate earnings, enthusiasm for artificial intelligence and semiconductor-related investments, and periods of easing monetary policy as major central banks, including the Federal Reserve, reduced interest rates in late 2025. Despite volatility from shifting U.S. tariff policies and the U.S.-Iran conflict, markets recovered as ceasefire progress reduced energy-price pressures and improved investor sentiment, while fixed income benefited from declining yields, resilient credit markets, and easing geopolitical risks. Compared with the style-specific S&P Target Date 2015 Index, glide path effect contributed to results for the period. Despite bouts of volatility, global equity markets advanced significantly over the year, and the fund’s greater total equity exposure versus the benchmark was beneficial. Additionally, an overweight allocation to emerging markets equities, which strongly outpaced international developed markets, had a positive impact on relative results. Conversely, security selection within some of the underlying portfolios detracted from relative results, including allocations to U.S. large-cap value, core, and growth stocks. The fund seeks the highest total return over time consistent with an emphasis on both capital growth and income. The fund invests in a diversified portfolio of other T. Rowe Price stock and bond mutual funds that represent various asset classes and sectors. Its allocation among T. Rowe Price funds will change over time in relation to its target retirement date.
|
| Performance Past Does Not Indicate Future [Text] |
The fund’s past performance is not a good predictor of the fund’s future performance.
|
| Line Graph [Table Text Block] |
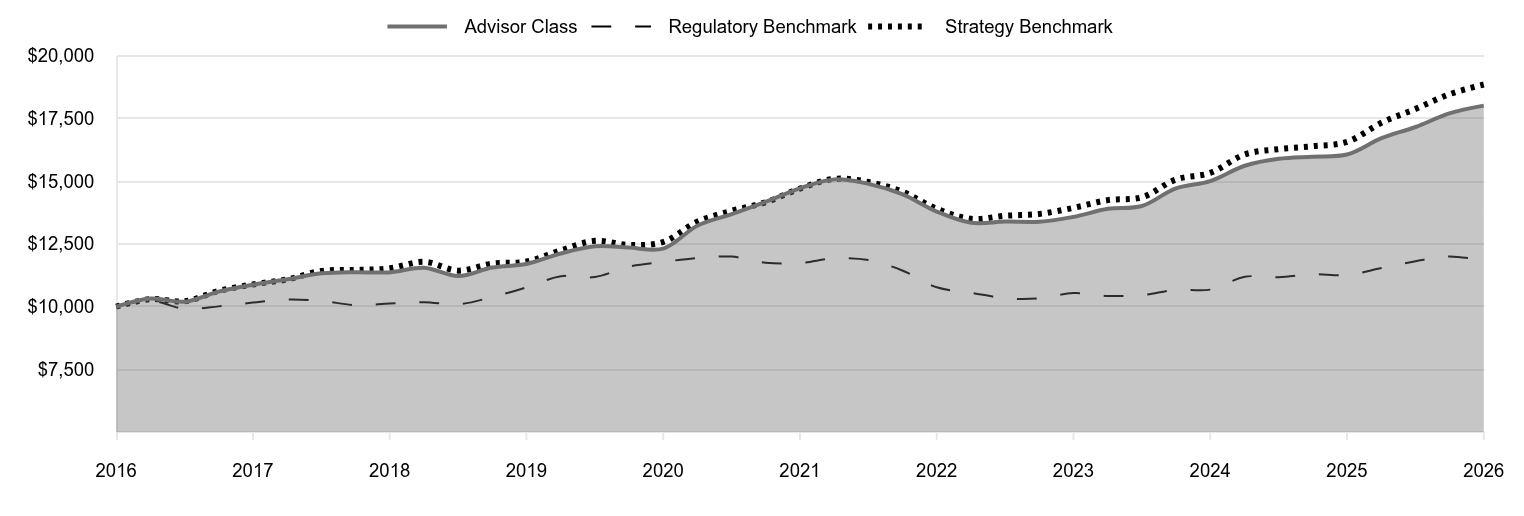
Table Summary
|
Advisor Class |
Regulatory Benchmark |
Strategy Benchmark |
2016 |
10,000 |
10,000 |
10,000 |
2016 |
10,323 |
10,232 |
10,296 |
2016 |
10,194 |
9,908 |
10,211 |
2017 |
10,598 |
10,008 |
10,622 |
2017 |
10,872 |
10,158 |
10,883 |
2017 |
11,089 |
10,283 |
11,084 |
2017 |
11,325 |
10,227 |
11,422 |
2018 |
11,373 |
10,059 |
11,458 |
2018 |
11,363 |
10,120 |
11,524 |
2018 |
11,548 |
10,175 |
11,784 |
2018 |
11,217 |
10,089 |
11,433 |
2019 |
11,556 |
10,378 |
11,716 |
2019 |
11,699 |
10,768 |
11,794 |
2019 |
12,116 |
11,210 |
12,243 |
2019 |
12,402 |
11,178 |
12,621 |
2020 |
12,354 |
11,590 |
12,457 |
2020 |
12,312 |
11,781 |
12,575 |
2020 |
13,235 |
11,936 |
13,391 |
2020 |
13,686 |
11,992 |
13,821 |
2021 |
14,172 |
11,750 |
14,156 |
2021 |
14,716 |
11,734 |
14,704 |
2021 |
15,071 |
11,925 |
15,091 |
2021 |
14,893 |
11,854 |
14,967 |
2022 |
14,482 |
11,440 |
14,582 |
2022 |
13,787 |
10,769 |
13,899 |
2022 |
13,339 |
10,552 |
13,500 |
2022 |
13,387 |
10,332 |
13,621 |
2023 |
13,384 |
10,328 |
13,691 |
2023 |
13,576 |
10,538 |
13,936 |
2023 |
13,896 |
10,426 |
14,244 |
2023 |
14,011 |
10,454 |
14,357 |
2024 |
14,714 |
10,671 |
15,065 |
2024 |
15,005 |
10,676 |
15,329 |
2024 |
15,614 |
11,187 |
16,064 |
2024 |
15,892 |
11,173 |
16,279 |
2025 |
15,977 |
11,291 |
16,392 |
2025 |
16,061 |
11,258 |
16,566 |
2025 |
16,714 |
11,538 |
17,329 |
2025 |
17,159 |
11,809 |
17,881 |
2026 |
17,703 |
11,998 |
18,464 |
2026 |
18,012 |
11,836 |
18,854 |
|
| Average Annual Return [Table Text Block] |
Table Summary
|
1 Year |
5 Years |
10 Years |
Target 2015 Fund (Advisor Class) |
12.15% |
4.12% |
6.06% |
Bloomberg U.S. Aggregate Bond Index (Regulatory Benchmark) |
5.13 |
0.17 |
1.70 |
S&P Target Date 2015 Index (Strategy Benchmark) |
13.81 |
5.10 |
6.55 | |
| No Deduction of Taxes [Text Block] |
Neither the fund’s returns nor the index returns reflect the deduction of taxes that a shareholder would pay on fund distributions or redemptions of fund shares.
|
| Updated Performance Information Location [Text Block] |
Updated performance information can be found at www.troweprice.com.
|
| Distribution of Capital [Text Block] |
The fund's total return figures reflect the reinvestment of dividends and capital gains, if any.
|
| AssetsNet |
$ 156,651,000
|
| Holdings Count | Holding |
26
|
| Advisory Fees Paid, Amount |
$ 552,000
|
| InvestmentCompanyPortfolioTurnover |
23.30%
|
| Additional Fund Statistics Significance or Limits [Text Block] |
What are some fund statistics? - Total Net Assets (000s)$156,651
- Number of Portfolio Holdings26
|
| Holdings [Text Block] |
Table Summary
Domestic Bond Funds |
45.1% |
Domestic Equity Funds |
27.0 |
International Bond Funds |
17.0 |
International Equity Funds |
9.6 |
Short-Term and Other |
1.3 | |
| Largest Holdings [Text Block] |
Table Summary
T. Rowe Price Limited Duration Inflation Focused Bond Fund |
20.4% |
T. Rowe Price New Income Fund |
18.2 |
T. Rowe Price International Bond Fund (USD Hedged) |
6.9 |
T. Rowe Price Growth Stock Fund |
5.7 |
T. Rowe Price Value Fund |
5.5 |
T. Rowe Price Dynamic Global Bond Fund |
4.2 |
T. Rowe Price Emerging Markets Bond Fund |
4.1 |
T. Rowe Price Hedged Equity Fund |
3.6 |
T. Rowe Price High Yield Fund |
3.1 |
T. Rowe Price U.S. Large-Cap Core Fund |
3.1 | |
| Material Fund Change [Text Block] |
|
| Updated Prospectus Web Address |
www.troweprice.com/paperless
|
| C000169042 |
|
| Shareholder Report [Line Items] |
|
| Fund Name |
Target 2015 Fund
|
| Class Name |
I Class
|
| Trading Symbol |
TTRTX
|
| Annual or Semi-Annual Statement [Text Block] |
This annual shareholder report contains important information about Target 2015 Fund (the "fund") for the period of June 1, 2025 to May 31, 2026.
|
| Additional Information [Text Block] |
You can find the fund’s prospectus, financial information on Form N‑CSR (which includes required tax information for dividends), holdings, proxy voting information, and other information atwww.troweprice.com/prospectus. You can also request this information without charge by contacting T. Rowe Price at 1‑800‑638‑5660 or info@troweprice.com or contacting your intermediary.
|
| Material Fund Change Notice [Text Block] |
|
| Additional Information Phone Number |
1‑800‑638‑5660
|
| Additional Information Email |
<span style="box-sizing: border-box; color: rgb(0, 0, 0); display: inline; flex-wrap: nowrap; font-size: 13.3333px; font-weight: 400; grid-area: auto; line-height: 17.3333px; margin: 0px; overflow: visible; text-align: justify; text-align-last: left; white-space-collapse: preserve-breaks;">info@troweprice.com</span>
|
| Additional Information Website |
www.troweprice.com/prospectus
|
| Expenses [Text Block] |
What were the fund costs for the last year? (based on a hypothetical $10,000 investment)
Table Summary
|
Costs of a $10,000 investment |
Costs paid as a percentage of a $10,000 investment |
Target 2015 Fund - I Class |
$32 |
0.30% | |
| Expenses Paid, Amount |
$ 32
|
| Expense Ratio, Percent |
0.30%
|
| Factors Affecting Performance [Text Block] |
What drove fund performance during the past 12 months?Global stock indexes and fixed income markets generated strong returns for the 12 months ended May 31, 2026. Equities were supported by solid corporate earnings, enthusiasm for artificial intelligence and semiconductor-related investments, and periods of easing monetary policy as major central banks, including the Federal Reserve, reduced interest rates in late 2025. Despite volatility from shifting U.S. tariff policies and the U.S.-Iran conflict, markets recovered as ceasefire progress reduced energy-price pressures and improved investor sentiment, while fixed income benefited from declining yields, resilient credit markets, and easing geopolitical risks. Compared with the style-specific S&P Target Date 2015 Index, glide path effect contributed to results for the period. Despite bouts of volatility, global equity markets advanced significantly over the year, and the fund’s greater total equity exposure versus the benchmark was beneficial. Additionally, an overweight allocation to emerging markets equities, which strongly outpaced international developed markets, had a positive impact on relative results. Conversely, security selection within some of the underlying portfolios detracted from relative results, including allocations to U.S. large-cap value, core, and growth stocks. The fund seeks the highest total return over time consistent with an emphasis on both capital growth and income. The fund invests in a diversified portfolio of other T. Rowe Price stock and bond mutual funds that represent various asset classes and sectors. Its allocation among T. Rowe Price funds will change over time in relation to its target retirement date.
|
| Performance Past Does Not Indicate Future [Text] |
The fund’s past performance is not a good predictor of the fund’s future performance.
|
| Line Graph [Table Text Block] |
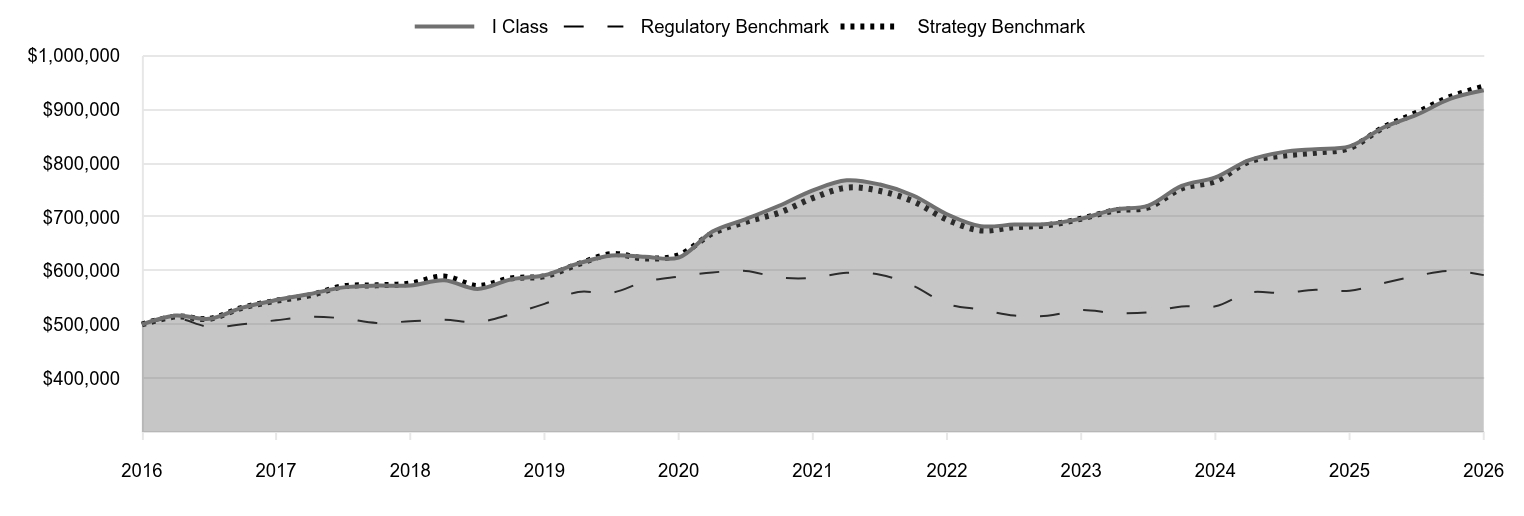
Table Summary
|
I Class |
Regulatory Benchmark |
Strategy Benchmark |
2016 |
500,000 |
500,000 |
500,000 |
2016 |
516,575 |
511,616 |
514,808 |
2016 |
510,589 |
495,403 |
510,537 |
2017 |
531,264 |
500,416 |
531,117 |
2017 |
545,443 |
507,893 |
544,153 |
2017 |
556,787 |
514,136 |
554,191 |
2017 |
569,076 |
511,326 |
571,118 |
2018 |
572,419 |
502,944 |
572,881 |
2018 |
572,419 |
505,990 |
576,193 |
2018 |
582,212 |
508,741 |
589,219 |
2018 |
566,053 |
504,464 |
571,641 |
2019 |
583,787 |
518,886 |
585,776 |
2019 |
591,495 |
538,376 |
589,675 |
2019 |
613,593 |
560,492 |
612,140 |
2019 |
628,496 |
558,902 |
631,073 |
2020 |
626,054 |
579,506 |
622,866 |
2020 |
624,460 |
589,067 |
628,765 |
2020 |
672,822 |
596,775 |
669,529 |
2020 |
696,206 |
599,611 |
691,026 |
2021 |
720,861 |
587,524 |
707,799 |
2021 |
749,606 |
586,682 |
735,201 |
2021 |
768,205 |
596,272 |
754,550 |
2021 |
760,314 |
592,695 |
748,362 |
2022 |
740,023 |
571,989 |
729,121 |
2022 |
705,128 |
538,444 |
694,949 |
2022 |
682,867 |
527,606 |
675,014 |
2022 |
685,875 |
516,596 |
681,039 |
2023 |
687,081 |
516,381 |
684,564 |
2023 |
696,934 |
526,907 |
696,811 |
2023 |
714,012 |
521,310 |
712,213 |
2023 |
721,238 |
522,690 |
717,838 |
2024 |
757,884 |
533,562 |
753,247 |
2024 |
773,588 |
533,786 |
766,451 |
2024 |
805,679 |
559,349 |
803,205 |
2024 |
820,700 |
558,625 |
813,938 |
2025 |
826,259 |
564,552 |
819,616 |
2025 |
831,297 |
562,924 |
828,293 |
2025 |
866,564 |
576,891 |
866,450 |
2025 |
890,315 |
590,474 |
894,049 |
2026 |
919,773 |
599,896 |
923,177 |
2026 |
935,802 |
591,821 |
942,719 |
|
| Average Annual Return [Table Text Block] |
Table Summary
|
1 Year |
5 Years |
10 Years |
Target 2015 Fund (I Class) |
12.57% |
4.54% |
6.47% |
Bloomberg U.S. Aggregate Bond Index (Regulatory Benchmark) |
5.13 |
0.17 |
1.70 |
S&P Target Date 2015 Index (Strategy Benchmark) |
13.81 |
5.10 |
6.55 | |
| No Deduction of Taxes [Text Block] |
Neither the fund’s returns nor the index returns reflect the deduction of taxes that a shareholder would pay on fund distributions or redemptions of fund shares.
|
| Updated Performance Information Location [Text Block] |
Updated performance information can be found at www.troweprice.com.
|
| Distribution of Capital [Text Block] |
The fund's total return figures reflect the reinvestment of dividends and capital gains, if any.
|
| AssetsNet |
$ 156,651,000
|
| Holdings Count | Holding |
26
|
| Advisory Fees Paid, Amount |
$ 552,000
|
| InvestmentCompanyPortfolioTurnover |
23.30%
|
| Additional Fund Statistics Significance or Limits [Text Block] |
What are some fund statistics? - Total Net Assets (000s)$156,651
- Number of Portfolio Holdings26
|
| Holdings [Text Block] |
Table Summary
Domestic Bond Funds |
45.1% |
Domestic Equity Funds |
27.0 |
International Bond Funds |
17.0 |
International Equity Funds |
9.6 |
Short-Term and Other |
1.3 | |
| Largest Holdings [Text Block] |
Table Summary
T. Rowe Price Limited Duration Inflation Focused Bond Fund |
20.4% |
T. Rowe Price New Income Fund |
18.2 |
T. Rowe Price International Bond Fund (USD Hedged) |
6.9 |
T. Rowe Price Growth Stock Fund |
5.7 |
T. Rowe Price Value Fund |
5.5 |
T. Rowe Price Dynamic Global Bond Fund |
4.2 |
T. Rowe Price Emerging Markets Bond Fund |
4.1 |
T. Rowe Price Hedged Equity Fund |
3.6 |
T. Rowe Price High Yield Fund |
3.1 |
T. Rowe Price U.S. Large-Cap Core Fund |
3.1 | |
| Material Fund Change [Text Block] |
|
| Updated Prospectus Web Address |
www.troweprice.com/paperless
|