Pay vs Performance Disclosure - USD ($)
Apr. 30, 2026
Apr. 30, 2025
Apr. 30, 2024
Apr. 30, 2023
Apr. 30, 2022
PAY VERSUS PERFORMANCE DISCLOSURE
Pursuant to Section 953(a) of the Dodd-Frank Act and Item 402(v) of Regulation S-K, the following table sets forth information regarding certain financial performance metrics of the Company and the “compensation actually paid” (“CAP”) to our NEOs, using a methodology that has been prescribed by the SEC.
The C/HC Committee does not utilize CAP as the basis for making compensation decisions. For further information concerning our compensation philosophy and how we align executive compensation with our performance, see the CD&A.
Pay Versus Performance Table | ||||||||||||||||||||||||||
Fiscal Year | Summary Compensation Table For PEO(1)(3) | CAP to PEO(1)(2) | Average Summary Compensation Table for Non-PEO NEOs(1)(3) | Average CAP to Non-PEO NEOs(1)(2) | Value of Initial Fixed $100 Investment based on:(4) | GAAP Net Income | EBITDA(5) | |||||||||||||||||||
Casey’s TSR | Peer Group TSR | |||||||||||||||||||||||||
2026 | $14,741,268 | $83,686,371 | $4,084,058 | $17,652,521 | $381 | $151 | $714,448,000 | $1,483,615,000 | ||||||||||||||||||
2025 | $10,680,190 | $42,464,859 | $2,971,538 | $9,027,522 | $213 | $140 | $546,520,000 | $1,200,047,000 | ||||||||||||||||||
2024 | $10,626,257 | $33,564,809 | $3,066,576 | $8,057,409 | $147 | $122 | $501,972,000 | $1,059,398,000 | ||||||||||||||||||
2023 | $10,607,379 | $18,017,916 | $2,931,535 | $4,874,894 | $104 | $118 | $446,691,000 | $952,464,000 | ||||||||||||||||||
2022 | $9,061,083 | $9,712,877 | $2,862,173 | $3,711,970 | $91 | $115 | $339,790,000 | $801,241,000 | ||||||||||||||||||
(1) | Mr. Rebelez served as our principal executive officer (PEO) for fiscal years 2022-2026. Reflects other NEOs for the applicable years as follows: (i) for 2022, Mr. Bramlage, Ms. Williams, Mr. Brennan and Adrian M. Butler (the Company’s prior Chief Information Officer), and (iii) for 2023-2026, Mr. Bramlage, Ms. Williams, Mr. Brennan and Mr. Frazell. |
(2) | The following amounts were deducted from and/or added to Summary Compensation Table (“SCT”) total compensation in accordance with the SEC-mandated adjustments to calculate CAP. Previously reported amounts for 2025 have been revised in select instances to incorporate administrative updates. The fair value of equity awards was determined using methodologies and assumptions developed in a manner substantively consistent with those used to determine the grant date fair value of such awards: |
2026 | 2025 | 2024 | 2023 | 2022 | ||||||||||||||||||||||||||||||||
Figures reflected in $000s | PEO | Average other NEOs | PEO | Average other NEOs | PEO | Average other NEOs | PEO | Average other NEOs | PEO | Average other NEOs | ||||||||||||||||||||||||||
Summary Comp. Table Total | $14,741 | $4,084 | $10,680 | $2,972 | $10,626 | $3,067 | $10,607 | $2,932 | $9,061 | $2,862 | ||||||||||||||||||||||||||
Grant Date Fair Value of Current Fiscal Year Awards | ($9,648) | ($2,278) | ($7,348) | ($1,531) | ($6,543) | ($1,426) | ($6,337) | ($1,348) | ($5,377) | ($1,240) | ||||||||||||||||||||||||||
Fair Value Current Fiscal Year Awards at Fiscal Year End | $30,948 | $7,298 | $14,081 | $2,121 | $14,276 | $3,104 | $7,469 | $1,617 | $5,129 | $1,187 | ||||||||||||||||||||||||||
Change in Fair Value of Prior Fiscal Year Awards (Outstanding) | $44,863 | $7,947 | $22,704 | $4,929 | $15,225 | $3,341 | $6,468 | $1,625 | $1,110 | $884 | ||||||||||||||||||||||||||
Change in Fair Value of Prior Fiscal Year Awards (Vested) | $2,782 | $602 | $2,348 | $538 | ($277) | ($86) | ($385) | ($2) | ($316) | ($15) | ||||||||||||||||||||||||||
Dividends Accrued in Fiscal Year, not captured elsewhere | $0 | $0 | $0 | $0 | $257 | $57 | $195 | $51 | $106 | $34 | ||||||||||||||||||||||||||
Compensation Actually Paid | $83,686 | $17,653 | $42,465 | $9,028 | $33,565 | $8,057 | $18,018 | $4,875 | $9,713 | $3,712 | ||||||||||||||||||||||||||
(3) | Reflects the total compensation reported in the SCT for the applicable year for Mr. Rebelez as the PEO and the average of the total compensation reported in the SCT for the applicable year for each of the other NEOs listed in Footnote 1. |
(4) | Reflects TSR, cumulative for the measurement periods beginning on May 1, 2021, and ending on each of April 30, 2022-2026, the last day of each fiscal year, respectively, calculated in accordance with Item 201(e) of Regulation S-K. “Peer Group” represents the S&P 1500 Consumer Staples Sector Index (“CAP Peer Group”). |
(5) | Reflects the “company selected measure.” EBITDA is a non-GAAP measure defined as net income before net interest expense, income taxes, depreciation and amortization. See Appendix A for reconciliation to net income. |
(1) | Mr. Rebelez served as our principal executive officer (PEO) for fiscal years 2022-2026. Reflects other NEOs for the applicable years as follows: (i) for 2022, Mr. Bramlage, Ms. Williams, Mr. Brennan and Adrian M. Butler (the Company’s prior Chief Information Officer), and (iii) for 2023-2026, Mr. Bramlage, Ms. Williams, Mr. Brennan and Mr. Frazell. |
(4) | Reflects TSR, cumulative for the measurement periods beginning on May 1, 2021, and ending on each of April 30, 2022-2026, the last day of each fiscal year, respectively, calculated in accordance with Item 201(e) of Regulation S-K. “Peer Group” represents the S&P 1500 Consumer Staples Sector Index (“CAP Peer Group”). |
(2) | The following amounts were deducted from and/or added to Summary Compensation Table (“SCT”) total compensation in accordance with the SEC-mandated adjustments to calculate CAP. Previously reported amounts for 2025 have been revised in select instances to incorporate administrative updates. The fair value of equity awards was determined using methodologies and assumptions developed in a manner substantively consistent with those used to determine the grant date fair value of such awards: |
2026 | 2025 | 2024 | 2023 | 2022 | ||||||||||||||||||||||||||||||||
Figures reflected in $000s | PEO | Average other NEOs | PEO | Average other NEOs | PEO | Average other NEOs | PEO | Average other NEOs | PEO | Average other NEOs | ||||||||||||||||||||||||||
Summary Comp. Table Total | $14,741 | $4,084 | $10,680 | $2,972 | $10,626 | $3,067 | $10,607 | $2,932 | $9,061 | $2,862 | ||||||||||||||||||||||||||
Grant Date Fair Value of Current Fiscal Year Awards | ($9,648) | ($2,278) | ($7,348) | ($1,531) | ($6,543) | ($1,426) | ($6,337) | ($1,348) | ($5,377) | ($1,240) | ||||||||||||||||||||||||||
Fair Value Current Fiscal Year Awards at Fiscal Year End | $30,948 | $7,298 | $14,081 | $2,121 | $14,276 | $3,104 | $7,469 | $1,617 | $5,129 | $1,187 | ||||||||||||||||||||||||||
Change in Fair Value of Prior Fiscal Year Awards (Outstanding) | $44,863 | $7,947 | $22,704 | $4,929 | $15,225 | $3,341 | $6,468 | $1,625 | $1,110 | $884 | ||||||||||||||||||||||||||
Change in Fair Value of Prior Fiscal Year Awards (Vested) | $2,782 | $602 | $2,348 | $538 | ($277) | ($86) | ($385) | ($2) | ($316) | ($15) | ||||||||||||||||||||||||||
Dividends Accrued in Fiscal Year, not captured elsewhere | $0 | $0 | $0 | $0 | $257 | $57 | $195 | $51 | $106 | $34 | ||||||||||||||||||||||||||
Compensation Actually Paid | $83,686 | $17,653 | $42,465 | $9,028 | $33,565 | $8,057 | $18,018 | $4,875 | $9,713 | $3,712 | ||||||||||||||||||||||||||
(2) | The following amounts were deducted from and/or added to Summary Compensation Table (“SCT”) total compensation in accordance with the SEC-mandated adjustments to calculate CAP. Previously reported amounts for 2025 have been revised in select instances to incorporate administrative updates. The fair value of equity awards was determined using methodologies and assumptions developed in a manner substantively consistent with those used to determine the grant date fair value of such awards: |
2026 | 2025 | 2024 | 2023 | 2022 | ||||||||||||||||||||||||||||||||
Figures reflected in $000s | PEO | Average other NEOs | PEO | Average other NEOs | PEO | Average other NEOs | PEO | Average other NEOs | PEO | Average other NEOs | ||||||||||||||||||||||||||
Summary Comp. Table Total | $14,741 | $4,084 | $10,680 | $2,972 | $10,626 | $3,067 | $10,607 | $2,932 | $9,061 | $2,862 | ||||||||||||||||||||||||||
Grant Date Fair Value of Current Fiscal Year Awards | ($9,648) | ($2,278) | ($7,348) | ($1,531) | ($6,543) | ($1,426) | ($6,337) | ($1,348) | ($5,377) | ($1,240) | ||||||||||||||||||||||||||
Fair Value Current Fiscal Year Awards at Fiscal Year End | $30,948 | $7,298 | $14,081 | $2,121 | $14,276 | $3,104 | $7,469 | $1,617 | $5,129 | $1,187 | ||||||||||||||||||||||||||
Change in Fair Value of Prior Fiscal Year Awards (Outstanding) | $44,863 | $7,947 | $22,704 | $4,929 | $15,225 | $3,341 | $6,468 | $1,625 | $1,110 | $884 | ||||||||||||||||||||||||||
Change in Fair Value of Prior Fiscal Year Awards (Vested) | $2,782 | $602 | $2,348 | $538 | ($277) | ($86) | ($385) | ($2) | ($316) | ($15) | ||||||||||||||||||||||||||
Dividends Accrued in Fiscal Year, not captured elsewhere | $0 | $0 | $0 | $0 | $257 | $57 | $195 | $51 | $106 | $34 | ||||||||||||||||||||||||||
Compensation Actually Paid | $83,686 | $17,653 | $42,465 | $9,028 | $33,565 | $8,057 | $18,018 | $4,875 | $9,713 | $3,712 | ||||||||||||||||||||||||||
The chart below illustrates the relationship between the PEO and average Non-PEO CAP amounts and the Company’s and CAP Peer Group’s TSR during fiscal years 2022-2026.
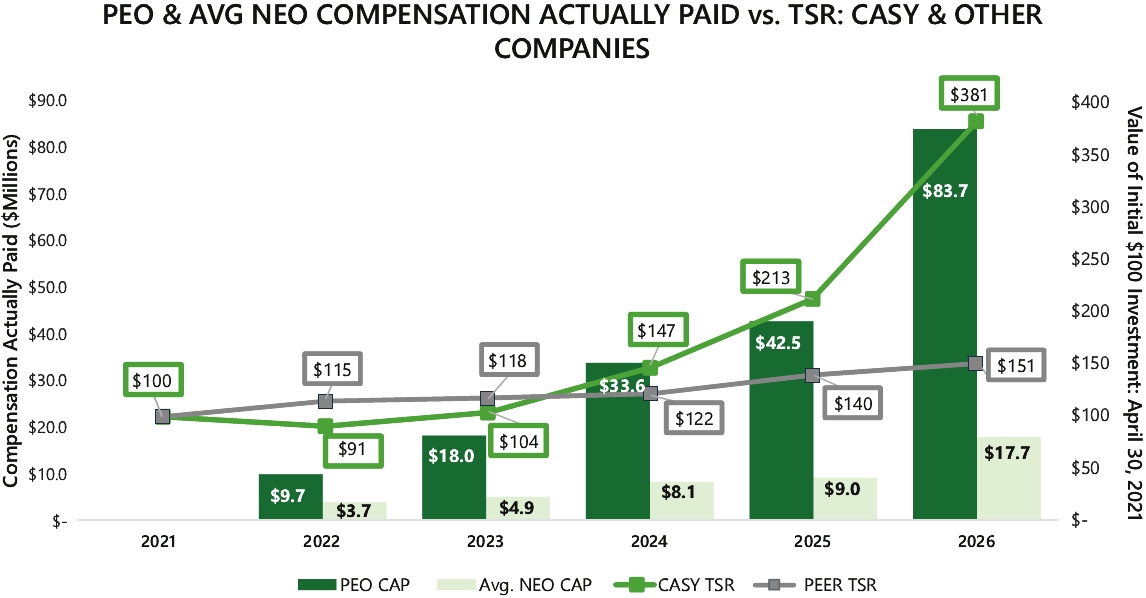
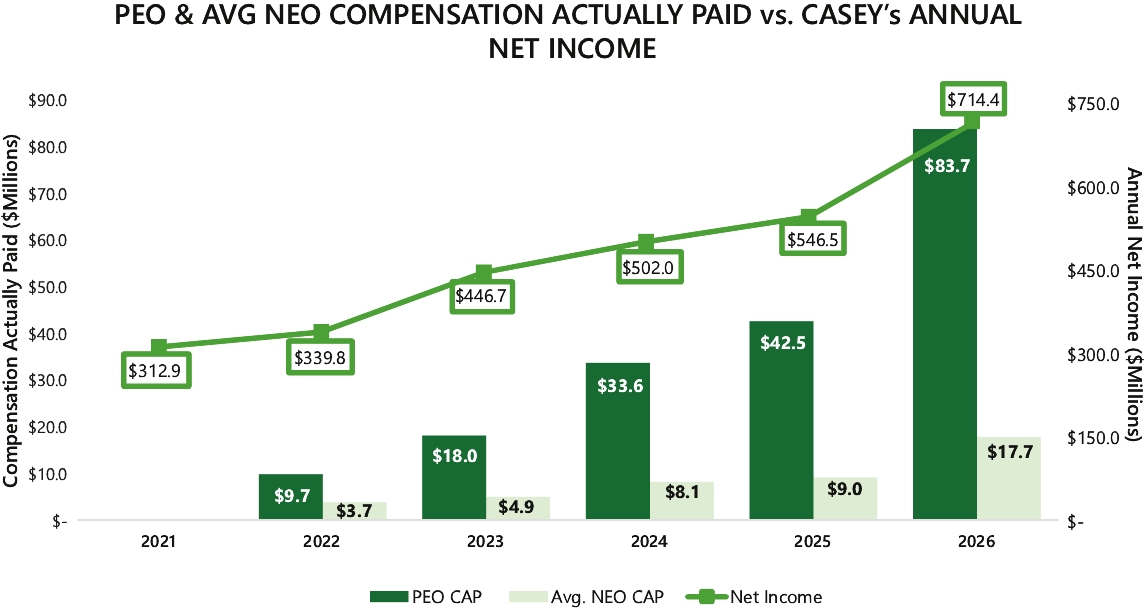
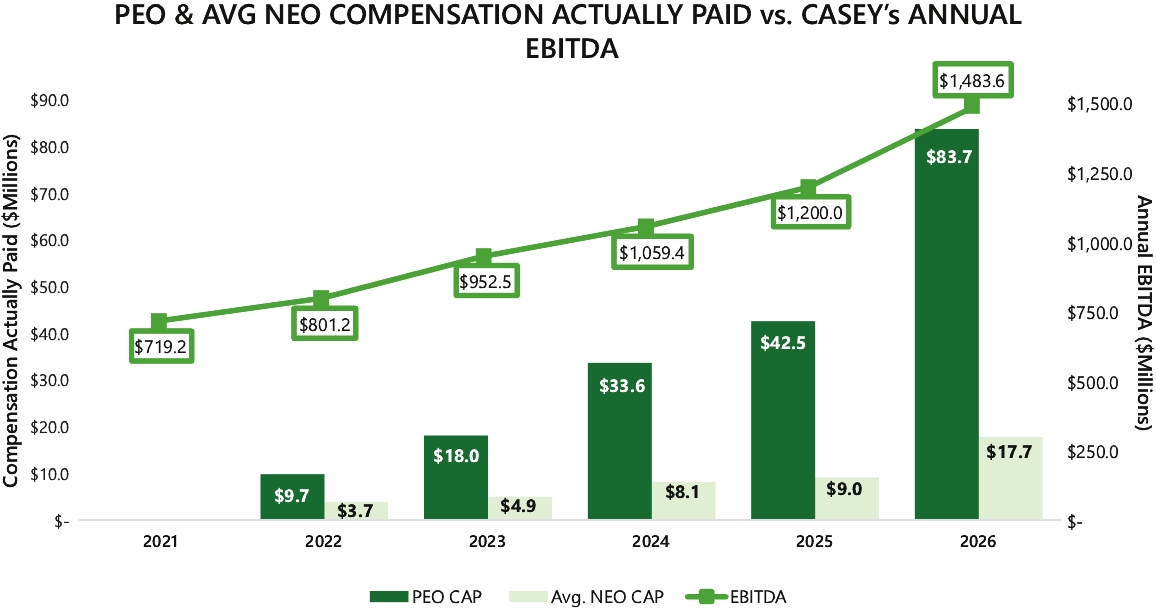
The chart below illustrates the relationship between the PEO and average Non-PEO CAP amounts and the Company’s and CAP Peer Group’s TSR during fiscal years 2022-2026.
Performance Measures Used to Link Company Performance and CAP
The following table lists the performance measures that, in our assessment, represent the most important performance measures we used to link compensation actually paid to our NEOs to Company performance for the 2026 fiscal year. See the CD&A for further details.
Tabular List of Performance Measures | |||||||||||
EBITDA | Same-Store Sales Growth % (Inside Sales) | ROIC | Relative TSR | ||||||||
(5) | Reflects the “company selected measure.” EBITDA is a non-GAAP measure defined as net income before net interest expense, income taxes, depreciation and amortization. See Appendix A for reconciliation to net income. |