Exhibit 99.5
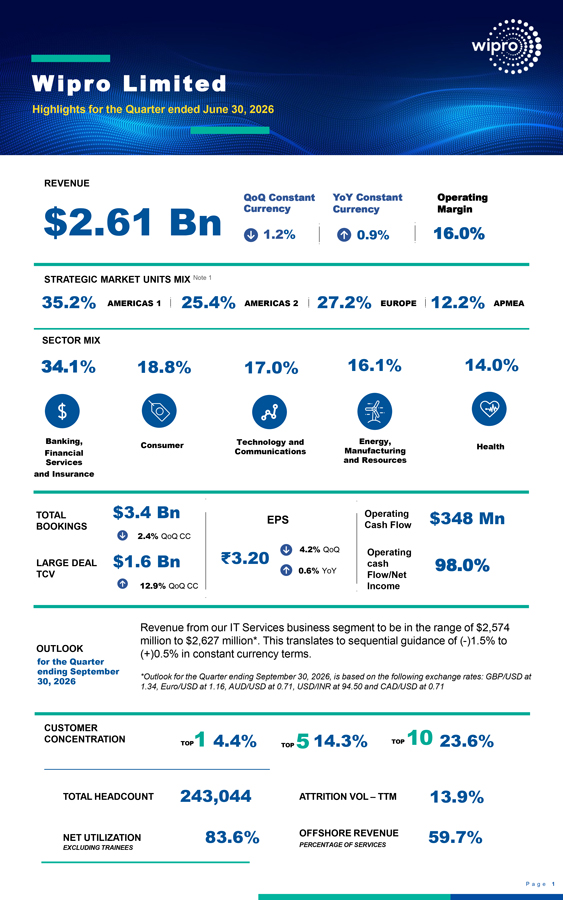
W ipro Limited Highlights for the Quarter ended June 30, 2026 REVENUE QoQ Constant YoY Constant Operating $2.61 Bn Currency Currency Margin 1.2% 0.9% 16.0% STRATEGIC MARKET UNITS MIX Note 1 35.2% AMERICAS 1 25.4% AMERICAS 2 27.2% EUROPE 12.2% APMEA SECTOR MIX 34.1% 18.8% 17.0% 16.1% 14.0% Banking, Consumer Technology and Energy, Health Financial Communications Manufacturing Services and Resources and Insurance TOTAL $3.4 Bn Operating EPS $348 Mn BOOKINGS Cash Flow 2.4% QoQ CC ₹ 3.20 4.2% QoQ Operating LARGE DEAL $1.6 Bn cash 98.0% TCV 0.6% YoY Flow/Net 12.9% QoQ CC Income Revenue from our IT Services business segment to be in the range of $2,574 million to $2,627 million*. This translates to sequential guidance of (-)1.5% to OUTLOOK (+)0.5% in constant currency terms. for the Quarter ending September 30, 2026 *Outlook for the Quarter ending September 30, 2026, is based on the following exchange rates: GBP/USD at 1.34, Euro/USD at 1.16, AUD/USD at 0.71, USD/INR at 94.50 and CAD/USD at 0.71 CUSTOMER CONCENTRATION TOP1 4.4% 14.3% TOP 10 23.6% TOP 5 TOTAL HEADCOUNT 243,044 ATTRITION VOL – TTM 13.9% OFFSHORE REVENUE NET UTILIZATION 83.6% 59.7% PERCENTAGE OF SERVICES EXCLUDING TRAINEES
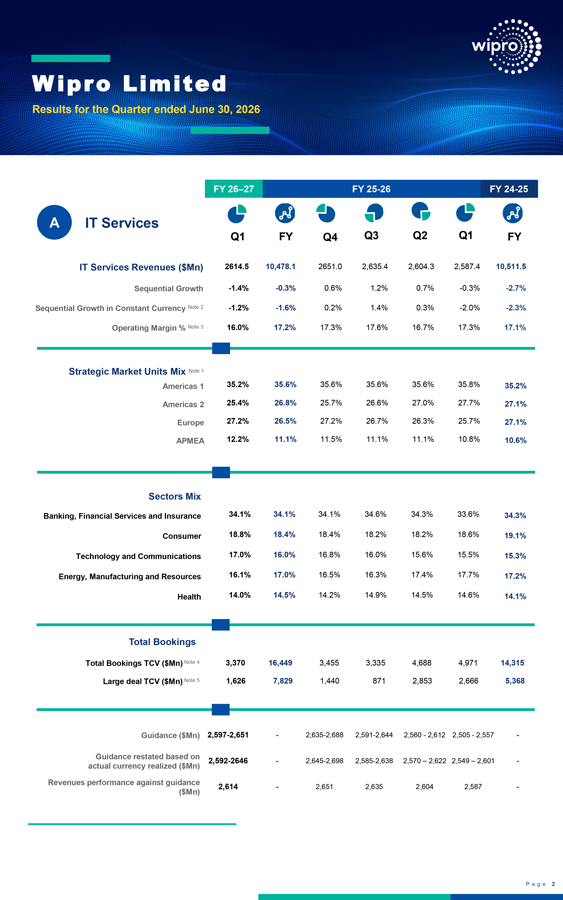
W ipro Limited Results for the Quarter ended June 30, 2026 FY 26–27 FY 25-26 FY 24-25 A IT Services Q1 FY Q4 Q3 Q2 Q1 FY IT Services Revenues ($Mn) 2614.5 10,478.1 2651.0 2,635.4 2,604.3 2,587.4 10,511.5 Sequential Growth -1.4% -0.3% 0.6% 1.2% 0.7% -0.3% -2.7% Sequential Growth in Constant Currency Note 2 -1.2% -1.6% 0.2% 1.4% 0.3% -2.0% -2.3% Operating Margin % Note 3 16.0% 17.2% 17.3% 17.6% 16.7% 17.3% 17.1% Strategic Market Units Mix Note 1 Americas 1 35.2% 35.6% 35.6% 35.6% 35.6% 35.8% 35.2% Americas 2 25.4% 26.8% 25.7% 26.6% 27.0% 27.7% 27.1% Europe 27.2% 26.5% 27.2% 26.7% 26.3% 25.7% 27.1% APMEA 12.2% 11.1% 11.5% 11.1% 11.1% 10.8% 10.6% Sectors Mix Banking, Financial Services and Insurance 34.1% 34.1% 34.1% 34.6% 34.3% 33.6% 34.3% Consumer 18.8% 18.4% 18.4% 18.2% 18.2% 18.6% 19.1% Technology and Communications 17.0% 16.0% 16.8% 16.0% 15.6% 15.5% 15.3% Energy, Manufacturing and Resources 16.1% 17.0% 16.5% 16.3% 17.4% 17.7% 17.2% Health 14.0% 14.5% 14.2% 14.9% 14.5% 14.6% 14.1% Total Bookings Total Bookings TCV ($Mn) Note 4 3,370 16,449 3,455 3,335 4,688 4,971 14,315 Large deal TCV ($Mn) Note 5 1,626 7,829 1,440 871 2,853 2,666 5,368 Guidance ($Mn) 2,597-2,651—2,635-2,688 2,591-2,644 2,560—2,612 2,505—2,557 - Guidance restated based on 2,592-2646—2,645-2,698 2,585-2,638 2,570 – 2,622 2,549 – 2,601 -actual currency realized ($Mn) Revenues performance against guidance 2,614—2,651 2,635 2,604 2,587 - ($Mn)
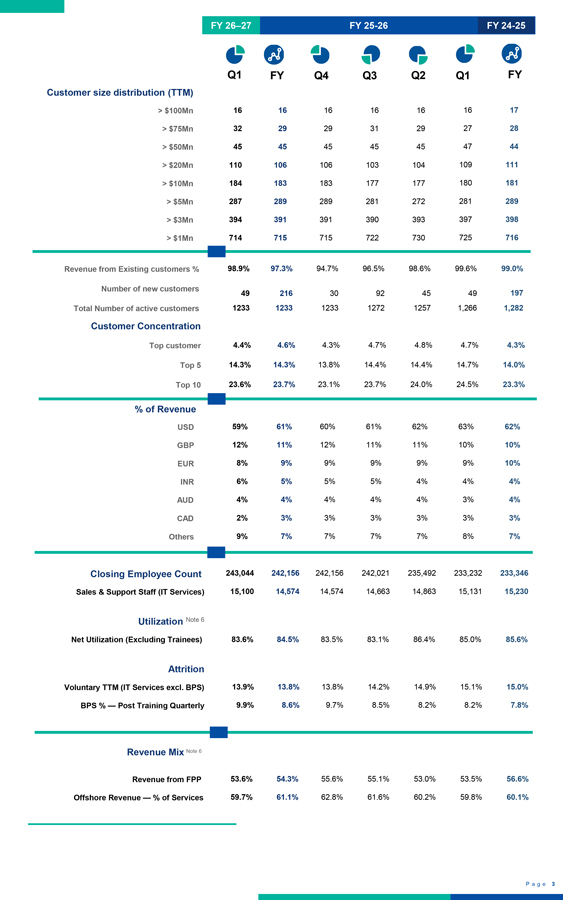
FY 26–27 FY 25-26 FY 24-25 Q1 FY Q4 Q3 Q2 Q1 FY Customer size distribution (TTM) > $100Mn 16 16 16 16 16 16 17 > $75Mn 32 29 29 31 29 27 28 > $50Mn 45 45 45 45 45 47 44 > $20Mn 110 106 106 103 104 109 111 > $10Mn 184 183 183 177 177 180 181 > $5Mn 287 289 289 281 272 281 289 > $3Mn 394 391 391 390 393 397 398 > $1Mn 714 715 715 722 730 725 716 Revenue from Existing customers % 98.9% 97.3% 94.7% 96.5% 98.6% 99.6% 99.0% Number of new customers 49 216 30 92 45 49 197 Total Number of active customers 1233 1233 1233 1272 1257 1,266 1,282 Customer Concentration Top customer 4.4% 4.6% 4.3% 4.7% 4.8% 4.7% 4.3% Top 5 14.3% 14.3% 13.8% 14.4% 14.4% 14.7% 14.0% Top 10 23.6% 23.7% 23.1% 23.7% 24.0% 24.5% 23.3% % of Revenue USD 59% 61% 60% 61% 62% 63% 62% GBP 12% 11% 12% 11% 11% 10% 10% EUR 8% 9% 9% 9% 9% 9% 10% INR 6% 5% 5% 5% 4% 4% 4% AUD 4% 4% 4% 4% 4% 3% 4% CAD 2% 3% 3% 3% 3% 3% 3% Others 9% 7% 7% 7% 7% 8% 7% Closing Employee Count 243,044 242,156 242,156 242,021 235,492 233,232 233,346 Sales & Support Staff (IT Services) 15,100 14,574 14,574 14,663 14,863 15,131 15,230 Utilization Note 6 Net Utilization (Excluding Trainees) 83.6% 84.5% 83.5% 83.1% 86.4% 85.0% 85.6% Attrition Voluntary TTM (IT Services excl. BPS) 13.9% 13.8% 13.8% 14.2% 14.9% 15.1% 15.0% BPS % — Post Training Quarterly 9.9% 8.6% 9.7% 8.5% 8.2% 8.2% 7.8% Revenue Mix Note 6 Revenue from FPP 53.6% 54.3% 55.6% 55.1% 53.0% 53.5% 56.6% Offshore Revenue — % of Services 59.7% 61.1% 62.8% 61.6% 60.2% 59.8% 60.1%
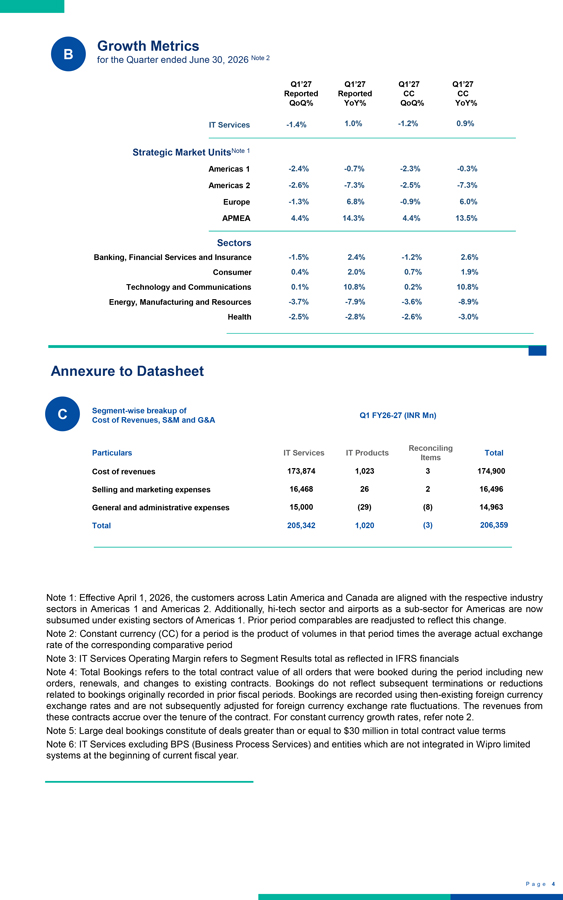
Growth Metrics B for the Quarter ended June 30, 2026 Note 2 Q1’27 Q1’27 Q1’27 Q1’27 Reported Reported CC CC QoQ% YoY% QoQ% YoY% IT Services -1.4% 1.0% -1.2% 0.9% Strategic Market UnitsNote 1 Americas 1 -2.4% -0.7% -2.3% -0.3% Americas 2 -2.6% -7.3% -2.5% -7.3% Europe -1.3% 6.8% -0.9% 6.0% APMEA 4.4% 14.3% 4.4% 13.5% Sectors Banking, Financial Services and Insurance -1.5% 2.4% -1.2% 2.6% Consumer 0.4% 2.0% 0.7% 1.9% Technology and Communications 0.1% 10.8% 0.2% 10.8% Energy, Manufacturing and Resources -3.7% -7.9% -3.6% -8.9% Health -2.5% -2.8% -2.6% -3.0% Annexure to Datasheet Segment-wise breakup of C Q1 FY26-27 (INR Mn) Cost of Revenues, S&M and G&A Reconciling Particulars IT Services IT Products Total Items Cost of revenues 173,874 1,023 3 174,900 Selling and marketing expenses 16,468 26 2 16,496 General and administrative expenses 15,000 (29) (8) 14,963 Total 205,342 1,020 (3) 206,359 Note 1: Effective April 1, 2026, the customers across Latin America and Canada are aligned with the respective industry sectors in Americas 1 and Americas 2. Additionally, hi-tech sector and airports as a sub-sector for Americas are now subsumed under existing sectors of Americas 1. Prior period comparables are readjusted to reflect this change. Note 2: Constant currency (CC) for a period is the product of volumes in that period times the average actual exchange rate of the corresponding comparative period Note 3: IT Services Operating Margin refers to Segment Results total as reflected in IFRS financials Note 4: Total Bookings refers to the total contract value of all orders that were booked during the period including new orders, renewals, and changes to existing contracts. Bookings do not reflect subsequent terminations or reductions related to bookings originally recorded in prior fiscal periods. Bookings are recorded using then-existing foreign currency exchange rates and are not subsequently adjusted for foreign currency exchange rate fluctuations. The revenues from these contracts accrue over the tenure of the contract. For constant currency growth rates, refer note 2. Note 5: Large deal bookings constitute of deals greater than or equal to $30 million in total contract value terms Note 6: IT Services excluding BPS (Business Process Services) and entities which are not integrated in Wipro limited systems at the beginning of current fiscal year.