Shareholder Report
|
12 Months Ended |
|
May 31, 2026
USD ($)
Holding
|
|---|
| Shareholder Report [Line Items] |
|
| Document Type |
N-CSR
|
| Amendment Flag |
false
|
| Registrant Name |
T. ROWE PRICE CREDIT OPPORTUNITIES FUND, INC.
|
| Entity Central Index Key |
0001600600
|
| Entity Investment Company Type |
N-1A
|
| Document Period End Date |
May 31, 2026
|
| Shareholder Report Annual or Semi-Annual |
Annual Shareholder Report
|
| C000141380 |
|
| Shareholder Report [Line Items] |
|
| Fund Name |
Credit Opportunities Fund
|
| Class Name |
Investor Class
|
| Trading Symbol |
PRCPX
|
| Annual or Semi-Annual Statement [Text Block] |
This annual shareholder report contains important information about Credit Opportunities Fund (the "fund") for the period of June 1, 2025 to May 31, 2026.
|
| Additional Information [Text Block] |
You can find the fund’s prospectus, financial information on Form N‑CSR (which includes required tax information for dividends), holdings, proxy voting information, and other information atwww.troweprice.com/prospectus. You can also request this information without charge by contacting T. Rowe Price at 1‑800‑638‑5660 or info@troweprice.com or contacting your intermediary.
|
| Material Fund Change Notice [Text Block] |
|
| Additional Information Phone Number |
1‑800‑638‑5660
|
| Additional Information Email |
<span style="box-sizing: border-box; color: rgb(0, 0, 0); display: inline; flex-wrap: nowrap; font-size: 13.3333px; font-weight: 400; grid-area: auto; line-height: 17.3333px; margin: 0px; overflow: visible; text-align: justify; text-align-last: left; white-space-collapse: preserve-breaks;">info@troweprice.com</span>
|
| Additional Information Website |
www.troweprice.com/prospectus
|
| Expenses [Text Block] |
What were the fund costs for the last year? (based on a hypothetical $10,000 investment)
Table Summary
|
Costs of a $10,000 investment |
Costs paid as a percentage of a $10,000 investment |
Credit Opportunities Fund - Investor Class |
$84 |
0.81% | |
| Expenses Paid, Amount |
$ 84
|
| Expense Ratio, Percent |
0.81%
|
| Factors Affecting Performance [Text Block] |
What drove fund performance during the past 12 months?The high yield market posted solid gains in the year ended May 31, 2026, despite significant volatility and inflationary pressure due to the Trump administration’s trade policies and the war in Iran. The resilient labor market, healthy corporate earnings, and strong equity returns supported the asset class’s performance. Compared with the style-specific Bloomberg U.S. High Yield 2% Issuer Capped Bond Index, our selection in the wireless communications segment contributed, partly due to Asurion, the leading provider of mobile protection services. Asurion’s contracts with Verizon and AT&T, which were extended through year-end 2031, and its growing connected home business, provide reasonable earnings visibility, in our view. Avoiding troubled issuers that underperformed, including luxury retail company Saks Global and global label solutions provider Multi-Color, added value. Relative to the style-specific benchmark, the information technology segment detracted as fears about the potential impacts of displacement amid increased adoption of artificial intelligence technology hampered the performance of several issuers including, Qlik Technologies, which offers business intelligence and analytics. Sabre, a technology solutions provider to the global travel and tourism industry, held back relative gains in the services segment. The fund seeks a combination of long-term capital appreciation and high income. Over the period, we selectively added to credits where our analysts saw credible takeout optionality as we continued to believe that mergers and acquisitions will remain an ongoing theme across our markets. We also found value in new issues and continued to emphasize shorter duration, higher-carry ideas.
|
| Performance Past Does Not Indicate Future [Text] |
The fund’s past performance is not a good predictor of the fund’s future performance.
|
| Line Graph [Table Text Block] |
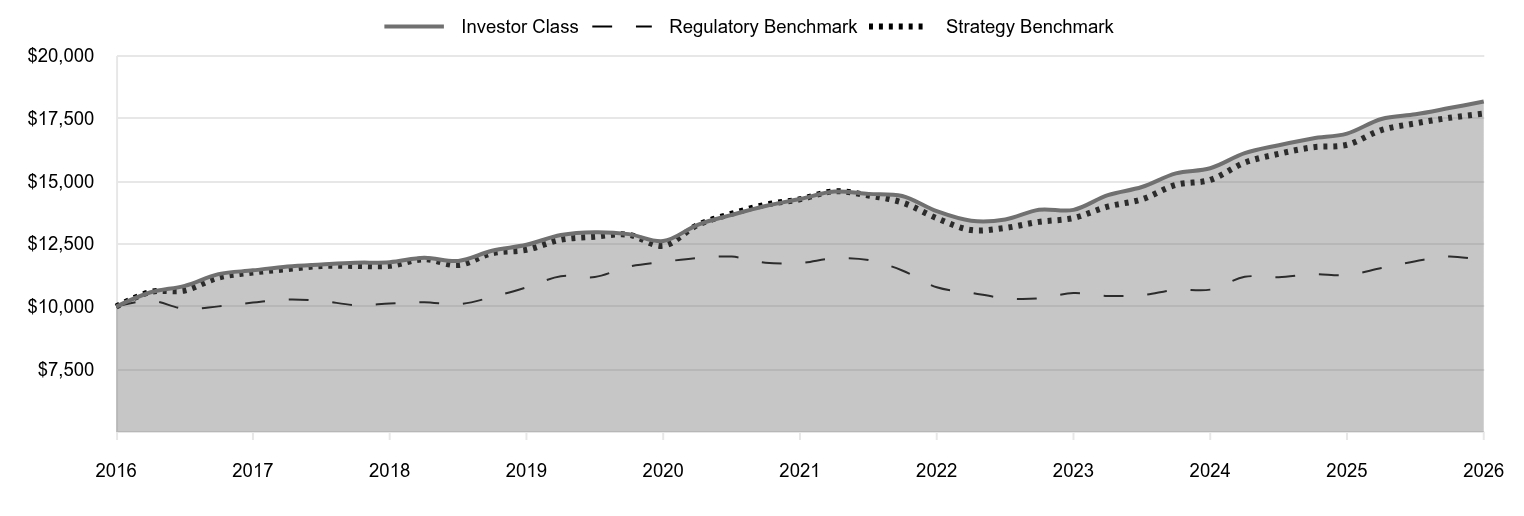
Table Summary
|
Investor Class |
Regulatory Benchmark |
Strategy Benchmark |
2016 |
10,000 |
10,000 |
10,000 |
2016 |
10,570 |
10,232 |
10,582 |
2016 |
10,827 |
9,908 |
10,643 |
2017 |
11,292 |
10,008 |
11,156 |
2017 |
11,444 |
10,158 |
11,357 |
2017 |
11,602 |
10,283 |
11,494 |
2017 |
11,681 |
10,227 |
11,617 |
2018 |
11,748 |
10,059 |
11,622 |
2018 |
11,768 |
10,120 |
11,624 |
2018 |
11,947 |
10,175 |
11,885 |
2018 |
11,819 |
10,089 |
11,659 |
2019 |
12,225 |
10,378 |
12,123 |
2019 |
12,462 |
10,768 |
12,264 |
2019 |
12,853 |
11,210 |
12,665 |
2019 |
12,967 |
11,178 |
12,787 |
2020 |
12,888 |
11,590 |
12,863 |
2020 |
12,611 |
11,781 |
12,424 |
2020 |
13,259 |
11,936 |
13,254 |
2020 |
13,656 |
11,992 |
13,704 |
2021 |
14,010 |
11,750 |
14,060 |
2021 |
14,289 |
11,734 |
14,276 |
2021 |
14,583 |
11,925 |
14,597 |
2021 |
14,493 |
11,854 |
14,426 |
2022 |
14,409 |
11,440 |
14,149 |
2022 |
13,801 |
10,769 |
13,523 |
2022 |
13,422 |
10,552 |
13,049 |
2022 |
13,469 |
10,332 |
13,135 |
2023 |
13,859 |
10,328 |
13,378 |
2023 |
13,855 |
10,538 |
13,530 |
2023 |
14,444 |
10,426 |
13,987 |
2023 |
14,766 |
10,454 |
14,276 |
2024 |
15,311 |
10,671 |
14,851 |
2024 |
15,514 |
10,676 |
15,049 |
2024 |
16,117 |
11,187 |
15,739 |
2024 |
16,434 |
11,173 |
16,090 |
2025 |
16,703 |
11,291 |
16,349 |
2025 |
16,894 |
11,258 |
16,451 |
2025 |
17,477 |
11,538 |
17,039 |
2025 |
17,664 |
11,809 |
17,305 |
2026 |
17,913 |
11,998 |
17,524 |
2026 |
18,175 |
11,836 |
17,696 |
|
| Average Annual Return [Table Text Block] |
Table Summary
|
1 Year |
5 Years |
10 Years |
Credit Opportunities Fund (Investor Class) |
7.59% |
4.93% |
6.16% |
Bloomberg U.S. Aggregate Bond Index (Regulatory Benchmark) |
5.13 |
0.17 |
1.70 |
Bloomberg U.S. High-Yield 2% Issuer Capped Bond Index (Strategy Benchmark) |
7.57 |
4.39 |
5.87 | |
| No Deduction of Taxes [Text Block] |
Neither the fund’s returns nor the index returns reflect the deduction of taxes that a shareholder would pay on fund distributions or redemptions of fund shares.
|
| Updated Performance Information Location [Text Block] |
Updated performance information can be found at www.troweprice.com.
|
| Distribution of Capital [Text Block] |
The fund's total return figures reflect the reinvestment of dividends and capital gains, if any.
|
| AssetsNet |
$ 395,564,000
|
| Holdings Count | Holding |
303
|
| Advisory Fees Paid, Amount |
$ 1,552,000
|
| InvestmentCompanyPortfolioTurnover |
36.90%
|
| Additional Fund Statistics Significance or Limits [Text Block] |
What are some fund statistics? - Total Net Assets (000s)$395,564
- Number of Portfolio Holdings303
|
| Holdings [Text Block] |
Table Summary
Corporate Bonds |
81.3% |
Bank Loans |
9.5 |
Securities Lending Collateral |
2.0 |
Convertible Preferred Stocks |
1.1 |
Preferred Stocks |
1.1 |
Municipal Securities |
0.6 |
Common Stocks |
0.4 |
Convertible Bonds |
0.3 |
Short-Term and Other |
3.7 | |
| Largest Holdings [Text Block] |
Table Summary
Vistra |
2.9% |
TransDigm |
2.7 |
Navient |
2.2 |
LifePoint Health |
2.2 |
EchoStar |
1.9 |
Hilcorp Energy I |
1.7 |
Service Properties Trust |
1.6 |
Venture Global LNG |
1.5 |
Jane Street Group |
1.4 |
Neptune Bidco U.S. |
1.3 | |
| Material Fund Change [Text Block] |
|
| Updated Prospectus Web Address |
www.troweprice.com/paperless
|
| C000141381 |
|
| Shareholder Report [Line Items] |
|
| Fund Name |
Credit Opportunities Fund
|
| Class Name |
Advisor Class
|
| Trading Symbol |
PAOPX
|
| Annual or Semi-Annual Statement [Text Block] |
This annual shareholder report contains important information about Credit Opportunities Fund (the "fund") for the period of June 1, 2025 to May 31, 2026.
|
| Additional Information [Text Block] |
You can find the fund’s prospectus, financial information on Form N‑CSR (which includes required tax information for dividends), holdings, proxy voting information, and other information atwww.troweprice.com/prospectus. You can also request this information without charge by contacting T. Rowe Price at 1‑800‑638‑5660 or info@troweprice.com or contacting your intermediary.
|
| Material Fund Change Notice [Text Block] |
|
| Additional Information Phone Number |
1‑800‑638‑5660
|
| Additional Information Email |
<span style="box-sizing: border-box; color: rgb(0, 0, 0); display: inline; flex-wrap: nowrap; font-size: 13.3333px; font-weight: 400; grid-area: auto; line-height: 17.3333px; margin: 0px; overflow: visible; text-align: justify; text-align-last: left; white-space-collapse: preserve-breaks;">info@troweprice.com</span>
|
| Additional Information Website |
www.troweprice.com/prospectus
|
| Expenses [Text Block] |
What were the fund costs for the last year? (based on a hypothetical $10,000 investment)
Table Summary
|
Costs of a $10,000 investment |
Costs paid as a percentage of a $10,000 investment |
Credit Opportunities Fund - Advisor Class |
$94 |
0.91% | |
| Expenses Paid, Amount |
$ 94
|
| Expense Ratio, Percent |
0.91%
|
| Factors Affecting Performance [Text Block] |
What drove fund performance during the past 12 months?The high yield market posted solid gains in the year ended May 31, 2026, despite significant volatility and inflationary pressure due to the Trump administration’s trade policies and the war in Iran. The resilient labor market, healthy corporate earnings, and strong equity returns supported the asset class’s performance. Compared with the style-specific Bloomberg U.S. High Yield 2% Issuer Capped Bond Index, our selection in the wireless communications segment contributed, partly due to Asurion, the leading provider of mobile protection services. Asurion’s contracts with Verizon and AT&T, which were extended through year-end 2031, and its growing connected home business, provide reasonable earnings visibility, in our view. Avoiding troubled issuers that underperformed, including luxury retail company Saks Global and global label solutions provider Multi-Color, added value. Relative to the style-specific benchmark, the information technology segment detracted as fears about the potential impacts of displacement amid increased adoption of artificial intelligence technology hampered the performance of several issuers including, Qlik Technologies, which offers business intelligence and analytics. Sabre, a technology solutions provider to the global travel and tourism industry, held back relative gains in the services segment. The fund seeks a combination of long-term capital appreciation and high income. Over the period, we selectively added to credits where our analysts saw credible takeout optionality as we continued to believe that mergers and acquisitions will remain an ongoing theme across our markets. We also found value in new issues and continued to emphasize shorter duration, higher-carry ideas.
|
| Performance Past Does Not Indicate Future [Text] |
The fund’s past performance is not a good predictor of the fund’s future performance.
|
| Line Graph [Table Text Block] |
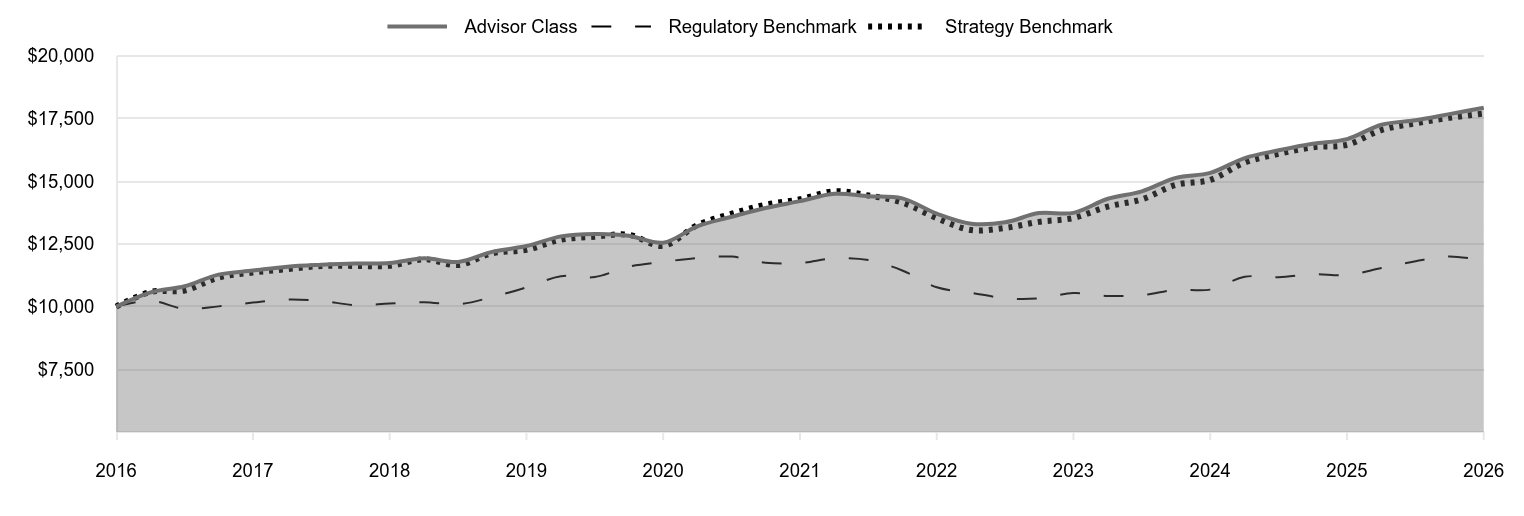
Table Summary
|
Advisor Class |
Regulatory Benchmark |
Strategy Benchmark |
2016 |
10,000 |
10,000 |
10,000 |
2016 |
10,568 |
10,232 |
10,582 |
2016 |
10,810 |
9,908 |
10,643 |
2017 |
11,273 |
10,008 |
11,156 |
2017 |
11,434 |
10,158 |
11,357 |
2017 |
11,590 |
10,283 |
11,494 |
2017 |
11,665 |
10,227 |
11,617 |
2018 |
11,716 |
10,059 |
11,622 |
2018 |
11,733 |
10,120 |
11,624 |
2018 |
11,922 |
10,175 |
11,885 |
2018 |
11,777 |
10,089 |
11,659 |
2019 |
12,180 |
10,378 |
12,123 |
2019 |
12,412 |
10,768 |
12,264 |
2019 |
12,799 |
11,210 |
12,665 |
2019 |
12,895 |
11,178 |
12,787 |
2020 |
12,827 |
11,590 |
12,863 |
2020 |
12,547 |
11,781 |
12,424 |
2020 |
13,205 |
11,936 |
13,254 |
2020 |
13,581 |
11,992 |
13,704 |
2021 |
13,931 |
11,750 |
14,060 |
2021 |
14,205 |
11,734 |
14,276 |
2021 |
14,494 |
11,925 |
14,597 |
2021 |
14,400 |
11,854 |
14,426 |
2022 |
14,313 |
11,440 |
14,149 |
2022 |
13,704 |
10,769 |
13,523 |
2022 |
13,305 |
10,552 |
13,049 |
2022 |
13,361 |
10,332 |
13,135 |
2023 |
13,727 |
10,328 |
13,378 |
2023 |
13,737 |
10,538 |
13,530 |
2023 |
14,300 |
10,426 |
13,987 |
2023 |
14,596 |
10,454 |
14,276 |
2024 |
15,132 |
10,671 |
14,851 |
2024 |
15,329 |
10,676 |
15,049 |
2024 |
15,922 |
11,187 |
15,739 |
2024 |
16,231 |
11,173 |
16,090 |
2025 |
16,493 |
11,291 |
16,349 |
2025 |
16,677 |
11,258 |
16,451 |
2025 |
17,250 |
11,538 |
17,039 |
2025 |
17,430 |
11,809 |
17,305 |
2026 |
17,671 |
11,998 |
17,524 |
2026 |
17,925 |
11,836 |
17,696 |
|
| Average Annual Return [Table Text Block] |
Table Summary
|
1 Year |
5 Years |
10 Years |
Credit Opportunities Fund (Advisor Class) |
7.48% |
4.76% |
6.01% |
Bloomberg U.S. Aggregate Bond Index (Regulatory Benchmark) |
5.13 |
0.17 |
1.70 |
Bloomberg U.S. High-Yield 2% Issuer Capped Bond Index (Strategy Benchmark) |
7.57 |
4.39 |
5.87 | |
| No Deduction of Taxes [Text Block] |
Neither the fund’s returns nor the index returns reflect the deduction of taxes that a shareholder would pay on fund distributions or redemptions of fund shares.
|
| Updated Performance Information Location [Text Block] |
Updated performance information can be found at www.troweprice.com.
|
| Distribution of Capital [Text Block] |
The fund's total return figures reflect the reinvestment of dividends and capital gains, if any.
|
| AssetsNet |
$ 395,564,000
|
| Holdings Count | Holding |
303
|
| Advisory Fees Paid, Amount |
$ 1,552,000
|
| InvestmentCompanyPortfolioTurnover |
36.90%
|
| Additional Fund Statistics Significance or Limits [Text Block] |
What are some fund statistics? - Total Net Assets (000s)$395,564
- Number of Portfolio Holdings303
|
| Holdings [Text Block] |
Table Summary
Corporate Bonds |
81.3% |
Bank Loans |
9.5 |
Securities Lending Collateral |
2.0 |
Convertible Preferred Stocks |
1.1 |
Preferred Stocks |
1.1 |
Municipal Securities |
0.6 |
Common Stocks |
0.4 |
Convertible Bonds |
0.3 |
Short-Term and Other |
3.7 | |
| Largest Holdings [Text Block] |
Table Summary
Vistra |
2.9% |
TransDigm |
2.7 |
Navient |
2.2 |
LifePoint Health |
2.2 |
EchoStar |
1.9 |
Hilcorp Energy I |
1.7 |
Service Properties Trust |
1.6 |
Venture Global LNG |
1.5 |
Jane Street Group |
1.4 |
Neptune Bidco U.S. |
1.3 | |
| Material Fund Change [Text Block] |
|
| Updated Prospectus Web Address |
www.troweprice.com/paperless
|
| C000177210 |
|
| Shareholder Report [Line Items] |
|
| Fund Name |
Credit Opportunities Fund
|
| Class Name |
I Class
|
| Trading Symbol |
TCRRX
|
| Annual or Semi-Annual Statement [Text Block] |
This annual shareholder report contains important information about Credit Opportunities Fund (the "fund") for the period of June 1, 2025 to May 31, 2026.
|
| Additional Information [Text Block] |
You can find the fund’s prospectus, financial information on Form N‑CSR (which includes required tax information for dividends), holdings, proxy voting information, and other information atwww.troweprice.com/prospectus. You can also request this information without charge by contacting T. Rowe Price at 1‑800‑638‑5660 or info@troweprice.com or contacting your intermediary.
|
| Material Fund Change Notice [Text Block] |
|
| Additional Information Phone Number |
1‑800‑638‑5660
|
| Additional Information Email |
<span style="box-sizing: border-box; color: rgb(0, 0, 0); display: inline; flex-wrap: nowrap; font-size: 13.3333px; font-weight: 400; grid-area: auto; line-height: 17.3333px; margin: 0px; overflow: visible; text-align: justify; text-align-last: left; white-space-collapse: preserve-breaks;">info@troweprice.com</span>
|
| Additional Information Website |
www.troweprice.com/prospectus
|
| Expenses [Text Block] |
What were the fund costs for the last year? (based on a hypothetical $10,000 investment)
Table Summary
|
Costs of a $10,000 investment |
Costs paid as a percentage of a $10,000 investment |
Credit Opportunities Fund - I Class |
$58 |
0.56% | |
| Expenses Paid, Amount |
$ 58
|
| Expense Ratio, Percent |
0.56%
|
| Factors Affecting Performance [Text Block] |
What drove fund performance during the past 12 months?The high yield market posted solid gains in the year ended May 31, 2026, despite significant volatility and inflationary pressure due to the Trump administration’s trade policies and the war in Iran. The resilient labor market, healthy corporate earnings, and strong equity returns supported the asset class’s performance. Compared with the style-specific Bloomberg U.S. High Yield 2% Issuer Capped Bond Index, our selection in the wireless communications segment contributed, partly due to Asurion, the leading provider of mobile protection services. Asurion’s contracts with Verizon and AT&T, which were extended through year-end 2031, and its growing connected home business, provide reasonable earnings visibility, in our view. Avoiding troubled issuers that underperformed, including luxury retail company Saks Global and global label solutions provider Multi-Color, added value. Relative to the style-specific benchmark, the information technology segment detracted as fears about the potential impacts of displacement amid increased adoption of artificial intelligence technology hampered the performance of several issuers including, Qlik Technologies, which offers business intelligence and analytics. Sabre, a technology solutions provider to the global travel and tourism industry, held back relative gains in the services segment. The fund seeks a combination of long-term capital appreciation and high income. Over the period, we selectively added to credits where our analysts saw credible takeout optionality as we continued to believe that mergers and acquisitions will remain an ongoing theme across our markets. We also found value in new issues and continued to emphasize shorter duration, higher-carry ideas.
|
| Performance Past Does Not Indicate Future [Text] |
The fund’s past performance is not a good predictor of the fund’s future performance.
|
| Line Graph [Table Text Block] |
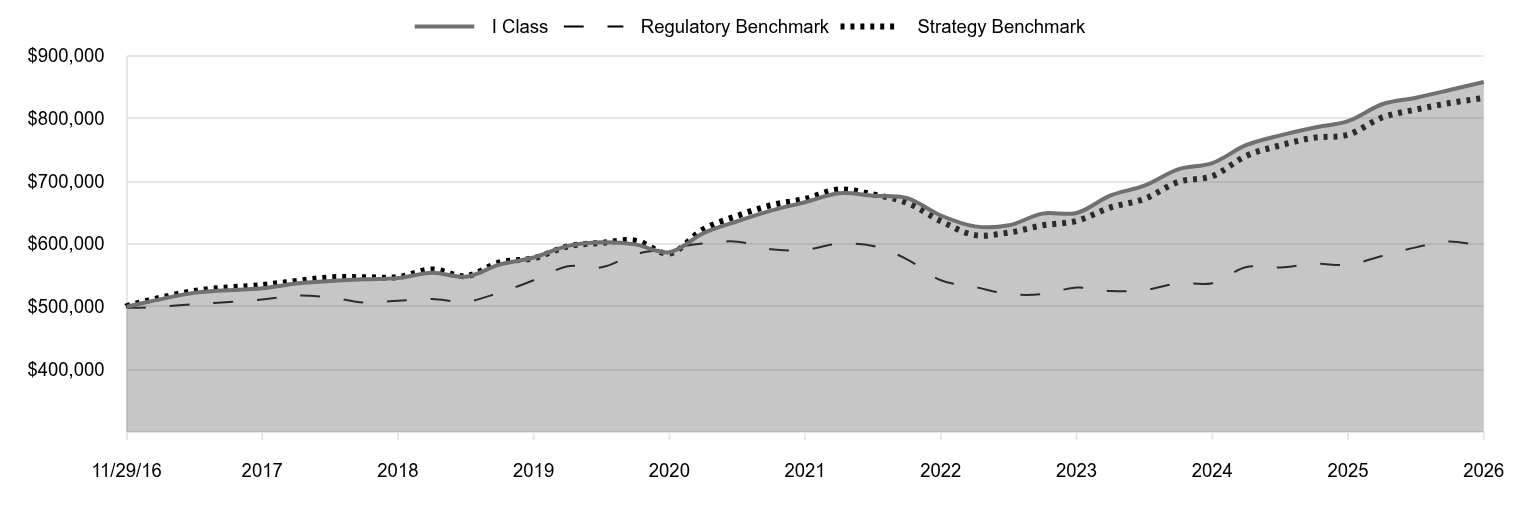
Table Summary
|
I Class |
Regulatory Benchmark |
Strategy Benchmark |
11/29/16 |
500,000 |
500,000 |
500,000 |
11/30/16 |
500,073 |
498,674 |
500,747 |
2/28/17 |
521,834 |
503,720 |
524,914 |
5/31/17 |
529,102 |
511,246 |
534,377 |
8/31/17 |
536,712 |
517,530 |
540,821 |
11/30/17 |
540,608 |
514,702 |
546,597 |
2/28/18 |
543,431 |
506,265 |
546,850 |
5/31/18 |
545,364 |
509,331 |
546,934 |
8/31/18 |
553,993 |
512,100 |
559,216 |
11/30/18 |
547,740 |
507,795 |
548,575 |
2/28/19 |
566,945 |
522,312 |
570,417 |
5/31/19 |
578,293 |
541,930 |
577,028 |
8/31/19 |
596,807 |
564,193 |
595,881 |
11/30/19 |
602,520 |
562,592 |
601,661 |
2/29/20 |
599,210 |
583,332 |
605,197 |
5/31/20 |
586,658 |
592,956 |
584,585 |
8/31/20 |
617,228 |
600,715 |
623,591 |
11/30/20 |
636,103 |
603,570 |
644,791 |
2/28/21 |
653,049 |
591,403 |
661,535 |
5/31/21 |
666,460 |
590,555 |
671,715 |
8/31/21 |
680,643 |
600,209 |
686,798 |
11/30/21 |
676,846 |
596,608 |
678,773 |
2/28/22 |
673,334 |
575,765 |
665,742 |
5/31/22 |
645,270 |
541,999 |
636,278 |
8/31/22 |
627,891 |
531,089 |
613,957 |
11/30/22 |
629,639 |
520,006 |
617,992 |
2/28/23 |
648,260 |
519,790 |
629,430 |
5/31/23 |
649,295 |
530,385 |
636,581 |
8/31/23 |
677,350 |
524,752 |
658,089 |
11/30/23 |
692,888 |
526,141 |
671,702 |
2/29/24 |
718,876 |
537,084 |
698,752 |
5/31/24 |
728,873 |
537,310 |
708,067 |
8/31/24 |
757,700 |
563,042 |
740,535 |
11/30/24 |
773,061 |
562,314 |
757,059 |
2/28/25 |
785,235 |
568,279 |
769,261 |
5/31/25 |
795,665 |
566,641 |
774,030 |
8/31/25 |
822,657 |
580,700 |
801,714 |
11/30/25 |
833,007 |
594,373 |
814,215 |
2/28/26 |
845,268 |
603,857 |
824,519 |
5/31/26 |
858,143 |
595,728 |
832,620 |
|
| Average Annual Return [Table Text Block] |
Table Summary
|
1 Year |
5 Years |
Since Inception 11/29/16 |
Credit Opportunities Fund (I Class) |
7.85% |
5.19% |
5.85% |
Bloomberg U.S. Aggregate Bond Index (Regulatory Benchmark) |
5.13 |
0.17 |
1.86 |
Bloomberg U.S. High-Yield 2% Issuer Capped Bond Index (Strategy Benchmark) |
7.57 |
4.39 |
5.51 | |
| Performance Inception Date |
Nov. 29, 2016
|
| No Deduction of Taxes [Text Block] |
Neither the fund’s returns nor the index returns reflect the deduction of taxes that a shareholder would pay on fund distributions or redemptions of fund shares.
|
| Updated Performance Information Location [Text Block] |
Updated performance information can be found at www.troweprice.com.
|
| Distribution of Capital [Text Block] |
The fund's total return figures reflect the reinvestment of dividends and capital gains, if any.
|
| AssetsNet |
$ 395,564,000
|
| Holdings Count | Holding |
303
|
| Advisory Fees Paid, Amount |
$ 1,552,000
|
| InvestmentCompanyPortfolioTurnover |
36.90%
|
| Additional Fund Statistics Significance or Limits [Text Block] |
What are some fund statistics? - Total Net Assets (000s)$395,564
- Number of Portfolio Holdings303
|
| Holdings [Text Block] |
Table Summary
Corporate Bonds |
81.3% |
Bank Loans |
9.5 |
Securities Lending Collateral |
2.0 |
Convertible Preferred Stocks |
1.1 |
Preferred Stocks |
1.1 |
Municipal Securities |
0.6 |
Common Stocks |
0.4 |
Convertible Bonds |
0.3 |
Short-Term and Other |
3.7 | |
| Largest Holdings [Text Block] |
Table Summary
Vistra |
2.9% |
TransDigm |
2.7 |
Navient |
2.2 |
LifePoint Health |
2.2 |
EchoStar |
1.9 |
Hilcorp Energy I |
1.7 |
Service Properties Trust |
1.6 |
Venture Global LNG |
1.5 |
Jane Street Group |
1.4 |
Neptune Bidco U.S. |
1.3 | |
| Material Fund Change [Text Block] |
|
| Updated Prospectus Web Address |
www.troweprice.com/paperless
|