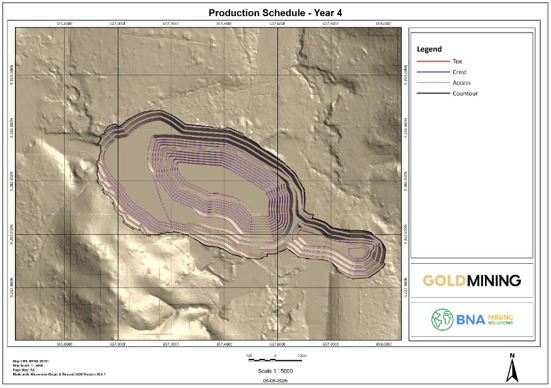
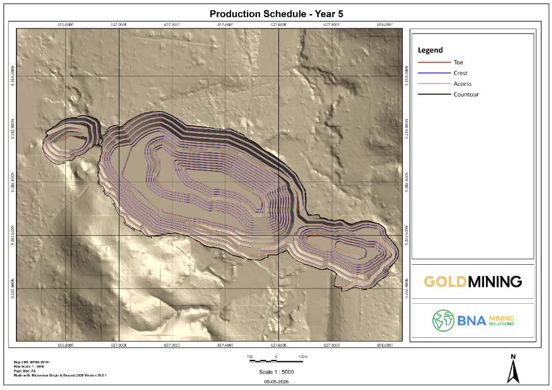
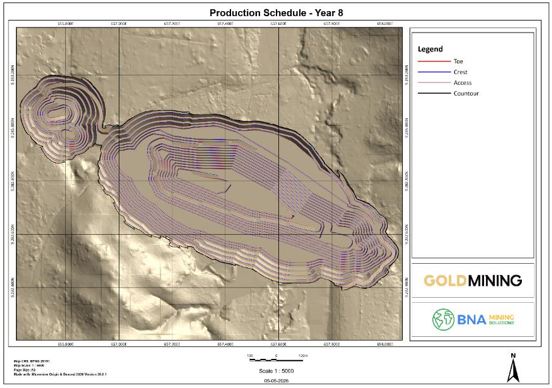
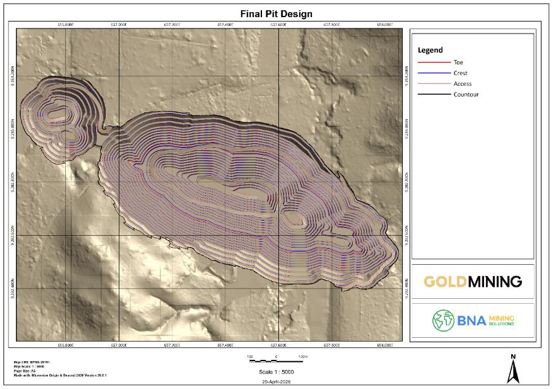
Exhibit 99.2
|
|
|
|
|
|
|
NI 43-101 TECHNICAL REPORT AND PRELIMINARY ECONOMIC ASSESSMENT
SÃO JORGE GOLD PROJECT
PARÁ STATE, BRAZIL
EFFECTIVE DATE: JUNE 09, 2026
ISSUE DATE: JULY 22, 2026
PREPARED FOR:
GOLDMINING INC.
BY
BNA MINING SOLUTIONS
BELO HORIZONTE, BRAZIL
AND
SLR CONSULTING (CANADA) Ltd.
TORONTO, CANADA
|
|
| |
|
|
| |
|
|
| |
Qualified Persons:
Dr. Beck Nader, FAIG, CBRR
Reno Pressacco, M. Sc. (A), P.Geo., FGC
|
|
|
|
|
GoldMining Inc.
NI 43-101 Report – São Jorge Project
|
Page 2 |
Date and Signature Page
The “qualified person” (within the meaning of NI43-101) for the purposes of this report is Dr. Beck Nader, who is Principal Mining Consultant of BNA Mining Solutions Ltda. The effective date of this Technical Report entitled “NI 43-101 Technical Report and Preliminary Economic Assessment São Jorge Gold Project, Pará State, Brazil” is June 09, 2026.
“Signed and sealed”
Dr. Beck Nader, D.Sc., M.Sc. Mining Engineer, Member (FAIG - 4472)
Dated July 22, 2026
The “qualified person” (within the meaning of NI43-101) for the purposes of this report is Reno Pressacco, who is an employee SLR. The effective date of this Technical Report entitled “NI 43-101 Technical Report and Preliminary Economic Assessment São Jorge Gold Project, Pará State, Brazil” is June 09, 2026.
“Signed and sealed”
Reno Pressacco, M.Sc.(A), P.Geo., FGC
Dated July 22, 2026
BNA Mining Solutions - R. Des. Leão Starling, 200 - Ouro Preto, BH - MG, 31310-370 – Phone: +55 (31) 2514-8733 – E-mail: info@bnaconsultoria.com
|
GoldMining Inc.
NI 43-101 Report – São Jorge Project
|
Page 3 |
Certificate of Author – Dr. Beck Nader
I, Beck Nader, FAIG #4472, as a co-author of this report entitled “"NI 43-101 Technical Report and Preliminary Economic Assessment São Jorge Gold Project, Pará State, Brazil (the "Technical Report") with an effective date of June 9, 2026, prepared for GoldMining Inc.,do hereby certify that:
|
1.
|
I am the Principal Mining Consultant of BNA Mining Solutions Ltda.
R. Desembargador Leão Starling, 200, Ouro Preto, Belo Horizonte – MG – Brazil. 31310-370
|
|
2.
|
I graduated with a degree in Mining Engineering from the Polytechnic School of the University of São Paulo (USP), São Paulo, Brazil, in 1981. In addition, I obtained an M.Sc. degree in Mineral Technology from the Federal University of Minas Gerais (UFMG) in 2004 and a D.Sc. degree in Mineral Engineering from the University of São Paulo (USP) in 2012.
|
|
3.
|
I am a fellow of the Australian Institute of Geoscientists (FAIG #4472) and a registered member of CREA-MG, the Regional Council of Engineering and Agronomy of the Minas Gerais State.
|
|
4.
|
I have worked as a Mining Engineer for a total of more than 44 years since my graduation from university. My relevant experience includes mineral resource and reserve estimation of deposits, including economical evaluation of mineral projects, risk assessment and multidisciplinary coordination and integration.
|
|
5.
|
I have read the definition of “qualified person” set out in National Instrument 43-101 (NI 43-101) and certify that by reason of my education, affiliation with a professional association (as defined in NI 43-101) and past relevant work experience, I fulfill the requirements to be a “qualified person” for the purposes of NI 43-101.
|
|
6.
|
I most recently visited the São Jorge Project on February 25-27, 2026.
|
|
7.
|
I have supervised the preparation of this Technical Report and am responsible for Sections 2,3,4,5 and 15 through 26, as well as contributions to Section 1 and 27.
|
|
8.
|
I have not had any prior involvement with the property that is the subject of the Technical Report.
|
|
9.
|
I am independent of the Issuer applying the test set out in section 1.5 of NI 43-101.
|
|
10.
|
I have read NI 43-101 and Form 43-101F1, and the Technical Report has been prepared in compliance with that instrument and form.
|
|
11.
|
I consent to the filing of the Technical Report with any stock exchange and other regulatory authority and any publication by them for regulatory purposes, including electronic publication in the public company files on their websites accessible by the public, of the Technical Report.
|
|
12.
|
As of the effective date of the Technical Report, to the best of my knowledge, information and belief, the Technical Report, or parts the qualified person is responsible for, contains all the scientific and technical information that is required to be disclosed to ensure that the technical report is not misleading.
|
Signed this 22nd day of July, 2026, in Belo Horizonte, Minas Gerais, Brazil.
(Signed) Beck Nader
Dr. Beck Nader - DSc, MSc (Mining Engineer); FAIG #4472
BNA Mining Solutions Ltda.
BNA Mining Solutions - R. Des. Leão Starling, 200 - Ouro Preto, BH - MG, 31310-370 – Phone: +55 (31) 2514-8733 – E-mail: info@bnaconsultoria.com
|
GoldMining Inc.
NI 43-101 Report – São Jorge Project
|
Page 4 |
Certificate of Author – Reno Pressacco
I, Reno Pressacco, M.Sc.(A), P.Geo., FGC, as a co-author of this report entitled “NI 43-101 Technical Report and Preliminary Economic Assessment São Jorge Gold Project, Pará State, Brazil (the “Technical Report”) with an effective date of June 9, 2026, prepared for GoldMining Inc., do hereby certify that:
|
1.
|
I am an Associate Principal Geologist with SLR Consulting (Canada) Ltd, of Suite 501, 55 University Ave., Toronto, ON M5J 2H7.
|
|
2.
|
I am a graduate of Cambrian College of Applied Arts and Technology, Sudbury, Ontario, in 1982 with a CET Diploma in Geological Technology; Lake Superior State College, Sault Ste. Marie, Michigan, USA in 1984 with a Bachelor of Science degree in Geology; and McGill University, Montreal, Québec in 1986 with a Master of Applied Science degree in Mineral Exploration.
|
|
3.
|
I am registered as a Professional Geologist in the Province of Ontario (Reg. #939). I have worked as a geologist for a total of 40 years since my graduation. My relevant experience for the purpose of the Technical Report is:
|
| |
●
|
Review and report as a consultant on numerous exploration and mining projects around the world for due diligence and regulatory requirements including preparation of Mineral Resource estimates and NI 43-101 Technical Reports.
|
| |
●
|
Numerous assignments in North, Central, and South America, Europe, Russia, Armenia, and China for a variety of deposit types in different geological environments. Commodities include Au, Ag, Cu, Zn, Pb, Ni, Mo, U, PGM, REE, and industrial minerals.
|
| |
●
|
Vice president positions with Canadian mining companies.
|
| |
●
|
A senior position with an international consulting firm.
|
| |
●
|
Performing as an exploration, development, and production stage geologist for several Canadian mining companies.
|
|
4.
|
I have read the definition of "qualified person" set out in National Instrument 43-101 (NI 43-101) and certify that by reason of my education, affiliation with a professional association (as defined in NI 43-101) and past relevant work experience, I fulfill the requirements to be a "qualified person" for the purposes of NI 43-101.
|
|
5.
|
I most recently visited the São Jorge Project on May 3, 2024, and May 4, 2024.
|
|
6.
|
I am responsible for Sections 6 to 14 inclusive, and contributions to Sections 1 and 27 of the Technical Report.
|
|
7.
|
I am independent of the Issuer applying the test set out in Section 1.5 of NI 43-101.
|
|
8.
|
I have previously been involved with the preparation of a technical report dated January 28, 2025 on the property that is the subject of the Technical Report.
|
|
9.
|
I have read NI 43-101, and the Technical Report has been prepared in compliance with NI 43-101 and Form 43-101F1.
|
|
10.
|
At the effective date of the Technical Report, to the best of my knowledge, information, and belief, the Technical Report contains all scientific and technical information that is required to be disclosed to make the Technical Report not misleading.
|
Dated 22nd day of July, 2026
(Signed) Reno Pressacco
Reno Pressacco, M.Sc.(A), P.Geo., FGC
SLR Consulting (Canada) Ltd.
BNA Mining Solutions - R. Des. Leão Starling, 200 - Ouro Preto, BH - MG, 31310-370 – Phone: +55 (31) 2514-8733 – E-mail: info@bnaconsultoria.com
|
GoldMining Inc.
NI 43-101 Report – São Jorge Project
|
Page 5 |
LIST OF CONTENTS
|
1
|
Summary
|
29
|
|
1.1
|
Executive Summary
|
29
|
|
1.2
|
Property Description and Location
|
29
|
|
1.3
|
Permit Status and Ownership
|
32
|
|
1.4
|
Geology and Mineralization
|
33
|
|
1.5
|
Exploration and Drilling
|
34
|
|
1.6
|
Mineral Processing and Metallurgical Testing
|
35
|
|
1.7
|
Mineral Resource Estimate
|
36
|
|
1.8
|
Mineral Reserve Estimate
|
37
|
|
1.9
|
PEA Production Metrics
|
37
|
|
1.10
|
Mining Methods
|
38
|
|
1.11
|
Recovery Methods
|
41
|
|
1.12
|
Infrastructure
|
41
|
|
1.13
|
Capital Costs
|
41
|
|
1.14
|
Operating Costs
|
41
|
|
1.15
|
Economic Analysis
|
42
|
|
1.16
|
Conclusions and Recommendations
|
42
|
|
2
|
Introduction
|
45
|
|
2.1
|
Terms of Reference and Purpose of the Report
|
45
|
|
2.2
|
Qualifications of Consultants
|
45
|
|
2.3
|
Details of Inspection
|
46
|
|
2.4
|
Sources of Information Provided by GoldMining Inc.
|
46
|
|
2.5
|
Effective Date
|
47
|
BNA Mining Solutions - R. Des. Leão Starling, 200 - Ouro Preto, BH - MG, 31310-370 – Phone: +55 (31) 2514-8733 – E-mail: info@bnaconsultoria.com
|
GoldMining Inc.
NI 43-101 Report – São Jorge Project
|
Page 6 |
|
2.6
|
Units of Measure
|
47
|
|
3 Reliance on Other Experts
|
48
|
|
4 Property Description and Location
|
49
|
|
4.1
|
Project Location
|
49
|
|
4.2
|
Mineral Tenure and Title
|
51
|
|
4.3
|
Surface Rights
|
53
|
|
4.4
|
Royalties, Agreements and Encumbrances
|
53
|
|
4.4.1
|
Environmental Liabilities and Permitting |
53
|
|
4.5
|
Other Significant Factors and Risks
|
54
|
|
5 Accessibility, Climate, Local Resources, Infrastructure and Physiography
|
55
|
|
5.1
|
Accessibility
|
55
|
|
5.2
|
Climate
|
56
|
|
5.3
|
Local Resources and Infrastructure
|
56
|
|
5.4
|
Physiography
|
57
|
|
6 History
|
58
|
|
6.1
|
Prior Ownership
|
58
|
|
6.2
|
Exploration and Development History
|
58
|
|
6.2.1
|
RTDM Drilling
|
60
|
|
6.2.2
|
Talon Drilling
|
60
|
|
6.2.3
|
BGC Drilling
|
61
|
|
6.3
|
Historical Resource Estimates
|
61
|
|
6.4
|
Past Production
|
61
|
|
7 Geological Setting and Mineralization
|
62
|
|
7.1
|
Regional Geology
|
62
|
BNA Mining Solutions - R. Des. Leão Starling, 200 - Ouro Preto, BH - MG, 31310-370 – Phone: +55 (31) 2514-8733 – E-mail: info@bnaconsultoria.com
|
GoldMining Inc.
NI 43-101 Report – São Jorge Project
|
Page 7 |
|
7.2
|
Property Geology
|
64
|
|
7.2.1
|
Lithologies
|
64
|
|
7.2.2
|
Alteration
|
65
|
|
7.2.3
|
Structure
|
72
|
|
7.3
|
Mineralization
|
74
|
|
8 Deposit Types
|
77
|
|
9 Exploration
|
78
|
|
9.1
|
Exploration by Previous Owners
|
78
|
|
9.1.1
|
IP Survey
|
78
|
|
9.2
|
Exploration Completed by GoldMining Inc.
|
80
|
|
9.2.1
|
IP Infill and Extensions
|
80
|
|
9.2.2
|
Soil Sampling Procedures and Parameters
|
81
|
|
9.2.3
|
Mapping and Rock Chip Sampling
|
81
|
|
9.2.4
|
Surficial Geological Exploration preliminary conclusions
|
83
|
|
10 Drilling
|
85
|
|
10.1
|
Introduction
|
85
|
|
10.2
|
Drilling, Logging, and Sampling Procedures
|
89
|
|
10.2.1
|
Auger Drilling
|
89
|
|
10.2.2
|
Diamond Drilling
|
92
|
|
10.2.3
|
Drill Core Resampling Program
|
95
|
|
10.2.4
|
RC Drilling Program
|
95
|
|
11 Sample Preparation, Analyses, and Security
|
97
|
|
11.1
|
Sample Preparation and Analysis
|
97
|
|
11.1.1
|
Auger Drill Holes
|
97
|
BNA Mining Solutions - R. Des. Leão Starling, 200 - Ouro Preto, BH - MG, 31310-370 – Phone: +55 (31) 2514-8733 – E-mail: info@bnaconsultoria.com
|
GoldMining Inc.
NI 43-101 Report – São Jorge Project
|
Page 8 |
|
11.1.2
|
Diamond Drill Holes
|
97
|
|
11.1.3
|
Drill Core Resampling Program
|
98
|
|
11.1.4
|
RC Drilling Program
|
98
|
|
11.2
|
Quality Assurance and Quality Control
|
99
|
|
12 Data Verification
|
102
|
|
13 Mineral Processing and Metallurgical Testing
|
104
|
|
13.1
|
Metallurgical Testing – 2006
|
104
|
|
13.2
|
Metallurgical Testing – 2012
|
107
|
|
13.2.1
|
Sample Selection and Location
|
107
|
|
13.2.2
|
Head Samples and Assays
|
108
|
|
13.2.3
|
Granulometric Test Work
|
109
|
|
13.2.4
|
Grindability Testing
|
109
|
|
13.2.5
|
Gravity Concentration Test Work
|
110
|
|
13.2.6
|
Kinetic Curves for Leaching Without Gravity Concentration
|
111
|
|
13.2.7
|
Kinetic Curves for Leaching With Gravity Concentration
|
112
|
|
13.3
|
Conclusions
|
115
|
|
13.4
|
Recommendations
|
117
|
|
14 Mineral Resource Estimate
|
119
|
|
14.1
|
Summary
|
119
|
|
14.2
|
Resource Database
|
120
|
|
14.3
|
Topography and Excavation Models
|
121
|
|
14.4
|
Weathering, Lithology and Mineralization Wireframes
|
121
|
|
14.4.1
|
Weathering
|
121
|
|
14.4.2
|
Lithology
|
121
|
BNA Mining Solutions - R. Des. Leão Starling, 200 - Ouro Preto, BH - MG, 31310-370 – Phone: +55 (31) 2514-8733 – E-mail: info@bnaconsultoria.com
|
GoldMining Inc.
NI 43-101 Report – São Jorge Project
|
Page 9 |
|
14.4.3
|
Mineralization
|
121
|
|
14.5
|
Sample Statistics and Grade Capping
|
125
|
|
14.6
|
Compositing
|
126
|
|
14.7
|
Bulk Density
|
127
|
|
14.8
|
Trend Analysis
|
128
|
|
14.8.1
|
Grade Contouring
|
128
|
|
14.8.2
|
Variography
|
132
|
|
14.9
|
Block Model Construction
|
133
|
|
14.10
|
Search Strategy and Grade Interpolation Parameters
|
134
|
|
14.11
|
Block Model Validation
|
136
|
|
14.11.1
|
Visual Comparisons
|
136
|
|
14.11.2
|
Swath Plots
|
140
|
|
14.11.3
|
3D Polygonal De-clustered Mean Grades
|
141
|
|
14.12
|
Classification
|
144
|
|
14.13
|
Determination of Reasonable Prospects for Eventual Economic Extraction (“RPEEE”)
|
146
|
|
14.14
|
Mineral Resource Reporting
|
148
|
|
14.15
|
Factors Affecting the Mineral Resource
|
149
|
|
14.16
|
Sensitivity Analysis
|
150
|
|
15 Mineral Reserve Estimate
|
153
|
|
16 Mining Methods
|
154
|
|
16.1
|
Introduction
|
154
|
|
16.2
|
Geotechnical Studies
|
154
|
|
16.2.1
|
Geological Context
|
154
|
|
16.2.2
|
Technical Visit
|
155
|
BNA Mining Solutions - R. Des. Leão Starling, 200 - Ouro Preto, BH - MG, 31310-370 – Phone: +55 (31) 2514-8733 – E-mail: info@bnaconsultoria.com
|
GoldMining Inc.
NI 43-101 Report – São Jorge Project
|
Page 10 |
|
16.2.3
|
Pit
|
156
|
|
16.2.4
|
Waste Dump
|
157
|
|
16.2.5
|
Final Consideration
|
158
|
|
16.3
|
Base Data, Design Criteria and Project Parameters
|
160
|
|
16.3.1
|
Technical and Economic Parameters Used for Final Pit Generation
|
160
|
|
16.3.2
|
Surface Constraints
|
161
|
|
16.4
|
Optimal Pit Selection
|
162
|
|
16.5
|
Mining Method
|
167
|
|
16.6
|
Final Pit Design
|
167
|
|
16.7
|
Mine Preparation
|
170
|
|
16.8
|
Production Schedule
|
171
|
|
16.8.1
|
Annual Production Rate
|
171
|
|
16.8.2
|
Mine Sequencing
|
171
|
|
16.9
|
Waste Disposal
|
178
|
|
16.10
|
Geotechnical Considerations
|
183
|
|
16.10.1
|
Materials and Lithotypes (Pit)
|
183
|
|
16.10.2
|
Final Pit Geometry
|
189
|
|
16.10.3
|
Definition of Geotechnical Domains
|
191
|
|
16.10.4
|
Criteria and Assumptions
|
192
|
|
16.10.5
|
Pit Instrumentation and Monitoring Plan
|
194
|
|
16.10.6
|
Waste Rock Dump Studies
|
195
|
|
16.10.7
|
Conclusions
|
201
|
|
16.11
|
Mine Drainage
|
202
|
|
16.11.1
|
Pit Drainage
|
202
|
BNA Mining Solutions - R. Des. Leão Starling, 200 - Ouro Preto, BH - MG, 31310-370 – Phone: +55 (31) 2514-8733 – E-mail: info@bnaconsultoria.com
|
GoldMining Inc.
NI 43-101 Report – São Jorge Project
|
Page 11 |
|
16.11.2
|
Waste Pile Drainage
|
203
|
|
16.11.3
|
Roads and Access Route Drainage
|
203
|
|
16.12
|
Mining Operation
|
203
|
|
16.13
|
Equipment
|
204
|
|
16.13.1
|
Estimation of Average Haul Distances
|
204
|
|
16.13.2
|
Drill and Blast
|
204
|
|
16.13.3
|
Equipment Selection
|
206
|
|
16.13.4
|
Mining Fleet Sizing
|
209
|
|
16.14
|
Personnel Requirements
|
216
|
|
17 Recovery Methods
|
217
|
|
17.1
|
Process Design Criteria
|
217
|
|
17.2
|
Overall Flowsheet and General Layout
|
219
|
|
17.3
|
Process Plant Description
|
222
|
|
17.3.1
|
Primary, Secondary, and Tertiary Crushing – Stockpile
|
222
|
|
17.3.2
|
Grinding and Classification
|
222
|
|
17.3.3
|
Gravity Gold Recovery
|
223
|
|
17.3.4
|
Pre-Leach Thickening and CIL
|
223
|
|
17.3.5
|
Cyanide Recovery, Detoxification, and Tailings
|
223
|
|
17.3.6
|
Acid Wash and Elution
|
224
|
|
17.3.7
|
Electrowinning and Gold Room
|
225
|
|
17.3.8
|
Tailings Storage Facility
|
225
|
|
17.3.9
|
Carbon Regeneration
|
225
|
|
17.3.10
|
Plant Services and Reagents
|
226
|
|
17.3.11
|
Metallurgical Control
|
229
|
BNA Mining Solutions - R. Des. Leão Starling, 200 - Ouro Preto, BH - MG, 31310-370 – Phone: +55 (31) 2514-8733 – E-mail: info@bnaconsultoria.com
|
GoldMining Inc.
NI 43-101 Report – São Jorge Project
|
Page 12 |
|
17.4
|
Process Plant Consumption
|
229
|
|
17.4.1
|
Energy
|
229
|
|
17.4.2
|
Water
|
229
|
|
17.4.3
|
Reagents and Consumables
|
230
|
|
17.4.4
|
Control Philosophy
|
230
|
|
17.4.5
|
Workforce
|
231
|
|
18 Project Infrastructure
|
232
|
|
18.1
|
Site Layout
|
232
|
|
18.2
|
Access Roads
|
234
|
|
18.3
|
Camp Accommodations
|
234
|
|
18.4
|
Support Infrastructure – Mine, Process Plant, and Administrative Area
|
235
|
|
18.5
|
Power Supply and Distribution
|
236
|
|
18.6
|
Water Infrastructure
|
236
|
|
18.7
|
Tailings Disposal System
|
237
|
|
18.7.1
|
Geological-Geotechnical Studies
|
237
|
|
18.7.2
|
Design Description
|
239
|
|
18.7.3
|
Geotechnical Considerations
|
239
|
|
18.8
|
Site Personnel and Support Services
|
246
|
|
19 Market Studies and Contracts
|
249
|
|
20 Environmental Studies, Permitting and Social or Community Impact
|
250
|
|
21 Capital and Operating Costs
|
251
|
|
21.1
|
Capital Expenditure
|
251
|
|
21.1.1
|
CAPEX Summary
|
252
|
|
21.1.2
|
Preliminary Initial Capital
|
253
|
BNA Mining Solutions - R. Des. Leão Starling, 200 - Ouro Preto, BH - MG, 31310-370 – Phone: +55 (31) 2514-8733 – E-mail: info@bnaconsultoria.com
|
GoldMining Inc.
NI 43-101 Report – São Jorge Project
|
Page 13 |
|
21.1.3
|
Mining
|
254
|
|
21.1.4
|
Process Plant
|
255
|
|
21.1.5
|
Site Infrastructure, Camp Facilities and Civil Works
|
256
|
|
21.1.6
|
Power Supply, Distribution and Automation Infrastructure
|
257
|
|
21.1.7
|
General and Engineering Services
|
258
|
|
21.1.8
|
Pre-Production, Start-Up, First Fill and Ramp-Up
|
259
|
|
21.1.9
|
Indirect Costs, Owner's Costs and Contingency
|
259
|
|
21.1.10
|
Mine Closure
|
260
|
|
21.1.11
|
Sustaining Capital
|
260
|
|
21.2
|
Operating Cost Expenditures
|
263
|
|
21.2.1
|
Operating Costs Summary
|
263
|
|
21.2.2
|
Mining
|
265
|
|
21.2.3
|
Process Plant Consumption
|
274
|
|
21.2.4
|
Administration, Infrastructure Maintenance and Other Costs
|
278
|
|
22 Economic Analysis
|
282
|
|
22.1
|
Principal Assumptions
|
282
|
|
22.2
|
Cashflow Forecasts and Annual Production Forecasts
|
283
|
|
22.3
|
Taxes, Royalties and Other Interests
|
283
|
|
22.3.1
|
Federal Income Tax
|
283
|
|
22.3.2
|
Mining Royalties
|
284
|
|
22.3.3
|
Other Taxes
|
284
|
|
22.4
|
Economic Analysis
|
284
|
|
22.4.1
|
Leverage to Gold Price
|
288
|
|
22.5
|
Project Sensitivity Analysis
|
288
|
BNA Mining Solutions - R. Des. Leão Starling, 200 - Ouro Preto, BH - MG, 31310-370 – Phone: +55 (31) 2514-8733 – E-mail: info@bnaconsultoria.com
|
GoldMining Inc.
NI 43-101 Report – São Jorge Project
|
Page 14 |
|
22.5.1
|
One-Variable Sensitivity Analysis
|
288
|
|
22.5.2
|
Two-Variable Sensitivity Analysis
|
290
|
|
23 Adjacent Properties
|
293
|
|
23.1
|
Tocantinzinho Mine
|
293
|
|
23.2
|
Cuiú Cuiú Deposit
|
294
|
|
23.3
|
Palito and São Chico Mines
|
296
|
|
24 Other Relevant Data and Information
|
299
|
|
25 Interpretation and Conclusions
|
300
|
|
25.1
|
Interpretation
|
300
|
|
25.2
|
Conclusions
|
300
|
|
26 Recommendations
|
301
|
|
26.1
|
Recommended Future Investments
|
301
|
|
27 References
|
303
|
BNA Mining Solutions - R. Des. Leão Starling, 200 - Ouro Preto, BH - MG, 31310-370 – Phone: +55 (31) 2514-8733 – E-mail: info@bnaconsultoria.com
|
GoldMining Inc.
NI 43-101 Report – São Jorge Project
|
Page 15 |
LIST OF FIGURES
|
Figure 1.1 - Location Map of the Project
|
30
|
|
Figure 1.2 - São Jorge Project location
|
31
|
|
Figure 1.3 - São Jorge deposit location (situated on the São Jorge Claim)
|
32
|
|
Figure 1.4 - Regional Geology
|
33
|
|
Figure 1.5 - Property Geology
|
34
|
|
Figure 1.6 - Diamond Drill Hole and Auger Drill Hole Locations
|
35
|
|
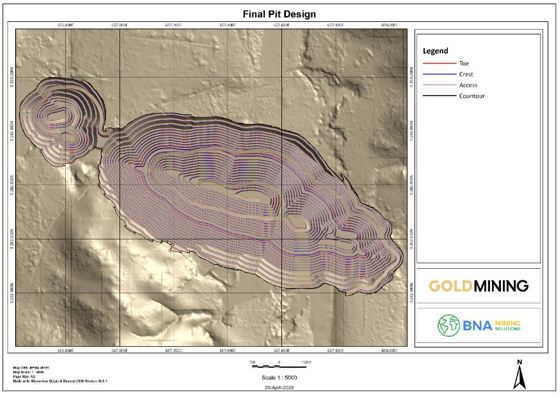
Figure 1.7 - Final Pit Design
|
39
|
|
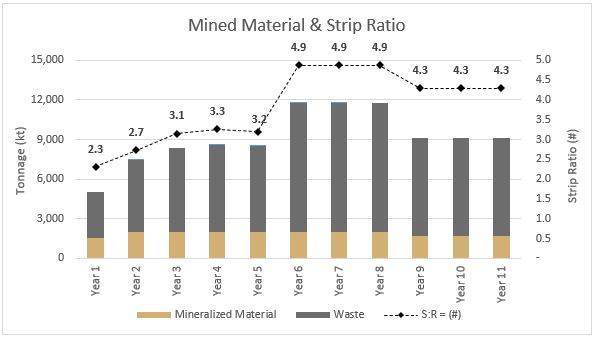
Figure 1.8 - Mined Material Schedule
|
40
|
|
Figure 1.9 - Process Schedule
|
40
|
|
Figure 4.1 - Location Map of the Project
|
50
|
|
Figure 4.2 - São Jorge Project location & notable mining operation nearby
|
51
|
|
Figure 4.3 – São Jorge Project Tenements
|
52
|
|
Figure 5.1 - Accessibility map
|
56
|
|
Figure 7.1 – São Jorge Project, regional-scale geology
|
63
|
|
Figure 7.2 – São Jorge property-scale geology
|
65
|
|
Figure 7.3 - Typical examples of São Jorge host lithologies
|
67
|
|
Figure 7.4 - Example of fresh, un-altered monzogranite
|
68
|
|
Figure 7.5 - Example of Fe-oxide +/- Chlorite Alteration
|
69
|
|
Figure 7.6 - Example of K-Feldspar-Epidote-Chlorite Alteration
|
70
|
|
Figure 7.7 - Example of Mixed Zone Alteration Type
|
71
|
|
Figure 7.8 - Example of Heterogenous Alteration Type zone
|
72
|
|
Figure 7.9 - Example of a small scale shear zone in drill core
|
73
|
|
Figure 7.10 - Examples of shear zones containing quartz veins in drill core
|
73
|
BNA Mining Solutions - R. Des. Leão Starling, 200 - Ouro Preto, BH - MG, 31310-370 – Phone: +55 (31) 2514-8733 – E-mail: info@bnaconsultoria.com
|
GoldMining Inc.
NI 43-101 Report – São Jorge Project
|
Page 16 |
|
Figure 7.11 - Example of shear zone in saprolite containing sulphide veinlets. View looking east
|
74
|
|
Figure 7.12 - Example of fine disseminated pyrite mineralization within the mixed alteration zone
|
75
|
|
Figure 7.13 - Example of fracture controlled vein-style pyrite mineralization within the Fe-Ox-chlorite alteration zone
|
76
|
|
Figure 7.14 - Example of semi-massive, veinlet, and disseminated pyrite mineralization
|
76
|
|
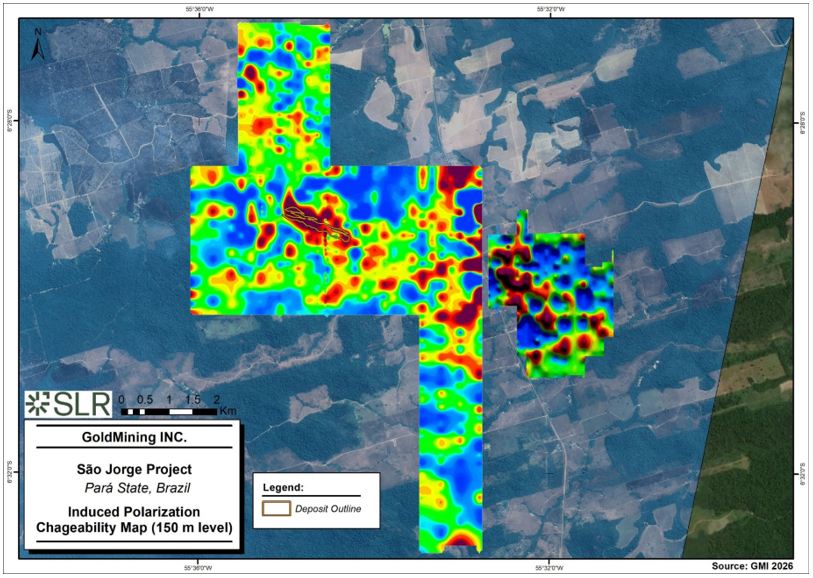
Figure 9.1 - Induce Polarization chargeability Map (100 m level) combining historic data (2011) and recent infill and extensions of the IP grid (2025 – 2026).
|
79
|
|
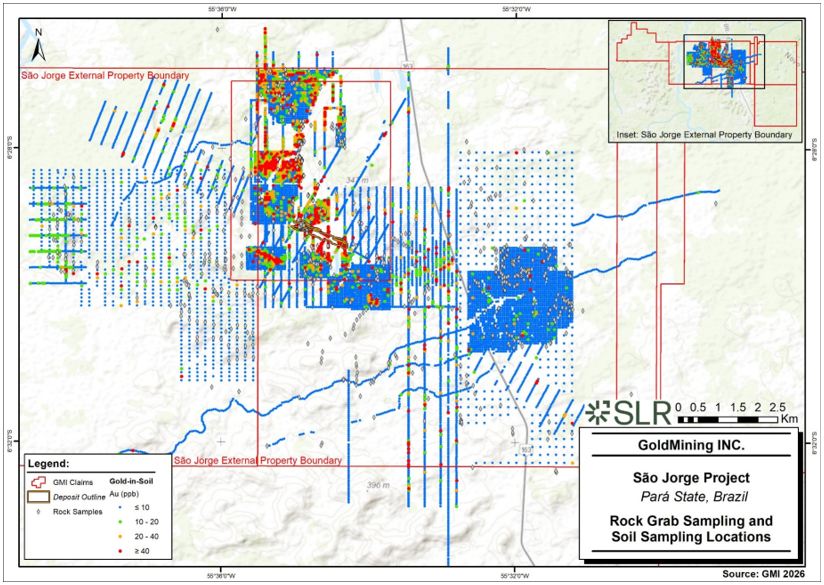
Figure 9.2 – Soil and rock grab sampling locations, combining historic data (2011) and recent infill and extensions of the IP grid (2025 – 2026)
|
82
|
|
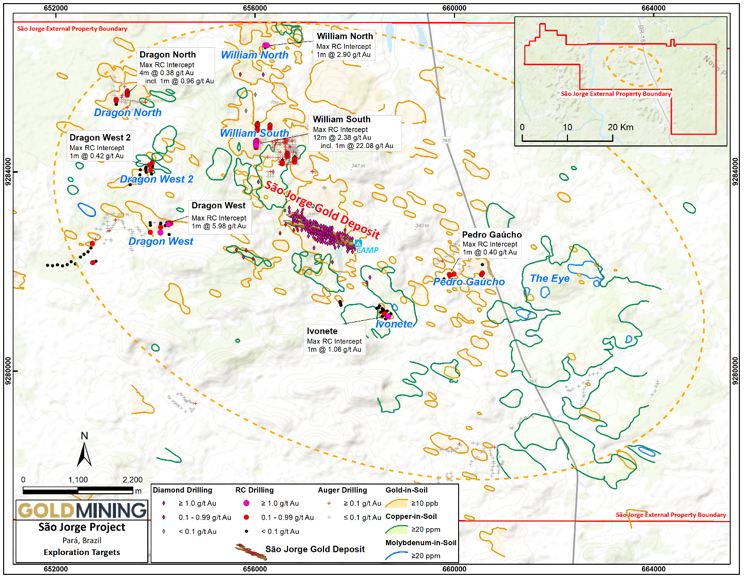
Figure 9.3 – Exploration targets within a 5km radius
|
84
|
|
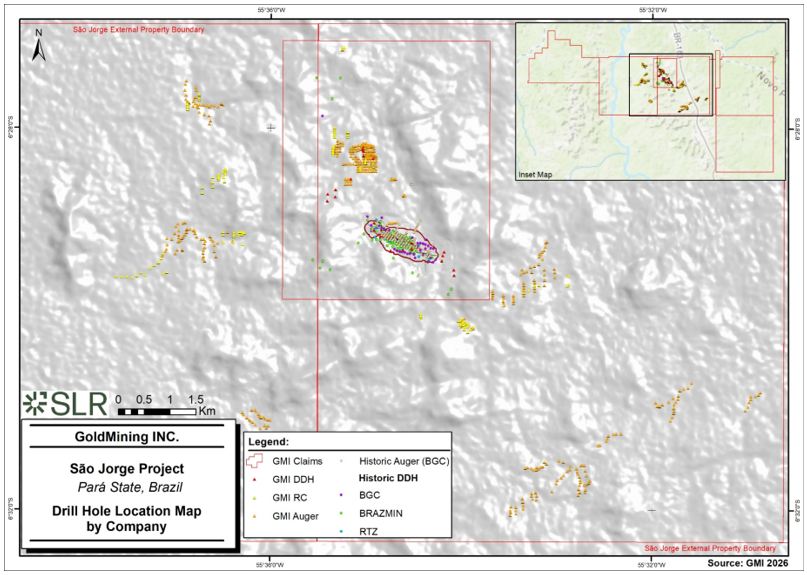
Figure 10.1 - Drill hole location map by Company to June 9, 2026
|
86
|
|
Figure 10.2 - Diamond drill hole and auger drill hole locations
|
87
|
|
Figure 10.3 - Auger hole location map
|
89
|
|
Figure 10.4 - Typical drill core recovery
|
93
|
|
Figure 10.5 - Core Logging Workflow
|
94
|
|
Figure 11.1 - Drill Core Sampling Workflow
|
99
|
|
Figure 11.2 - Control Chart for Certified Reference Material SE58
|
100
|
|
Figure 11.3 - Control Chart for Coarse Blank Material
|
101
|
|
Figure 13.1 - São Jorge Gravity Recovery Result
|
106
|
|
Figure 13.2 - Leaching Recovery Test Result
|
106
|
|
Figure 13.3 - Gravity Plus Leach Recovery Test Result
|
107
|
|
Figure 13.4 - Gold Recovery Versus Grind Size
|
110
|
|
Figure 13.5 - Leaching Test – Percentage Recovery Versus Time
|
114
|
|
Figure 13.6 - Recovery Versus Leach Time P80 = 106 microns
|
114
|
|
Figure 13.7 - Recovery Versus Leach Time P80 = 75 microns
|
114
|
|
Figure 13.8 - Predicted Grade Versus Recovery for Higher Grade Mineralization
|
116
|
BNA Mining Solutions - R. Des. Leão Starling, 200 - Ouro Preto, BH - MG, 31310-370 – Phone: +55 (31) 2514-8733 – E-mail: info@bnaconsultoria.com
|
GoldMining Inc.
NI 43-101 Report – São Jorge Project
|
Page 17 |
|
Figure 14.1 - Plan View of the Mineralized Wireframes
|
123
|
|
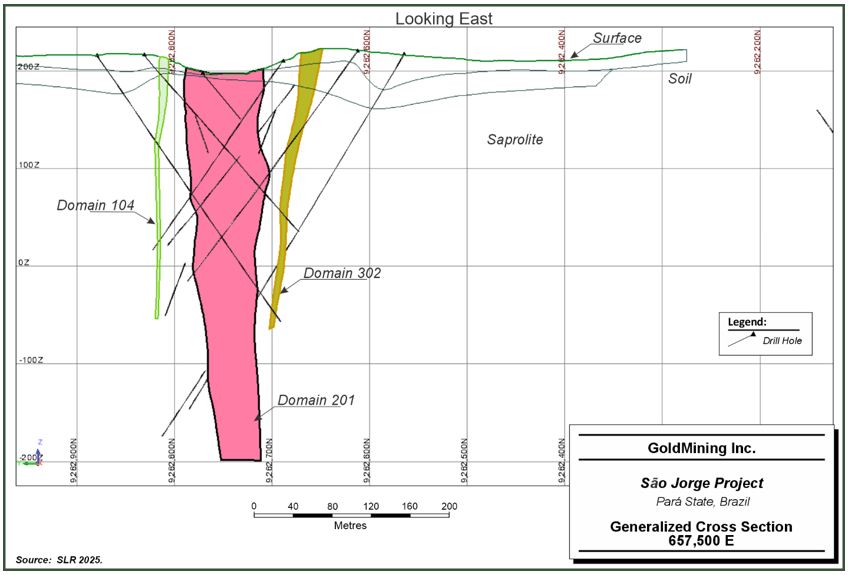
Figure 14.2 - Generalized Cross Section 657,500 E (looking east)
|
124
|
|
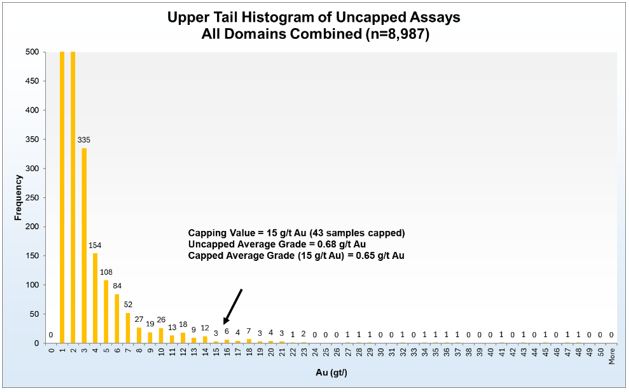
Figure 14.3 - Upper Tail Histogram of the Combined Gold Assays
|
126
|
|
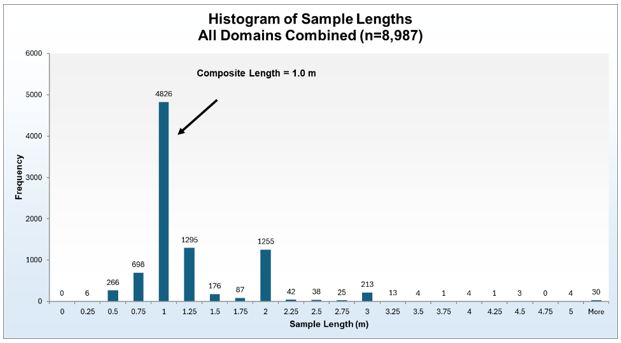
Figure 14.4 - Histogram of Sample Lengths
|
127
|
|
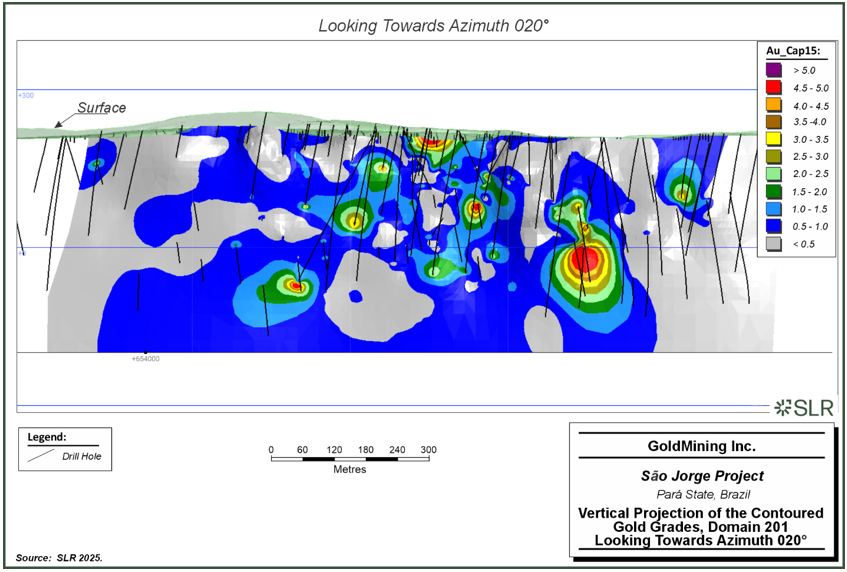
Figure 14.5 - Vertical Projection of the Contoured Gold Grades, Domain 201 Looking Towards Azimuth 020º
|
129
|
|
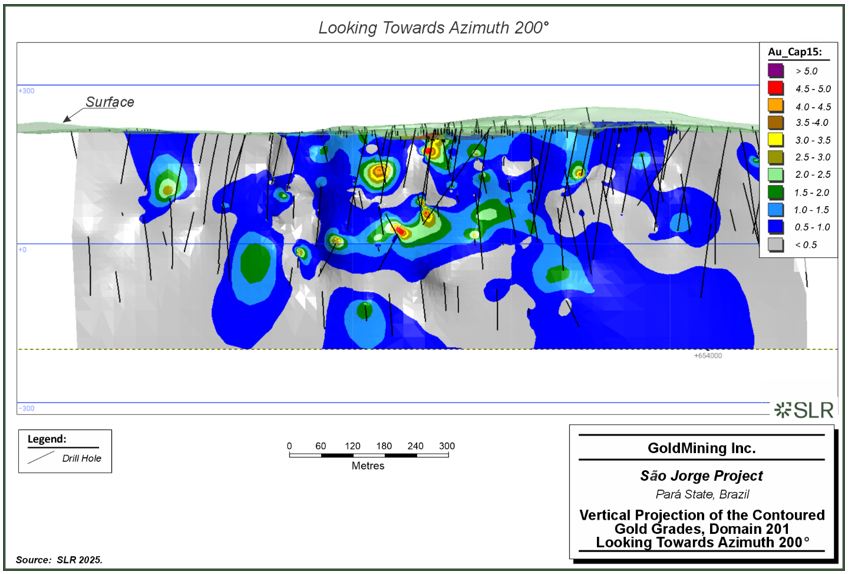
Figure 14.6 - Vertical Projection of the Contoured Gold Grades, Domain 201 Looking Towards Azimuth 200º
|
130
|
|
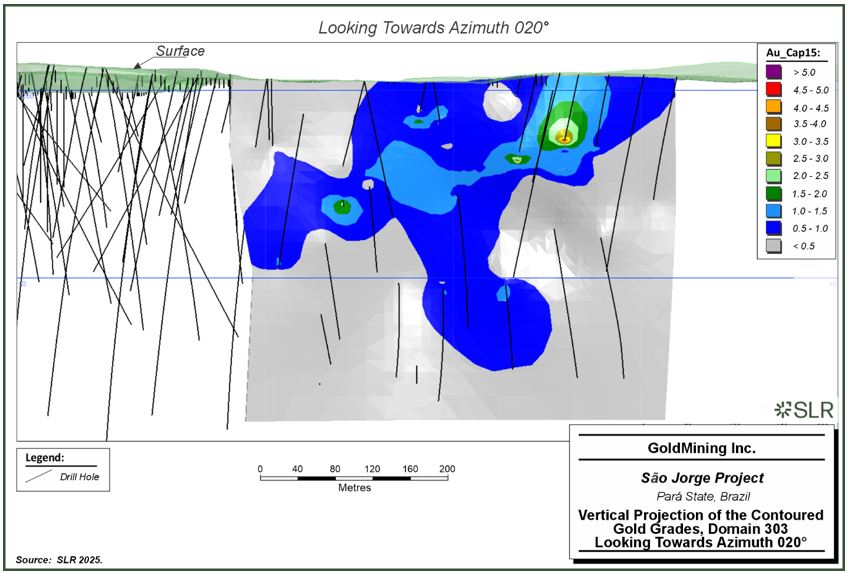
Figure 14.7 - Vertical Projection of the Contoured Gold Grades, Domain 303 Looking Towards Azimuth 020º
|
131
|
|
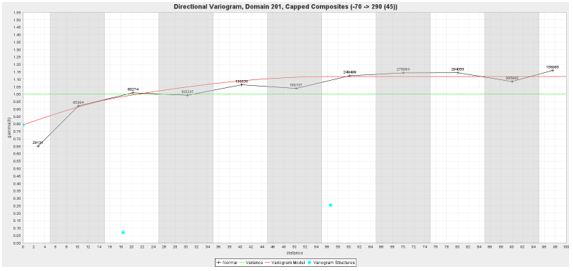
Figure 14.8 - Directional Variogram #1, Domain 201
|
132
|
|
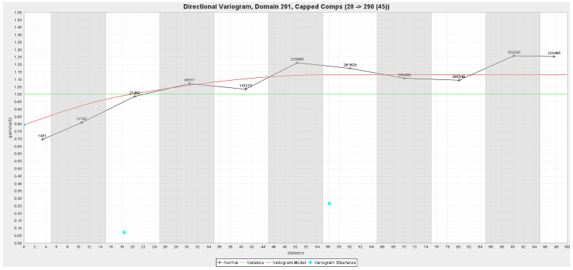
Figure 14.9 - Directional Variogram #2, Domain 201
|
132
|
|
Figure 14.10 - Comparison of Contoured Grades vs Block Model Estimates, Domain 201
|
137
|
|
Figure 14.11 - Comparison of Contoured Grades vs Block Model Estimates, Domain 201
|
138
|
|
Figure 14.12 - Comparison of Contoured Grades vs Block Model Estimates, Domain 303
|
139
|
|
Figure 14.13 - Swath Plot by Easting, Domain 201
|
140
|
|
Figure 14.14 - Swath Plot by Easting, Domain 303
|
140
|
|
Figure 14.15 - Swath Plot by Easting, Domain 104
|
141
|
|
Figure 14.16 - Polygonally De-clustered DDH Grades vs Block Model Estimated Grades, Domain 201
|
142
|
|
Figure 14.17 - Polygonally De-clustered DDH Grades vs Block Model Estimated Grades, Domain 303
|
142
|
|
Figure 14.18 - Polygonally De-clustered DDH Grades vs Block Model Estimated Grades, Domain 104
|
143
|
|
Figure 14.19 - Longitudinal View of the Classified Mineral Resources, Domain 201
|
145
|
|
Figure 14.20 - Isometric View of the Mineral Resource Pit Shell
|
147
|
|
Figure 14.21 - Isometric View of Selected Pit Shells from the Sensitivity Analysis
|
151
|
|
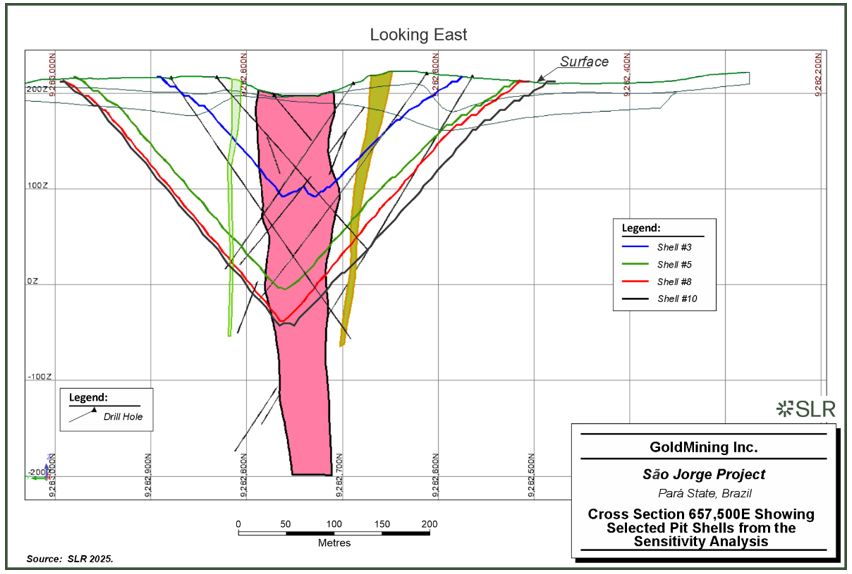
Figure 14.22 - Cross Section 657,500E Showing Selected Pit Shells from the Sensitivity Analysis
|
152
|
|
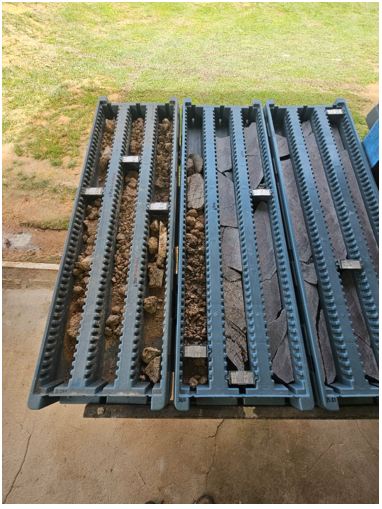
Figure 16.1 - Validation of drillhole SJD-120-24
|
155
|
BNA Mining Solutions - R. Des. Leão Starling, 200 - Ouro Preto, BH - MG, 31310-370 – Phone: +55 (31) 2514-8733 – E-mail: info@bnaconsultoria.com
|
GoldMining Inc.
NI 43-101 Report – São Jorge Project
|
Page 18 |
|
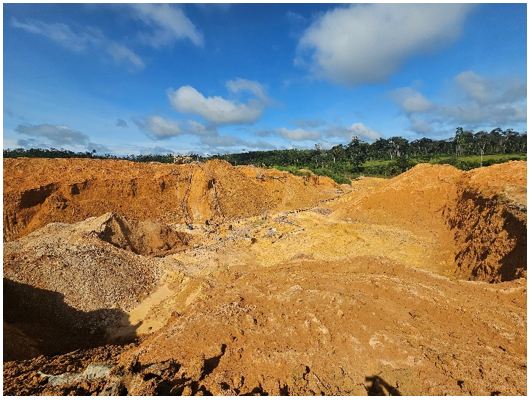
Figure 16.2 - Visit to active artisanal mining area within the São Jorge deposit
|
156
|
|
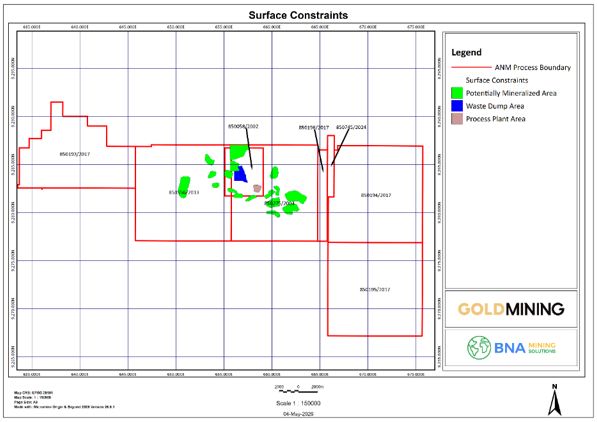
Figure 16.3 - Surface Constraints
|
162
|
|
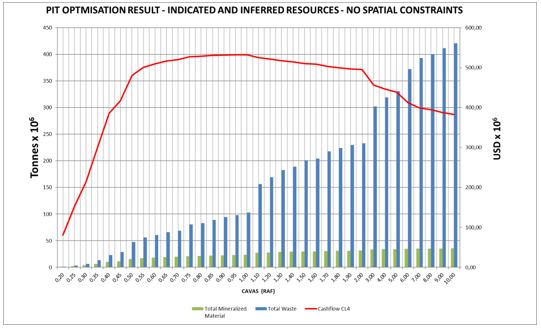
Figure 16.4 - Final Pit Optimization Results
|
166
|
|
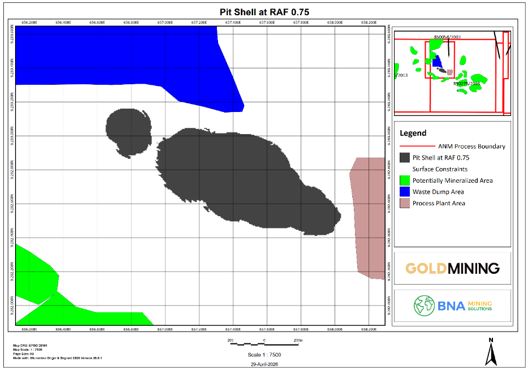
Figure 16.5 - Optimized Pit Shell - RAF 0.75
|
166
|
|
Figure 16.6 - Final Pit Design
|
170
|
|
Figure 16.7 - Mined Material Schedule
|
174
|
|
Figure 16.8 - Process Schedule
|
174
|
|
Figure 16.9 - Mine Sequencing Results – Year 1
|
175
|
|
Figure 16.10 - Mine Sequencing Results – Year 2
|
175
|
|
Figure 16.11 - Mine Sequencing Results – Year 3
|
176
|
|
Figure 16.12 - Mine Sequencing Results – Year 4
|
176
|
|
Figure 16.13 - Mine Sequencing Results – Year 5
|
177
|
|
Figure 16.14 - Mine Sequencing Results – Year 8
|
177
|
|
Figure 16.15 - Mine Sequencing Results – Year 11 – Final Pit
|
178
|
|
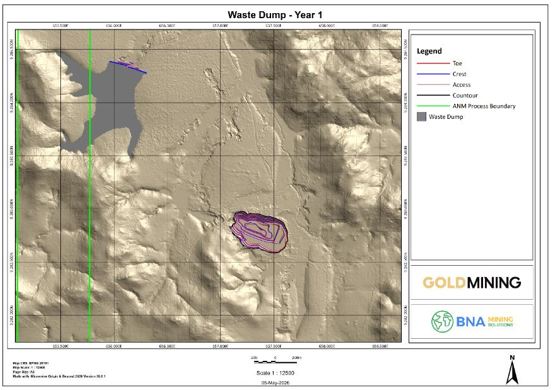
Figure 16.16 – Waste Rock Dump – Year 1
|
180
|
|
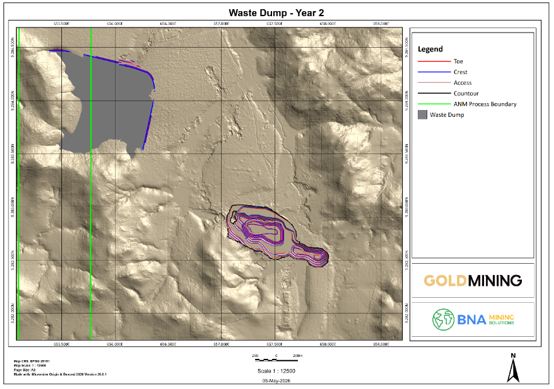
Figure 16.17 – Waste Rock Dump – Year 2
|
180
|
|
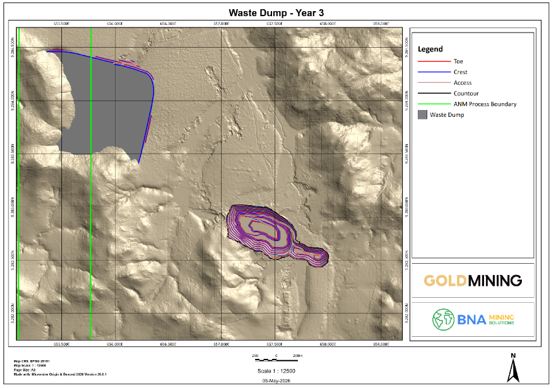
Figure 16.18 – Waste Rock Dump – Year 3
|
181
|
|
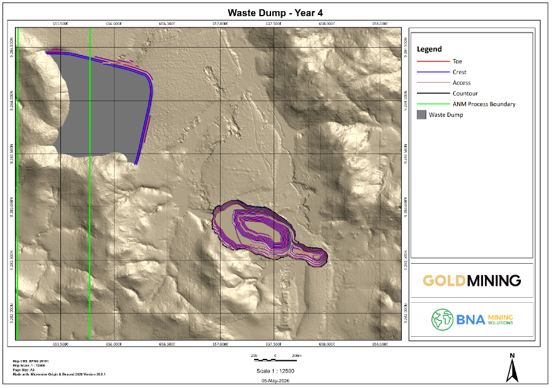
Figure 16.19 – Waste Rock Dump – Year 4
|
181
|
|
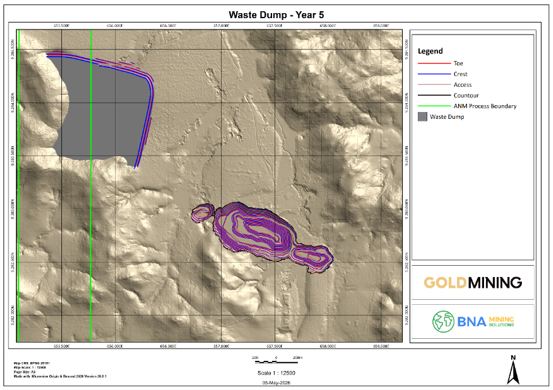
Figure 16.20 – Waste Rock Dump – Year 5
|
182
|
|
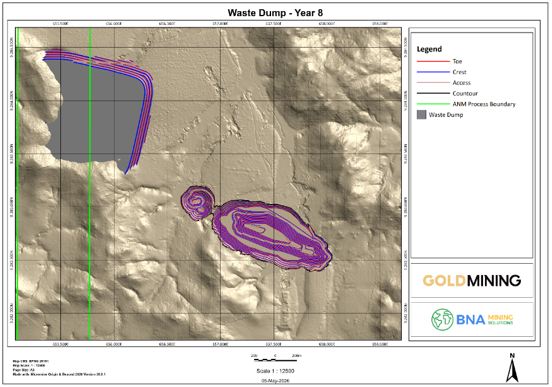
Figure 16.21 – Waste Rock Dump – Year 8
|
182
|
|
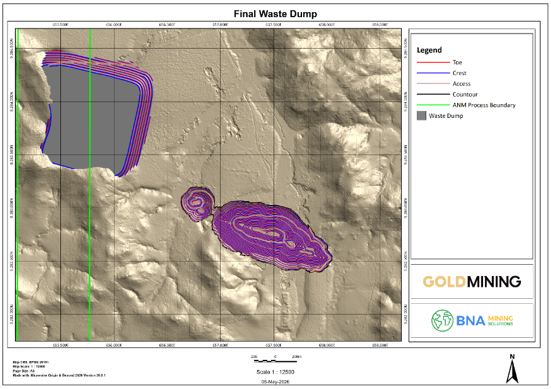
Figure 16.22 – Final Waste Rock Dump
|
183
|
|
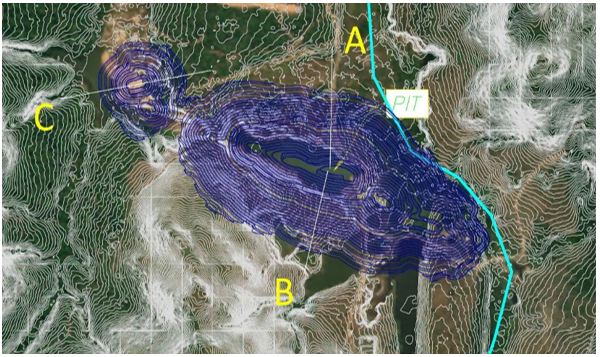
Figure 16.23 - Section Axes Relative to the São Jorge Pit
|
184
|
|
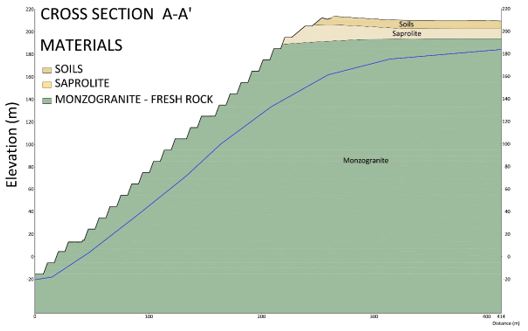
Figure 16.24 – Geological–Geotechnical Cross-Section A–A′
|
184
|
|
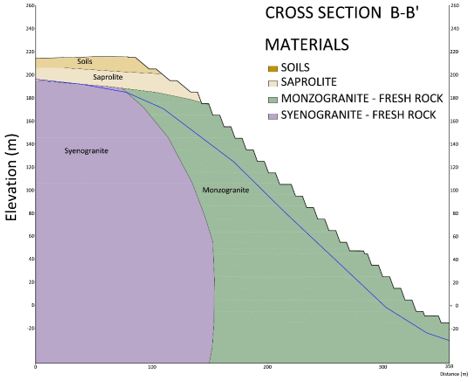
Figure 16.25 – Geological–Geotechnical Cross-Section B–B′
|
185
|
BNA Mining Solutions - R. Des. Leão Starling, 200 - Ouro Preto, BH - MG, 31310-370 – Phone: +55 (31) 2514-8733 – E-mail: info@bnaconsultoria.com
|
GoldMining Inc.
NI 43-101 Report – São Jorge Project
|
Page 19 |
|
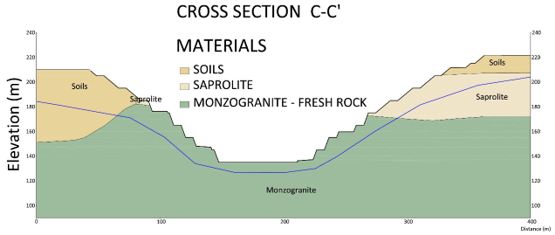
Figure 16.26 - Geological–Geotechnical Cross-Section C–C′
|
185
|
|
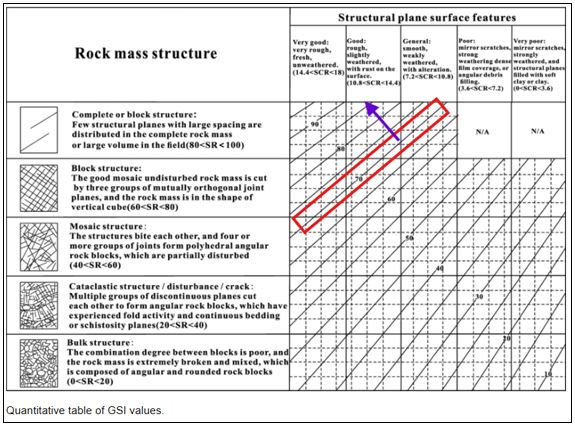
Figure 16.27 - Baseline GSI range, highlighted in red, for the rock mass of the São Jorge deposit. The arrow indicates the trend of improving rock mass quality toward less fractured zones
|
186
|
|
Figure 16.28 - Stability Analysis Results – Section A
|
190
|
|
Figure 16.29 - Stability Analysis Results – Section B
|
190
|
|
Figure 16.30 - Stability Analysis Results – Section C
|
191
|
|
Figure 16.31 - Pit sectorization based on slope geometry. The magenta lines represent the average slope orientation, while the cyan lines indicate the primary sector boundaries.
|
192
|
|
Figure 16.32 - Proposed Instrumentation Plan for the São Jorge Pit
|
195
|
|
Figure 16.33 - Location of Cross-sections A and B on the Waste Rock Dump.
|
197
|
|
Figure 16.34 - Proposed conceptual geological–geotechnical model incorporating a downstream rockfill buttress
|
198
|
|
Figure 16.35 - Instrumentation Plan for the São Jorge Waste Rock Dump
|
200
|
|
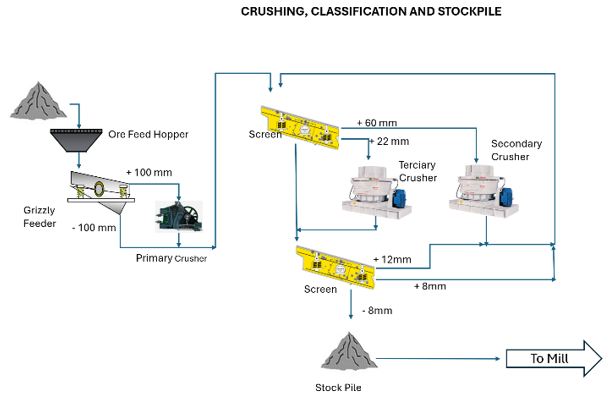
Figure 17.1 - Flowsheet – Crushing, Classification, and Stockpile
|
219
|
|
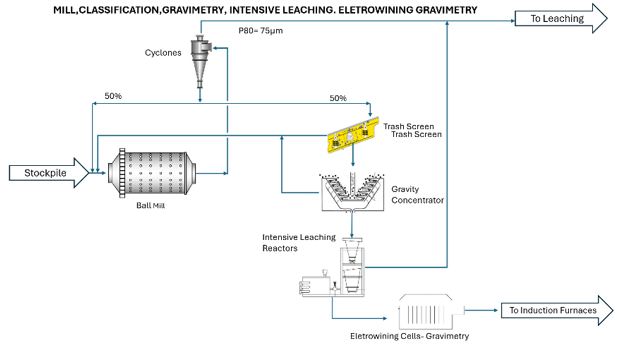
Figure 17.2 - Flowsheet – Grinding, Gravity Recovery, Intensive Leaching, and Electrowinning
|
220
|
|
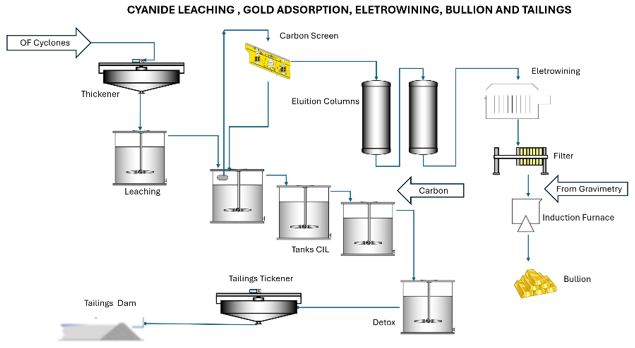
Figure 17.3 - Flowsheet – Cyanide Leaching, Gold Adsorption, Electrowinning, Bullion, and Tailings
|
220
|
|
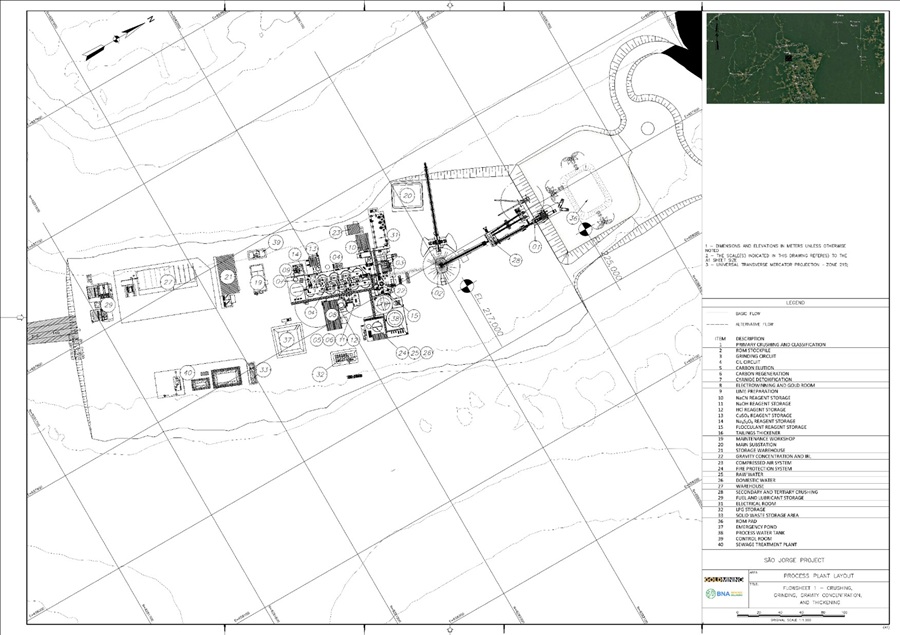
Figure 17.4 - General Layout
|
221
|
|
Figure 18.1 - General Site Layout
|
233
|
|
Figure 18.2 - Geological–Geotechnical Section of the Dam Including Staged Raises
|
240
|
|
Figure 18.3 - Initial investigation plan for foundation characterization
|
244
|
|
Figure 18.4 - Initial Instrumentation Plan
|
245
|
|
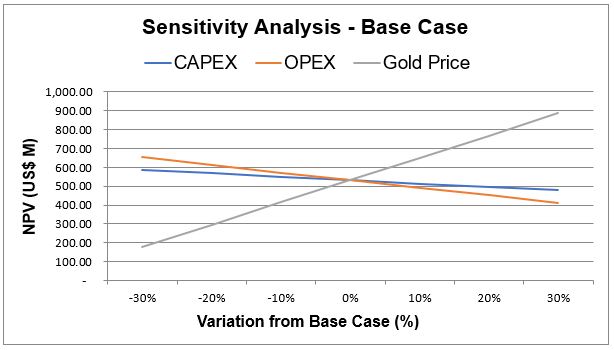
Figure 22.1 - Sensitivity of After-Tax NPV (5%) to Changes in CAPEX, OPEX and Gold Price
|
290
|
|
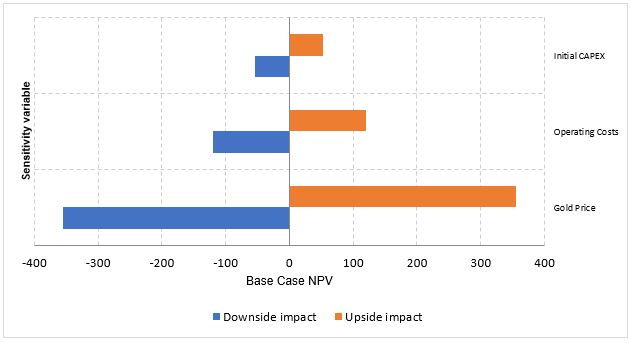
Figure 22.2 - Tornado Chart of After-Tax NPV (5%) Sensitivity
|
292
|
BNA Mining Solutions - R. Des. Leão Starling, 200 - Ouro Preto, BH - MG, 31310-370 – Phone: +55 (31) 2514-8733 – E-mail: info@bnaconsultoria.com
|
GoldMining Inc.
NI 43-101 Report – São Jorge Project
|
Page 20 |
LIST OF TABLES
|
Table 1.1 – Summary of Mineral Resources as at January 28, 2025
|
36
|
|
Table 1.2 - Summary of São Jorge PEA Production Metrics
|
37
|
|
Table 1.3 - Summary of Total Mineralized Material within the Final Operational Pit Shell
|
38
|
|
Table 1.4 - Final Pit Design Parameters
|
38
|
|
Table 1.5 - Mine Schedule Results
|
39
|
|
Table 6.1 - Exploration and Development History, São Jorge Project
|
59
|
|
Table 6.2 - Summary of Historical Mineral Resource Estimates, São Jorge Project
|
61
|
|
Table 10.1 - Summary of drilling completed at the São Jorge Project
|
85
|
|
Table 10.2 - List of significant intersections from the 2024 & 2025 auger drilling program
|
90
|
|
Table 10.3 - Summary of GMI significant intersections in the 2024 and 2025 São Jorge diamond core drilling program
|
95
|
|
Table 10.4 - Summary of GMI significant RC drilling intersections in the 2025 São Jorge drilling program
|
96
|
|
Table 11.1 - List of Certified Reference Materials
|
100
|
|
Table 13.1 - Head Analysis (excluding SJ-MET-01)
|
104
|
|
Table 13.2 - Summary of Gravity Separation Tests
|
105
|
|
Table 13.3 - Summary of Leaching Tests
|
105
|
|
Table 13.4 - Comparison of Metallurgical Test Results
|
105
|
|
Table 13.5 - Chemical Analysis for Sample MET-1
|
108
|
|
Table 13.6 - Gold Analysis for Sample MET-1
|
108
|
|
Table 13.7 - Calculated and Assayed Heads for Sample MET-1 Tests
|
109
|
|
Table 13.8 - Recovery of Gold by Size Fraction for Sample MET-1
|
109
|
|
Table 13.9 - Bond Work Index Values for Selected Samples
|
110
|
|
Table 13.10 - Leach Recovery Without the Use of Gravity Separation – Sample MET-01
|
111
|
BNA Mining Solutions - R. Des. Leão Starling, 200 - Ouro Preto, BH - MG, 31310-370 – Phone: +55 (31) 2514-8733 – E-mail: info@bnaconsultoria.com
|
GoldMining Inc.
NI 43-101 Report – São Jorge Project
|
Page 21 |
|
Table 13.11 - Gravity Concentration Before Leaching P80 106 microns
|
112
|
|
Table 13.12 - Gravity Concentration Before Leaching P80 75 microns
|
112
|
|
Table 13.13 - Leach Recovery Rates of the Gravity Tails from Sample MET-01
|
113
|
|
Table 13.14 - Calculated Overall Recoveries from Gravity and Leaching- Sample Met-01
|
113
|
|
Table 14.1 - Summary of Mineral Resources as at January 28, 2025
|
119
|
|
Table 14.2 - Summary of the Drill Hole Database as of December 31, 2024
|
120
|
|
Table 14.3 - Descriptive Statistics of the Uncapped and Capped Gold Grades
|
125
|
|
Table 14.4 - Descriptive Statistics of the Uncapped and Capped Composite Samples
|
127
|
|
Table 14.5 - Summary of Bulk Densities
|
128
|
|
Table 14.6 - Summary of Variogram Parameters, Domain 201
|
133
|
|
Table 14.7 - Block Model Definition
|
133
|
|
Table 14.8 - Listing of Block Model Attributes
|
134
|
|
Table 14.9 - Summary of Search Strategies and Grade Interpolation Parameters
|
135
|
|
Table 14.10 - Comparison of Three Dimensional De-clustered Mean Grades with Estimated Block Model Grades
|
141
|
|
Table 14.11 - Mineral Resources as at January 28, 2025
|
148
|
|
Table 14.12 - Mineral Resources as at January 28, 2025 by Material Type
|
149
|
|
Table 14.13 - Sensitivity Analysis for Selected Pit Shells
|
150
|
|
Table 16.1 - Final Pit Design Parameters
|
160
|
|
Table 16.2 - Final Waste Dump Parameters
|
160
|
|
Table 16.3 - Technical and Economic Parameters Used for Final Pit Optimization
|
161
|
|
Table 16.4 - Final Pit Optimization Results
|
164
|
|
Table 16.5 - Final Pit Design Parameters
|
168
|
|
Table 16.6 - Final Operational Pit Results
|
169
|
|
Table 16.7 - Mine Schedule Results
|
173
|
BNA Mining Solutions - R. Des. Leão Starling, 200 - Ouro Preto, BH - MG, 31310-370 – Phone: +55 (31) 2514-8733 – E-mail: info@bnaconsultoria.com
|
GoldMining Inc.
NI 43-101 Report – São Jorge Project
|
Page 22 |
|
Table 16.8 - Waste Rock Dump Design Parameters
|
179
|
|
Table 16.9 - Waste Rock Volumes by Period
|
179
|
|
Table 16.10 - Parameterization of the intact granitic rock mass of the São Jorge deposit
|
186
|
|
Table 16.11 - Geotechnical Parameterization of the São Jorge Granitic Rock Mass
|
188
|
|
Table 16.12 - Stability Analysis Results
|
189
|
|
Table 16.13 - Geometric Sector Definition
|
192
|
|
Table 16.14 - Results of Probabilistic Kinematic Assessment (blue: no potential; red: potential for failure)
|
193
|
|
Table 16.15 - Results of Probabilistic Kinematic Assessment (blue: no potential; red: potential for failure)
|
194
|
|
Table 16.16 - Installation Specifications for Proposed Pit Instrumentation
|
195
|
|
Table 16.17 - Geotechnical Parameters for São Jorge Waste Rock Dump Materials
|
198
|
|
Table 16.18 - Stability Analysis Results for the São Jorge Waste Rock Dump
|
199
|
|
Table 16.19 - Estimation of Average Haul Distances
|
204
|
|
Table 16.20 - Blasting Pattern Parameters
|
205
|
|
Table 16.21 - Basic Project Parameters
|
207
|
|
Table 16.22 - Drill Rig Sizing for Mineralized Material
|
210
|
|
Table 16.23 - Drill Rig Sizing for Waste
|
211
|
|
Table 16.24 - Hydraulic Excavator Sizing for Mineralized Material and Waste
|
212
|
|
Table 16.25 - Truck Sizing for Mineralized Material and Waste
|
213
|
|
Table 16.26 - Crawler Dozer for Stockpile and Waste
|
214
|
|
Table 16.27 - Mining Fleet Sizing Summary
|
215
|
|
Table 16.28 - Personnel Requirements for Mine Operations
|
216
|
|
Table 17.1 - Process Design Criteria – General
|
218
|
|
Table 17.2 - Process Design – Unit Operations
|
218
|
BNA Mining Solutions - R. Des. Leão Starling, 200 - Ouro Preto, BH - MG, 31310-370 – Phone: +55 (31) 2514-8733 – E-mail: info@bnaconsultoria.com
|
GoldMining Inc.
NI 43-101 Report – São Jorge Project
|
Page 23 |
|
Table 17.3 - Power Requirements
|
229
|
|
Table 17.4 - Reagents – Average
|
230
|
|
Table 17.5 - Consumables – Average
|
230
|
|
Table 17.6 - Process Plant Workforce
|
231
|
|
Table 18.1 – Evolution of Costs Throughout the Construction of the Dam.
|
241
|
|
Table 18.2 - Safety factor summary.
|
243
|
|
Table 18.3 - Estimated Administration, Maintenance, Quality Control and Support Personnel Requirements
|
247
|
|
Table 21.1 - Summary of Initial Capital Cost Estimate
|
253
|
|
Table 21.2 - Preliminary Initial Capital
|
254
|
|
Table 21.3 - Initial Investment in Mining Equipment
|
254
|
|
Table 21.4 - Estimated Pre-Production Mining Capital Costs
|
255
|
|
Table 21.5 - Estimated Capital Costs for the Process Plant and Initial Tailings Storage Facility Construction
|
256
|
|
Table 21.6 - Estimated Capital Costs for Site Infrastructure
|
257
|
|
Table 21.7 - Estimated Capital Costs for Power Supply, Electrical Distribution and Automation Infrastructure
|
258
|
|
Table 21.8 - Estimated Capital Costs for Water Management Infrastructure
|
258
|
|
Table 21.9 - Estimated Capital Costs for General and Engineering Services
|
259
|
|
Table 21.10 - Estimated Indirect Costs, Owner's Costs and Contingency Allowances
|
259
|
|
Table 21.11 - Estimated Mine Closure Costs by Year
|
260
|
|
Table 21.12 - Estimated Life of Mine Sustaining Capital Expenditures by Year
|
262
|
|
Table 21.13 - Summary of Annual Operating Costs
|
264
|
|
Table 21.14 - Mining Operating Costs
|
266
|
|
Table 21.15 - Mining Personnel Costs
|
268
|
|
Table 21.16 - Estimated Drilling Consumables Consumption
|
269
|
BNA Mining Solutions - R. Des. Leão Starling, 200 - Ouro Preto, BH - MG, 31310-370 – Phone: +55 (31) 2514-8733 – E-mail: info@bnaconsultoria.com
|
GoldMining Inc.
NI 43-101 Report – São Jorge Project
|
Page 24 |
|
Table 21.17 - Estimated Drilling Consumables Costs
|
270
|
|
Table 21.18 - Estimated Explosives and Blasting Accessories Consumption
|
271
|
|
Table 21.19 - Estimated Explosives and Blasting Accessories Costs
|
271
|
|
Table 21.20 - Fuel and Lubricant Consumption
|
272
|
|
Table 21.21 - Fuel and Lubricant Costs
|
272
|
|
Table 21.22 - Maintenance Parts and Materials Costs
|
273
|
|
Table 21.23 - Estimated Tire Consumption
|
274
|
|
Table 21.24 - Estimated Tire Costs
|
274
|
|
Table 21.25 - Estimated Annual Processing Operating Costs
|
275
|
|
Table 21.26 - Process Plant Personnel Costs
|
276
|
|
Table 21.27 - Estimated Annual Power Consumption and Power Costs
|
276
|
|
Table 21.28 - Estimated Annual Reagent and Grinding Media Costs
|
277
|
|
Table 21.29 - Estimated Annual Maintenance and Other Process Plant Operating Costs
|
277
|
|
Table 21.30 - Estimated Annual Administration, Infrastructure Maintenance and Other Operating Costs
|
279
|
|
Table 21.31 - Administration, Maintenance, Quality Control and Camp Personnel Costs
|
280
|
|
Table 22.1 - Annual Production and Cash Flow Forecast
|
286
|
|
Table 22.2 - Sensitivity Analysis of After-Tax NPV (5%) to Variations in CAPEX, OPEX and Gold Price
|
289
|
|
Table 22.3 - Two-Variable Sensitivity of After-Tax NPV (5%): Gold Price versus OPEX (US$ million)
|
291
|
BNA Mining Solutions - R. Des. Leão Starling, 200 - Ouro Preto, BH - MG, 31310-370 – Phone: +55 (31) 2514-8733 – E-mail: info@bnaconsultoria.com
|
GoldMining Inc.
NI 43-101 Report – São Jorge Project
|
Page 25 |
|
Table 22.4 - Two-Variable Sensitivity of After-Tax NPV (5%): Gold Price versus Initial CAPEX (US$ million)
|
291
|
|
Table 22.5 - Summary of the Impact of Key Variables on After-Tax NPV (5%)
|
292
|
|
Table 23.1 - Summary of the Tocantinzinho Mine Mineral Reserves as at December 10, 2021
|
294
|
|
Table 23.2 - Summary of the Tocantinzinho Mine Mineral Resources as at December 10, 2021
|
294
|
|
Table 23.3 - Summary of the Cuiú Cuiú Mineral Reserves as at July 23, 2025
|
295
|
|
Table 23.4 - Summary of the Cuiú Cuiú Mineral Resources as at July 23, 2025
|
296
|
|
Table 23.5 - Summary of the Palito and São Chico Mines Mineral Reserves as at July 31, 2023
|
297
|
|
Table 23.6 - Summary of the Palito and São Chico Mines Mineral Resources as of July 31, 2023
|
298
|
|
Table 26.1 - Recommended Work Program and Budget Estimate for Advancement to PFS
|
302
|
BNA Mining Solutions - R. Des. Leão Starling, 200 - Ouro Preto, BH - MG, 31310-370 – Phone: +55 (31) 2514-8733 – E-mail: info@bnaconsultoria.com
|
GoldMining Inc.
NI 43-101 Report – São Jorge Project
|
Page 26 |
ABBREVIATIONS AND ACRONYMS
|
Abbreviation
|
Definition
|
|
AACE
|
Association for the Advancement of Cost Engineering
|
|
ADR
|
Adsorption, Desorption, and Recovery
|
|
ANM
|
Agência Nacional de Mineração / Brazilian National Mining Agency
|
|
AISC
|
All-In Sustaining Cost
|
|
Au
|
Gold
|
|
BGC
|
Brazilian Gold Corporation
|
|
BNA
|
BNA Mining Solutions
|
|
BRL
|
Brazilian Real
|
|
CAPEX
|
Capital Expenditure
|
|
CFEM
|
Compensação Financeira pela Exploração de Recursos Minerais / Brazilian Financial Compensation for the Exploitation of Mineral Resources
|
|
CIL
|
Carbon-in-Leach
|
|
CIM
|
Canadian Institute of Mining, Metallurgy and Petroleum
|
|
COG
|
Cut-off Grade
|
|
CRM
|
Certified Reference Material
|
|
DDH
|
Diamond Drill Hole
|
|
DCF
|
Discounted Cash Flow
|
|
EIA
|
Environmental Impact Assessment
|
|
FS
|
Feasibility Study
|
|
G&A
|
General and Administrative
|
|
GMI
|
GoldMining Inc.
|
|
GPS
|
Global Positioning System
|
|
GRG
|
Gravity Recoverable Gold
|
|
GSI
|
Geological Strength Index
|
|
ILR
|
Intensive Leach Reactor
|
|
IP
|
Induced Polarization
|
|
IRR
|
Internal Rate of Return
|
|
ISO
|
International Organization for Standardization
|
|
LI
|
Licença de Instalação / Installation Licence
|
|
LO
|
Licença de Operação / Operating Licence
|
|
LOM
|
Life of Mine
|
|
LP
|
Licença Prévia / Preliminary Licence
|
|
MRE
|
Mineral Resource Estimate
|
|
NI 43-101
|
National Instrument 43-101 – Standards of Disclosure for Mineral Projects
|
|
NPV
|
Net Present Value
|
|
NSR
|
Net Smelter Return
|
|
OPEX
|
Operating Expenditure
|
|
P80
|
Particle size at which 80% of the material passes
|
|
PAE
|
Plano de Aproveitamento Econômico / Economic Utilization Plan
|
BNA Mining Solutions - R. Des. Leão Starling, 200 - Ouro Preto, BH - MG, 31310-370 – Phone: +55 (31) 2514-8733 – E-mail: info@bnaconsultoria.com
|
GoldMining Inc.
NI 43-101 Report – São Jorge Project
|
Page 27 |
|
PEA
|
Preliminary Economic Assessment
|
|
PFS
|
Pre-Feasibility Study
|
|
QA
|
Quality Assurance
|
|
QA/QC
|
Quality Assurance / Quality Control
|
|
QC
|
Quality Control
|
|
QP
|
Qualified Person
|
|
RAF
|
Revenue Adjustment Factor
|
|
RMR
|
Rock Mass Rating
|
|
ROM
|
Run-of-Mine
|
|
RPEEE
|
Reasonable Prospects for Eventual Economic Extraction
|
|
RQD
|
Rock Quality Designation
|
|
SAG
|
Semi-Autogenous Grinding
|
|
SGS
|
SGS Geosol Laboratórios Ltda.
|
|
SLR
|
SLR Consulting (Canada) Ltd.
|
|
SRM
|
Standard Reference Material
|
|
TFRM-PA
|
Pará State Mining Activity Inspection, Monitoring and Control Fee
|
|
TSF
|
Tailings Storage Facility
|
|
UCS
|
Uniaxial Compressive Strength
|
|
USD
|
United States Dollar
|
|
UTM
|
Universal Transverse Mercator
|
|
WRSF
|
Waste Rock Storage Facility
|
BNA Mining Solutions - R. Des. Leão Starling, 200 - Ouro Preto, BH - MG, 31310-370 – Phone: +55 (31) 2514-8733 – E-mail: info@bnaconsultoria.com
|
GoldMining Inc.
NI 43-101 Report – São Jorge Project
|
Page 28 |
UNITS OF MEASURE
|
Abbreviation
|
Definition
|
|
%
|
Percent
|
|
°
|
Degree
|
|
°C
|
Degree Celsius
|
|
a
|
Annum / year
|
|
g
|
Gram
|
|
g/L
|
Gram per litre
|
|
g/t
|
Gram per tonne
|
|
ha
|
Hectare
|
|
h
|
Hour
|
|
kg
|
Kilogram
|
|
kg/t
|
Kilogram per tonne
|
|
km
|
Kilometre
|
|
km²
|
Square kilometre
|
|
kPa
|
Kilopascal
|
|
kt
|
Thousand tonnes
|
|
kV
|
Kilovolt
|
|
kW
|
Kilowatt
|
|
kWh
|
Kilowatt-hour
|
|
kWh/t
|
Kilowatt-hour per tonne
|
|
L
|
Litre
|
|
m
|
Metre
|
|
m²
|
Square metre
|
|
m³
|
Cubic metre
|
|
M
|
Million
|
|
mm
|
Millimetre
|
|
Moz
|
Million troy ounces
|
|
Mt
|
Million tonnes
|
|
Mtpa
|
Million tonnes per annum
|
|
MW
|
Megawatt
|
|
oz
|
Troy ounce
|
|
ppb
|
Parts per billion
|
|
ppm
|
Parts per million
|
|
t
|
Tonne / metric tonne
|
|
tpd
|
Tonnes per day
|
|
US$
|
United States dollar
|
|
US$/oz
|
United States dollars per troy ounce
|
|
US$/t
|
United States dollars per tonne
|
|
µm
|
Micrometre / micron
|
BNA Mining Solutions - R. Des. Leão Starling, 200 - Ouro Preto, BH - MG, 31310-370 – Phone: +55 (31) 2514-8733 – E-mail: info@bnaconsultoria.com
|
GoldMining Inc.
NI 43-101 Report – São Jorge Project
|
Page 29 |
GoldMining Inc. (“GMI” or the “Company”) retained BNA Mining Solutions (“BNA”) to prepare a Preliminary Economic Assessment (“PEA”) for the São Jorge Gold Project ("São Jorge Project" or the "Project"), located in Pará State, Brazil.
The purpose of this PEA is to evaluate the potential economic viability of developing the São Jorge Project as a conventional open pit mining operation with on-site processing of mineralized material and production of gold doré.
The PEA is preliminary in nature and includes Inferred Mineral Resources, which are considered too speculative geologically to have the economic considerations applied to them that would enable them to be categorized as Mineral Reserves. No Mineral Reserves have been declared for the São Jorge Project. Mineral Resources that are not Mineral Reserves and do not have demonstrated economic viability. There is no certainty that the results of this PEA will be realized.
The PEA is based on a conventional open pit, truck and shovel mining operation, with mineralized material processed through a conventional gravity concentration and gold leaching process plant. The process plant is designed for a nominal throughput rate of approximately 5,500 tonnes per day, equivalent to approximately 2.0 Mtpa.
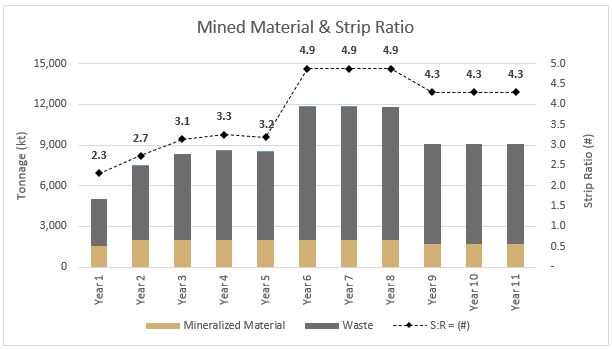
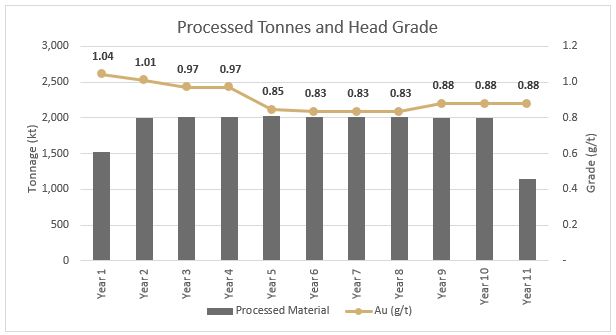
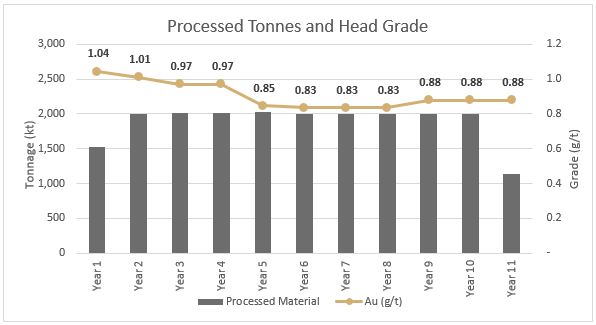
The Project demonstrates positive economics under the assumptions adopted in this PEA, supported by a 10.6 year mine life, total processed material of approximately 20.7 Mt, an average strip ratio of 4.27, an average gold metallurgical recovery of 90.0%, and total gold production of approximately 543.2 koz.
The estimate presented in this report has been prepared in accordance with the Canadian Institute of Mining, Metallurgy and Petroleum (“CIM”) Definition Standards for Mineral Resources and Mineral Reserves (May 10, 2014), as incorporated by reference in NI 43-101 (https://mrmr.cim.org/media/1128/cim-definition-standards_2014.pdf).
|
1.2
|
Property Description and Location
|
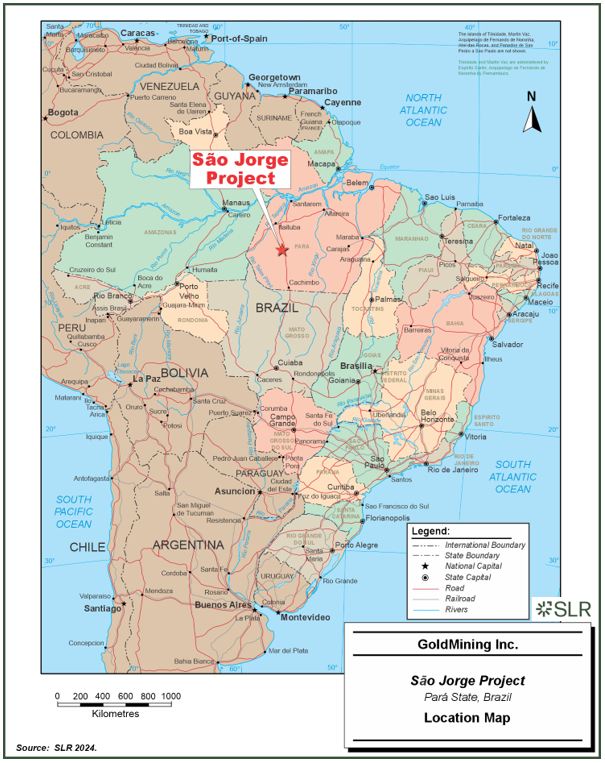
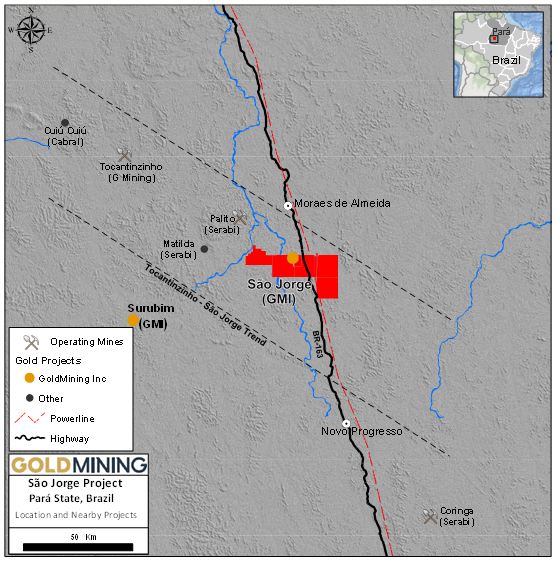
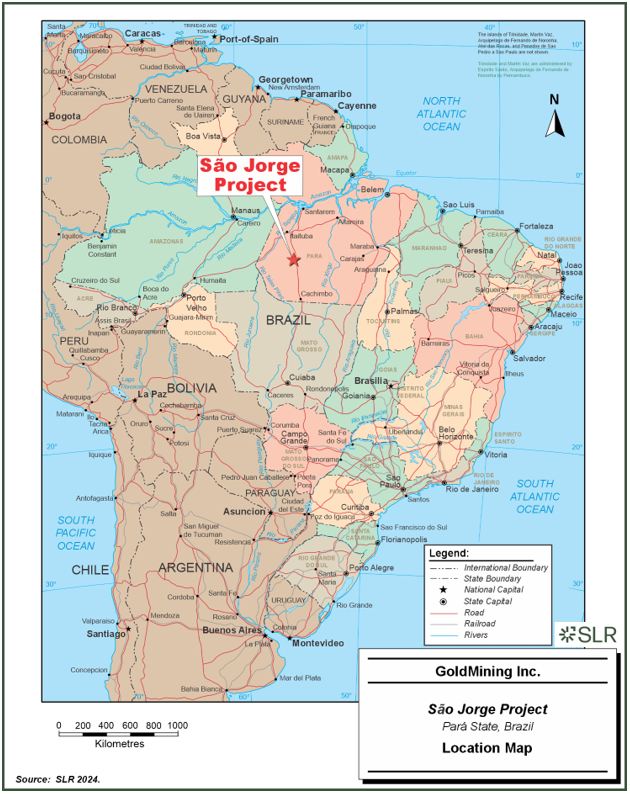
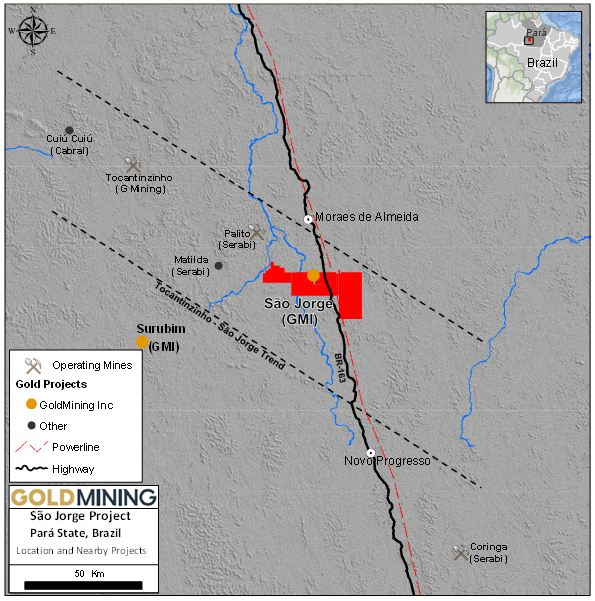
The São Jorge Project (the “Project”) is located in the Tapajós Mineral Province, in the State of Pará, Brazil, within the municipality of Novo Progresso (Figure 1.1 to Figure 1.3).
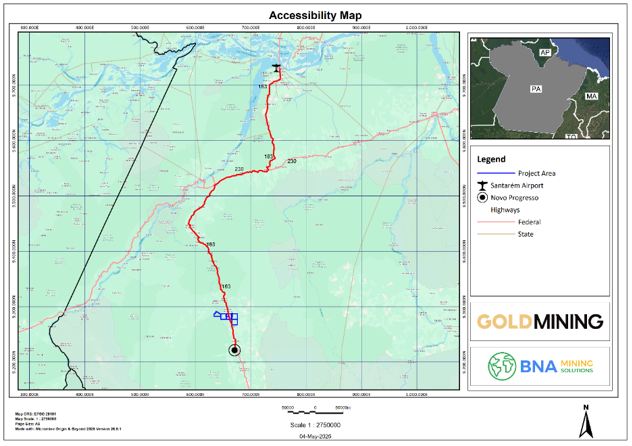
The Project is situated approximately 70 km north of the town of Novo Progresso and is accessible via the BR-163 highway, followed by secondary unpaved roads leading to the Project site.
The Project is centred approximately at latitude 6°29’14” S and longitude 55°34’38” W, corresponding to UTM coordinates of approximately 657,400 mE and 9,282,750 mN (SAD69, Zone 21S).
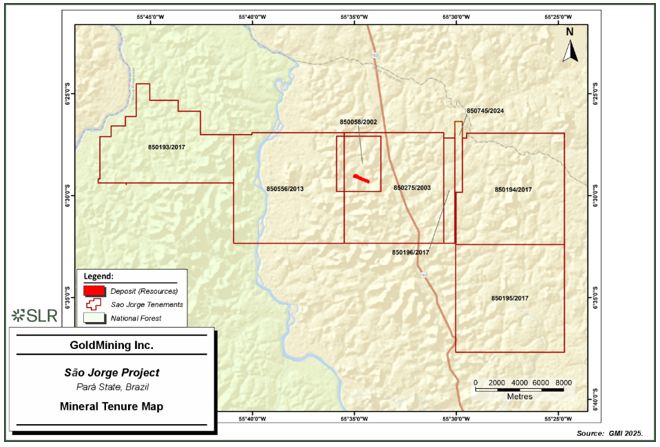
The Project area consist of multiple contiguous tenements covering approximately 46,485 hectares.
BNA Mining Solutions - R. Des. Leão Starling, 200 - Ouro Preto, BH - MG, 31310-370 – Phone: +55 (31) 2514-8733 – E-mail: info@bnaconsultoria.com
|
GoldMining Inc.
NI 43-101 Report – São Jorge Project
|
Page 30 |
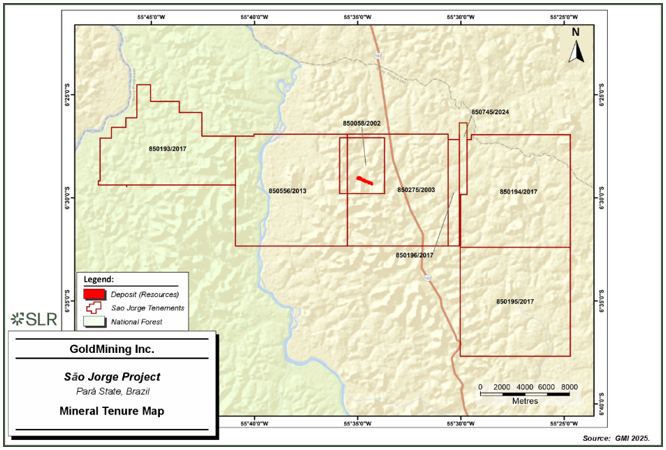
The São Jorge deposit is situated on the mineral tenure No. 850.058/2002 and covers an area of 1,660.56 hectares. This mineral tenure is also referred to as the “São Jorge Claim”.
Figure 1.1 - Location Map of the Project
BNA Mining Solutions - R. Des. Leão Starling, 200 - Ouro Preto, BH - MG, 31310-370 – Phone: +55 (31) 2514-8733 – E-mail: info@bnaconsultoria.com
|
GoldMining Inc.
NI 43-101 Report – São Jorge Project
|
Page 31 |
Figure 1.2 - São Jorge Project location
BNA Mining Solutions - R. Des. Leão Starling, 200 - Ouro Preto, BH - MG, 31310-370 – Phone: +55 (31) 2514-8733 – E-mail: info@bnaconsultoria.com
|
GoldMining Inc.
NI 43-101 Report – São Jorge Project
|
Page 32 |
Figure 1.3 - São Jorge deposit location (situated on the São Jorge Claim)
|
1.3
|
Permit Status and Ownership
|
The São Jorge Project is located in the State of Pará, Brazil, and is held under Mineral Process No. 850.058/2002, administered by the Brazilian National Mining Agency (Agência Nacional de Mineração – “ANM”).
The property is currently in the application stage for a mining concession (Requerimento de Lavra) under Brazilian mining regulations. The Final Exploration Report was approved by the ANM on October 30, 2023, and the application for a mining concession was filed on October 29, 2024.
Based on the information provided by GMI, the mineral tenure is considered to be in good standing.
BNA Mining Solutions - R. Des. Leão Starling, 200 - Ouro Preto, BH - MG, 31310-370 – Phone: +55 (31) 2514-8733 – E-mail: info@bnaconsultoria.com
|
GoldMining Inc.
NI 43-101 Report – São Jorge Project
|
Page 33 |
Environmental permitting for the Project is at an early stage, and additional studies and regulatory approvals will be required prior to any potential development.
The authors have not independently verified the legal status of the mineral tenure and have relied on information provided by GMI.
|
1.4
|
Geology and Mineralization
|
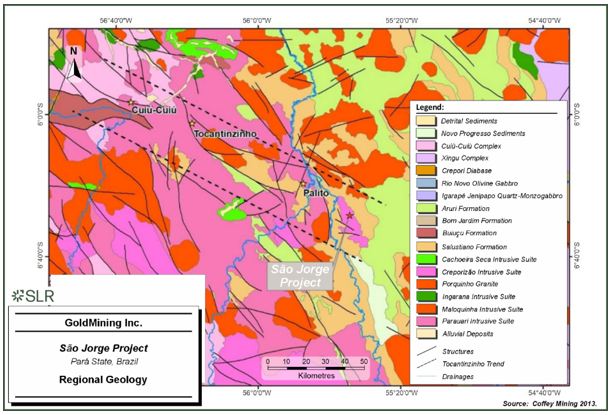
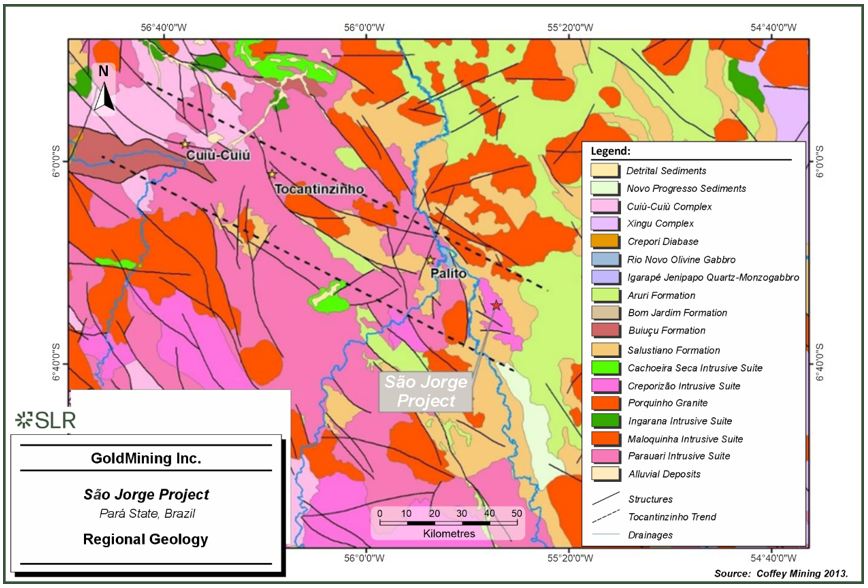
The São Jorge Project is located within the Tapajós Mineral Province, in the southern portion of the Amazonian Craton, a region known for significant Paleoproterozoic gold mineralization associated with granitoid intrusions and hydrothermal systems, Figure 1.4.
Figure 1.4 - Regional Geology
Source: São Jorge Technical Report (February 26, 2025).
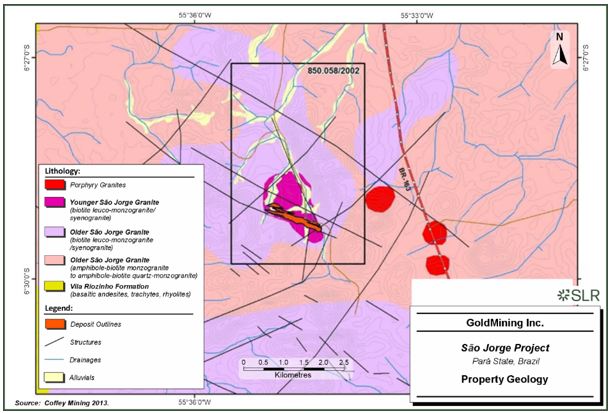
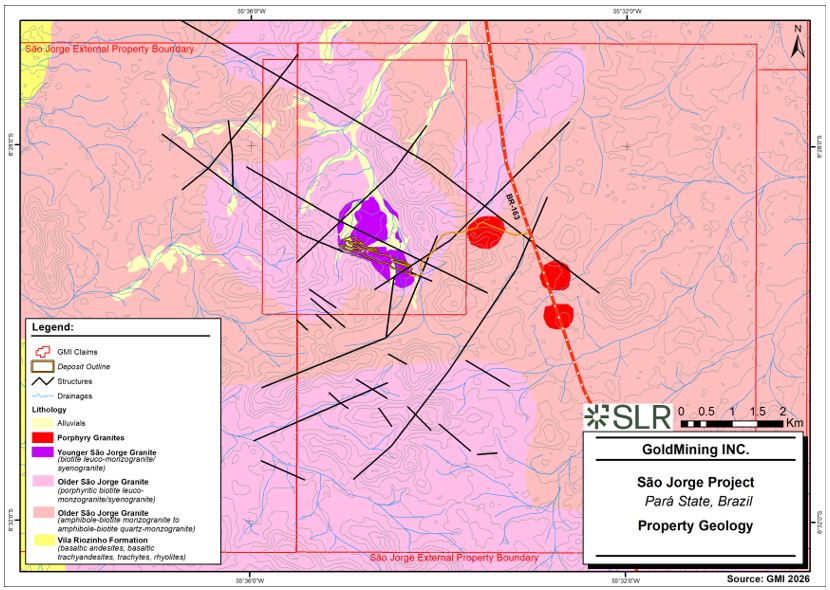
At the Project scale, the geology is dominated by granitoid rocks, primarily monzogranite, locally affected by hydrothermal alteration including silicification, sericitization, and chloritization, Figure 1.5.
BNA Mining Solutions - R. Des. Leão Starling, 200 - Ouro Preto, BH - MG, 31310-370 – Phone: +55 (31) 2514-8733 – E-mail: info@bnaconsultoria.com
|
GoldMining Inc.
NI 43-101 Report – São Jorge Project
|
Page 34 |
Figure 1.5 - Property Geology
Source: São Jorge Technical Report (February 26, 2025).
Gold mineralization is structurally controlled and occurs as disseminated sulfides and quartz vein systems associated with alteration zones within the host rocks.
The mineralized system extends over approximately 1.4 km along strike, with an average thickness of approximately 160 m and vertical continuity exceeding 300 m. The mineralization remains open at depth.
|
1.5
|
Exploration and Drilling
|
Exploration activities at the São Jorge Project have been conducted by previous operators and have included geological mapping, geochemical sampling, geophysical surveys, and drilling programs.
Geochemical programs included soil sampling and other surface sampling methods, which contributed to the identification and delineation of anomalous zones. Geophysical surveys, including induced polarization (“IP”), supported target definition and geological interpretation.
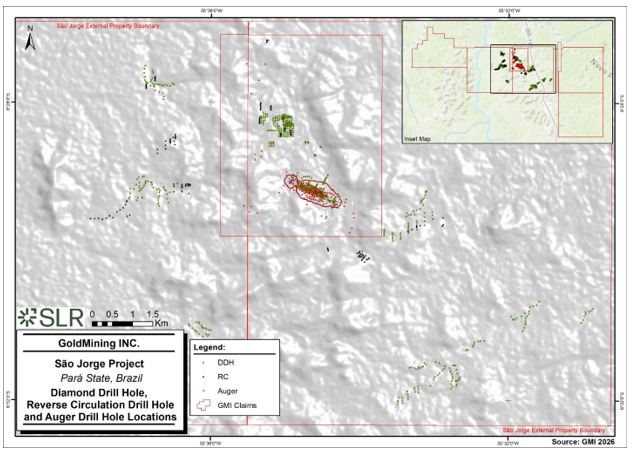
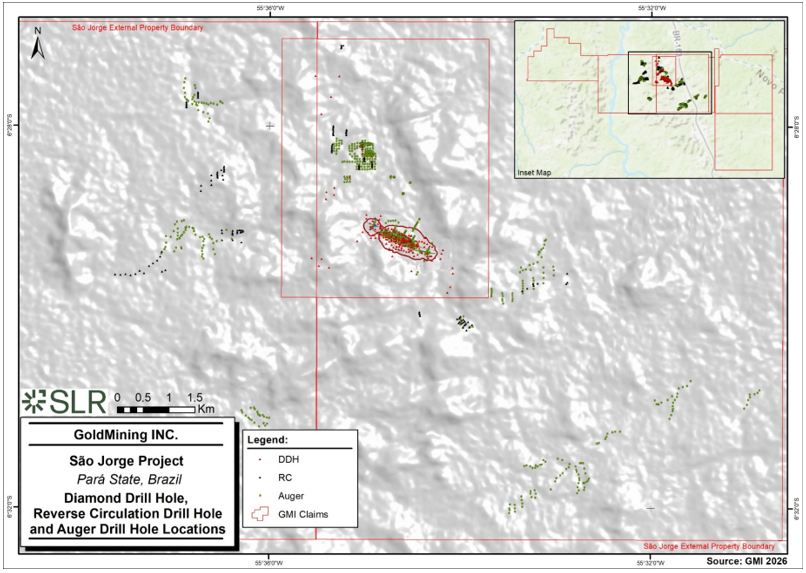
As of June 9, 2026 (Effective Date of the Technical Report), a total of 934 drill holes has been completed on the property totalling 55,974 m in length (Figure 1.6).
BNA Mining Solutions - R. Des. Leão Starling, 200 - Ouro Preto, BH - MG, 31310-370 – Phone: +55 (31) 2514-8733 – E-mail: info@bnaconsultoria.com
|
GoldMining Inc.
NI 43-101 Report – São Jorge Project
|
Page 35 |
Figure 1.6 - Diamond Drill Hole and Auger Drill Hole Locations
Drill core was logged for lithology, alteration, mineralization, and structural features. Based on the available information, the drilling database is considered adequate to support the current geological interpretation and Mineral Resource estimate.
The information presented in this section is based on data and reports provided by GMI.
|
1.6
|
Mineral Processing and Metallurgical Testing
|
Historical metallurgical test work completed for the São Jorge Project indicates that the mineralization is amenable to conventional gravity concentration and gold leaching processes. Metallurgical programs conducted between 2006 and 2013 included mineralogical characterization, comminution testing, gravity recovery testing, bottle-roll leaching, kinetic leaching curves, cyanide optimization tests, and preliminary variability assessments for oxide and sulphide ores.
Test work results demonstrated favourable gold recoveries using conventional processing methods. Combined gravity and carbon in leach (“CIL”) recoveries generally ranged from approximately 90% to 94%, with some tests achieving recoveries above 95% for sulphide material at finer grind sizes. Gravity recoverable gold (“GRG”) results indicated partial free gold liberation, supporting the inclusion of a gravity recovery stage in the conceptual process flowsheet.
BNA Mining Solutions - R. Des. Leão Starling, 200 - Ouro Preto, BH - MG, 31310-370 – Phone: +55 (31) 2514-8733 – E-mail: info@bnaconsultoria.com
|
GoldMining Inc.
NI 43-101 Report – São Jorge Project
|
Page 36 |
Comminution testing classified the material as medium to hard, with Bond Ball Mill Work Index values generally ranging from approximately 13.7 to 15.7 kWh/t. Metallurgical testing indicated that grind sizes near P80 of 75 µm provided the most consistent overall recoveries.
The conceptual process route considered for this PEA includes crushing, grinding, gravity concentration, carbon in leach cyanidation, gold recovery and refining, and conventional tailings disposal.
Additional metallurgical investigations are recommended for future project phases, including variability testing, mineralogical studies, comminution optimization, flotation testing, reagent optimization, pilot plant testing, and additional tailings characterization. The metallurgical assumptions adopted in this PEA are based on historical testing and remain subject to confirmation during future Pre-Feasibility Study (“PFS”) and Feasibility Study (“FS”) phases.
|
1.7
|
Mineral Resource Estimate
|
A Mineral Resource Estimate was based upon the conceptual view that the mineralized material would be extracted by means of an open pit mine at an envisioned production rate of between 5,000 tpd and 15,000 tpd. The material would then be processed at an on-site facility where gold would be recovered using a cyanide leaching flowsheet.
Open pit Mineral Resources at a break-even cut-off grade of 0.27 g/t Au are estimated to total 19,418,000 t at an average grade of 1.00 g/t Au containing approximately 624 thousand ounces (“koz”) Au in the Indicated Resource category. An additional 5,557,000 t at an average grade of 0.72 g/t Au containing approximately 129 koz Au are estimated to be present in the Inferred Mineral Resource category.
The Mineral Resource Estimate for the São Jorge Project is summarized in Table 1.1.
Table 1.1 – Summary of Mineral Resources as at January 28, 2025
|
Category
|
Tonnage
(000 t)
|
Grade
(g/t Au)
|
Contained Metal
(000 oz Au)
|
|
Indicated
|
19,418
|
1.00
|
624
|
|
Inferred
|
5,557
|
0.72
|
129
|
Notes:
| |
1.
|
CIM (2014) definitions were followed for Mineral Resources.
|
| |
2.
|
Mineral Resources are estimated at a breakeven cut-off grade of 0.27 g/t Au for classified blocks above a constraining pit shell.
|
| |
3.
|
Mineral Resources are estimated using a long-term gold price of US$ 1,950 per ounce.
|
| |
4.
|
A minimum mining width of five meters was used.
|
| |
5.
|
There are no Mineral Reserves estimated at the São Jorge Project. Mineral Resources that are not Mineral Reserves do not have demonstrated economic viability.
|
| |
6.
|
Numbers may not add due to rounding.
|
Mineral Resources that are not Mineral Reserves and do not have demonstrated economic viability.
BNA Mining Solutions - R. Des. Leão Starling, 200 - Ouro Preto, BH - MG, 31310-370 – Phone: +55 (31) 2514-8733 – E-mail: info@bnaconsultoria.com
|
GoldMining Inc.
NI 43-101 Report – São Jorge Project
|
Page 37 |
|
1.8
|
Mineral Reserve Estimate
|
There are currently no Mineral Reserves estimated for the São Jorge Project.
The mine plan developed for this PEA is based on Mineral Resources and does not constitute Mineral Reserves.
|
1.9
|
PEA Production Metrics
|
The PEA mine plan is based on a conceptual open pit mining operation developed to evaluate the potential economic viability of the São Jorge Project.
The mine plan contemplates a 10.6 year mine life and the processing of approximately 20.7 Mt of mineralized material. Total mined material is estimated at approximately 109.1 Mt, resulting in a life of mine strip ratio of approximately 4.27:1.
The process plant is designed for a nominal processing rate of approximately 5,500 tpd, equivalent to approximately 2.0 Mtpa. The average gold feed grade is estimated at 0.91 g/t Au, with an average metallurgical recovery of 90.0%.
The main PEA production metrics are summarized in Table 1.2.
Table 1.2 - Summary of São Jorge PEA Production Metrics
|
São Jorge PEA Key Metrics
|
|
Production
|
Result
|
Units
|
|
Mine life
|
10.6
|
Years
|
|
LOM Strip ratio (waste: processed material)
|
4.27
|
Ratio
|
|
Total mined material
|
109.1
|
Mt
|
|
Total processed material
|
20.7
|
Mt
|
|
Nominal process plant rate
|
5,500
|
tpd
|
|
Gold Production
|
|
|
|
Average gold feed grade
|
0.91
|
g/t
|
|
Average gold metallurgical recovery
|
90.0
|
%
|
|
Total gold produced
|
543.2
|
koz
|
|
Average annual gold production (Years 1-5)
|
53.4
|
koz
|
|
LOM average
|
51.2
|
koz
|
The PEA forecasts total gold production of approximately 543.2 koz over the life of mine (“LOM”). Average annual gold production is estimated at approximately 51.2 koz over the LOM, with average annual production of approximately 53.4 koz during the first five years.
BNA Mining Solutions - R. Des. Leão Starling, 200 - Ouro Preto, BH - MG, 31310-370 – Phone: +55 (31) 2514-8733 – E-mail: info@bnaconsultoria.com
|
GoldMining Inc.
NI 43-101 Report – São Jorge Project
|
Page 38 |
The São Jorge Project is planned as a conventional open pit mining operation comprised of drill and blast, load and haul activities. Mine planning and pit optimization were completed using economic, operational, and geotechnical parameters considered appropriate for a PEA level study.
For the purposes of this PEA, the term “mineralized material” is used to describe material contained within the conceptual mine plan derived from the Mineral Resource estimate and scheduled for processing. The term does not imply the existence of Mineral Reserves or economically mineable mineralized material as defined under NI 43-101.
The selected final pit shell was based on a Revenue Adjustment Factor (“RAF”) analysis, with the RAF 0.75 pit shell selected as the basis for the final pit design, and reflects a balance between economic extraction and practical mining conditions. The final pit optimization results, including total material movement, mineralized material tonnage, strip ratio, average in situ grade, and contained gold, are summarized in Table 1.3.
Table 1.3 - Summary of Total Mineralized Material within the Final Operational Pit Shell
|
Mt
|
g/t
|
g/t
|
x103
|
Strip Ratio
|
|
Total
Mineralized
Material 1
|
Total Waste
|
Au Indicated
Mineralized
Material
(Diluted)
|
Au Inferred
Mineralized
Material
(Diluted)
|
Au Total
(Diluted)
|
Ounces
Produced
|
|
20.7
|
88.4
|
0.95
|
0.67
|
0.91
|
543.25
|
4.27
|
The final pit design incorporates recommended geotechnical parameters, including bench geometry, berm configuration, haul road dimensions, and overall slope angles suitable for long term operational stability. The principal open pit design criteria adopted for this study are presented in Table 1.4. A plan view of the final open pit layout is presented in Figure 1.7.
Table 1.4 - Final Pit Design Parameters
|
Operational Parameters
|
|
Parameter
|
|
Value
|
|
Bench Height
|
meters
|
10.00
|
|
Minimum Berm Width
|
meters
|
6.00
|
|
Road Width
|
meters
|
12.00
|
|
Road Gradient
|
%
|
10.00
|
|
Overall Slope Angle - Saprolite
|
degrees
|
29.17
|
|
Overall Slope Angle - Fresh Rock
|
degrees
|
46.01
|
|
Bench Face Angle - Saprolite
|
degrees
|
40.00
|
|
Bench Face Angle - Fresh Rock
|
degrees
|
70.00
|
1 “Mineralized Material” refers to potentially mineable material derived from pit design and does not constitute Mineral Reserves. Mineral Reserves have not been defined.
BNA Mining Solutions - R. Des. Leão Starling, 200 - Ouro Preto, BH - MG, 31310-370 – Phone: +55 (31) 2514-8733 – E-mail: info@bnaconsultoria.com
|
GoldMining Inc.
NI 43-101 Report – São Jorge Project
|
Page 39 |
Figure 1.7 - Final Pit Design
The proposed mining sequence was developed to support the process plant feed requirements over the life of mine while considering operational access, waste stripping requirements, and mineralized material selectivity. Opportunities for low grade stockpiling during the early years of operation were also identified as a potential strategy to improve project cash flow and operational flexibility. The life of mine mining sequence and production schedule is summarized in Table 1.5, Figure 1.8 and Figure 1.9 respectively.
Table 1.5 - Mine Schedule Results
|
MINING PLAN RESULTS
|
| |
Mt
|
g/t
|
x103
|
Strip Ratio
|
|
Period
|
Total
Mineralized
Material
|
Total Waste
|
Au Total
(Diluted)
|
Ounces
Produced
|
|
Year 1
|
1.52
|
3.85
|
1.04
|
43.79
|
2.52
|
|
Year 2
|
2.00
|
6.45
|
1.01
|
55.71
|
3.23
|
|
Year 3
|
2.01
|
7.37
|
0.97
|
53.87
|
3.66
|
|
Year 4
|
2.01
|
7.55
|
0.97
|
53.82
|
3.75
|
|
Year 5
|
2.02
|
7.41
|
0.85
|
47.12
|
3.67
|
|
Year 6 to 8
|
6.02
|
31.55
|
0.83
|
138.42
|
5.24
|
|
Year 8 to 11 (Final Pit)
|
5.14
|
24.23
|
0.88
|
124.64
|
4.71
|
BNA Mining Solutions - R. Des. Leão Starling, 200 - Ouro Preto, BH - MG, 31310-370 – Phone: +55 (31) 2514-8733 – E-mail: info@bnaconsultoria.com
|
GoldMining Inc.
NI 43-101 Report – São Jorge Project
|
Page 40 |
Figure 1.8 - Mined Material Schedule
Figure 1.9 - Process Schedule
Mining operations are expected to be carried out using a conventional owner operated mining fleet composed of hydraulic excavators, haul trucks, production drills, bulldozers, and auxiliary equipment.
The mine design, production schedule, and operating assumptions presented in this section are preliminary in nature and remain subject to further refinement during future PFS and / or FS level studies.
BNA Mining Solutions - R. Des. Leão Starling, 200 - Ouro Preto, BH - MG, 31310-370 – Phone: +55 (31) 2514-8733 – E-mail: info@bnaconsultoria.com
|
GoldMining Inc.
NI 43-101 Report – São Jorge Project
|
Page 41 |
1.11 Recovery Methods
The São Jorge process plant is designed to treat mineralized material using conventional processing methods, including crushing, grinding, gravity concentration, cyanide leaching, CIL, gold adsorption, carbon elution, and gold recovery circuits.
The process route is based on metallurgical test work completed for the Project and assumes an overall gold recovery of 90.0% for the PEA.
The process plant is designed for a nominal throughput rate of approximately 5,500 tpd, equivalent to approximately 2.0 Mtpa.
Gold is expected to be produced on site as doré.
1.12 Infrastructure
The PEA includes development of on-site infrastructure required to support mining and processing activities, including haul roads, access roads, process facilities, tailings and waste storage facilities, water management infrastructure, power distribution, camp and administration facilities, maintenance facilities, and other ancillary infrastructure.
Construction is anticipated to occur over approximately two years prior to the commencement of operations.
1.13 Capital Costs
Initial capital expenditure is estimated at US$ 202.2 million, including contingency.
Sustaining capital expenditures over the life of mine are estimated at approximately US$ 53.0 million and include mining equipment additions or replacements and staged expansion of project infrastructure, including tailings and waste management facilities.
Closure costs are estimated at approximately US$ 15.0 million (including $3.0 million contingency).
Total capital expenditure, including initial capital, sustaining capital, and closure costs, is estimated at approximately US$ 267.2 million.
1.14 Operating Costs
Life-of-mine on-site operating costs are estimated to average approximately US$ 30.67/t of material processed. These costs include mining, processing, general and administrative (“G&A”), maintenance, transportation, and refining costs.
BNA Mining Solutions - R. Des. Leão Starling, 200 - Ouro Preto, BH - MG, 31310-370 – Phone: +55 (31) 2514-8733 – E-mail: info@bnaconsultoria.com
|
GoldMining Inc.
NI 43-101 Report – São Jorge Project
|
Page 42 |
The reported on-site operating costs exclude royalties, the Brazilian Financial Compensation for the Exploitation of Mineral Resources (“CFEM”), the Pará State Mining Activity Inspection, Monitoring and Control Fee (“TFRM-PA”), and sustaining capital expenditures.
The estimated life of mine All-In Sustaining Cost (“AISC”), which includes on-site operating costs, sustaining capital, royalties, CFEM, and TFRM-PA charges, is estimated at approximately US$ 1,464 per payable ounce of gold sold.
1.15 Economic Analysis
The economic evaluation was prepared on an ungeared basis and assumes 100% equity financing.
The base case economic analysis was prepared using a long-term gold price assumption of US$ 3,500/oz Au.
Under the base case assumptions, the Project generates a pre-tax Net Present Value (“NPV”), discounted at 5%, of approximately US$ 645.7 million and a pre-tax Internal Rate of Return (“IRR”) of 48.9%.
On an after-tax basis, the Project generates an NPV, discounted at 5%, of approximately US$ 532.5 million and an IRR of 42.4%.
The estimated payback period is approximately 2.83 years on a pre-tax basis, measured from the commencement of commercial production.
In addition to the base case evaluation, a supplementary leverage case was assessed using a gold price assumption of US$ 4,400/oz gold to illustrate the Project's exposure to higher gold prices.
The US$ 4,400/oz Au price was selected on June 9, 2026, based on the 10-day trailing average gold price, rounded down to the nearest hundred dollars, and reflects the prevailing commodity price environment at the time of preparation of this PEA.
The results of the leverage case are presented in Section 22.4.1.
The results demonstrate the potential for the São Jorge Project to generate positive economic returns under the assumptions adopted in this PEA.
1.16 Conclusions and Recommendations
The São Jorge Project demonstrates the potential to support a technically feasible and economically viable open pit gold mining operation based on the assumptions and methodologies adopted in this Preliminary Economic Assessment.
The mine plan developed for this study contemplates a 10.6 year mine life and the processing of approximately 20.7 Mt of mineralized material at an average diluted grade of 0.91 g/t Au. The process plant is designed for a nominal throughput rate of approximately 2.0 Mtpa and an average metallurgical recovery of 90.0%.
BNA Mining Solutions - R. Des. Leão Starling, 200 - Ouro Preto, BH - MG, 31310-370 – Phone: +55 (31) 2514-8733 – E-mail: info@bnaconsultoria.com
|
GoldMining Inc.
NI 43-101 Report – São Jorge Project
|
Page 43 |
The economic evaluation was prepared on an ungeared basis and assumes 100% equity financing. Using a base case gold price of US$ 3,500/oz Au, the Project generates an after-tax NPV, discounted at 5%, of approximately US$ 532 million and an after-tax IRR of 42.3%.
The Project exhibits significant leverage to increases in the gold price. Under a supplementary gold price scenario of US$ 4,400/oz Au, the after-tax NPV, discounted at 5%, increases to approximately US$ 837 million, demonstrating the Project's exposure to favourable market conditions.
The sensitivity analysis indicates that Project economics are most sensitive to changes in the gold price, followed by operating costs and initial capital expenditures.
The PEA is preliminary in nature and includes Inferred Mineral Resources that are considered too speculative geologically to have the economic considerations applied to them that would enable them to be categorized as Mineral Reserves. There is no certainty that the results of the PEA will be realized.
Based on the results of this PEA, the Qualified Persons consider that the São Jorge Project warrants advancement to a Pre-Feasibility Study.
The results of the technical studies completed to date indicate that the Project has the potential to support a conventional open pit mining operation with processing by crushing, grinding, gravity concentration, cyanide leaching, carbon adsorption, and gold recovery by electrowinning.
The Project demonstrates robust economic performance under the base case assumptions and significant upside potential under higher gold price scenarios.
Further technical studies are recommended to reduce project uncertainties and improve the level of confidence in the engineering, cost estimates, and economic assumptions used in this PEA.
The Qualified Persons recommend that additional technical studies be completed to reduce technical uncertainty and support advancement of the Project toward a Pre-Feasibility Study.
The recommended work programs include:
| |
●
|
Continue infill drilling program to upgrade pit constrained Inferred Mineral Resources to Indicated Mineral Resources and also test the deposit continuity at depth.
|
| |
●
|
Complete additional geotechnical investigations to refine pit slope design criteria and review the geometric parameters adopted for pit optimization and operational pit design. Geotechnical investigation should also extend beneath the footprint of all planned infrastructure.
|
| |
●
|
Complete hydrogeological investigations to evaluate the potential interaction between the final pit and the water table. Hydrogeological investigation to extend to the proposed tailings storage and waste rock storage facilities to inform stability determinations and designs.
|
BNA Mining Solutions - R. Des. Leão Starling, 200 - Ouro Preto, BH - MG, 31310-370 – Phone: +55 (31) 2514-8733 – E-mail: info@bnaconsultoria.com
|
GoldMining Inc.
NI 43-101 Report – São Jorge Project
|
Page 44 |
| |
●
|
Complete additional geometallurgical and metallurgical studies to improve understanding of metallurgical variability throughout the deposit.
|
| |
●
|
Continue environmental baseline studies, permitting activities, and stakeholder engagement programs.
|
BNA Mining Solutions - R. Des. Leão Starling, 200 - Ouro Preto, BH - MG, 31310-370 – Phone: +55 (31) 2514-8733 – E-mail: info@bnaconsultoria.com
|
GoldMining Inc.
NI 43-101 Report – São Jorge Project
|
Page 45 |
|
2.1
|
Terms of Reference and Purpose of the Report
|
GoldMining Inc. (“GMI” or the “Company”) commissioned BNA Mining Solutions (“BNA”) to prepare a Technical Report compliant with Canadian National Instrument 43-101 – Standards of Disclosure for Mineral Projects (“NI 43-101”) for the São Jorge Gold Project ("São Jorge Project" or the "Project"), located in the Tapajós Mineral Province, Pará State, Brazil.
The Mineral Resource estimate used in this PEA is based on a previously published NI 43-101 Technical Report (SLR 2025) for the São Jorge Project and has been incorporated without modification for the purposes of this study. The Mineral Resource estimate remains under the responsibility of the original Qualified Person (“QP”), who is a co-author of this report.
The mine plan developed for this PEA represents an economic extraction scenario derived from the Mineral Resource inventory and is reported as a “PEA Mine Plan”. The mine plan includes Indicated and Inferred Mineral Resources and incorporates dilution and mining losses. The results of pit optimization, mine design, and production scheduling are presented as operational outputs, including Run of Mine (“ROM”) material and process plant feed, and are clearly distinguished from the Mineral Resource estimate.
For the purposes of this PEA, the term “mineralized material” is used to describe material contained within the conceptual mine plan derived from the Mineral Resource estimate and scheduled for processing. The term does not imply the existence of Mineral Reserves or economically mineable mineralized material as defined under NI 43-101.
This PEA is preliminary in nature and includes Inferred Mineral Resources that are considered too speculative geologically to have economic considerations applied to them that would enable them to be categorized as Mineral Reserves. There is no certainty that the results of the PEA will be realized.
This Technical Report is intended to provide a technical and economic basis for internal evaluation and potential project advancement. The report may also support public disclosure in accordance with NI 43-101, if required.
Qualified Persons, as defined under NI 43-101, are responsible for the preparation of specific sections of this report. The QP responsible for Mineral Resources retains full responsibility for the Mineral Resource estimate, while other QPs are responsible for mining, processing, and economic analysis.
|
2.2
|
Qualifications of Consultants
|
The Consultants preparing this Technical Report are specialists in the fields of mining engineering, geotechnics, infrastructure, and economic evaluation of mineral projects. The information in this report that relates to mine planning and economic analysis is based on the information provided by the Company and the application of industry-standard methodologies appropriate for a Preliminary Economic Assessment.
BNA Mining Solutions - R. Des. Leão Starling, 200 - Ouro Preto, BH - MG, 31310-370 – Phone: +55 (31) 2514-8733 – E-mail: info@bnaconsultoria.com
|
GoldMining Inc.
NI 43-101 Report – São Jorge Project
|
Page 46 |
This PEA was prepared under the supervision of Dr. Beck Nader, D.Sc., M.Sc., FAIG. Sections related to the Mineral Resource estimate were prepared by Reno Pressacco, M.Sc.(A), P.Geo., FGC.
Dr. Beck Nader, who is a D.Sc. in Mineral Engineering and a Fellow of the Australian Institute of Geoscientists (FAIG #4472), brings over 40 years of experience in mineral resource and reserve estimation, mine planning, economic evaluation of mineral projects, risk assessment, and multidisciplinary coordination. Dr. Nader is a Qualified Person under NI 43-101 and is responsible for the overall coordination, mine planning, and economic components of this Technical Report.
Other consultants who contributed to this report include:
| |
●
|
Hudson Burgarelli, Mining Engineer at BNA Mining Solutions;
|
| |
●
|
Kelly Pereira, Systems Engineer at BNA Mining Solutions;
|
| |
●
|
José Roberto Leite Reis, Mining Engineer of CONSENSUM Engenharia e Consultoria;
|
| |
●
|
Gabriel Neiva, Geologist of Shin Geo; and
|
| |
●
|
Heide Rafaela do Carmo, Civil Engineer of CONSENSUM Engenharia e Consultoria.
|
None of the Consultants or any associates employed in the preparation of this report have any beneficial interest in GMI. The Consultants are not insiders, associates, or affiliates of GMI. The results of this Technical Report are not dependent upon any prior agreements concerning the conclusions to be reached, nor are there any undisclosed understandings concerning any future business dealings between GMI and the Consultants. The Consultants are being paid a fee for their work in accordance with normal professional consulting practice.
|
2.3
|
Details of Inspection
|
A site visit to the São Jorge Project was conducted between February 25 and February 27, 2026, by Dr. Beck Nader, José Roberto Leite Reis, and Gabriel Neiva. Dr. Beck Nader is the Qualified Person responsible for the sections related to mining, processing, infrastructure, and economic analysis.
The purpose of the site visit was to obtain a general understanding of the Project, including access, local infrastructure, topography, geological setting, and conditions relevant to mine planning and development at a Preliminary Economic Assessment level.
The observations made during the site visit were considered in the preparation of this Technical Report.
|
2.4
|
Sources of Information Provided by GoldMining Inc.
|
This Technical Report has been prepared using information provided by GoldMining Inc. (“GMI”), as well as publicly available technical reports and internal project documentation.
BNA Mining Solutions - R. Des. Leão Starling, 200 - Ouro Preto, BH - MG, 31310-370 – Phone: +55 (31) 2514-8733 – E-mail: info@bnaconsultoria.com
|
GoldMining Inc.
NI 43-101 Report – São Jorge Project
|
Page 47 |
The principal sources of information include previously published NI 43-101 Technical Reports for the São Jorge Project, which provide the basis for the Mineral Resource estimate used in this study. Additional sources include exploration reports, historical technical studies, the Plano de Aproveitamento Econômico (“PAE”), engineering drawings, process flow diagrams, and other supporting technical documentation relevant to the Project.
Information related to mining, processing, infrastructure, and economic assumptions was provided by GMI and complemented by BNA Mining Solutions and CONSENSUM Engenharia e Consultoria, based on industry experience, benchmarking, and technical guidance documents prepared for the development of the PEA.
Where possible, the information provided has been reviewed for consistency and reasonableness within the context of a PEA level study. However, the authors have relied on the information provided by GMI and third-party consultants and have not independently verified all such information.
The Mineral Resource estimate has been incorporated without modification and remains under the responsibility of the Qualified Person responsible for its preparation.
The effective date of this report is June 9, 2026.
There were no material changes to the information on the Project between the effective date and the signature date of the Technical Report.
The Metric System for weights and units has been used throughout this report, unless noted otherwise. All currency is in U.S. dollars (US$) unless otherwise stated, and all geographical coordinates are in UTM, SAD69, zone 21S, unless otherwise stated.
BNA Mining Solutions - R. Des. Leão Starling, 200 - Ouro Preto, BH - MG, 31310-370 – Phone: +55 (31) 2514-8733 – E-mail: info@bnaconsultoria.com
|
GoldMining Inc.
NI 43-101 Report – São Jorge Project
|
Page 48 |
|
3
|
Reliance on Other Experts
|
The authors of this Technical Report have relied on information provided by GoldMining Inc. and its legal advisors with respect to mineral tenure, property ownership, and the legal status of the São Jorge Project.
BNA Mining Solutions - R. Des. Leão Starling, 200 - Ouro Preto, BH - MG, 31310-370 – Phone: +55 (31) 2514-8733 – E-mail: info@bnaconsultoria.com
|
GoldMining Inc.
NI 43-101 Report – São Jorge Project
|
Page 49 |
|
4
|
Property Description and Location
|
The São Jorge Project is located in the Tapajós region, southeastern portion of Pará State, in the municipality of Novo Progresso, approximately 460 km southeast of Santarém and 250 km southeast of Itaituba, the main regional cities of the Tapajós region. The nearest town of the project area is Novo Progresso, located 70 km south of the project.
The property is centred approximately at 657,400 mE and 9,282,750 mN (SAD69, Zone 21S EPSG:29191 datum). The centre of the currently delineated mineralization is located at approximately latitude 6°29’14” S and longitude 55°34’38” W.
Nearby operating gold mines include Tocantinzinho (G Mining) and Palito (Serabi), 90 kilometres and 29 kilometres northwest, respectively, from the São Jorge Project. Relevant deposits under development include the Matilda copper- gold porphyry (Serabi) and the Cuiú-Cuiú gold project (Cabral Gold), 120 kilometers and 40 kilometres, from the São Jorge Project. (Figure 4.1 and Figure 4.2).
BNA Mining Solutions - R. Des. Leão Starling, 200 - Ouro Preto, BH - MG, 31310-370 – Phone: +55 (31) 2514-8733 – E-mail: info@bnaconsultoria.com
|
GoldMining Inc.
NI 43-101 Report – São Jorge Project
|
Page 50 |
Figure 4.1 - Location Map of the Project
BNA Mining Solutions - R. Des. Leão Starling, 200 - Ouro Preto, BH - MG, 31310-370 – Phone: +55 (31) 2514-8733 – E-mail: info@bnaconsultoria.com
|
GoldMining Inc.
NI 43-101 Report – São Jorge Project
|
Page 51 |
Figure 4.2 - São Jorge Project location & notable mining operation nearby
|
4.2
|
Mineral Tenure and Title
|
The São Jorge Project encompasses eight mineral titles associated with the National Mining Agency (“ANM”) proceedings no. 850.058/2002, 850.193/2017, 850.556/2013, 850.275/2003, 850.745/2024, 850.194/2017, 850.195/2017, and 850.196/2017. The project covers a contiguous area of approximately 46,485 hectares as shown in Figure 4.3.
The São Jorge deposit is situated on the mineral tenure No. 850.058/2002 and covers an area of 1,660.56 hectares.
BNA Mining Solutions - R. Des. Leão Starling, 200 - Ouro Preto, BH - MG, 31310-370 – Phone: +55 (31) 2514-8733 – E-mail: info@bnaconsultoria.com
|
GoldMining Inc.
NI 43-101 Report – São Jorge Project
|
Page 52 |
The mineral titles are held by Brazilian Resources Mineração Ltda and BRI Mineração Ltda, subsidiaries of GoldMining Inc.
The Final Exploration Report for the ANM proceeding no. 850.058/2002, which includes the São Jorge Deposit, was approved by the ANM on October 30, 2023, and an application for a mining concession was submitted on October 29, 2024.
Advancement to construction and operation will require the granting of a mining concession by the ANM as well as the issuance of the applicable environmental permits, including the Preliminary Licence (Licença Prévia – “LP”), Installation Licence (Licença de Instalação – “LI”), and Operating Licence (Licença de Operação – “LO”), in accordance with Brazilian federal and state regulations.
The authors have not independently verified the legal status of the mineral tenure and have relied on information provided by the Issuer regarding ownership, title, and current standing of the mineral rights.
Based on the information available to the authors, the mineral tenure is in good standing.
Figure 4.3 shows the layout of the Project tenements.
Figure 4.3 – São Jorge Project Tenements
Source: SLR Report
BNA Mining Solutions - R. Des. Leão Starling, 200 - Ouro Preto, BH - MG, 31310-370 – Phone: +55 (31) 2514-8733 – E-mail: info@bnaconsultoria.com
|
GoldMining Inc.
NI 43-101 Report – São Jorge Project
|
Page 53 |
The São Jorge Project is located on privately held rural land in Pará State, Brazil. GoldMining Inc., through its Brazilian subsidiary, holds the mineral rights associated with the Project area but does not currently hold surface rights to properties that cover the mineral tenure.
Future development activities associated with the Project, including any potential mining or infrastructure development, may require additional land access agreements, easements, or other arrangements with surface rights holders, as applicable under Brazilian legislation.
At the time of this PEA, long-term land access requirements and potential surface rights arrangements remain subject to further engineering, environmental, social, legal, and economic evaluation in future stages of project development.
|
4.4
|
Royalties, Agreements and Encumbrances
|
The São Jorge Project is subject to certain royalties and encumbrances as disclosed in the São Jorge NI 43-101 Technical Report. GoldMining Inc. acquired the Project through a series of agreements and transactions that include royalty obligations applicable to future production from the mineral properties.
The São Jorge Deposit is subject to a 1.0% net smelter return (“NSR”) royalty payable to Osisko Gold Royalties Ltd. and a 1.0% NSR royalty payable to Gold Royalty Corp.
The Project is also subject to the Brazilian federal mining royalty known as the Compensation for the Exploitation of Mineral Resources (“CFEM”). This royalty is payable on mineral production at a rate of 1.5% of the value of the mineral production, in accordance with applicable Brazilian mining legislation.
The NI 43-101 Technical Report further notes that additional payments or compensation obligations may apply in relation to surface rights holders.
At the time of this PEA, no Mineral Reserves have been declared, and no production decision has been made. The potential economic impact of royalties, surface rights arrangements, and other encumbrances remains subject to further engineering, legal, commercial, and economic evaluation in future stages of project development.
4.4.1 Environmental Liabilities and Permitting
With the exception of one exploration licence (850.193/2017) that is located to the west of the Jamanxim River, and the western portion of another exploration licence (850.556/2013), that lies on the Jamanxim National Forest protected area (on which mining is permitted under certain conditions), all the other exploration mineral titles of the property are located outside of environmentally restricted areas.
The São Jorge Gold deposit is located outside environmentally restricted areas.
BNA Mining Solutions - R. Des. Leão Starling, 200 - Ouro Preto, BH - MG, 31310-370 – Phone: +55 (31) 2514-8733 – E-mail: info@bnaconsultoria.com
|
GoldMining Inc.
NI 43-101 Report – São Jorge Project
|
Page 54 |
New legislation requires the preservation of natural vegetation areas, including drainage margins, that were partially degraded by previous artisanal miners’ activities. GMI will be required to comply with the minimum preservation area set by legislation, and this will be verified through the environmental baseline studies to be conducted as part of the Environmental Licensing to obtain the Mining License.
The QP is not aware of any environmental liabilities on the property. GMI has all required permits to conduct exploration work on the property at the current stage of the project.
|
4.5
|
Other Significant Factors and Risks
|
At the time of writing, the authors are unaware of any other significant factors or risks that would materially affect the development of the São Jorge Project.
For this chapter the authors have relied on information provided by GMI and have not independently verified such information.
BNA Mining Solutions - R. Des. Leão Starling, 200 - Ouro Preto, BH - MG, 31310-370 – Phone: +55 (31) 2514-8733 – E-mail: info@bnaconsultoria.com
|
GoldMining Inc.
NI 43-101 Report – São Jorge Project
|
Page 55 |
|
5
|
Accessibility, Climate, Local Resources, Infrastructure and Physiography
|
Access to the São Jorge Project from the cities of Itaituba and Santarém is via the paved BR-163 highway (Cuiabá-Santarém) as shown in the map of Figure 5.1.
The distance from Santarém to the project is approximately 600km (10-hour drive by car), and from Itaituba, 270 km (4-hour drive by car).
The project camp and the São Jorge Gold deposit are situated only 2km west of the BR-163 highway and are accessible via unpaved secondary roads.
The highway and secondary road access conditions may be affected seasonally during periods of heavy rainfall; however, access is maintained year round.
The cities of Santarém and Itaituba offer regular commercial flights, and both have seaports that can accommodate large ships and barges. These cities' ports are connected to Belém, the capital of the state of Pará, at the mouth of the Amazon River, a major seaport on the Atlantic coast.
To the south, highway BR-163 also connects the São Jorge project to the city of Sinop in the nearby state of Mato Grosso, providing an alternative option for the project’s logistics.
BNA Mining Solutions - R. Des. Leão Starling, 200 - Ouro Preto, BH - MG, 31310-370 – Phone: +55 (31) 2514-8733 – E-mail: info@bnaconsultoria.com
|
GoldMining Inc.
NI 43-101 Report – São Jorge Project
|
Page 56 |
Figure 5.1 - Accessibility map
The São Jorge Project is located in a tropical climatic region characterized by distinct wet and dry seasons. The wet season typically extends from December to May, while the dry season occurs between June and November.
Average annual precipitation in the region is approximately 2,000 mm, with most of the rainfall occurring during the wet season. Average annual temperatures are approximately 27°C, with limited seasonal variation.
Seasonal rainfall may locally affect road conditions and access, particularly along unpaved roads; however, climate conditions are not considered a significant constraint to exploration or potential mining activities.
|
5.3
|
Local Resources and Infrastructure
|
The São Jorge Project is in a region with access to local labour, basic services, and existing infrastructure to support exploration and potential mining activities.
BNA Mining Solutions - R. Des. Leão Starling, 200 - Ouro Preto, BH - MG, 31310-370 – Phone: +55 (31) 2514-8733 – E-mail: info@bnaconsultoria.com
|
GoldMining Inc.
NI 43-101 Report – São Jorge Project
|
Page 57 |
The local economy is primarily based on agriculture (mainly soya beans and corn), cattle ranching, mining, forestry, and services.
The nearest population centres include the town of Novo Progresso, located approximately 70 km to the south, and smaller communities such as Vila Riozinho and Moraes Almeida, located approximately 15 km and 30 km from the Project area, respectively. These communities provide a source of semi-skilled and unskilled labour, as well as most services needed for project logistics, such as fuel, equipment, consumables, and basic services.
On-site infrastructure includes camp facilities for personnel accommodation, office buildings, core-logging and sample-preparation facilities, and storage areas. These installations have supported historical exploration activities and remain available for ongoing and future use.
Electrical power is supplied via a connection to the regional grid, with on-site diesel generators serving as backup. Water required for exploration activities is sourced locally, and potable water is sourced from wells.
Communication infrastructure, including internet and satellite telephone service, is available at the Project site.
Based on the available information, no significant limitations related to local resources or infrastructure have been identified that would materially affect the development of the Project.
The São Jorge Project is situated in a region characterized by relatively low relief, with elevations ranging approximately from 150 m to 400 m above sea level. The topography is generally gentle, with locally undulating terrain.
The Project area is located within a tropical rainforest environment, although portions of the original vegetation have been altered by agricultural activities, primarily cattle ranching and mining.
The regional drainage is part of the Tapajós River basin, with the Jamanxim River located approximately 10 km west of the Project area. Surface water is available locally and contributes to the regional hydrological network.
The physiographic conditions are considered favourable for exploration and potential mining activities, with no significant topographic or natural barriers identified.
BNA Mining Solutions - R. Des. Leão Starling, 200 - Ouro Preto, BH - MG, 31310-370 – Phone: +55 (31) 2514-8733 – E-mail: info@bnaconsultoria.com
|
GoldMining Inc.
NI 43-101 Report – São Jorge Project
|
Page 58 |
From 1993 to 1998 Rio Tinto Desenvolvimento Minerais Ltda (“RTDM”), a subsidiary of Rio Tinto Plc Mineral Group, acquired the exploration rights to the property.
In March 1998, Altoro Gold Corp. (“Altoro”) negotiated an agreement on the property with RTDM and reviewed all data by check sampling of drill holes and surface sampling at the garimpeiro pit. However, due to a merger with Solitario Resources Corporation, no further work was completed on the property. In early 2003, RTDM relinquished the four São Jorge exploration licenses.
One of the licenses (No 850.024/02), was immediately acquired by a private individual and subsequently optioned to Centaurus Mineração e Participações Ltda (“Centaurus”). No exploration work was undertaken by Centaurus.
From 2001 to 2005, garimpo operations were undertaken by Tapajós Mineração Ltda (“TML”). These operations included small heap-leach pads that used cyanide solutions to recover gold. Production by TML was reported at 15,000 t of ore per month grading 0.3 to 0.7 g/t of gold.
By the time garimpeiro operations ceased on the property, a pit of approximately 400 m long, 80 m wide, and 20-30 m deep had been excavated over the Wilton Pit area.
On July 16, 2004, Talon Metals Corp. (“Talon”) acquired from Centaurus a 100% interest in the São Jorge exploration licenses and, in April 2005, entered into an agreement with Jaguar Resources Limited to acquire a 100% interest in the three adjacent claims.
On June 14, 2010, Brazilian Gold Corporation (“BGC”) acquired from Talon a 100% interest in the São Jorge exploration licenses.
On November 22, 2013, BGC entered into an agreement with Brazil Resources Inc. (“BRI”), pursuant to which BRI acquired all outstanding common shares of BGC. Brazil Resources Inc. announced that effective December 6, 2016, it had changed its name to GoldMining Inc. As a result of its acquisition of BGC, GMI indirectly owns Brazilian Resources Mineração Ltda., Mineração Regent Brasil Ltda., and BRI Mineração Ltd., which in turn own the Project.
|
6.2
|
Exploration and Development History
|
The Project is located in the eastern part of the region known as the “Tapajós Gold Province”. Gold is reported to have been first discovered in the Tapajós region in the 18th century.
Significant regional production has been recorded since the end of the 1970s and beginning of the 1980s, when highway BR-163 (the Cuiaba–Santarém road) was opened. A gold rush began in the Tapajós region with thousands of garimpeiros entering the previously isolated area. Production from the region apparently peaked between 1983 and 1989, with as many as 300,000 garimpeiros reportedly extracting somewhere between 500,000 oz and 1 million oz of gold per year, predominantly from shallow alluvial gold sources. Up until 1993, cumulative gold production was officially estimated at approximately 7 Moz. Production has since declined, reaching an estimated average of 160,000 oz of gold per year in the late 1990s.
BNA Mining Solutions - R. Des. Leão Starling, 200 - Ouro Preto, BH - MG, 31310-370 – Phone: +55 (31) 2514-8733 – E-mail: info@bnaconsultoria.com
|
GoldMining Inc.
NI 43-101 Report – São Jorge Project
|
Page 59 |
Garimpeiro mining at the Project reportedly commenced in the 1970s (the Wilton pit). There are no published records to support the timing or amount of production. The exploration of the São Jorge area was initiated by RTDM in 1993. At that time, the São Jorge garimpo workings (the Wilton Pit) were approximately 30 m in diameter. Following sampling in this small open pit, RTDM applied for four exploration licences to acquire the bedrock mining rights and negotiated an agreement with the landowner, Wilton Amorim, which enabled them to initiate exploration on the property.
A summary of the exploration and development history of the Project prior to being acquired by GMI is excerpted from GE21 Consultoria Mineral (2021) and is shown in Table 6.1.
Table 6.1 - Exploration and Development History, São Jorge Project
|
Owner
|
Year
|
Work
|
Results
|
|
Artisanal miners
|
Pre-1990
|
Placer mining of the saprolite and alluvium
|
Minor quantities of gold produced
|
|
RTDM
|
1993 – 1995
|
Geological mapping, soil sampling, trenching, auger drilling, and diamond drilling (26 drill holes totalling 4,391 m in length)
|
Preparation of an internal Mineral Resource estimate by RTDM (non 43-101 compliant)
|
|
1997 – 1998
|
Diamond drilling (16 drill holes) and preparation of a scoping study
|
|
Centarus Mineração e Participaçõs Ltda.
|
1998 - 2004
|
No exploration carried out
|
|
|
Tapajós Mineração Ltda
|
2001 – 2005
|
Garimpo open-pit mining
|
Gold production by heap leaching. Final pit dimensions 400 m in length, 80 m in width, and 20 m to 30 m depth.
|
|
Talon Metals Corp. (Talon, previously known as BrazMin Corp)
|
2005
|
Phase I diamond drilling, 48 drill holes totalling 10,104 m in length.
|
Defined an envelope of a sulphide vein and stockwork zone along a strike length of 700 m.
|
|
2006
|
Airborne-based and ground-based geophysical surveys, Phase II diamond drilling of 34 drill holes totalling 7,952 m in length.
|
New targets and extensions from the Wilton Zone defined to the west (Kite Zone) and to the east (Wilton East Zone). First NI 43-101 compliant Mineral Resource estimate.
|
| |
2007
|
Extension of regional soil sampling grid coverage
|
Anomalous gold values discovered along a length of 600 m on one survey line.
|
|
Brazilian Gold Corporation (BGC)
|
2011
|
Soil geochemical surveys and geophysical (Induced Polarization) surveys totalling 120 line km in length. Diamond drilling of 37 drill holes totalling 14,708 m in length.
|
Increase in the overall Mineral Resources and upgrading of the resource classification.
|
BNA Mining Solutions - R. Des. Leão Starling, 200 - Ouro Preto, BH - MG, 31310-370 – Phone: +55 (31) 2514-8733 – E-mail: info@bnaconsultoria.com
|
GoldMining Inc.
NI 43-101 Report – São Jorge Project
|
Page 60 |
6.2.1 RTDM Drilling
Diamond drilling undertaken by RTDM was comprised of an initial phase of 10 drill holes comprising FSJ-01 to FSJ-10 for a total of about 1,700 m with the deepest drill hole penetrating 150 m below surface. These holes were inclined at 50º to 55º. All core drilled was BQ (36.5 mm) diameter. The second phase of drilling by RTDM comprised 16 drill holes (FSJ-11 to FSJ-26) for a total of approximately 2,690 m. Drill holes were drilled with a 50º to 55º inclination with a north or south azimuth. Five drill holes were drilled at an azimuth ranging from 20º degrees to 35º degrees, approximately perpendicular to the deposit strike. Core drilled during this campaign was HQ (63.5 mm) and NQ (47.6 mm) in diameter. Details of RTDM drilling procedures were reviewed by Harron (2006). Downhole surveys were not completed for RTDM holes and possible deviation may have occurred, but verification of this deviation is not possible.
6.2.2 Talon Drilling
In 2005 Talon completed a Phase I diamond drilling program with a total of 10,104 m from 48 drill holes completed, mainly targeting the existing garimpeiro pit.
From May to September 2006, Talon conducted a Phase II drilling program with a total of 34 drill holes completed for 7,952 m. From this phase, eight drill holes for 2,302 m targeted an infill program at the Wilton pit, and another 5,650 m tested prospective targets. Two new extensions, the “Kite zone”, located to the northwest, and the “Wilton East zone’, located east of the pit, were defined.
Drilling was contracted to Geoserv Pesquisas Geologicas SA of Rio de Janeiro, a subsidiary of Boart Longyear. Drilling equipment used on the Project included two Diakore and one Longyear 38 drilling rigs. Overburden, laterite and saprolite rock was drilled using HQ core equipment. Un-weathered rock was drilled with NQ diameter core.
The majority of drill holes over the Wilton Pit area were drilled with a north or south azimuth and inclined about 55º. Talon drilled five vertical drill holes and some drill holes with northeast and southwest orientations to test for sub-horizontal and oblique structures in the deposit.
The Talon drilling procedures include:
| |
●
|
Storage of all core in wooden core boxes at drill site;
|
| |
●
|
Twice daily collection of core from drill site;
|
BNA Mining Solutions - R. Des. Leão Starling, 200 - Ouro Preto, BH - MG, 31310-370 – Phone: +55 (31) 2514-8733 – E-mail: info@bnaconsultoria.com
|
GoldMining Inc.
NI 43-101 Report – São Jorge Project
|
Page 61 |
| |
●
|
Storage of core in secure corrugated metal and wood core shed;
|
| |
●
|
Run markers with metal tags indicating drilled depth;
|
| |
●
|
Measurement and recording of core recovery for each drilling run;
|
| |
●
|
Photography of core before splitting;
|
| |
●
|
Measurement of rock quality designation (“RQD”), and magnetic susceptibility for part of the drill holes;
|
| |
●
|
Detailed logging of alteration, lithology, structures and sulphides.
|
Collar coordinates are based on the UTM coordinate SAD69, UTM zone 21S datum. Talon holes were surveyed by the drilling contractor using a Sperry Sun multi-shot tool, followed by a Reflex single-shot tool. Initially holes were surveyed at 3 m intervals and then with a better knowledge of drill hole deviations, variably from 40 to 90 m intervals. Several holes were oriented using the downhole “spear” technique. Drill collar coordinates are recorded using a differential GPS system by Terra Engineering based in Novo Progresso, Pará state.
BGC had drilled about 14,708 metres in 37 drill holes from January to December 2011. All of this data, along with the historical drill hole information, supports the updated Mineral Resource presented in this report. BGC implemented the exploration program keeping the same procedures and philosophy as Talon.
|
6.3
|
Historical Resource Estimates
|
Several historical Mineral Resource estimates have been prepared for the Project (Table 6.2). All of these estimates are considered to be historical in nature and should not be relied upon. A qualified person has not completed sufficient work to classify any of the historical estimates as a current Mineral Resource or Mineral Reserve, and GMI is not treating any the historical estimates as current Mineral Resources. The current Mineral Resources presented in Section 14 supersede all historical Mineral Resource estimates.
Table 6.2 - Summary of Historical Mineral Resource Estimates, São Jorge Project
|
Year
|
Owner
|
Reference
|
|
1996
|
Rio Tinto Desenvolvemento Minerais Ltda.
|
MPH Consulting. 2004
|
|
2008
|
BrazMin Corp.
|
SRK Consulting. 2008
|
|
2010
|
Brazilian Gold Corporation
|
Coffey Mining. 2010
|
|
2013
|
Brazilian Gold Corporation
|
Coffey Mining. 2013
|
Gold production from the Project has been only via artisanal mining operations that recovered gold from the shallow, saprolite profile. Approximately 1,500 oz of gold have been estimated to have been produced in this manner (MPH Consulting 2004).
BNA Mining Solutions - R. Des. Leão Starling, 200 - Ouro Preto, BH - MG, 31310-370 – Phone: +55 (31) 2514-8733 – E-mail: info@bnaconsultoria.com
|
GoldMining Inc.
NI 43-101 Report – São Jorge Project
|
Page 62 |
|
7
|
Geological Setting and Mineralization
|
The São Jorge Gold Project is located within the Tapajós District situated in the south-central portion of the Amazon Craton. The Amazon craton became tectonically stable at the end of the Late Proterozoic period. The Craton is generally divided into the Guyana Shield north of the Amazon River and the Brazil Shield south of the Amazon River. The provinces have a northwest trend across the shields. The Brazil Shield has, as its nucleus, the Archean granitoid-greenstone terranes of the Carajás-Imataca Province in the east. The structural provinces become younger towards the west and are dominantly granitic rocks of Paleoproterozoic age. There is a general agreement that in this region, initial oblique collision tectonism was associated with crustal shortening linked to subduction and or accretion of magmatic arcs and early continental nucleation (GE21 Consultoria Mineral, 2021).
The main units that form the basement of the Tapajós Gold Province are the Paleoproterozoic Cuiú-Cuiú Metamorphic Suite (2.0 to 2.4 Ga old), and the Jacareacanga Metamorphic Suite, also of possible Paleoproterozoic age (>2.1 Ga). The Cuiú-Cuiú Suite comprises gneisses, migmatites, granitoid rocks and amphibolites. The Jacareacanga Suite comprises a supracrustal sedimentary-volcanic sequence, which has been deformed and metamorphosed to greenschist facies. Both suites are intruded by granitoids of the Parauari Intrusive Suite consisting of a monzodiorite dated at 1.9 to 2.0 Ga. These form the basement of the extensive felsic to intermediate volcanic rocks of the Iriri Group, dated at 1.87 to 1.89 Ga, including comagmatic and anorogenic plutons of the Maloquinha Suite with intrusive events dated at 1.8 to 1.9 Ga. The Iriri - Maloquinha igneous event is associated with a strong extensional period. Regional structural analysis in the Tapajós area has identified important lineaments that trend mainly northwest to southeast with a less well defined transverse east to west set.
The primary gold mineralization in the Tapajós region is related to:
| |
●
|
Lode-like mesothermal orogenic gold deposits, comprising quartz veins in shear zones with local hydrothermal alteration of the country rocks; and
|
| |
●
|
Stockwork and disseminated gold with a more pervasive hydrothermal alteration hosting granitoid and volcanic rocks, similar to porphyry intrusion related styles of mineralization.
|
The São Jorge gold deposit is related to the east extension of the regional 450 km long northwest-southeast Cuiú-Cuiú - Tocantinzinho lineament which also hosts several important gold deposits including the Palito mine, Tocantinzinho and Cuiú-Cuiú deposits, and the Bom Jardim and Batalha gold prospects (Figure 7.1).
BNA Mining Solutions - R. Des. Leão Starling, 200 - Ouro Preto, BH - MG, 31310-370 – Phone: +55 (31) 2514-8733 – E-mail: info@bnaconsultoria.com
|
GoldMining Inc.
NI 43-101 Report – São Jorge Project
|
Page 63 |
Figure 7.1 – São Jorge Project, regional-scale geology
BNA Mining Solutions - R. Des. Leão Starling, 200 - Ouro Preto, BH - MG, 31310-370 – Phone: +55 (31) 2514-8733 – E-mail: info@bnaconsultoria.com
|
GoldMining Inc.
NI 43-101 Report – São Jorge Project
|
Page 64 |
The São Jorge property geology consists of a granitoid pluton dominantly composed of an amphibole-biotite monzogranite (Figure 7.2). In the past, this pluton was interpreted to comprise one granitoid series, however, geological research completed by the Federal University of Pará (“UFPA”) indicates that the pluton is heterogeneous and is comprised of two main granitoid series including:
| |
●
|
Older São Jorge granitoid: massive granitic and porphyritic felsic intrusives composed of amphibolite-biotite monzogranite to quartz monzogranite rocks and biotite leuco- monzogranites to syenogranite rocks. Texturally they are generally massive, displaying rare localized nonpenetrative foliation;
|
| |
●
|
Younger São Jorge granitoid: massive granitic felsic intrusives composed of biotite leuco-monzogranite and syenogranite, often occurring as circular shaped bodies, with localized brecciated foliation indicating brittle-ductile deformation which is observed in the vicinity of gold mineralization.
|
The São Jorge granitoids frequently include 5 cm to 10 cm long, oval-shaped mafic enclaves. They also display local rapakivi texture characterized by sparse crystals of K-feldspar mantled by plagioclase.
BNA Mining Solutions - R. Des. Leão Starling, 200 - Ouro Preto, BH - MG, 31310-370 – Phone: +55 (31) 2514-8733 – E-mail: info@bnaconsultoria.com
|
GoldMining Inc.
NI 43-101 Report – São Jorge Project
|
Page 65 |
Figure 7.2 – São Jorge property-scale geology
BNA Mining Solutions - R. Des. Leão Starling, 200 - Ouro Preto, BH - MG, 31310-370 – Phone: +55 (31) 2514-8733 – E-mail: info@bnaconsultoria.com
|
GoldMining Inc.
NI 43-101 Report – São Jorge Project
|
Page 66 |
7.2.1 Lithologies
Typically soil, laterite, saprolite and saprock comprise the upper 30 m to 40 m. Below this is fresh granitoid of a fairly narrow range of primary composition. Microscope work on representative samples indicates the following ranges for the major rock forming minerals in the weakly to moderately altered lithologies:
| |
●
|
Plagioclase: 20 to 35 %
|
| |
●
|
K-feldspar (Microcline): 15 to 40 %
|
| |
●
|
Mafic minerals (chlorite/biotite/amphibole) 1 to 20 %
|
Based upon these compositions the primary rock is mostly classified as monzogranite though lesser amounts of granodiorite (where microcline content is lower) are present. Depending on the contribution of hornblende, biotite and magnetite, a prefix of hornblende or biotite may be added to the rock name.
Figure 7.3 shows typical São Jorge lithologies; from top to bottom they are:
Top: Monzogranite with large orange/pink microcline crystals, 35% plagioclase (largely altered to sericite), 20% quartz;
Centre: Granodiorite comprised of 35% quartz, 30% plagioclase, 15% microcline and 15% chlorite (reddish coloration is due to fine hematite within plagioclase); and
Bottom: Very weakly altered hornblende monzogranite comprised of 20% quartz, 30% plagioclase, 20% microcline, 18% hornblende, 6% biotite and 1% chlorite.
BNA Mining Solutions - R. Des. Leão Starling, 200 - Ouro Preto, BH - MG, 31310-370 – Phone: +55 (31) 2514-8733 – E-mail: info@bnaconsultoria.com
|
GoldMining Inc.
NI 43-101 Report – São Jorge Project
|
Page 67 |
Figure 7.3 - Typical examples of São Jorge host lithologies
Source: Coffey Mining 2013.
The São Jorge granitoids are mostly medium grained and equigranular, but microcline crystals up to 100 mm size may give the rock a coarse porphyritic texture where potassic alteration is advanced. A small percentage (<0.5%) of the rock mass is comprised of fine grained aplites which are pink/orange K-feldspar rich, cross-cutting and up to three metres thick. A small amount of leuco-granite is present in some boreholes; comprised mainly of K-feldspar, possibly as a result of pervasive potassic alteration. Where intensely sheared, the granite composition and texture is un-recognizable and the lithology is best described as a low grade metamorphic granite or meta-granite (Pedley 2011).
7.2.2 Alteration
The main variable in the São Jorge lithology is alteration. The main visible alteration types are:
| |
●
|
Sericitization of plagioclase
|
| |
●
|
Chloritization of hornblende and biotite
|
| |
●
|
Microclinization (potassic) alteration of plagioclase
|
| |
●
|
Epidotization of mafics and as a sassauritization product within plagioclase
|
| |
●
|
Hematite development probably after magnetite
|
BNA Mining Solutions - R. Des. Leão Starling, 200 - Ouro Preto, BH - MG, 31310-370 – Phone: +55 (31) 2514-8733 – E-mail: info@bnaconsultoria.com
|
GoldMining Inc.
NI 43-101 Report – São Jorge Project
|
Page 68 |
| |
●
|
Carbonatization. Although widespread (in small quantities of 0 to 4%) it is difficult to recognize in core samples and has not been used in the classification of assemblages.
|
In addition to the above is the development of silicification (Pedley 2011).
The intensity of alteration and the relative proportions of the main alteration minerals is variable and changes are typically gradational, but five alteration assemblages have been recognized as those which can be identified relatively easily in core and importantly, correlated between boreholes. The alteration minerals, in probable order of genesis/advancement, reflecting change from potassic to phyllic alteration, are: Fe-oxide→ chlorite→ microcline and epidote→ sericite and quartz.
Detailed descriptions of the alteration assemblages observed at the São Jorge deposit is as follows.
|
7.2.2.1
|
‘Nada’ Zone – Very weak or no alteration
|
Figure 7.4 presents an example of the un-altered pale grey hornblende-magnetite monzogranite, sometimes with clusters of biotite and magnetite, in this case totally unaltered. Crystals are typically euhedral.
Figure 7.4 - Example of fresh, un-altered monzogranite
Source: Coffey Mining 2013.
BNA Mining Solutions - R. Des. Leão Starling, 200 - Ouro Preto, BH - MG, 31310-370 – Phone: +55 (31) 2514-8733 – E-mail: info@bnaconsultoria.com
|
GoldMining Inc.
NI 43-101 Report – São Jorge Project
|
Page 69 |
|
7.2.2.2
|
Fe-oxide +/- Chlorite Alteration (Fe-Ox-Chl zone)
|
Hematite formation within feldspar crystals gives this alteration type a distinct reddish coloration. Chlorite typically forms veins and patches. Hornblende is partially/largely preserved. Crystals are euhedral to subhedral. Primary magnetite is largely replaced. Widely spaced narrow (<0.2m) mineralized zones of quartz-sericite alteration may be present. With increasing pervasive alteration, this zone grades into the K-feldspar – epidote – chlorite (K-feld-ep-chl) zone, or, with a greater frequency of fracture controlled alteration/mineralization, may be classified as the heterogeneous ore type. Figure 7.5 illustrates the Fe-oxide +/- chlorite assemblage, in this case very little chlorite is present (hornblende remains largely unaltered).
Figure 7.5 - Example of Fe-oxide +/- Chlorite Alteration
Source: Coffey Mining 2013.
|
7.2.2.3
|
K-feldspar – Epidote– Chlorite Alteration (K-feld – ep – chl zone)
|
Sericite comprises less than 4% to 5% of the rock. Increased alteration is present, notably microclinisation forming overgrowths and new large K feldspar crystals. Microcline crystals may reach 100 mm or more. Plagioclase takes on a light greenish appearance due to replacement by epidote. Silicification is not as abundant as it is in the mixed assemblage.
Chlorite is abundant forming veins and aggregates.
Figure 7.6 illustrates the K-feld-ep-chl zone. It presents large K-feldspar crystals and visible chlorite veins.
BNA Mining Solutions - R. Des. Leão Starling, 200 - Ouro Preto, BH - MG, 31310-370 – Phone: +55 (31) 2514-8733 – E-mail: info@bnaconsultoria.com
|
GoldMining Inc.
NI 43-101 Report – São Jorge Project
|
Page 70 |
Figure 7.6 - Example of K-Feldspar-Epidote-Chlorite Alteration
Source: Coffey Mining 2013.
|
7.2.2.4
|
Sericite – K-feldspar – Chlorite – Epidote Alteration (mixed zone)
|
Sericite is an essential component of this assemblage, and epidote and K-feldspar are always present in varying amounts. A distinguishing criterion of this assemblage is that the alteration is pervasive. There is some variation in the relative proportion of sericite which may comprise between 5% and 50% by volume; largely reflecting the intensity of the alteration. With increasing intensity the epidote and K-feldspar component is reduced, replaced by a sericite quartz assemblage; it may be possible to subdivide the assemblage based upon the amount of sericite and epidote present.
Typically this alteration assemblage has a greenish/grey patchy or ‘marbled’ appearance. Original crystal forms are largely/entirely destroyed though less intensely altered varieties exist. Silicification is common, probably after K-feldspar (Pedley 2011). It is distinct in core and provides a useful ‘marker’ for correlation. Figure 7.7 illustrates the mixed zone, in this case sericite is present in relatively small amounts (15%).
BNA Mining Solutions - R. Des. Leão Starling, 200 - Ouro Preto, BH - MG, 31310-370 – Phone: +55 (31) 2514-8733 – E-mail: info@bnaconsultoria.com
|
GoldMining Inc.
NI 43-101 Report – São Jorge Project
|
Page 71 |
Figure 7.7 - Example of Mixed Zone Alteration Type
Source: Coffey Mining 2013.
|
7.2.2.5
|
Heterogenous (variable) Zone
|
The importance of this assemblage was recognized midway through the re-logging exercise; on some sections it may be incorrectly logged as Fe-Ox +/- chl or K-feldspar-epidote-chlorite assemblage. It is typified by weak to moderately altered rock of these assemblages but with small (10 mm to 0.5 m) altered zones with quartz, sericite, epidote and appears to be fracture controlled as opposed to pervasive.
Figure 7.8 illustrates the heterogeneous (variable) zone alteration. In this picture there are several small zones of intense sericite-quartz alteration separated by sections of weak Fe-Ox +/- chl alteration. This heterogeneous appearance is typical of this mineralization type.
BNA Mining Solutions - R. Des. Leão Starling, 200 - Ouro Preto, BH - MG, 31310-370 – Phone: +55 (31) 2514-8733 – E-mail: info@bnaconsultoria.com
|
GoldMining Inc.
NI 43-101 Report – São Jorge Project
|
Page 72 |
Figure 7.8 - Example of Heterogenous Alteration Type zone
Source: Coffey Mining 2013.
7.2.3 Structure
The mineralized and altered portions of the São Jorge Granitoid reflect zones of moderate shearing evident as numerous small (less than two to three metres, mostly less than 0.5 m) ductile shears with foliation approaching mylonitic textures in places, and widespread micro-shearing and brecciation. Quartz and feldspar crystals are affected by cataclasis forming cryptocrystalline aggregates.
The shear zones are typically discontinuous; they can be correlated between some boreholes but not others. Generally, shear zones are coincident with the most advanced alteration zones. Quartz veining, boudin structures, carbonate veinlets and hematite are typical of the shear zones. Sericite may comprise up to 60% of the central parts of the shear zones. Adjacent to these zones the granitoids exhibit micro-shearing and brecciation and a general destruction of primary igneous textures (cataclasis) for several metres around the structure (Pedley 2011).
Figure 7.9 shows a typical small shear zone with foliation and cataclastic textures. Figure 7.10 shows a typical quartz veining adjacent to most intense shearing. In both cases alteration is sericite dominated and very intense.
BNA Mining Solutions - R. Des. Leão Starling, 200 - Ouro Preto, BH - MG, 31310-370 – Phone: +55 (31) 2514-8733 – E-mail: info@bnaconsultoria.com
|
GoldMining Inc.
NI 43-101 Report – São Jorge Project
|
Page 73 |
Figure 7.9 - Example of a small scale shear zone in drill core
Source: Coffey Mining 2013.
Figure 7.10 - Examples of shear zones containing quartz veins in drill core
Source: Coffey Mining 2013.
Figure 7.11 shows a surface view of a shear zone contained within the saprolite portion of the weathering profile. In this location the shear zone dips vertically, is in order of 3 to 4 metres in width and contains thin, centimetre-scale veinlets of semi-massive to massive oxidized pyrite that are oriented either parallel to the foliation, or are at a low angle. Disseminated pyrite is also present.
BNA Mining Solutions - R. Des. Leão Starling, 200 - Ouro Preto, BH - MG, 31310-370 – Phone: +55 (31) 2514-8733 – E-mail: info@bnaconsultoria.com
|
GoldMining Inc.
NI 43-101 Report – São Jorge Project
|
Page 74 |
Figure 7.11 - Example of shear zone in saprolite containing sulphide veinlets. View looking east
Source: SLR 2024.
The mineralized system extends over approximately 1.4 km along strike, with an average thickness of approximately 160 m and vertical continuity exceeding 300 m. The mineralization remains open at depth.
Observations made in drill core suggest that the gold mineralization is often associated with the presence of sulphide minerals where at least 99 percent of sulphides are pyrite. Chalcopyrite, and very rare galena and molybdenite are also observed on occasion and comprise less than approximately 1% of the total sulphide abundance. Statistical analyses of the relationship between sulphide abundance as logged in drill core and gold grades reveal a poor correlation. While the presence of sulphide minerals appears to be a prerequisite for elevated gold values, there is no clear and consistent correlation between sulphide abundance and gold grades. Many instances are noted in drill core where sulphide mineralization is present with little to no associated gold values.
The SLR QP recommends that mineral chemistry studies be undertaken on both the mineralized and barren pyrite present in the São Jorge deposit to determine whether a difference in the pyrite chemistry can be used as an exploration tool.
The sulphide minerals are present as either disseminated grains (Figure 7.12) or within veins/veinlets (Figure 7.13) or small semi-massive blebs/lenses (Figure 7.14), comprising up to a maximum of 10% by volume by metre of core. Grains are typically < 2mm fine euhedral to subhedral but in exceptional specimens sulphide grains may reach 8 mm to 10 mm in size.
BNA Mining Solutions - R. Des. Leão Starling, 200 - Ouro Preto, BH - MG, 31310-370 – Phone: +55 (31) 2514-8733 – E-mail: info@bnaconsultoria.com
|
GoldMining Inc.
NI 43-101 Report – São Jorge Project
|
Page 75 |
Mineralization is best developed within the central portions of the deposit, typically associated with sericite (phyllic alteration):
| |
●
|
within the mixed zone, as disseminations and semi-massive accumulations. Sulphide is more abundant in the mixed zone than in any other assemblage but gold mineralization appears to be equally well developed within the less pervasively altered heterogeneous zone.
|
| |
●
|
within numerous small fracture controlled altered and mineralised concentrations within the heterogeneous and Fe-Ox +/- chlorite zones. This style of mineralization is typically within sulphide veins up to 100 mm thick and is more likely to contain chalcopyrite than the other mineralization styles. Some of the best grade intersections are within this fracture controlled style.
|
Figure 7.12 - Example of fine disseminated pyrite mineralization within the mixed alteration zone
Source: Coffey Mining 2013.
BNA Mining Solutions - R. Des. Leão Starling, 200 - Ouro Preto, BH - MG, 31310-370 – Phone: +55 (31) 2514-8733 – E-mail: info@bnaconsultoria.com
|
GoldMining Inc.
NI 43-101 Report – São Jorge Project
|
Page 76 |
Figure 7.13 - Example of fracture controlled vein-style pyrite mineralization within the Fe-Ox-chlorite alteration zone
Source: Coffey Mining 2013.
Figure 7.14 - Example of semi-massive, veinlet, and disseminated pyrite mineralization
Source: Coffey Mining 2013.
BNA Mining Solutions - R. Des. Leão Starling, 200 - Ouro Preto, BH - MG, 31310-370 – Phone: +55 (31) 2514-8733 – E-mail: info@bnaconsultoria.com
|
GoldMining Inc.
NI 43-101 Report – São Jorge Project
|
Page 77 |
The São Jorge mineral deposit is best classified as a granite-hosted, intrusion-related gold deposit. Intrusion related gold deposits were defined by Thompson et al. (1999) with the following characteristics:
| |
●
|
Deposits hosted within or zoned proximal to intermediate to felsic granitic rocks.
|
| |
●
|
Intrusions are typically moderately reduced to moderately oxidized (ilmenite through to magnetite series) I-type granitic rocks.
|
| |
●
|
The associated pathfinder elements are typically Bi, Te, Mo, W in the core of the intrusion system, zoning outward to distal As, Sb, Pb and Zn.
|
| |
●
|
The deposits have a range in styles including sheeted, breccia, stockwork, flat-vein, and disseminated to greisen that is controlled by proximity to intrusions, depth of emplacement and structural controls on intrusions.
|
| |
●
|
Mineralization is coeval with the related intrusions demonstrated through zonation with respect to the causative intrusion and mineralized magmatic-hydrothermal transition textures. These may include miarolitic cavities, vein dykes, unidirectional solidification textures, brain rock, and granite- facies control on gold distribution. In addition, age dating in global examples has confirmed synchroneity between intrusions and mineralization.
|
| |
●
|
Mineralization is typically characterized by reduced, low sulfide (<2%) mineral assemblages including pyrite, pyrrhotite and arsenopyrite with magnetite less common and hematite rare. Proximal gold is typically high fineness and paragenetically related to Bi ± Te.
|
| |
●
|
Alteration is usually more limited than in typical porphyry environments, and characterized by early, high temperature quartz-feldspar (both potassic and sodic) alteration intimately associated with magmatic-hydrothermal transition textures that evolve to lower temperature white mica / sericite- carbonate-chlorite-quartz alteration and veining typically associated with the main mineralization stage.
|
| |
●
|
The mineralization formed from H2O-CO2 ± salt magmatic fluids.
|
| |
●
|
The majority of known deposits are Phanerozoic in age and formed in continental arc to back arc settings.
|
Analogous deposits associated with granitoid intrusives in the Amazonian craton are the multi-million ounce Omai gold deposit in Guyana (Goldfarb et al. 2001) and the 2.1 million ounce Tocantinzinho gold deposit, located approximately 90 km northwest from the São Jorge property along the same regional lineament.
BNA Mining Solutions - R. Des. Leão Starling, 200 - Ouro Preto, BH - MG, 31310-370 – Phone: +55 (31) 2514-8733 – E-mail: info@bnaconsultoria.com
|
GoldMining Inc.
NI 43-101 Report – São Jorge Project
|
Page 78 |
|
9.1
|
Exploration by Previous Owners
|
Exploration work completed over the property by previous operators from 1993 to 2013 is summarized in Chapter 6 (‘History’) and described by GE21 Consultoria Mineral (2021). It includes:
| |
●
|
Induced Polarization (“IP”) survey over the deposit and immediate surrounding area covering 24.6 km2,
|
| |
●
|
Soil sampling survey over 15.0 km2 on a 200 m by 50 m grid and 100 m by 50 m infill sampling grid, for a total of 4,445 surficial soil samples collected and analyzed for gold.
|
In the period between May 3rd and August 8th, 2011, an IP survey was completed over the property totaling 101,550 linear metres of IP profiles.
The time domain Spectral Induced Polarization survey was performed along lines using the Dipole-Dipole arrangement with spacing of 100 m and advances of 50 m between stations. The survey equipment included a VIP4000 Transmitter in conjunction with IP Receiver ELREC- PRO – both from IRIS.
The data was processed using the GEOSOFT Interactiv™ IP Processing System.
Figure 9.1 shows the chargeability distribution in plan view at the 100 m level. The image is a representation of the chargeability at depths in the fresh rock.
BNA Mining Solutions - R. Des. Leão Starling, 200 - Ouro Preto, BH - MG, 31310-370 – Phone: +55 (31) 2514-8733 – E-mail: info@bnaconsultoria.com
|
GoldMining Inc.
NI 43-101 Report – São Jorge Project
|
Page 79 |
Figure 9.1 - Induce Polarization chargeability Map (100 m level) combining historic data (2011) and recent infill and extensions of the IP grid (2025 – 2026).
BNA Mining Solutions - R. Des. Leão Starling, 200 - Ouro Preto, BH - MG, 31310-370 – Phone: +55 (31) 2514-8733 – E-mail: info@bnaconsultoria.com
|
GoldMining Inc.
NI 43-101 Report – São Jorge Project
|
Page 80 |
The elevated chargeability values are attributed to the presence of variable abundances of pyrite in the deposit occurring as disseminations and stockwork veinlets. The elevated chargeability values continue along strike to the southeast from the known limits of the deposit into areas that are not extensively tested by diamond drilling.
9.2 Exploration Completed by GoldMining Inc.
GoldMining Inc. recommenced systematic exploration activities over the São Jorge property in 2024. GMI's exploration programs included:
| |
●
|
Expansion and infill of historic soil sampling grids to ensure systematic data coverage, including gold and multi-element assaying totalling over 6,000 samples, collected from July 2022 to June 2026 (Figure 9.2),
|
| |
●
|
A broad extension of the IP survey to the north and east of the deposit, including a number of infill lines to collect additional data resolution,
|
| |
●
|
Mapping and rock chip sampling program of natural outcrop and bedrock exposures within,
|
| |
●
|
Auger, RC and diamond core drilling programs were also completed in 2024-2026, primarily distal to the deposit to explore new targets areas, which are described in Chapter 10.
|
The soil sampling program delineated several targets comprising gold ± copper ± molybdenum ± silver soil geochemical anomalies distributed over a large 12 km x 7 km geochemical footprint surrounding the São Jorge deposit.
In addition to extending the São Jorge mineral system surrounding the deposit, the sampling program identified for the first time several copper ± molybdenum ± gold soil geochemical anomalies associated with distinct magnetic geophysical features suggestive of potential copper-porphyry style mineralization.
9.2.1 IP Infill and Extensions
Commencing in early 2025 the IP grid was expanded beyond the extent of the original 2011 survey, primarily to the north and east.
The survey was conducted by Geomag (a Wellfield Services subsidiary), the same company employed for the 2011 IP survey.
In the period between August 30th and November 13th, 2025, an IP survey was completed over the property totaling 56,950 linear metres of IP profiles, subsequently in the period between February 26th and April 25th, 2026, an IP survey was completed over the property totaling 40,000 linear metres of IP profiles.
The time domain Spectral Induced Polarization survey was performed along lines using the Dipole-Dipole arrangement with spacing of 150 m and advances of 50 m between stations. The survey equipment included a VIP4000 Transmitter in conjunction with IP Receiver ELREC- PRO – both from IRIS. The data was processed using the GEOSOFT Interactiv™ IP Processing System.
BNA Mining Solutions - R. Des. Leão Starling, 200 - Ouro Preto, BH - MG, 31310-370 – Phone: +55 (31) 2514-8733 – E-mail: info@bnaconsultoria.com
|
GoldMining Inc.
NI 43-101 Report – São Jorge Project
|
Page 81 |
Chargeability at the 100 m level is shown in Figure 9.1, which combines the 2025-2026 survey data with the historic 2011 data.
9.2.2 Soil Sampling Procedures and Parameters
At selected regions of interest, the sampling grid spacing ranges from 200 m x 100 m to 50 m x 50 m. Samples were collected using shovels excavating up to 30 cm deep to obtain material below the organic soil.
The samples were dried in the air and homogenized in the field. One representative sample, approximately 1 kg, was sent for laboratory analysis. The remaining material was stored until the final results were received and quality assurance (“QA”) and quality control (“QC”) procedures were completed.
The samples were sent to the SGS Geosol Laboratórios Ltda. (“SGS”) that is located in Vespasiano, Minas Gerais, Brazil. The samples were then dried at 105º C, crushed to 3 mm, homogenized, quartered, and an aliquot of 250 g to 300 g was pulverized to 150 mesh in a steel mill. These were then analyzed for gold by the FAA505 method (fire assay with atomic absorption finish on 50 g of material) and for 33 other elements by the GE_ICP40Q method (multi-acid digestion with an inductively coupled plasma optical emission spectroscopy finish on 0.25 g of material).
SGS is a certified commercial laboratory and independent of GMI. GMI has implemented a quality assurance and quality control program for the sampling and analysis of drill core and auger samples, including duplicates, mineralized standards and blank samples for each batch of 100 samples.
9.2.3 Mapping and Rock Chip Sampling
Rock samples from natural outcrops and saprolite zones and quartz veins exposed in artisanal mine workings (“garimpos”) were collected during the surface sampling program. A total of 1,164 rock and saprolite samples have been collected (Figure 9.2).
Saprolite channel samples were collected along profiles on exposed vertical faces and across floors of garimpo workings. Several mineralized veins were identified in these zones, helping to delineate structural orientation and distribution of mineralization in the surrounding areas of the São Jorge deposit.
A total of 751 rock samples were analyzed for whole-rock geochemistry and 38 elements. The rock samples were sent to the SGS laboratory located in Goiâna, Goiás, Brazil, where they were dried at 105ºC, crushed to 3 mm, homogenized, quartered, and an aliquot of 250 g to 300 g was pulverized to 150 mesh in a steel mill. These were then analyzed for gold by the FAA505 method (fire assay with atomic absorption (“AA”) finish on 50 g of material) and ICP95A, determination by fusion with lithium metaborate – inductively coupled plasma optical emission spectroscopy (“ICP OES”) and loss on ignition test due to calcination of the sample at 1,000ºC.
BNA Mining Solutions - R. Des. Leão Starling, 200 - Ouro Preto, BH - MG, 31310-370 – Phone: +55 (31) 2514-8733 – E-mail: info@bnaconsultoria.com
|
GoldMining Inc.
NI 43-101 Report – São Jorge Project
|
Page 82 |
Figure 9.2 – Soil and rock grab sampling locations, combining historic data (2011) and recent infill and extensions of the IP grid (2025 – 2026)
BNA Mining Solutions - R. Des. Leão Starling, 200 - Ouro Preto, BH - MG, 31310-370 – Phone: +55 (31) 2514-8733 – E-mail: info@bnaconsultoria.com
|
GoldMining Inc.
NI 43-101 Report – São Jorge Project
|
Page 83 |
9.2.4 Surficial Geological Exploration preliminary conclusions
The combination of surficial and outcrop geology mapping, soil and rock chip geochemistry, and geophysics has helped with the interpretation of underlying primary geology across the São Jorge Project, and also the delineation, characterization and prioritization of exploration targets within the São Jorge mineral system.
The signature of the rock geochemistry permitted the identification of several different types of granitoids.
An excellent correlation was identified between the soil geochemistry and the subjacent rock geochemistry units, showing that is possible to separate the geological units using the soil geochemistry and geophysics.
It was also confirmed that the soil transportation of the anomalies is on the order of tens of metres, and the anomalies located in the soil may suggest relatively proximal bedrock sources.
Some elements, such as Mn, Fe, Cu, and As, are helpful for discriminating between the topsoil, transported lateritic horizons, and saprolite bedrock, where abrupt gradients can help identify the contacts between these units in the lateritized regolith profile.
Several target areas have been identified from a combination of elevated gold-in-soil, and/or rock grab sampling from outcrop or garimpos, and/or IP geophysical (chargeability) anomalies. Figure 9.3 summarizes the exploration prospects identified to date within approximately 5 km radius of the São Jorge deposit, some of which have returned positive drilling results from initial drill testing (see Section 10) completed to date.
BNA Mining Solutions - R. Des. Leão Starling, 200 - Ouro Preto, BH - MG, 31310-370 – Phone: +55 (31) 2514-8733 – E-mail: info@bnaconsultoria.com
|
GoldMining Inc.
NI 43-101 Report – São Jorge Project
|
Page 84 |
Figure 9.3 – Exploration targets within a 5km radius
BNA Mining Solutions - R. Des. Leão Starling, 200 - Ouro Preto, BH - MG, 31310-370 – Phone: +55 (31) 2514-8733 – E-mail: info@bnaconsultoria.com
|
GoldMining Inc.
NI 43-101 Report – São Jorge Project
|
Page 85 |
Several drilling programs have been carried out on the property by the various claim owners. The historical drilling completed on the entire Property is documented in Section 6 (‘History’) of this report. As of June 9, 2026, a total of 934 drill holes have been completed on the property totalling 55,974 m in length (Table 10.1, Figure 10.1). These drilling programs include diamond drill holes (“DDH”) and auger drill holes and Reverse Circulation (“RC”) drill holes (Figure 10.2).
Table 10.1 - Summary of drilling completed at the São Jorge Project
|
Company
|
Years
|
Drilling Type
|
No. of Holes
|
Metres
Completed
|
|
Rio Tinto
|
1993 to 1995
|
DDH
|
26
|
4,391
|
|
Talon Metals Corp. / BrazMin Corp
|
2005 & 2006
|
DDH
|
84
|
18,392
|
|
Brazil Gold Corporation
|
2011
|
Auger
DDH
|
202
39
|
1,868
14,747
|
|
GoldMining Inc.
|
2024
|
Auger
DDH
|
206
5
|
3,098
1,077
|
|
GoldMining Inc.
|
2025
|
Auger
RC
DDH
|
223
84
15
|
2,143
3,258
3,862
|
|
GoldMining Inc.
|
2026
|
RC
|
50
|
2,958
|
|
Total
|
|
|
934
|
55,794
|
BNA Mining Solutions - R. Des. Leão Starling, 200 - Ouro Preto, BH - MG, 31310-370 – Phone: +55 (31) 2514-8733 – E-mail: info@bnaconsultoria.com
|
GoldMining Inc.
NI 43-101 Report – São Jorge Project
|
Page 86 |
Figure 10.1 - Drill hole location map by Company to June 9, 2026
BNA Mining Solutions - R. Des. Leão Starling, 200 - Ouro Preto, BH - MG, 31310-370 – Phone: +55 (31) 2514-8733 – E-mail: info@bnaconsultoria.com
|
GoldMining Inc.
NI 43-101 Report – São Jorge Project
|
Page 87 |
Figure 10.2 - Diamond drill hole and auger drill hole locations
BNA Mining Solutions - R. Des. Leão Starling, 200 - Ouro Preto, BH - MG, 31310-370 – Phone: +55 (31) 2514-8733 – E-mail: info@bnaconsultoria.com
|
GoldMining Inc.
NI 43-101 Report – São Jorge Project
|
Page 88 |
|
10.2
|
Drilling, Logging, and Sampling Procedures
|
Auger drilling is used as a first pass deep geochemical exploration tool to test the surficial geochemical profile from surface to the top of bedrock, with the primary objective to identify placer gold horizons in the transported material, and the potential bedrock source of surface geochemical anomalies. GMI completed an auger drilling program comprising 206 holes for a total length of approximately 3,098 m between April 2024 and November 2024, and 223 holes for a total length of approximately 2,143 m between July 2025 and September 2025.
The 2024 auger drilling program targeted primarily the high-priority ‘William South’ area located approximately two km north of the São Jorge deposit. The William South area comprises a broad high-tenor zone of anomalous gold-in-soil samples, measuring approximately 2 km x 2 km (Figure 10.3). The auger program confirmed multiple contiguous primary gold anomalies in the shallow saprolite zones below the surface soil anomalies. The auger program indicated multiple contiguous primary gold anomalies in the shallow saprolite zones below the surface soil anomalies.
The 2025 auger drilling program targeted numerous surface geochemical anomalies throughout the property and areas of previous garimpeiro activity to test for shallow placer mineralization which could be traced back to a potential bedrock source.
The auger drilling programs were completed by Geoscan Consulting utilizing a diesel powered 20 cm diameter rotary drill head capable of penetrating to depths of 15 m to 20 m, with vertical drill holes completed on an approximately 25-50 m x 50 m grid pattern. A geologist or technician supervised the drilling, logged the drill cuttings, and discriminated between transported overburden from in situ weathered bedrock. Sampling is conducted at one metre intervals, with assaying being done with assay methods with detection limits of 5 parts per billion (“ppb”) Au. The drilling method is an open hole, therefore contamination and/or dilution of precious metal grades by material from higher in the hole is possible.
The one-metre auger sample intervals were dried in the air and homogenized in the field and a representative sample of 1 kg from each sample interval was sent for analysis. The remaining material was stored until the final results were received and QA/QC was completed.
A summary of the significant intersections encountered in the 2024 and 2025 auger holes is provided in Table 10.2
The SLR QP recommends that exploration drilling be carried out to search for bedrock sources of the gold mineralization discovered by GMI’s auger drilling program in the William South area.
BNA Mining Solutions - R. Des. Leão Starling, 200 - Ouro Preto, BH - MG, 31310-370 – Phone: +55 (31) 2514-8733 – E-mail: info@bnaconsultoria.com
|
GoldMining Inc.
NI 43-101 Report – São Jorge Project
|
Page 89 |
Figure 10.3 - Auger hole location map
BNA Mining Solutions - R. Des. Leão Starling, 200 - Ouro Preto, BH - MG, 31310-370 – Phone: +55 (31) 2514-8733 – E-mail: info@bnaconsultoria.com
|
GoldMining Inc.
NI 43-101 Report – São Jorge Project
|
Page 90 |
Table 10.2 - List of significant intersections from the 2024 & 2025 auger drilling program
|
Auger Hole
|
From
|
To
|
Interval
(m)
|
Au
g/t)
|
|
Auger Hole
|
From
|
To
|
Interval
(m)
|
Au g/t)
|
|
SJTRD-047-24
|
0
|
7
|
7
|
0.20
|
|
SJTRD-150-24
|
2
|
4
|
2
|
0.17
|
|
SJTRD-049-24
|
3
|
4
|
1
|
0.17
|
|
SJTRD-151-24
|
4
|
5
|
1
|
0.15
|
|
SJTRD-051-24
|
3
|
4
|
1
|
0.31
|
|
SJTRD-151-24
|
6
|
7
|
1
|
0.12
|
|
SJTRD-054-24
|
9
|
10
|
1
|
0.22
|
|
SJTRD-152-24
|
9
|
10
|
1
|
0.26
|
|
SJTRD-055-24
|
0
|
1
|
1
|
0.29
|
|
SJTRD-153-24
|
3
|
4
|
1
|
0.16
|
|
SJTRD-055-24
|
10
|
11
|
1
|
0.96
|
|
SJTRD-155-24
|
0
|
1
|
1
|
0.18
|
|
SJTRD-057-24
|
1
|
2
|
1
|
0.76
|
|
SJTRD-156-24
|
4
|
5
|
1
|
0.33
|
|
SJTRD-060-24
|
0
|
1
|
1
|
0.62
|
|
SJTRD-158-24
|
5
|
6
|
1
|
0.12
|
|
SJTRD-061-24
|
3
|
7
|
4
|
0.19
|
|
SJTRD-160-24
|
4
|
5
|
1
|
0.34
|
|
SJTRD-065-24
|
0
|
1
|
1
|
0.14
|
|
SJTRD-162-24
|
2
|
8
|
6
|
0.33
|
|
SJTRD-066-24
|
0
|
2
|
2
|
0.13
|
|
including
|
6
|
7
|
1
|
0.80
|
|
SJTRD-067-24
|
3
|
9
|
6
|
0.22
|
|
SJTRD-163-24
|
5
|
9
|
4
|
0.17
|
|
including
|
4
|
5
|
1
|
0.73
|
|
SJTRD-166-24
|
0
|
1
|
1
|
0.13
|
|
SJTRD-068-24
|
2
|
3
|
1
|
0.82
|
|
SJTRD-166-24
|
11
|
12
|
1
|
0.71
|
|
SJTRD-070-24
|
0
|
1
|
1
|
0.11
|
|
SJTRD-167-24
|
11
|
12
|
1
|
0.35
|
|
SJTRD-072-24
|
3
|
4
|
1
|
0.12
|
|
SJTRD-169-24
|
5
|
8
|
3
|
0.18
|
|
SJTRD-073-24
|
3
|
5
|
2
|
0.50
|
|
SJTRD-170-24
|
1
|
2
|
1
|
0.47
|
|
including
|
4
|
5
|
1
|
0.82
|
|
SJTRD-170-24
|
13
|
15
|
2
|
0.42
|
|
SJTRD-076-24
|
0
|
1
|
1
|
2.33
|
|
including
|
14
|
15
|
1
|
0.59
|
|
SJTRD-077-24
|
7
|
8
|
1
|
3.05
|
|
SJTRD-171-24
|
6
|
7
|
1
|
0.36
|
|
SJTRD-079-24
|
4
|
5
|
1
|
0.12
|
|
SJTRD-172-24
|
12
|
13
|
1
|
0.11
|
|
SJTRD-080-24
|
5
|
6
|
1
|
0.18
|
|
SJTRD-178-24
|
0
|
1
|
1
|
0.15
|
|
SJTRD-081-24
|
4
|
5
|
1
|
0.33
|
|
SJTRD-178-24
|
4
|
5
|
1
|
0.19
|
|
SJTRD-082-24
|
8
|
10
|
2
|
1.29
|
|
SJTRD-179-24
|
4
|
9
|
5
|
0.27
|
|
including
|
8
|
9
|
1
|
2.03
|
|
SJTRD-180-24
|
7
|
8
|
1
|
0.31
|
|
SJTRD-082-24
|
12
|
14
|
2
|
8.79
|
|
SJTRD-180-24
|
14
|
15
|
1
|
0.15
|
|
including
|
12
|
13
|
1
|
17.14
|
|
SJTRD-182-24
|
2
|
3
|
1
|
0.11
|
|
SJTRD-084-24
|
17
|
18
|
1
|
0.92
|
|
SJTRD-182-24
|
5
|
6
|
1
|
0.10
|
|
SJTRD-085-24
|
1
|
2
|
1
|
0.49
|
|
SJTRD-187-24
|
10
|
15
|
5
|
2.78
|
|
SJTRD-086-24
|
3
|
7
|
4
|
2.45
|
|
including
|
12
|
13
|
1
|
3.91
|
|
including
|
6
|
7
|
1
|
8.01
|
|
including
|
13
|
14
|
1
|
3.90
|
|
SJTRD-086-24
|
16
|
17
|
1
|
0.37
|
|
including
|
14
|
15
|
1
|
3.93
|
|
SJTRD-087-24
|
2
|
3
|
1
|
0.18
|
|
SJTRD-188-24
|
0
|
1
|
1
|
0.13
|
|
SJTRD-089-24
|
4
|
5
|
1
|
0.12
|
|
SJTRD-194-24
|
5
|
6
|
1
|
0.18
|
|
SJTRD-090-24
|
1
|
2
|
1
|
0.13
|
|
SJTRD-196-24
|
3
|
6
|
3
|
0.35
|
BNA Mining Solutions - R. Des. Leão Starling, 200 - Ouro Preto, BH - MG, 31310-370 – Phone: +55 (31) 2514-8733 – E-mail: info@bnaconsultoria.com
|
GoldMining Inc.
NI 43-101 Report – São Jorge Project
|
Page 91 |
|
Auger Hole
|
From
|
To
|
Interval
(m)
|
Au
g/t)
|
|
Auger Hole
|
From
|
To
|
Interval
(m)
|
Au g/t)
|
|
SJTRD-090-24
|
9
|
12
|
3
|
0.33
|
|
including
|
3
|
4
|
1
|
0.85
|
|
including
|
9
|
10
|
1
|
0.83
|
|
SJTRD-197-24
|
0
|
2
|
2
|
0.30
|
|
SJTRD-091-24
|
0
|
5
|
5
|
0.16
|
|
SJTRD-197-24
|
7
|
8
|
1
|
0.18
|
|
SJTRD-091-24
|
9
|
11
|
2
|
1.47
|
|
SJTRD-197-24
|
12
|
15
|
3
|
1.05
|
|
SJTRD-092-24
|
3
|
7
|
4
|
0.23
|
|
including
|
13
|
14
|
1
|
2.33
|
|
including
|
3
|
4
|
1
|
0.65
|
|
SJTRD-198-24
|
0
|
4
|
4
|
0.55
|
|
SJTRD-094-24
|
1
|
2
|
1
|
0.26
|
|
SJTRD-199-24
|
2
|
3
|
1
|
0.22
|
|
SJTRD-094-24
|
5
|
7
|
2
|
0.28
|
|
SJTRD-204-24
|
3
|
10
|
7
|
0.33
|
|
SJTRD-096-24
|
9
|
10
|
1
|
0.28
|
|
SJTRD-204-24
|
13
|
15
|
2
|
0.14
|
|
SJTRD-098-24
|
6
|
8
|
2
|
0.37
|
|
SJTRD-205-24
|
0
|
2
|
2
|
0.15
|
|
SJTRD-099-24
|
2
|
3
|
1
|
0.32
|
|
SJTRD-205-24
|
10
|
14
|
4
|
0.18
|
|
SJTRD-107-24
|
5
|
7
|
2
|
0.13
|
|
SJTRD-209-24
|
2
|
3
|
1
|
0.11
|
|
SJTRD-108-24
|
1
|
2
|
1
|
0.16
|
|
SJTRD-210-24
|
0
|
1
|
1
|
0.10
|
|
SJTRD-108-24
|
10
|
11
|
1
|
0.10
|
|
SJTRD-210-24
|
2
|
3
|
1
|
0.10
|
|
SJTRD-109-24
|
9
|
10
|
1
|
0.11
|
|
SJTRD-210-24
|
13
|
15
|
2
|
0.16
|
|
SJTRD-110-24
|
7
|
8
|
1
|
0.21
|
|
SJTRD-211-24
|
5
|
6
|
1
|
0.30
|
|
SJTRD-112-24
|
5
|
6
|
1
|
0.12
|
|
SJTRD-214-24
|
0
|
1
|
1
|
0.15
|
|
SJTRD-113-24
|
0
|
1
|
1
|
0.55
|
|
SJTRD-214-24
|
8
|
9
|
1
|
0.17
|
|
SJTRD-113-24
|
10
|
11
|
1
|
0.17
|
|
SJTRD-215-24
|
0
|
1
|
1
|
0.21
|
|
SJTRD-114-24
|
2
|
3
|
1
|
0.28
|
|
SJTRD-216-24
|
0
|
3
|
3
|
0.21
|
|
SJTRD-115-24
|
1
|
2
|
1
|
0.15
|
|
SJTRD-217-24
|
0
|
1
|
1
|
0.19
|
|
SJTRD-116-24
|
2
|
3
|
1
|
0.29
|
|
SJTRD-217-24
|
4
|
5
|
1
|
0.77
|
|
SJTRD-117-24
|
0
|
2
|
2
|
0.35
|
|
SJTRD-219-24
|
0
|
1
|
1
|
0.18
|
|
SJTRD-117-24
|
4
|
6
|
2
|
0.14
|
|
SJTRD-220-24
|
4
|
5
|
1
|
0.86
|
|
SJTRD-118-24
|
0
|
7
|
7
|
0.12
|
|
SJTRD-223-24
|
15
|
16
|
1
|
0.11
|
|
SJTRD-119-24
|
3
|
5
|
2
|
0.65
|
|
SJTRD-228-24
|
9
|
10
|
1
|
0.55
|
|
including
|
4
|
5
|
1
|
0.78
|
|
SJTRD-230-24
|
3
|
4
|
1
|
0.42
|
|
SJTRD-120-24
|
3
|
4
|
1
|
0.10
|
|
SJTRD-237-24
|
0
|
1
|
1
|
0.25
|
|
SJTRD-121-24
|
5
|
6
|
1
|
0.14
|
|
SJTRD-242-24
|
0
|
2
|
2
|
0.21
|
|
SJTRD-121-24
|
8
|
9
|
1
|
0.11
|
|
SJTRD-248-24
|
0
|
1
|
1
|
0.11
|
|
SJTRD-122-24
|
2
|
7
|
5
|
0.34
|
|
SJTRD-248-24
|
4
|
5
|
1
|
0.23
|
|
including
|
2
|
3
|
1
|
0.99
|
|
SJTRD-251-24
|
14
|
15
|
1
|
0.11
|
|
SJTRD-123-24
|
5
|
6
|
1
|
0.33
|
|
SJTRD-257-24
|
1
|
12
|
11
|
0.22
|
|
SJTRD-124-24
|
0
|
1
|
1
|
0.25
|
|
including
|
10
|
11
|
1
|
0.57
|
|
SJTRD-124-24
|
4
|
5
|
1
|
0.19
|
|
SJTRD-275-25
|
4
|
7
|
3
|
0.24
|
|
SJTRD-124-24
|
10
|
12
|
2
|
2.12
|
|
SJTRD-276-25
|
12
|
13
|
1
|
0.12
|
|
including
|
10
|
11
|
1
|
3.78
|
|
SJTRD-277-25
|
7
|
8
|
1
|
0.22
|
|
SJTRD-125-24
|
3
|
4
|
1
|
0.40
|
|
SJTRD-286-25
|
4
|
9
|
5
|
0.24
|
|
SJTRD-128-24
|
13
|
14
|
1
|
0.78
|
|
SJTRD-296-25
|
2
|
3
|
1
|
0.22
|
|
SJTRD-129-24
|
14
|
15
|
1
|
0.10
|
|
SJTRD-297-25
|
4
|
5
|
1
|
0.12
|
BNA Mining Solutions - R. Des. Leão Starling, 200 - Ouro Preto, BH - MG, 31310-370 – Phone: +55 (31) 2514-8733 – E-mail: info@bnaconsultoria.com
|
GoldMining Inc.
NI 43-101 Report – São Jorge Project
|
Page 92 |
|
Auger Hole
|
From
|
To
|
Interval
(m)
|
Au
g/t)
|
|
Auger Hole
|
From
|
To
|
Interval
(m)
|
Au
g/t)
|
|
SJTRD-134-24
|
4
|
5
|
1
|
0.22
|
|
SJTRD-299-25
|
1
|
2
|
1
|
0.60
|
|
SJTRD-139-24
|
0
|
1
|
1
|
0.25
|
|
SJTRD-305-25
|
4
|
6
|
2
|
0.21
|
|
SJTRD-139-24
|
6
|
7
|
1
|
0.36
|
|
SJTRD-333-25
|
5
|
6
|
1
|
0.24
|
|
SJTRD-140-24
|
2
|
5
|
3
|
0.18
|
|
SJTRD-356-25
|
2
|
3
|
1
|
0.13
|
|
SJTRD-143-24
|
0
|
1
|
1
|
0.17
|
|
SJTRD-367-25
|
2
|
3
|
1
|
0.10
|
|
SJTRD-144-24
|
2
|
3
|
1
|
0.25
|
|
SJTRD-374-25
|
0
|
1
|
1
|
0.32
|
|
SJTRD-147-24
|
14
|
15
|
1
|
10.20
|
|
SJTRD-391-25
|
1
|
2
|
1
|
0.25
|
|
SJTRD-148-24
|
3
|
7
|
4
|
0.13
|
|
SJTRD-418-25
|
7
|
8
|
1
|
1.52
|
|
SJTRD-149-24
|
0
|
1
|
1
|
0.15
|
|
10.2.2 Diamond Drilling
In 2024 GMI completed diamond core drilling program comprising five drill holes and totalling approximately 1,077 m in length (May to September 2024). The objective of this drilling program was to primarily target the São Jorge deposit and its potential extension along strike to the northwest.
In 2025 GMI completed diamond core drilling program comprising fifteen drill holes and totalling approximately 3,862 m in length (from April to July 2025). The objective of this drilling program was to target potential extensions of the São Jorge deposit at depth and along strike to the southeast and northwest, and to test additional new target areas such as William South.
The proposed drill hole collar locations for GMI’s 2024-2025 diamond drilling campaigns were marked in the field by the geologist and field technicians using a handheld GPS unit. A wooden picket, marked with the drill hole number and orientation, was placed at the site of the proposed drill hole, and foresight and backsight pickets were also put into place to help in the alignment of the diamond drill. The drilling rig was then brought to a level orientation over the location of the proposed drill collar and aligned to the foresight and backsight pickets. The dip of the hole was set using an adjustable, graduated leveling device that had a precision of one degree.
The diamond drill holes were completed by Layne do Brasil Sondagens S/A using a wireline drill rig model CS10-358, having a depth capacity for 400 m using NQ2 diameter bits. Sample recovery data is collected during the core preparation workflow. The São Jorge deposit is hosted in a competent monzogranite with a saprolite cover, with recovery averaging approximately 97% across both units (Figure 10.4).
BNA Mining Solutions - R. Des. Leão Starling, 200 - Ouro Preto, BH - MG, 31310-370 – Phone: +55 (31) 2514-8733 – E-mail: info@bnaconsultoria.com
|
GoldMining Inc.
NI 43-101 Report – São Jorge Project
|
Page 93 |
Figure 10.4 - Typical drill core recovery
Source: GMI 2024.
Note: Hole SJD-120-24, 95.0 m – 132 m: 2.26 g/t Au / 37.00 m
Drill hole collars were spotted using handheld Garmin GPS units. No final survey, or collar checks were completed. All collar data accuracy from the 2024 program is estimated to be +/‑3 m horizontally and +/-5 m vertically. Following completion of the drill hole, the location of the collar was marked with a wooden picket that was marked with the drill hole number. The drill hole collar locations were determined using the UTM SAD69 Zone 21S EPSG:5531 datum relative to four topographic control points that have been established on the property.
Downhole surveying of the drill hole deviation was conducted by the drilling contractor using a Reflex Sprint Gyro tool. Single shots were taken approximately every 30 m to 50 m downhole during drilling, and a continuous in/out survey (3 m station intervals) was completed at the end of the hole. No secondary downhole surveys were completed to verify the accuracy or calibration of the tool in use. A magnetic declination of 19° was applied. The drill core was delivered to a secured core logging facility once per day where it was prepared for processing.
BNA Mining Solutions - R. Des. Leão Starling, 200 - Ouro Preto, BH - MG, 31310-370 – Phone: +55 (31) 2514-8733 – E-mail: info@bnaconsultoria.com
|
GoldMining Inc.
NI 43-101 Report – São Jorge Project
|
Page 94 |
At the core shack, the core was re-aligned by the geologist to a consistent orientation and was measured to confirm the accuracy of the depth markers placed in the core boxes by the diamond drilling crews. The core was then examined, and the depths of geological, structural, or alteration features were marked onto the core using a wax marker. An examination of the distribution of magnetic intensity of the drill core was conducted using a hand-held pen magnet. Subsequently, the rock quality determination (“RQD”) and joint/fracturing intensity of the core was determined by a geological technician at a nominal interval of three metres. Figure 10.5 shows the core processing workflow used at São Jorge. Spot checks for data completeness and accuracy were carried out throughout the project to ensure consistent data collection throughout the program. Descriptions of the lithologies, alteration styles and intensities, structural features, occurrences and orientations of quartz veins or sulphide veins and the style, amount and distribution of sulphide minerals were then recorded in the diamond drill logs by the logging geologist. Drill hole logs were backed up periodically throughout the program from the cloud to the GMI’s servers.
Figure 10.5 - Core Logging Workflow
The 2024 diamond drilling program was successful in confirming the interpreted location of the gold mineralization within the São Jorge deposit (DDH SJD-120-24), locating the northwestern strike extension of the mineralized zone (DDH SJD-122-24), intersecting the gold mineralization along a parallel mineralized zone located to the northwest of the main mineralized trend (DDH SJD-121-24), and intersecting previously untested mineralized zone (DDH SJD-123-24).
The 2025 diamond drilling program was successful in intersecting mineralization beneath the mineral resource estimate (see Section 14) constraining pit shell and delivered intersected mineralization in follow-up drilling on the potential continuation of mineralization along strike of the São Jorge Deposit to the northwest.
BNA Mining Solutions - R. Des. Leão Starling, 200 - Ouro Preto, BH - MG, 31310-370 – Phone: +55 (31) 2514-8733 – E-mail: info@bnaconsultoria.com
|
GoldMining Inc.
NI 43-101 Report – São Jorge Project
|
Page 95 |
A summary of the significant intersections encountered in the 2024 and 2025 drill holes is provided in Table 10.3.
Table 10.3 - Summary of GMI significant intersections in the 2024 and 2025 São Jorge diamond core drilling program
|
Hole ID
|
From
|
To
|
Core Length
(m)
|
Uncapped
Average Grade
(g/t Au)
|
Capped Average
Grade
(g/t Au)
|
|
SJD-120-24
|
44.00
|
207.00
|
163.00
|
1.02
|
1.02
|
|
Incl.
|
44.00
|
64.00
|
20.00
|
1.37
|
1.37
|
|
and
|
95.00
|
132.00
|
37.00
|
2.26
|
2.26
|
|
and
|
148.00
|
159.00
|
11.00
|
1.00
|
1.00
|
|
and
|
166.00
|
179.00
|
13.00
|
1.35
|
1.35
|
|
and
|
195.00
|
207.00
|
12.00
|
1.15
|
1.15
|
|
SJD-121-24
|
82.00
|
103.00
|
21.00
|
0.61
|
0.61
|
|
SJD-122-24
|
67.00
|
75.00
|
8.00
|
2.64
|
2.56
|
|
SJD-123-24
|
93.00
|
103.00
|
10.00
|
0.66
|
0.66
|
|
SJD-133-25
|
10.00
|
13.00
|
3.00
|
1.10
|
1.10
|
|
and
|
45.00
|
46.00
|
1.00
|
1.15
|
1.15
|
|
SJD-136-25
|
422.00
|
495.00
|
73.00
|
0.54
|
0.54
|
|
Incl.
|
425.00
|
444.00
|
19.00
|
1.00
|
1.00
|
|
SJD-138-25
|
103.00
|
107.00
|
4.00
|
0.80
|
0.80
|
|
and
|
175.00
|
176.00
|
1.00
|
1.25
|
1.25
|
Notes:
True widths are estimated to range from 70% to 90% of the core lengths.
Capped average grades use a capping value of 15 g/t Au.
10.2.3 Drill Core Resampling Program
In 2021, GMI carried out a 14 hole confirmatory assay program of existing unsampled core intervals from previous drilling programs. Results indicated that the previously un-sampled intervals were variably mineralized, principally comprising low to nil or marginal (below cut-off) gold grades. Exception with the results of an interval of weak to moderate alteration and mineralization within a previously unsampled interval from 50.0 m to 70.0 m in hole SJD-094-11 and extensive sections of SJD-058-06 from 140.0 to 259.0 m, which was drilled as a twinned hole next to SJD-058A-06 with the majority of the hole previously un-sampled that contained extensive sections of strongly altered and mineralized materials.
The complete assay results also delineated mineralized saprolite intervals that were not only previously un-sampled but, importantly, located at the surface and outside of any known mineralization or resource models
10.2.4 RC Drilling Program
In 2025, GMI completed a reverse circulation (“RC”) drilling program comprising 84 drill holes and totalling approximately 3,528 m in length (from June to December 2024). The objective of this drilling program was to undertake systematic exploration across numerous gold-in-soil and /or geophysical anomalies across the São Jorge property. The program successfully delineated mineralization at four new gold prospects, including at the William South prospect located approximately 1.5 km north of the existing São Jorge deposit.
BNA Mining Solutions - R. Des. Leão Starling, 200 - Ouro Preto, BH - MG, 31310-370 – Phone: +55 (31) 2514-8733 – E-mail: info@bnaconsultoria.com
|
GoldMining Inc.
NI 43-101 Report – São Jorge Project
|
Page 96 |
RC drilling was performed by Drillbell Sondagens LTDA., utilizing a hydraulic DTH drill rig, all drillholes were inclined (60 degrees). Collars were located with handheld GPS (Garming eTrex 32x), after completion the locations were marked with cement blocks and metal plates registering the identification of the hole and its coordinates.
In 2026, GMI completed follow-up RC drilling comprising 50 drill holes and totalling approximately 2,958 m in length (from January 1 to June 9, 2026 (PEA Effective Date). The objective of this drilling program was to undertake systematic follow-up of previous positive exploration results across numerous gold-in-soil and /or geophysical anomalies across the São Jorge property.
A summary of the significant intersections encountered in the 2025 drill holes is provided in Table 10.4.
Table 10.4 - Summary of GMI significant RC drilling intersections in the 2025 São Jorge drilling program
|
Hole ID
|
From
|
To
|
Core Length
(m)
|
Uncapped
Average Grade
(g/t Au)
|
Capped Average
Grade
(g/t Au)
|
|
SJRC-004-25
|
19.00
|
23.00
|
4.00
|
1.76
|
1.76
|
|
including
|
19.00
|
20.00
|
1.00
|
5.98
|
5.98
|
|
SJRC-006-25
|
2.00
|
3.00
|
1.00
|
3.08
|
3.08
|
|
SJRC-032-25
|
49.00
|
50.00 (EOH)
|
1.00
|
2.90
|
2.90
|
|
SJRC-033-25
|
44.00
|
45.00
|
1.00
|
1.75
|
1.75
|
|
SJRC-043-25
|
4.00
|
5.00
|
1.00
|
1.06
|
10.6
|
|
SJRC-046-25
|
12.00
|
16.00
|
4.00
|
1.78
|
1.78
|
|
SJRC-047-25
|
16.00
|
17.00
|
1.00
|
1.23
|
1.23
|
|
SJRC-048-25
|
13.00
|
25.00
|
12.00
|
2.38
|
1.79
|
|
including
|
16.00
|
17.00
|
1.00
|
4.86
|
4.86
|
|
including
|
17.00
|
18.00
|
1.00
|
22.08
|
15.00
|
|
SJRC-049-25
|
46.00
|
50.00
|
4.00
|
1.11
|
1.11
|
For the RC drilling program, samples were collected at 1 m sample intervals, generating approximately 25 kg samples, with the material being dried, homogenized and split in the field to obtain a 1 kg representative sample which was sent to SGS for analysis. The remaining RC sample material is stored until the lab results are received, and approximately 20 kg of the original samples are maintained in the archive.
SGS is a certified commercial laboratory located in Vespasiano, Minas Gerais, Brazil, and is independent of GoldMining. GoldMining has implemented a quality assurance and quality control program for the sampling and analysis of drill core and auger samples, including duplicates, mineralized standards and blank samples for each batch of 100 samples. The gold analyses are completed by FAA505 method (fire-assay with an atomic absorption finish on 50 grams of material).
BNA Mining Solutions - R. Des. Leão Starling, 200 - Ouro Preto, BH - MG, 31310-370 – Phone: +55 (31) 2514-8733 – E-mail: info@bnaconsultoria.com
|
GoldMining Inc.
NI 43-101 Report – São Jorge Project
|
Page 97 |
|
11
|
Sample Preparation, Analyses, and Security
|
|
11.1
|
Sample Preparation and Analysis
|
The samples from the auger drilling program were sent to the SGS laboratory in Vespasiano, Brazil, where they were dried at 105°C, crushed to 3 mm, homogenized, quartered, and an aliquot of 250g to 300g was pulverized to 150 mesh in a steel mill. These were then analyzed for gold by the FAA505 method (fire assay with AA finish on 50 grams of material) and for 33 other elements by the GE_ICP40Q method (multi-acid digestion with an inductively coupled plasma optical emission spectroscopy [“IES OES”] finish on 0.25 grams of material).
SGS is a certified commercial laboratory under ISO:IEC Standard 17025:2017 for gold analysis and independent of GMI. GMI has implemented a quality assurance and quality control program for the sampling and analysis of drill core and auger samples, including duplicates, mineralized standards, and blank samples for each batch of 100 samples.
|
11.1.2
|
Diamond Drill Holes
|
The logging geologist marked off those sections of the drill hole to be sampled using a wax crayon and the core was then forwarded to the core technician for sample cutting. In general, the entire length of the diamond drill holes completed in 2024 were selected for sampling using a nominal sample length of one metre. Care was taken to ensure that the samples corresponded to either geological or alteration intervals present in the core. Aside from occasional intervals of fault gouge and blocky core in the drill holes no drilling, sampling, or recovery factors were encountered that would materially impact the accuracy and reliability of the analytical results from samples of the drill holes. The drill core provides samples of high quality, which were representative of any alteration, veining, or sulphide accumulations that were intersected by the drill hole. No factors were identified which may have resulted in a sample bias.
The core was then transferred to the core technician who proceeded to separate the core into two halves by means of cutting the samples using an electrical core saw equipped with a diamond impregnated blade. One half of the core was placed into an 8-mil plastic bag and then forwarded to the assay laboratory. The remaining half core was placed back into the core box for storage and future reference. The core technician assigned an identification number to the sample using a uniquely numbered sample tag. One tag was placed into the assay sample bag, while the second tag was placed into the core box at the appropriate location. Once sufficient samples had accumulated, they were transported by GMI personnel from site to a trucking company in Novo Progresso, who then transported the samples to the sample receiving facilities of SGS, located in Goiâna, Goiás, Brazil, for sample preparation.
Once all the samples had been split, the remaining core was stored in a secure indoor location.
BNA Mining Solutions - R. Des. Leão Starling, 200 - Ouro Preto, BH - MG, 31310-370 – Phone: +55 (31) 2514-8733 – E-mail: info@bnaconsultoria.com
|
GoldMining Inc.
NI 43-101 Report – São Jorge Project
|
Page 98 |
Samples of cut drill core were delivered to the sample receiving facilities of SGS. Once received into the prep shop area, the samples were moved from the inspection table and individually placed, in sequence, into well cleaned pans on the large table. The samples were placed into drying ovens whose temperatures are set to a nominal temperature of 105ºC. Drying time varies with the amount of moisture in the sample, sample volume, and the type of sample. Core samples will normally be dry in one to three hours. After the samples in the oven are suitably dried, the sample pans are transferred in sequence onto a mobile steel rack. The rack is then moved to the crushing area.
Each of the samples is crushed to a minimum of 75% minus 3 mm. The operator makes a screen test on first crushed sample to ensure that the crushed sample material meets minimum size distribution requirements for splitting. Screen tests are conducted on a random basis from then on. A 250 g sample of crushed material is collected using a rotary divider and is then sent to the milling station, where the sample will be pulverized for to a minimum of 95% passing through a 150 mesh sieve. The sieve test is performed each shift on a test sample selected at random by the shift leader.
The pulp sample resulting from the preparation stage was then sent to the SGS laboratory in Vespasiano, Minas Gerais for analysis. SGS is independent of GMI. The gold content of all samples was determined using the fire assay / atomic absorption spectroscopy method (SGS method code FAA505). In addition, multi-element assaying was also carried out on all samples using Inductively Coupled Plasma (SGS method code GE-ICP40Q). SGS is certified under ISO:IEC Standard 17025:2017 for gold analysis.
11.1.3 Drill Core Resampling Program
The historical core resampling program samples were taken from the NQ/HQ core by sawing the drill core in half, with one-half sent to SGS and the other half retained for future reference. SGS is a certified commercial laboratory located in Goiâna, Goiás, Brazil. GMI implemented a stringent quality assurance and quality control (“QA/QC”) program for the sampling and analysis of drill core, which included insertion of duplicates, mineralized standards, and blank samples for each batch of 100 samples. The gold analyses were completed by fire-assays with an AA finish on 50 grams of material. Repeats were carried out by fire-assay.
Assays have been incorporated into the São Jorge Project database, with all assayed intervals replacing the previous unsampled intervals.
11.1.4 RC Drilling Program
For the RC drilling program, samples were collected at 1 m sample intervals, generating approximately 25 kg samples, with the material being dried, homogenized and split in the field to obtain a 1 kg representative sample which was sent to SGS for analysis. The remaining RC sample material is stored until the lab results are received, and approximately 20 kg of the original samples are maintained in the archive.
SGS is a certified commercial laboratory located in Vespasiano, Minas Gerais, Brazil, and is independent of GoldMining. GoldMining has implemented a quality assurance and quality control program for the sampling and analysis of drill core and auger samples, including duplicates, mineralized standards and blank samples for each batch of 100 samples. The gold analyses are completed by FAA505 method (fire-assay with an atomic absorption finish on 50 grams of material).
BNA Mining Solutions - R. Des. Leão Starling, 200 - Ouro Preto, BH - MG, 31310-370 – Phone: +55 (31) 2514-8733 – E-mail: info@bnaconsultoria.com
|
GoldMining Inc.
NI 43-101 Report – São Jorge Project
|
Page 99 |
11.2 Quality Assurance and Quality Control
Certified gold standards (Certified reference materials (“CRM”) or Standard reference material (“SRM“) were inserted every 20 samples, alternating with blank material every 20 samples. Standard material represented a variety of grades and material types. Pulp duplicate samples were selected approximately every 50 samples with preference biased towards material that appeared to be mineralized, where possible. The sample preparation workflow is illustrated in Figure 11.1.
Figure 11.1 - Drill Core Sampling Workflow
Eight CRMs were used to represent a range of Au grades from low grade (0.34 ppm Au) to high grade (7.92 ppm Au), as listed in Table 11.1.
BNA Mining Solutions - R. Des. Leão Starling, 200 - Ouro Preto, BH - MG, 31310-370 – Phone: +55 (31) 2514-8733 – E-mail: info@bnaconsultoria.com
|
GoldMining Inc.
NI 43-101 Report – São Jorge Project
|
Page 100 |
Table 11.1 - List of Certified Reference Materials
| |
SRM ID
|
Accepted Value
(g/t Au)
|
+2SD g/t Au
|
-2SD g/t Au
|
|
High Grade
|
ITAKA-678 CRM
|
7.92
|
8.36
|
7.48
|
|
High Grade
|
OREAS 17C
|
3.04
|
3.21
|
2.87
|
|
Low Grade
|
OREAS 52C
|
0.346
|
0.379
|
0.312
|
|
High Grade
|
OREAS 54PA
|
2.90
|
3.12
|
2.68
|
|
Low Grade
|
OxE86
|
0.613
|
0.655
|
0.571
|
|
Medium Grade
|
OxH55
|
1.282
|
1.358
|
1.206
|
|
Low Grade
|
SE58
|
0.607
|
0.645
|
0.569
|
|
Medium Grade
|
SG56
|
1.027
|
1.093
|
0.961
|
Notes: SD standard deviation.
Blank material used for laboratory QA/QC checks was collected from a local outcrop which was known to be barren of gold grades.
During 2024, a total of 123 blanks and standards (61 and 62, respectively) were inserted into sample shipments to test the precision and consistency of the SGS laboratories. There were a total of five failures where a standard returned a gold assay value 3 standard deviations (“SD”) above or below certified values. Four of these failures resulted in the surrounding material (+/- 5 samples) being sent for re-assay, with no appreciable changes being recognized between the original assay certificates and the re-assay results. The fifth outstanding failure was not sent for re-assay after inspection of the surrounding results determined that there was little risk to significant material contamination or over/under estimation.
An example of a CRM control chart is presented in Figure 11.2 and the blank control chart is presented in Figure 11.3. With regards to the blank control chart, assay values returning below detection limit were reported as -0.005 ppm Au by SGS. Gold values below the detection limit were converted to positive values at half the detection limit (0.0025 ppm Au), for the purposes of numerical comparison.
Figure 11.2 - Control Chart for Certified Reference Material SE58
BNA Mining Solutions - R. Des. Leão Starling, 200 - Ouro Preto, BH - MG, 31310-370 – Phone: +55 (31) 2514-8733 – E-mail: info@bnaconsultoria.com
|
GoldMining Inc.
NI 43-101 Report – São Jorge Project
|
Page 101 |
Figure 11.3 - Control Chart for Coarse Blank Material
In the QP’s opinion, the sample preparation, analysis, and security procedures at São Jorge are adequate for use in the estimation of Mineral Resources.
BNA Mining Solutions - R. Des. Leão Starling, 200 - Ouro Preto, BH - MG, 31310-370 – Phone: +55 (31) 2514-8733 – E-mail: info@bnaconsultoria.com
|
GoldMining Inc.
NI 43-101 Report – São Jorge Project
|
Page 102 |
Data verification related to the geological database, exploration data, geological interpretations, and the Mineral Resource Estimate was completed by Mr. Reno Pressacco, P.Geo., SLR Associate Principal Geologist, the Qualified Person responsible for the Mineral Resource Estimate presented in this Technical Report.
Mr. Reno Pressacco (“SLR QP”) carried out a site visit to the São Jorge Project on May 3, 2024, and May 4, 2024. During the site visit, he examined existing site infrastructure and access, observed the topographic control points present, visited the location of the diamond drill rig to observe the drilling procedures and equipment used, reviewed a selection of mineralized intersections and the host rocks in drill core, and observed the surface expression of the strike projection of the mineralized corridor.
During the site visit, he was accompanied by Mr. Paulo Pereira, President, GoldMining Inc. and Logan Boyce, Senior Geologist – Americas, GoldMining Inc.
The SLR QP carried out a program of validating the historical digital drill hole database by means of spot checking the assay results for a selection of drill holes that intersected the mineralized wireframe domains, thus relevant to the Mineral Resource estimate. The assay results in the drill hole database for all diamond drill holes completed during the 2024 drilling campaign were confirmed by cross checking with the certificates supplied to the SLR QP directly from the assay laboratory.
In addition, a number of standard data integrity checks were performed by the software programs on the drill hole database such as:
| |
●
|
Intervals exceeding the total hole length (from–to problem)
|
| |
●
|
Negative length intervals (from–to problem)
|
| |
●
|
Inconsistent downhole survey records
|
| |
●
|
Out-of-sequence and overlapping intervals (from–to problem; additional sampling/quality assurance/quality control/check sampling included in table)
|
| |
●
|
No interval defined within analyzed sequences (not sampled or missing samples/results)
|
| |
●
|
Inconsistent drill hole labelling between tables
|
| |
●
|
Invalid data formats and out-of-range values
|
The SLR QP is of the opinion that database verification procedures for the São Jorge Project comply with industry standards and are adequate for the purposes of Mineral Resource estimation.
A site visit to the São Jorge Project was also conducted by Qualified Person Dr. Beck Nader, D.Sc., M.Sc., FAIG, accompanied by Gabriel Neiva and José Reis, between February 25 and 27, 2026. The purpose of the visit was to obtain a general understanding of site conditions, access, infrastructure, environmental setting, and the overall operational context appropriate for a Preliminary Economic Assessment level of study.
BNA Mining Solutions - R. Des. Leão Starling, 200 - Ouro Preto, BH - MG, 31310-370 – Phone: +55 (31) 2514-8733 – E-mail: info@bnaconsultoria.com
|
GoldMining Inc.
NI 43-101 Report – São Jorge Project
|
Page 103 |
During the site visit and subsequent review process, Dr. Nader did not independently verify, review, or validate the geological database, geological interpretations, exploration data, Mineral Resource estimate, or Mineral Resource classification, as these activities are the responsibility of the Mineral Resource Qualified Person.
Data verification activities completed by Dr. Nader were limited to a high-level review of the datasets, technical reports, mine planning inputs, metallurgical information, and supporting documentation provided by GMI. Where possible, the information was cross-checked for internal consistency and reconciliation between sections of the Technical Report.
The BNA QP considers that the information provided by GMI, is adequate for the purposes of this Preliminary Economic Assessment.
BNA Mining Solutions - R. Des. Leão Starling, 200 - Ouro Preto, BH - MG, 31310-370 – Phone: +55 (31) 2514-8733 – E-mail: info@bnaconsultoria.com
|
GoldMining Inc.
NI 43-101 Report – São Jorge Project
|
Page 104 |
|
13
|
Mineral Processing and Metallurgical Testing
|
A summary of the metallurgical test work completed on the Project has been modified from GE21 (2021) as follows:
|
13.1
|
Metallurgical Testing – 2006
|
In 2006, SGS was commissioned to undertake metallurgical tests. Test work was performed on three carefully composed drill core samples from the São Jorge Project, of high, medium and low-grade samples. The gold head grades of samples SJ MET-01, SJ MET-02 and SJ MET-03 were 6.5 g/t Au, 1.8 g/t Au and 0.6 g/t Au, respectively.
SGS performed a comprehensive mineralogical and analytical approach of sample SJ MET-01, including fire assay, heavy liquid separation, super-panning, mineral microscopy, and electron microprobe. Results showed that the gold was present mainly in its native form with the native gold content ranging from 74.6% to 95.5% of the total gold occurrence. In terms of liberation, gold occurred as liberated particles, particles associated with pyrite, and particles associated with non-sulphides. The grain size ranged from 1 µm to 212 µm, with the majority of grains below 50 µm.
The gold balance shows that liberated gold accounted for approximately 17% of the head grade, with the majority of gold grains being less than 50 µm in size. Approximately 62% and 13% of the gold was associated with pyrite and pyrite/non-sulphide binaries, respectively. Test work showed this gold can be recovered by flotation, followed by cyanidation. Gold attached to pyrite can be recovered by direct cyanidation. To extract gold locked in pyrite, however, finer grinding will be required.
The Bond ball mill work index of a composite of the three samples was determined to be 16.8 kWh/t in a test using a 150 mesh closing screen.
The recovery of gold by gravity separation ranged from 33% to 43%. Gold extraction by carbon in leach (“CIL”) from the gravity separation tailing ranged from 97% from the highest-grade sample to 86% from the lowest grade sample, resulting in overall gold recoveries by gravity separation and CIL ranging from 98% (SJ MET-01) to 91% (SJ MET-03). The cyanide consumption was low at 0.1 to 0.3 kg/t NaCN. Test results of the recovery of gold from the gravity separation tailing by flotation ranged from 94% to 98%.
Summaries of test work results are shown in Table 13.1 (head analysis), Table 13.2 (gravity separation tests), and Table 13.3 (leaching tests). Figure 13.1 through Figure 13.3 illustrate the recovery versus grade curves for the metallurgical test work results.
Table 13.1 - Head Analysis (excluding SJ-MET-01)
|
Head Sample Assays
|
SJ-MET-01
|
SJ-MET-02
|
| |
Au (g/t)
|
S (%)
|
Au (g/t)
|
S (%)
|
|
Average
|
1.82
|
0.87
|
0.64
|
0.52
|
BNA Mining Solutions - R. Des. Leão Starling, 200 - Ouro Preto, BH - MG, 31310-370 – Phone: +55 (31) 2514-8733 – E-mail: info@bnaconsultoria.com
|
GoldMining Inc.
NI 43-101 Report – São Jorge Project
|
Page 105 |
Table 13.2 - Summary of Gravity Separation Tests
|
Test No.
|
Sample
|
K80 (μm)
|
Wt %
|
Gravity Concentrate
|
Gravity Tail
Assay
|
Head Assay
|
| |
|
|
|
Assay
(g/t Au)
|
% Au
Recovery
|
(g/t Au)
|
Calc.
(g/t Au)
|
Direct
(g/t Au)
|
|
G2
|
SJ-MET-02
|
92
|
0.092
|
5.22
|
35.2
|
0.88
|
1.36
|
1.82
|
|
G3
|
SJ-MET-03
|
91
|
0.088
|
2.62
|
32.8
|
0.47
|
0.70
|
0.64
|
Table 13.3 - Summary of Leaching Tests
|
Test No.
|
Sample
|
Reagent
Addition (kg/t)
|
Reagent Consumption
(kg/t)
|
%
Extr’n
|
Residue
(g/t Au)
|
Leach
Feed
(calc, g/t Au)
|
Overall Gold
Recovery (%)
|
| |
|
NaCN
|
CaO
|
NaCN
|
CaO
|
Gravity
Only
|
Gravity
+ CIL
|
|
CIL2
|
SJ-MET-02
|
0.70
|
0.69
|
0.10
|
0.64
|
89.6
|
0.09
|
0.87
|
35.2
|
93.3
|
|
CIL3
|
SJ-MET-03
|
0.77
|
0.71
|
0.12
|
0.67
|
86.1
|
0.07
|
0.51
|
32.8
|
90.7
|
A comparison of the metallurgical test work results is presented in Table 13.4. In summary, the mineralized samples responded very well to Gravity + CIL and Gravity+ Flotation tests. Although flotation gave the highest overall gold recovery, further upgrading and/or treatment of the flotation concentrate would be required with the added risk of some, undefined, gold loss associated with the downstream processes. Overall gold recoveries by gravity separation and flotation were 95.6% to 97.3%.
Table 13.4 - Comparison of Metallurgical Test Results
| |
Gold Recovery (%)
|
|
Sample
|
Gravity Only
|
Gravity + CIL
|
Gravity + Flotation
|
|
SJ-MET-02
|
35.2
|
93.3
|
97.3
|
|
SJ-MET-03
|
32.8
|
90.7
|
95.6
|
BNA Mining Solutions - R. Des. Leão Starling, 200 - Ouro Preto, BH - MG, 31310-370 – Phone: +55 (31) 2514-8733 – E-mail: info@bnaconsultoria.com
|
GoldMining Inc.
NI 43-101 Report – São Jorge Project
|
Page 106 |
Figure 13.1 - São Jorge Gravity Recovery Result
Figure 13.2 - Leaching Recovery Test Result
BNA Mining Solutions - R. Des. Leão Starling, 200 - Ouro Preto, BH - MG, 31310-370 – Phone: +55 (31) 2514-8733 – E-mail: info@bnaconsultoria.com
|
GoldMining Inc.
NI 43-101 Report – São Jorge Project
|
Page 107 |
Figure 13.3 - Gravity Plus Leach Recovery Test Result
|
13.2
|
Metallurgical Testing – 2012
|
A second phase of test work was carried out by Testwork Desenvolvimento de Processo Ltda in order to determine the most economical processing route for the mineralization based on using CIL as the metal extraction method.
The test work comprised chemical analysis on head samples, size by size distribution, leaching of the individual size fractions in order to establish leaching kinetics and gravity test work. Leaching was conducted on both gravity concentration tails and non-gravity tails with and without the addition of activated carbon. Finally, the effects on recovery with variation in cyanide addition rates were examined.
|
13.2.1
|
Sample Selection and Location
|
Samples were selected from nine bore holes covering a strike length of 600 m over a vertical depth of 60 m to 350 m below surface in the main portion of the São Jorge deposit. The samples were the remainder of the original 3.5 kg to 4.0 kg core samples submitted for assays. A selection of 30 samples with a grade of between 0.5 g/t Au and 1.5 g/t Au were taken. A weighted average grade calculated for the 30 samples was made. From the 30 samples selected, samples were added and removed until a representative combination of 18 samples with an average grade of close to 1.0 g/t Au was defined. All samples were crushed to P80 = 1.68 mm and composited into a single representative sample from which a number of 1 kg sub-samples were taken for leach and gravity recovery test work. The mean calculated head grade for the range of tests carried out was 0.78 g/t Au, well below the diluted resource grade of 0.91 g/t Au as reported by Coffey Mining (2013).
BNA Mining Solutions - R. Des. Leão Starling, 200 - Ouro Preto, BH - MG, 31310-370 – Phone: +55 (31) 2514-8733 – E-mail: info@bnaconsultoria.com
|
GoldMining Inc.
NI 43-101 Report – São Jorge Project
|
Page 108 |
The mineral samples were delivered in bags that were labelled MET-01. This was the only sample that was used for the metallurgical test work program for this phase.
|
13.2.2
|
Head Samples and Assays
|
Four 1 kg sub-samples were selected at random, homogenized once more and divided into six 500 g samples and one 1 kg sample in order to perform the following analyses:
| |
●
|
Au analysis via fire assay on the six 500 g samples;
|
| |
●
|
Ag, S, Fe, Cu, As, Hg, CO32-, ICP multi-element, CTOTAL (total carbon) analyses on the 1 kg sample.
|
Assay results obtained from the head sample MET-01 chemical analysis are listed in Table 13.5 and Table 13.6, and the calculated grade results for the same samples analysed for gold content can be seen in Table 13.7.
Table 13.5 - Chemical Analysis for Sample MET-1
|
Element
|
Unit
|
Quantity
|
|
Hg
|
ppm
|
<0.001
|
|
Ag
|
ppm
|
<3
|
|
As
|
ppm
|
<10
|
|
Fe
|
%
|
2.84
|
|
Cu
|
Ppm
|
166
|
|
C (organic)
|
% 0.027
|
|
|
C (Elemental)
|
%
|
<0.005
|
|
C (Carbonitic)
|
%
|
0.424
|
Table 13.6 - Gold Analysis for Sample MET-1
|
Sample
|
Assay (g/t)
|
|
1
|
0.587
|
|
2
|
0.744
|
|
3
|
1.177
|
|
4
|
0.872
|
|
5
|
0.618
|
|
6
|
0.684
|
|
Average
|
0.780
|
BNA Mining Solutions - R. Des. Leão Starling, 200 - Ouro Preto, BH - MG, 31310-370 – Phone: +55 (31) 2514-8733 – E-mail: info@bnaconsultoria.com
|
GoldMining Inc.
NI 43-101 Report – São Jorge Project
|
Page 109 |
Table 13.7 - Calculated and Assayed Heads for Sample MET-1 Tests
|
Description
|
Gold Assays (g/t)
|
|
Head assay
|
0.78
|
|
Test 1 experimental test work
|
0.49
|
|
Test 2 experimental test work
|
0.59
|
|
Granulometric weighted average
|
0.91
|
|
Gravity concentration test
|
0.86
|
|
Kinetic leaching w/o gravity (w/o carbon) (P80 106 microns)
|
0.67 – 0.87
|
|
Kinetic leaching w/o gravity (w carbon) (P80 106 microns)
|
0.61 – 0.78
|
|
Kinetic leaching w/o gravity (w/o carbon) (P80 75 microns)
|
0.72 – 1.10
|
|
Kinetic leaching w/o gravity (w carbon) (P80 75 microns)
|
0.55 – 0.79
|
13.2.3 Granulometric Test Work
A 3kg sample was crushed to P80 = 125 µm, dried and separated into size fractions of +100, +115, +150, +200, +325 and -325 mesh.
These fractions were leached, and both the solids and the solutions were analysed to verify gold distribution by fraction. Results can be seen in the Table 13.8.
The recovery of gold per fraction varied between 90.6% and 74.4%, with an average of 81.8%. The recalculated concentration of gold per fraction varied between 1.44 g/t Au and 0.63 g/t Au, having a head concentration of 0.91 g/t Au.
Table 13.8 - Recovery of Gold by Size Fraction for Sample MET-1
|
Tyler Mesh
|
Size (μm)
|
Au
Concentration
(g/t Au)
|
Tailings (g/t
Au)
|
Recovery Au
per Fraction
(Au %)
|
Recovery of Au per fraction in
relation to the feed
|
|
(Au %)
|
(Cumulative
Au %)
|
|
100
|
150
|
1.44
|
0.14
|
90.6
|
18.9
|
18.9
|
|
115
|
125
|
0.63
|
0.14
|
77.0
|
6.3
|
25.2
|
|
150
|
106
|
0.72
|
0.19
|
74.4
|
2.8
|
28.0
|
|
200
|
75
|
1.18
|
0.17
|
85.3
|
19.4
|
47.4
|
|
325
|
45
|
0.70
|
0.16
|
76.4
|
2.4
|
49.9
|
|
-325
|
-45
|
0.78
|
0.10
|
86.9
|
35.8
|
85.7
|
|
Weighted Average
|
0.91
|
0.13
|
|
|
|
13.2.4 Grindability Testing
Test work was carried out to determine the Bond Ball Mill work index on three samples collected from drill holes at different depths along the deposit. Sample SJ-WI-LOW was from approximately 200 m to 250 m below surface, SJ-WI-INT was from approximately 135 m to 175 m below surface and SJ-WI-SUP was from 30 m to 45 m below surface.
BNA Mining Solutions - R. Des. Leão Starling, 200 - Ouro Preto, BH - MG, 31310-370 – Phone: +55 (31) 2514-8733 – E-mail: info@bnaconsultoria.com
|
GoldMining Inc.
NI 43-101 Report – São Jorge Project
|
Page 110 |
The results are shown below in Table 13.9. The Bond ball mill work index of the three samples varied from 13.7 to 15.5 kWh/t in a test using a 150 mesh closing screen. From the values obtained, the mineralization can be categorized as medium to hard in regards to the Ball Mill Work Index.
Table 13.9 - Bond Work Index Values for Selected Samples
|
Sample Identification
|
Bond Ball Work Index (kWh/t)
|
|
SJ-WI-LOW
|
15.2
|
|
SJ-WI-Int
|
15.5
|
|
SJ-WI-SUP
|
13.7
|
13.2.5 Gravity Concentration Test Work
The test was conducted to determine the Gravity Recoverable Gold according to the Knelson procedure for small quantities of material.
A 10 kg sample was crushed into three different granulometric fractions (P80 = 212 µm, P80 = 106 µm, and P80 = 75 µm), and at each increment of crushing the material was passed through the Knelson MD3 concentrator to recover the free coarse gold (Figure 13.5).
Figure 13.4 - Gold Recovery Versus Grind Size
The gravity concentration test work was conducted by testing for gold recovery, then grinding the tails to a smaller particle size and retesting the gravity recovery. This was repeated down to the 75 micron size fraction.
The test results indicate that 66% recovery of gold is achievable, however, this conclusion has been based on a test methodology that may not be replicated in a commercial-scale mill, hence the results will require verification.
BNA Mining Solutions - R. Des. Leão Starling, 200 - Ouro Preto, BH - MG, 31310-370 – Phone: +55 (31) 2514-8733 – E-mail: info@bnaconsultoria.com
|
GoldMining Inc.
NI 43-101 Report – São Jorge Project
|
Page 111 |
From the test results it was shown that an overall recovery of 36.5% with a gold grade of 38.91 g/t Au was achieved when the entire sample was ground to a P80 of 212 microns. The gravity tailings were further ground to a particle size of P80 106 microns which then recovered an additional 17.2% of the gold in relation to the feed grade. The tailings from the second stage of concentrating were then ground to a particle size of P80 75 microns and returned a further gold recovery of 12.4%. The cumulative recoveries total 66% recovery.
The gravity concentrate is of low grade, less than 50 g/t Au, and would require further upgrading, likely at some loss of recovery, if it were to be sold to a smelter. An alternative would be to further treat this material in an Intense Leach Reactor (ILR), however, this process was not explored in this phase of test work program.
13.2.6 Kinetic Curves for Leaching Without Gravity Concentration
The leach kinetic curves were conducted individually for different values of P80 (106 µm and 75 µm). For each assay, a 1.2 kg sample was taken from the head sample, ground to the desired P80 size, dried, homogenized and sampled into six 200 g sub-samples, which were then individually leached during various pre-determined time periods.
Test conditions are defined below:
| |
●
|
With and without the addition of activated carbon to the pulp;
|
| |
●
|
Without pre-dosing the material with lime;
|
| |
●
|
pH adjusted to between 10-11;
|
| |
●
|
Total residence time of 32 hours;
|
| |
●
|
Leaching kinetics (recovery of gold as a function of time) – Collection of aliquots (gold, cyanide, pH) at 2, 6, 10, 20, 24 and 32 hours; and Cyanide concentration – 1,000 mg/L.
|
The results are presented in Table 13.10.
Table 13.10 - Leach Recovery Without the Use of Gravity Separation – Sample MET-01
|
Time
(h)
|
P80 =106 μm without
activated carbon
|
P80 = 106 μm with
activated carbon
|
P80 = 75 μm without
activated carbon
|
P80 = 75 μm with
activated carbon
|
| |
Real (%)
|
Adjusted (%)
|
Real (%)
|
Adjusted (%)
|
Real (%)
|
Adjusted (%)
|
Real (%)
|
Adjusted (%)
|
|
0
|
0
|
0
|
0
|
0
|
0
|
0
|
0
|
0
|
|
2
|
46.4
|
47.9
|
66.4
|
56.2
|
41.5
|
41.6
|
50.3
|
50.4
|
|
6
|
78.1
|
79.1
|
74.9
|
84.5
|
86.6
|
76.9
|
89.0
|
83.1
|
|
10
|
79.1
|
85.4
|
87.9
|
88.4
|
91.8
|
87.5
|
81.0
|
89.7
|
|
20
|
83.9
|
86.9
|
87.4
|
89.0
|
90.7
|
91.9
|
91.4
|
91.4
|
|
24
|
86.2
|
86.9
|
86.3
|
89.0
|
90.0
|
92.1
|
71.8
|
91.4
|
|
32
|
87.0
|
87.0
|
89.0
|
89.0
|
92.1
|
92.1
|
87.9
|
91.
|
BNA Mining Solutions - R. Des. Leão Starling, 200 - Ouro Preto, BH - MG, 31310-370 – Phone: +55 (31) 2514-8733 – E-mail: info@bnaconsultoria.com
|
GoldMining Inc.
NI 43-101 Report – São Jorge Project
|
Page 112 |
13.2.7 Kinetic Curves for Leaching With Gravity Concentration
Gravity concentration on the sample was carried out prior to leaching in order to remove the maximum amount of free gold possible with the least amount of mass.
The leach kinetic tests were conducted on individual tailing samples that were generated from the gravity tests having P80 values of 106 and 75 µm. For each assay, a 1.2 kg sample of gravity concentration tailings was sampled and sub-divided into six 200 g samples that were leached individually.
Test conditions are defined below:
| |
●
|
With and without the addition of activated carbon to the pulp;
|
| |
●
|
Without pre-dosing the material with lime;
|
| |
●
|
pH adjusted to between 10-11;
|
| |
●
|
Total residence time of 32 hours;
|
| |
●
|
Leaching kinetics (recovery of gold as a function of time) – Collection of aliquots (gold,
|
| |
●
|
cyanide, pH) at 2, 6, 10, 20, 24 and 32 hours; and Cyanide concentration – 1,000 mg/L.
|
Table 13.11 and Table 13.12 indicate the result of the gravity test work on the different grind sizes prior to gravity separation, and Table 13.13 indicates the gold recovery on the tails produced from gravity separation.
Table 13.11 - Gravity Concentration Before Leaching P80 106 microns
|
ID
|
Wt (kg)
|
% mass
|
Au concentration
(g/t Au)
|
Au (mg)
|
Cumulative Au
concentration (g/t)
|
% Recovered
|
|
Conc. 1
|
0.047
|
1.60
|
26.582
|
1.254
|
26.58
|
49.50
|
|
Final Tailings
|
2.953
|
98.40
|
0.434
|
1.285
|
0.85
|
50.50
|
|
Calculated Feed
|
3.000
|
|
0.850
|
2.536
|
|
|
|
Analyzed Feed
|
3.000
|
|
0.700
|
|
|
|
Table 13.12 - Gravity Concentration Before Leaching P80 75 microns
|
ID
|
Wt (kg)
|
% mass
|
Au concentration
(g/t Au)
|
Au (mg)
|
Cumulative Au
concentration (g/t)
|
% Recovered
|
|
Conc. 1
|
0.035
|
1.12
|
25.808
|
0.901
|
25.81
|
40.75
|
|
Final Tailings
|
2.965
|
98.80
|
0.442
|
1.311
|
0.74
|
59.25
|
|
Calculated Feed
|
3.000
|
|
0.740
|
2.212
|
|
|
|
Analyzed Feed
|
3.000
|
|
0.700
|
|
|
|
BNA Mining Solutions - R. Des. Leão Starling, 200 - Ouro Preto, BH - MG, 31310-370 – Phone: +55 (31) 2514-8733 – E-mail: info@bnaconsultoria.com
|
GoldMining Inc.
NI 43-101 Report – São Jorge Project
|
Page 113 |
Table 13.13 - Leach Recovery Rates of the Gravity Tails from Sample MET-01
|
Time
(h)
|
P80 = 106 μm without
activated carbon
|
P80 = 106 μm with
activated carbon
|
P80 = 75 μm without
activated carbon
|
P80 = 75 μm with
activated carbon
|
| |
Real (%)
|
Adjusted (%)
|
Real (%)
|
Adjusted (%)
|
Real (%)
|
Adjusted (%)
|
Real (%)
|
Adjusted (%)
|
|
0
|
0
|
0
|
0
|
0
|
0
|
0
|
0
|
0
|
|
2
|
61.90
|
61.80
|
64.90
|
64.70
|
77.40
|
76.70
|
67.30
|
67.50
|
|
6
|
80.10
|
84.30
|
83.70
|
84.50
|
84.30
|
88.50
|
79.80
|
87.20
|
|
8
|
82.20
|
86.10
|
85.80
|
85.70
|
76.90
|
88.70
|
88.40
|
88.30
|
|
20
|
86.20
|
86.20
|
82.80
|
85.80
|
88.70
|
88.70
|
86.10
|
88.40
|
|
24
|
81.70
|
86.20
|
76.50
|
85.80
|
85.40
|
88.70
|
75.50
|
88.40
|
|
36
|
86.10
|
86.20
|
84.20
|
85.80
|
87.10
|
88.70
|
78.20
|
88.40
|
Recovery rates for the samples that were subjected to gravity separation followed by leaching of the gravity tails have been adjusted to reflect possible overall recovery rates for the combined processes. In order to derive a final recovery, it was estimated that a recovery rate of 98% can be achieved when the gravity concentrate is subjected to leaching. This needs to be confirmed in the next phase of metallurgical testing. The results are listed in Table 13.14.
Table 13.14 - Calculated Overall Recoveries from Gravity and Leaching- Sample Met-01
|
Time (h)
|
P80 = 106 μm without
activated carbon
|
P80 = 106 μm with
activated carbon
|
P80 = 75 μm without
activated carbon
|
P80 = 75 μm with
activated carbon
|
|
0
|
0
|
0
|
0
|
0
|
|
2
|
76.55
|
78.27
|
87.24
|
82.60
|
|
6
|
89.88
|
90.00
|
93.20
|
92.55
|
|
8
|
90.95
|
90.71
|
93.30
|
93.10
|
|
20
|
91.01
|
90.77
|
93.30
|
93.15
|
|
24
|
91.01
|
90.77
|
93.30
|
93.15
|
|
36
|
91.01
|
90.77
|
93.30
|
93.15
|
From the data obtained, it has been observed that a finer grind size of P80 75 microns results in higher gold recovery. When comparing overall recovery rates for samples ground to P80 75 microns the recovery was similar regardless of if the samples were subjected to gravity separation prior to leaching. A coarser grind size of P80 106 microns resulted in lower overall recoveries even when the samples were subjected to gravity separation prior to leaching. This is illustrated in Figure 13.5. Figure 13.6 and Figure 13.7 illustrate the effect of both grind size and gravity separation on recovery.
BNA Mining Solutions - R. Des. Leão Starling, 200 - Ouro Preto, BH - MG, 31310-370 – Phone: +55 (31) 2514-8733 – E-mail: info@bnaconsultoria.com
|
GoldMining Inc.
NI 43-101 Report – São Jorge Project
|
Page 114 |
Figure 13.5 - Leaching Test – Percentage Recovery Versus Time
Figure 13.6 - Recovery Versus Leach Time P80 = 106 microns
Figure 13.7 - Recovery Versus Leach Time P80 = 75 microns
BNA Mining Solutions - R. Des. Leão Starling, 200 - Ouro Preto, BH - MG, 31310-370 – Phone: +55 (31) 2514-8733 – E-mail: info@bnaconsultoria.com
|
GoldMining Inc.
NI 43-101 Report – São Jorge Project
|
Page 115 |
13.3 Conclusions
The data reviewed suggests that collection of gold through gravity concentration is viable based on recovery, but not feasible based on the low concentrate grades reported. It would have been beneficial to have performed gravity upgrading and/or leach tests on the first pass gravity concentrate in order to establish cyanide consumption rates and overall recoveries.
Gravity concentrate recoveries should be revised and stated with the grade of the concentrate produced.
The selection of the metallurgical sample needs to be verified in order to determine if the samples represent the deposit as it is currently defined.
The recoveries by granulometric fraction were between 74% and 87% for the finer fractions and 90.6% for the coarser, 150 µm, fraction. As the process of sieving classifies material exclusively with respect to size, this may indicate that part of the gold (coarse and liberated) has been retained in the mesh.
For met sample SJ-AL1-T1, which represents the sulphides, and SJ-AL2-T2, which represents the oxides, gold recovery for the finer ground samples P80 75 microns ranged from 91.1% to 95.8% for the sulphides and between 86.1% and 91.2% for the oxides.
For met samples SJ-AL1-T1, gold recovery was increased from an average of 92.4% to 93.7% using a finer grind that is a P80 75 microns as compared to a P80 106 microns.
For met samples SJ-AL2-T2, the finer grind size did not affect recovery as both a grind size at P80 75 microns and of P80 106 microns resulted in the same recovery rates.
For met sample SJ-AL2-T2, low gold recoveries averaging 88% may be attributed to organic fouling.
The Gravity Recoverable Gold tests show how the gold is gradually liberated during the crushing process, and the results indicated that it was possible to attain a maximum gold recovery of 66% when the material is crushed in stages to a P80 equalling 74 µm. It should be noted that the material was initially ground to a P80 of 212 microns and then subjected to gravity concentration. From the test results it was shown that an overall recovery of 36.5% with a gold grade of 38.91 g/t Au was achieved when the entire sample was ground to a P80 of 212 microns. The gravity tailings were further ground to a particle size of P80 106 microns which then recovered an additional 17.2% of the gold in relation to the feed grade. The tailings from the second stage of concentrating were then ground to a particle size of P80 75 microns and returned a further gold recovery of 12.4%. The cumulative recoveries total 66% recovery. As a result of the three stages of grinding, the final gravity recovery that was achieved could be overstated.
The tailings from the gravity concentration were subjected to leaching with and without carbon present. It was observed that carbon reported to the solid residue which increased the reported tailings grade and reduced the gold recovery (24 hour test).
Gravity gold recovery reached 49.5% and 40.7% when the material was crushed at P80 levels of 106 µm and 75 µm, respectively.
BNA Mining Solutions - R. Des. Leão Starling, 200 - Ouro Preto, BH - MG, 31310-370 – Phone: +55 (31) 2514-8733 – E-mail: info@bnaconsultoria.com
|
GoldMining Inc.
NI 43-101 Report – São Jorge Project
|
Page 116 |
For met sample MET-01, a grind size of P80 = 75 microns resulted in an overall recovery of 92.1% and was achieved without the use of gravity separation. With gravity separation gold recovery can be slightly increased to 93%. At the coarser grind size of P80 = 106 microns, overall recovery was slightly lower at 91.0% with the aid of gravity separation. Overall recovery is a combination of gravity recovery and leaching. Further test work is recommended to validate the benefit of gravity separation.
As the test work was performed on a lower grade material, it is expected that as the head grade is increased, so too will the recovery of gold, as can be seen in Figure 13.8.
Figure 13.8 - Predicted Grade Versus Recovery for Higher Grade Mineralization
At an anticipated head grade of approximately 1.57 g/t Au, the overall recovery is expected to be in the range of 94.0% or slightly higher, if the process incorporates a CIL circuit with a feed size of P80 = 75 microns or finer.
The results from sample MET-01 indicates no great consumers of cyanide, such as thiocyanate, ferrocyanide or copper cyanide, exist in large concentrations in the solution.
The feed is categorized as medium to hard with a Ball Mill work index ranging from 13.7 to 15.7 kWh/t.
Results indicate that, at a fine grind of P80 75 microns, and a slightly higher grade of mineralized material (1.18 g/t Au), a recovery of 93.7 % is achievable.
Leach kinetics curves indicate that maximum gold recovery can be achieved after 22 hours of leaching for the sulphide material. Leach kinetic curves were not generated for the oxide material.
BNA Mining Solutions - R. Des. Leão Starling, 200 - Ouro Preto, BH - MG, 31310-370 – Phone: +55 (31) 2514-8733 – E-mail: info@bnaconsultoria.com
|
GoldMining Inc.
NI 43-101 Report – São Jorge Project
|
Page 117 |
13.4 Recommendations
In order to fully understand and define the metallurgical response of the oxide and sulphide deposits a number of variability samples would be required. These samples would be used not only to develop the resource block model but would also be used in the grinding and leach test program. The results of this test work would be inputted back into the block model in order to allow for metal extractions to be predicted across the deposit.
Future samples must be chosen to be representative of the material that will be mined in the first five years of the mine life. They should be selected by the Project Geologist in collaboration with the Lead Process Engineer and Mining Engineer.
The different lithologies along with the master composite for each deposit should be submitted for head analysis. Elements for analysis would include gold, silver, copper, sulphur and iron.
A representative sample from each lithology along with the master composites for the deposit should be submitted for mineralogical examination in order to obtain bulk modal analyses data and liberation data. Also QEMSCAN analysis should be performed on the final tails from the deposits in order to better understand the mineral composition within the deposit thus indicating how metallurgical performance may be affected.
The next phase of the program requires more comminution data such as; Modified Bond ball mill work index tests, several full Bond ball mill work index determinations, Bond rod mill work index, crushing work index, abrasion work index, Unconfined Compression tests (“UCS”), SAG Mill Comminution tests (“SMC”) and JKTech drop weight tests in order to properly size the comminution circuit.
On the master composite for the sulphide material, a high pressure grinding rolls (“HPGR”) evaluation should be considered as an option to SAG milling. This would require a Static Pressure Test (“SPT”) to be performed.
A series of flotation tests should be considered on both material types in order to establish if flotation would be an appropriate flowsheet option in order to optimize gold recovery.
Further gravity tests should be carried out on both material types at various grinds in order to confirm original findings.
Leaching of the gravity concentrate should be carried out in order to determine overall recovery rates and establish leach kinetic curves along with reagent consumptions.
Leach kinetic curves need to be established on master composite samples for both the oxide and sulphide materials.
Once optimum conditions have been established with the master composites, further bench tests should be performed on the variability samples using the same set of conditions.
BNA Mining Solutions - R. Des. Leão Starling, 200 - Ouro Preto, BH - MG, 31310-370 – Phone: +55 (31) 2514-8733 – E-mail: info@bnaconsultoria.com
|
GoldMining Inc.
NI 43-101 Report – São Jorge Project
|
Page 118 |
Once optimum conditions have been established from bench tests, locked-cycle testing and potentially a pilot plant trial should be conducted in order to confirm initial findings.
Reagent optimization for both feed types needs to be established.
Settling tests on the tailings for both feed types are required. This would involve appropriate flocculent selection (ionic, cationic, neutral, coagulant) settling test work (feed percent solids, dosage, pH), specific gravity determination and viscosity measurements on tailings, with and without thickening.
As the deposit consists of approximately 15% oxide (laterite and saprolite) material and 85% sulphide material the next phase of test work needs to include both gravity and leach test work on a composite sample that represents this ratio in order to determine what effect a blended feed has on recovery, if any, as this may be a possible process route.
Further testing needs to be carried out on the oxide material as it may be processed separately for the first 18 months of production. This would include the same test work that has been carried out on the sulphides.
Test work involving thickening of the leach tails is recommended for the next phase of work for both oxide and sulphide material in order to establish maximum obtainable densities for the counter current decantation (“CCD”) circuit.
The feed rheology needs to be well defined and understood to thwart any potential viscosity issues which may arise from the processing of the oxides alone.
Environmental test work, as it relates to the processing plant and tailings storage facility is required.
BNA Mining Solutions - R. Des. Leão Starling, 200 - Ouro Preto, BH - MG, 31310-370 – Phone: +55 (31) 2514-8733 – E-mail: info@bnaconsultoria.com
|
GoldMining Inc.
NI 43-101 Report – São Jorge Project
|
Page 119 |
|
14
|
Mineral Resource Estimate
|
The SLR QP prepared an updated estimate of the Mineral Resources present at the São Jorge deposit, which incorporated the results and knowledge gained from the drilling campaigns completed by GMI in 2024. In general terms, the recent GMI drilling program was successful in confirming the interpreted location of the gold mineralization (DDH SJD-120-24), locating the northwestern strike extension of the mineralized zone (DDH SJD-122-24), intersecting the gold mineralization along a parallel mineralized zone located to the northwest of the main mineralized trend (DDH SJD-121-24), and intersecting previously untested mineralized zone (DDH SJD-123-24).
The work completed by GMI has aided to advance the understanding of the controls on the distribution of the gold mineralization at the São Jorge deposit.
A Mineral Resource Estimate was prepared based upon the conceptual view that the mineralized material would be extracted by means of an open pit mine at an envisioned production rate of between 5,000 tpd and 15,000 tpd. The material would then be processed at an on-site facility where gold would be recovered using a cyanide leaching flowsheet.
Open pit Mineral Resources at a breakeven cut-off grade of 0.27 g/t Au are estimated to total 19,418,000 t at an average grade of 1.00 g/t Au containing approximately 624 thousand ounces (“koz”) Au in the Indicated Resource category. An additional 5,557,000 t at an average grade of 0.72 g/t Au containing approximately 129 koz Au are estimated to be present in the Inferred Mineral Resource category (Table 14.1).
Table 14.1 - Summary of Mineral Resources as at January 28, 2025
|
Category
|
Tonnage
(000 t)
|
Grade
(g/t Au)
|
Contained Metal
(000 oz Au)
|
|
Indicated
|
19,418
|
1.00
|
624
|
|
Inferred
|
5,557
|
0.72
|
129
|
Notes:
| |
1.
|
CIM (2014) definitions were followed for Mineral Resources.
|
| |
2.
|
Mineral Resources are estimated at a break-even cut-off grade of 0.27 g/t Au for classified blocks above a constraining pit shell.
|
| |
3.
|
Mineral Resources are estimated using a long-term gold price of US$ 1,950 per ounce.
|
| |
4.
|
A minimum mining width of five metres was used.
|
| |
5.
|
There are no Mineral Reserves estimated at the São Jorge Project. Mineral Resources that are not Mineral Reserves do not have demonstrated economic viability.
|
| |
6.
|
Numbers may not add due to rounding.
|
BNA Mining Solutions - R. Des. Leão Starling, 200 - Ouro Preto, BH - MG, 31310-370 – Phone: +55 (31) 2514-8733 – E-mail: info@bnaconsultoria.com
|
GoldMining Inc.
NI 43-101 Report – São Jorge Project
|
Page 120 |
The SLR QP is not aware of any environmental, permitting, legal, title, taxation, socio-economic, marketing, political, or other relevant factors that could materially affect the Mineral Resource estimate.
The drill hole database used to prepare the estimate of the Mineral Resources of the São Jorge deposit was compiled from various sources including drill hole information collected from prior claim owners and from drill hole information collected by GMI. The drill hole data consisted of detailed collar, survey, major lithology, and assay information. The locations of the drill holes throughout the Property are presented in Section 10 Drilling.
An initial review by GMI of the assay information revealed that not all samples from the historical drilling campaigns for drill holes located in and about the São Jorge deposit contained complete sampling and assay coverage for all portions of the drill holes located within the mineralized wireframes. In 2021, GMI carried out a program of re-sampling and re-assaying for selected drill holes where the core was stored in the on-site core shack. The results of this re-sampling program were included in the final database used to prepare the Mineral Resource estimate. For the remaining drill holes containing un-sampled intervals, zero values were inserted into the assay table of the drill hole database at the outset of the Mineral Resource estimation workflow.
GMI carried out a re-surveying program in 2022 for as many of the historical drill hole collars as could be located in the field and included the revised collar locations into the drill hole database. A total of 55 historical drill hole collars were re-surveyed using a GPS geodesic model RTK – COMNAV T300 unit and the SAD69, Zone 21S EPSG:5531 datum. For those historical drill holes that could not be located in the field, their elevations were edited to match with the revised topographic surface at the outset of the Mineral Resource estimation workflow. In general, these collar elevation corrections varied up to five metres in elevation.
The drill hole information was imported into the Seequent Leapfrog version 2024.1 (“Leapfrog”) and the Dassault Systèmes Surpac version 2024 Refresh1 (“Surpac”) software packages. The drill hole database contains information for 608 drill holes and auger/channel samples (Table 14.2), of which only 155 drill holes were used, as all auger drill holes were excluded from preparation of the Mineral Resource Estimate. The SLR QP is of the opinion that the drill hole and sampling database is suitable for use in preparation of the Mineral Resource Estimate for the São Jorge deposit.
Table 14.2 - Summary of the Drill Hole Database as of December 31, 2024
|
Table Name
|
Data Type
|
Table Type
|
Records
|
|
assay_cap_jan06
|
interval
|
time-independent
|
8,987
|
|
assay_nulled
|
interval
|
time-independent
|
30,789
|
|
collar
|
|
|
608
|
|
comps_1m
|
interval
|
time-independent
|
10,698
|
|
litho
|
interval
|
time-independent
|
7,907
|
|
minz_flags_2024
|
interval
|
time-independent
|
262
|
|
survey
|
|
|
3,333
|
BNA Mining Solutions - R. Des. Leão Starling, 200 - Ouro Preto, BH - MG, 31310-370 – Phone: +55 (31) 2514-8733 – E-mail: info@bnaconsultoria.com
|
GoldMining Inc.
NI 43-101 Report – São Jorge Project
|
Page 121 |
|
14.3
|
Topography and Excavation Models
|
GMI carried out a program of drone-based topographic surveying in 2024 of the area in the immediate vicinity of the existing pit excavation. This topographic information was merged with a larger, regional-scale ASTER satellite digital elevation model data obtained from NASA (2024).
|
14.4
|
Weathering, Lithology and Mineralization Wireframes
|
The top portion of the São Jorge deposit consists of a layer of deeply weathered saprolite unit that varies in depth up to approximately 40 m. The saprolite unit is in turn overlain by a thin layer of artisanal sheet-wash material that is typically on the order of one to three metres in thickness. Both units can contain gold values above the wireframe threshold value.
A combined wireframe model of the saprolite and soil unit was created in Leapfrog using available drill hole information and was used to code the block model.
The fresh host rock lithologies to the São Jorge deposit are relatively straightforward, consisting of units modelled as a monzogranite intrusion and a syenogranite intrusion. The gold mineralization is hosted almost exclusively in the monzogranite intrusion. Wireframe models of each of these two intrusive types were created in Leapfrog and were used to code the block model.
The gold mineralization is observed to be mostly correlated with increased concentrations of sulphide minerals, particularly pyrite. No clear fabric or indications of strain were observed in the drill core. Due to the lack of clear controls on the location of the gold values, a series of wireframe interpretations were prepared using a nominal assay threshold value of 0.25 g/t Au using the Leapfrog software package.
A total of ten mineralization wireframes were prepared using a minimum width of approximately five metres. The mineralization wireframes together have a strike of approximately azimuth 110º, have a strike length of approximately 1.5 km, and dip sub-vertically from surface to a depth of approximately 430 m beneath the surface (Figure 14.1 and Figure 14.2). The mineralization wireframes include gold assays found both within the weathered zone and the fresh host rocks.
The SLR QP observes that neither the strike extensions nor the depth limits of the mineralized system have been well defined by drilling. Furthermore, drill hole SJD-121-24 was successful in demonstrating the presence of a parallel mineralized zone located to the northwest and arranged in an en-echelon relationship with the main mineralized corridor. The strike limits of this new mineralized trend have also not been defined by drilling.
BNA Mining Solutions - R. Des. Leão Starling, 200 - Ouro Preto, BH - MG, 31310-370 – Phone: +55 (31) 2514-8733 – E-mail: info@bnaconsultoria.com
|
GoldMining Inc.
NI 43-101 Report – São Jorge Project
|
Page 122 |
The SLR QP recommends that additional exploration activities be carried out to search for the possible strike extensions of the main mineralized corridor as well as defining the extent of the mineralization in the north-western zone.
The mineralized wireframes, along with the table of mineralized intervals were imported into the Surpac software package for completion of the Mineral Resource estimation workflow.
BNA Mining Solutions - R. Des. Leão Starling, 200 - Ouro Preto, BH - MG, 31310-370 – Phone: +55 (31) 2514-8733 – E-mail: info@bnaconsultoria.com
|
GoldMining Inc.
NI 43-101 Report – São Jorge Project
|
Page 123 |
Figure 14.1 - Plan View of the Mineralized Wireframes
BNA Mining Solutions - R. Des. Leão Starling, 200 - Ouro Preto, BH - MG, 31310-370 – Phone: +55 (31) 2514-8733 – E-mail: info@bnaconsultoria.com
|
GoldMining Inc.
NI 43-101 Report – São Jorge Project
|
Page 124 |
Figure 14.2 - Generalized Cross Section 657,500 E (looking east)
BNA Mining Solutions - R. Des. Leão Starling, 200 - Ouro Preto, BH - MG, 31310-370 – Phone: +55 (31) 2514-8733 – E-mail: info@bnaconsultoria.com
|
GoldMining Inc.
NI 43-101 Report – São Jorge Project
|
Page 125 |
14.5 Sample Statistics and Grade Capping
The mineralization wireframe intervals contained within the selection table of the drill hole database were used to extract those samples from the database contained within the mineralized wireframe volumes, combined together to form one sample population, and then subjected to statistical analyses by means of histograms. A total of 8,987 samples comprised the mineralized population. The sample statistics for both the uncapped and capped assay values are summarized in Table 14.3, and the sample histogram is provided in Figure 14.3.
On the basis of its review of the assay statistics, the SLR QP assigned a capping value of 15 g/t Au to the gold assays contained within the mineralized wireframes.
Table 14.3 - Descriptive Statistics of the Uncapped and Capped Gold Grades
|
Item
|
Uncapped
|
Cap
15 g/t Au
|
|
Length-Weighted Mean
|
0.68
|
0.65
|
|
Median
|
0.15
|
0.15
|
|
Mode
|
0.0001
|
0.0001
|
|
Standard Deviation
|
2.32
|
1.85
|
|
Coefficient of Variation-Length Weighted
|
3.44
|
2.84
|
|
Sample Variance
|
5.40
|
3.41
|
|
Minimum
|
0.0001
|
0.0001
|
|
Maximum
|
47.50
|
15.00
|
|
Count
|
8,987
|
8,987
|
BNA Mining Solutions - R. Des. Leão Starling, 200 - Ouro Preto, BH - MG, 31310-370 – Phone: +55 (31) 2514-8733 – E-mail: info@bnaconsultoria.com
|
GoldMining Inc.
NI 43-101 Report – São Jorge Project
|
Page 126 |
Figure 14.3 - Upper Tail Histogram of the Combined Gold Assays
14.6 Compositing
The selection of an appropriate composite length began with review of the sample length frequency histogram (Figure 14.4). Consideration was also given to the size of the blocks in the model. On the basis of the available information, the SLR QP is of the opinion that a composite length of one metre for all samples is reasonable. All capped gold assays contained within the mineralized wireframes were composited to a nominal one metre length using the best fit compositing function of the Surpac mine modelling software package. In this function, the lengths of the composite samples are varied so as to avoid creating “short-length” composite samples at the bottom contact of the mineralization. The descriptive statistics of the composited samples are provided in Table 14.4.
BNA Mining Solutions - R. Des. Leão Starling, 200 - Ouro Preto, BH - MG, 31310-370 – Phone: +55 (31) 2514-8733 – E-mail: info@bnaconsultoria.com
|
GoldMining Inc.
NI 43-101 Report – São Jorge Project
|
Page 127 |
Figure 14.4 - Histogram of Sample Lengths
Table 14.4 - Descriptive Statistics of the Uncapped and Capped Composite Samples
|
Item
|
Uncapped Composite
|
Capped Composite
(15 g/t Au)
|
|
Mean
|
0.69
|
0.66
|
|
Median
|
0.16
|
0.16
|
|
Mode
|
0.0001
|
0.0001
|
|
Standard Deviation
|
1.72
|
1.47
|
|
Sample Variance
|
2.96
|
2.16
|
|
Minimum
|
0.0001
|
0.0001
|
|
Maximum
|
33.68
|
15.00
|
|
Count
|
10,698
|
10,698
|
14.7 Bulk Density
Bulk density measurements were collected by BGC in 2011 from selected drill holes using the water immersion (Archimedes) method. The bulk densities were determined only on samples of the fresh host rocks. A summary of the bulk densities used to code the block model is provided in Table 14.5.
No bulk densities were determined for the weathered saprolite material. Consequently, the SLR QP derived an estimate of the bulk density of 1.70 t/m3 for the weathered material using measurements made on comparable deposits.
The SLR QP recommends that the bulk density of the weathered material be determined during the preparation of future Mineral Resource estimates.
BNA Mining Solutions - R. Des. Leão Starling, 200 - Ouro Preto, BH - MG, 31310-370 – Phone: +55 (31) 2514-8733 – E-mail: info@bnaconsultoria.com
|
GoldMining Inc.
NI 43-101 Report – São Jorge Project
|
Page 128 |
Table 14.5 - Summary of Bulk Densities
|
Item
|
Monzograntite
|
Metagranite
|
Syenogranite
|
|
Mean (t/m3)
|
2.70
|
2.70
|
2.67
|
|
Median (t/m3)
|
2.69
|
2.71
|
2.67
|
|
Standard Deviation
|
0.07
|
0.03
|
0.03
|
|
Minimum (t/m3)
|
2.13
|
2.65
|
2.61
|
|
Maximum (t/m3)
|
3.95
|
2.78
|
2.82
|
|
Count
|
521
|
87
|
503
|
As an aid in understanding the three dimensional distribution of the gold grades within the main mineralized domains, the SLR QP conducted a short study of the overall trends of the gold grades by means of contours created using the radial-basis function of the Leapfrog Geo (v2024.1) software package on the capped, composited assay values.
The results are shown as vertical projections in Figure 14.5, Figure 14.6 and Figure 14.7. Examination of the contours for Domain 201 reveals that the gold grades occur in higher grade pockets and shoots that plunge moderately to the west, steeply to the east, or can be horizontal. The contours for Domain 303 suggest that the gold grades occur along a zone plunging approximately 30º to the west.
BNA Mining Solutions - R. Des. Leão Starling, 200 - Ouro Preto, BH - MG, 31310-370 – Phone: +55 (31) 2514-8733 – E-mail: info@bnaconsultoria.com
|
GoldMining Inc.
NI 43-101 Report – São Jorge Project
|
Page 129 |
Figure 14.5 - Vertical Projection of the Contoured Gold Grades, Domain 201 Looking Towards Azimuth 020º
BNA Mining Solutions - R. Des. Leão Starling, 200 - Ouro Preto, BH - MG, 31310-370 – Phone: +55 (31) 2514-8733 – E-mail: info@bnaconsultoria.com
|
GoldMining Inc.
NI 43-101 Report – São Jorge Project
|
Page 130 |
Figure 14.6 - Vertical Projection of the Contoured Gold Grades, Domain 201 Looking Towards Azimuth 200º
BNA Mining Solutions - R. Des. Leão Starling, 200 - Ouro Preto, BH - MG, 31310-370 – Phone: +55 (31) 2514-8733 – E-mail: info@bnaconsultoria.com
|
GoldMining Inc.
NI 43-101 Report – São Jorge Project
|
Page 131 |
Figure 14.7 - Vertical Projection of the Contoured Gold Grades, Domain 303 Looking Towards Azimuth 020º
BNA Mining Solutions - R. Des. Leão Starling, 200 - Ouro Preto, BH - MG, 31310-370 – Phone: +55 (31) 2514-8733 – E-mail: info@bnaconsultoria.com
|
GoldMining Inc.
NI 43-101 Report – São Jorge Project
|
Page 132 |
14.8.2 Variography
The directional continuity of the mineralization contained within the larger of the ten mineralized wireframes was examined using the variography functions contained within the Surpac software package. Reasonable model fits with a high nugget (C0) were developed for the largest mineralized wireframe (Domain 201) as shown in Figure 14.8 and Figure 14.9. A summary of the variogram parameters developed for Domain 201 is presented in Table 14.6.
A weak model fit was developed only for the down-plunge direction of Domain 303, while no good model fits were observed for any of the remaining mineralized wireframe domains.
Figure 14.8 - Directional Variogram #1, Domain 201
Figure 14.9 - Directional Variogram #2, Domain 201
BNA Mining Solutions - R. Des. Leão Starling, 200 - Ouro Preto, BH - MG, 31310-370 – Phone: +55 (31) 2514-8733 – E-mail: info@bnaconsultoria.com
|
GoldMining Inc.
NI 43-101 Report – São Jorge Project
|
Page 133 |
Table 14.6 - Summary of Variogram Parameters, Domain 201
|
Item
|
Value
|
|
Variogram Type
|
Standard
|
|
Variogram Model
|
Spherical
|
|
Direction #1
|
Down-plunge (west)
|
|
Orientation
|
-70º  290º (45 degree angular tolerance) 290º (45 degree angular tolerance)
|
|
Nugget (C0)
|
0.80
|
|
Sill, range (C1)
|
0.07, 18 m
|
|
Sill, range (C2)
|
0.25, 57 m
|
|
Direction #2
|
Down-plunge (east)
|
|
Orientation
|
+20º 290º (45 degree angular tolerance)
|
|
Nugget (C0)
|
0.80
|
|
Sill, range (C1)
|
0.07, 18 m
|
|
Sill, range (C2)
|
0.25, 57 m
|
14.9 Block Model Construction
The conceptual operational scenario envisions that mineralized material would be extracted by means of an open pit mine at a potential mining rate on the order of 5,000 tpd to 15,000 tpd, with the gold recovered using a cyanide leach flowsheet.
An upright, non-rotated, sub-blocked block model was created, using the Surpac software package, that comprised an array of parent blocks that measured 5 m x 5 m x 5 m (easting, northing, elevation). A summary of the block model dimensions and block sizes is presented in Table 14.7. Two levels of sub-blocks were created to a minimum size of 1.25 m x 1.25 m x 1.25 m (easting, northing, elevation). A number of attributes were created to store such information as the rock code, material densities, estimated metal grades, mineral resource classification code, and the like. A full listing of the block model attributes is presented in Table 14.8.
It is important to note that given the early stage of the Project development, selection of the most appropriate production rate(s) or selection of the specific mining methods which would ultimately be employed is not possible. Consequently, the selection of block dimensions is preliminary in nature based on the envisioned conceptual operating scenario. The block sizes may need to be revised at a later date as new information permits the identification of the most appropriate production rate and equipment selection.
Table 14.7 - Block Model Definition
|
Type
|
Y (Northing)
|
X (Easting)
|
Z (Elevation)
|
|
Minimum Coordinates (m)
|
9,282,200
|
656,300
|
-300
|
|
Maximum Coordinates (m)
|
9,283,500
|
658,300
|
400
|
|
User Block Size (m)
|
5
|
5
|
5
|
|
Min. Block Size (m)
|
1.25
|
1.25
|
1.25
|
|
Rotation (degrees)
|
0.000
|
0.000
|
0.000
|
BNA Mining Solutions - R. Des. Leão Starling, 200 - Ouro Preto, BH - MG, 31310-370 – Phone: +55 (31) 2514-8733 – E-mail: info@bnaconsultoria.com
|
GoldMining Inc.
NI 43-101 Report – São Jorge Project
|
Page 134 |
Table 14.8 - Listing of Block Model Attributes
|
Attribute Name
|
Type
|
Decimals
|
Background
|
Description
|
|
aucap15_ID3_aniso
|
Real
|
2
|
0
|
Au by ID3, Capped to 15 g/t Au, Anisotropic search ellipse
|
|
aucap15_ID3_iso
|
Real
|
2
|
0
|
Au by ID3, Capped to 15 g/t Au, Isotropic search ellipse
|
|
avg_dist_true_ID3
|
Real
|
1
|
0
|
True average distance of informing samples, ID3
|
|
class
|
Integer
|
-
|
0
|
Classification: 2=indicated, 3=inferred,4=exploration potential
|
|
density
|
Real
|
2
|
2.7
|
monzonite/granite=2.70, syenite=2.67, saprolite=1.7, air=0
|
|
dist_nearest_tru
|
Real
|
1
|
0
|
True distance to nearest informing sample
|
|
domain
|
Integer
|
-
|
0
|
Domain ID's
|
|
hole_id
|
Character
|
-
|
none
|
Area of Influence of DDH by NN
|
|
litho
|
Character
|
-
|
monzonite
|
monzonite, granite, syenite, volcanic, saprolite, or air
|
|
material_4whit
|
Integer
|
-
|
99
|
Air=0, Waste=99, Mineralization=400
|
|
no_samples_ID3
|
Integer
|
-
|
0
|
Number of informing samples, ID3
|
|
pass_no_ID3
|
Integer
|
-
|
0
|
Estimation pass
|
14.10 Search Strategy and Grade Interpolation Parameters
Gold grades were interpolated into the individual blocks for the mineralized domains using the inverse distance cubed (“ID3”) interpolation method. A two-pass approach was used that utilized the search strategies presented in Table 14.9. “Hard” domain boundaries and fixed search ellipse orientations were used to estimate the block grades. Only those samples contained within the respective domain models were allowed to be used to estimate the grades of the blocks within the domain in question, and only those blocks within the domain limits were allowed to receive grade estimates. The capped, composited gold grades of the drill hole intersections were used to estimate the gold block grades.
BNA Mining Solutions - R. Des. Leão Starling, 200 - Ouro Preto, BH - MG, 31310-370 – Phone: +55 (31) 2514-8733 – E-mail: info@bnaconsultoria.com
|
GoldMining Inc.
NI 43-101 Report – São Jorge Project
|
Page 135 |
Table 14.9 - Summary of Search Strategies and Grade Interpolation Parameters
|
Item
|
Domain 101
|
Domain 102
|
Domain 103
|
|
Major Axis
|
Along Strike
|
Along Strike
|
Along Strike
|
|
Major Axis Direction
|
0°at 265°
|
0°at 280°
|
0°at 250°
|
|
Semi-Major Axis
|
Along Strike
|
Along Strike
|
Along Strike
|
|
Semi-Major Direction
|
-90° at 265°
|
-90° at 010°
|
-90° at 250°
|
|
Minor Axis
|
Across Strike
|
Across Strike
|
Across Strike
|
|
Minor Direction
|
0° at 355°
|
0° at 010°
|
0° at 340°
|
|
Major/Semi-Major Ratio
|
1.4
|
1.4
|
1.4
|
|
Major/Minor Ratio
|
2.0
|
2.0
|
2.0
|
|
Length of Major Axis, Pass #1
(Short Range, m)
|
30
|
60
|
30
|
|
Length of Major Axis, Pass #2
(Long Range, m)
|
125
|
125
|
125
|
|
Minimum Number of Samples
|
5
|
5
|
5
|
|
Maximum Number of Samples
|
20
|
20
|
20
|
|
Search Ellipse Type
|
Quadrant
|
Quadrant
|
Quadrant
|
|
Item
|
Domain 104
|
Domain 201
|
Domain 301
|
|
Major Axis
|
Down plunge (west)
|
Down plunge (west)
|
Along Strike
|
|
Major Axis Direction
|
-70°at 290°
|
-70°at 290°
|
0°at 290°
|
|
Semi-Major Axis
|
Along Strike
|
Along Strike
|
Along Strike
|
|
Semi-Major Direction
|
+20° at 290°
|
+20° at 290°
|
-90° at 290°
|
|
Minor Axis
|
Across Strike
|
Across Strike
|
Across Strike
|
|
Minor Direction
|
0° at 020°
|
0° at 020°
|
0° at 020°
|
|
Major/Semi-Major Ratio
|
1.01
|
1.01
|
1.4
|
|
Major/Minor Ratio
|
3.0
|
3.0
|
2.0
|
|
Length of Major Axis, Pass #1
(Short Range, m)
|
30
|
30
|
30
|
|
Length of Major Axis, Pass #2
(Long Range, m)
|
125
|
125
|
125
|
|
Minimum Number of Samples
|
5
|
5
|
5
|
|
Maximum Number of Samples
|
20
|
20
|
20
|
|
Search Ellipse Type
|
Quadrant
|
Quadrant
|
Quadrant
|
|
Item
|
Domain 302
|
Domain 303
|
Domain 401
|
|
Major Axis
|
Along Strike
|
Down plunge (west)
|
Along Strike
|
|
Major Axis Direction
|
0°at 290°
|
-30°at 290°
|
0°at 290°
|
|
Semi-Major Axis
|
Along Strike
|
Along Strike
|
Along Strike
|
|
Semi-Major Direction
|
-90° at 290°
|
+60° at 290°
|
-90° at 290°
|
|
Minor Axis
|
Across Strike
|
Across Strike
|
Across Strike
|
|
Minor Direction
|
0° at 020°
|
0° at 020°
|
0° at 020°
|
|
Major/Semi-Major Ratio
|
1.4
|
1.4
|
1.4
|
|
Major/Minor Ratio
|
2.0
|
2.0
|
2.0
|
|
Length of Major Axis, Pass #1 (Short Range, m)
|
30
|
60
|
30
|
BNA Mining Solutions - R. Des. Leão Starling, 200 - Ouro Preto, BH - MG, 31310-370 – Phone: +55 (31) 2514-8733 – E-mail: info@bnaconsultoria.com
|
GoldMining Inc.
NI 43-101 Report – São Jorge Project
|
Page 136 |
|
Item
|
Domain 302
|
Domain 303
|
Domain 401
|
|
Length of Major Axis, Pass #2
(Long Range, m)
|
125
|
120
|
125
|
|
Minimum Number of Samples
|
5
|
5
|
5
|
|
Maximum Number of Samples
|
20
|
20
|
20
|
|
Search Ellipse Type
|
Quadrant
|
Quadrant
|
Quadrant
|
|
Item
|
Domain 402
|
|
|
|
Major Axis
|
Along Strike
|
|
|
|
Major Axis Direction
|
0°at 260°
|
|
|
|
Semi-Major Axis
|
Along Strike
|
|
|
|
Semi-Major Direction
|
-90° at 260°
|
|
|
|
Minor Axis
|
Across Strike
|
|
|
|
Minor Direction
|
0° at 350°
|
|
|
|
Major/Semi-Major Ratio
|
1.4
|
|
|
|
Major/Minor Ratio
|
2.0
|
|
|
|
Length of Major Axis, Pass #1
(Short Range, m)
|
30
|
|
|
|
Length of Major Axis, Pass #2
(Long Range, m)
|
125
|
|
|
|
Minimum Number of Samples
|
5
|
|
|
|
Maximum Number of Samples
|
20
|
|
|
|
Search Ellipse Type
|
Quadrant
|
|
|
|
14.11
|
Block Model Validation
|
|
14.11.1
|
Visual Comparisons
|
A visual comparison was also made between the distribution of the metal values in the blocks and the contoured metal distributions for selected mineralized wireframes (Figure 14.10, Figure 14.11, and Figure 14.12). In general, good visuals fit were observed.
BNA Mining Solutions - R. Des. Leão Starling, 200 - Ouro Preto, BH - MG, 31310-370 – Phone: +55 (31) 2514-8733 – E-mail: info@bnaconsultoria.com
|
GoldMining Inc.
NI 43-101 Report – São Jorge Project
|
Page 137 |
Figure 14.10 - Comparison of Contoured Grades vs Block Model Estimates, Domain 201
BNA Mining Solutions - R. Des. Leão Starling, 200 - Ouro Preto, BH - MG, 31310-370 – Phone: +55 (31) 2514-8733 – E-mail: info@bnaconsultoria.com
|
GoldMining Inc.
NI 43-101 Report – São Jorge Project
|
Page 138 |
Figure 14.11 - Comparison of Contoured Grades vs Block Model Estimates, Domain 201
BNA Mining Solutions - R. Des. Leão Starling, 200 - Ouro Preto, BH - MG, 31310-370 – Phone: +55 (31) 2514-8733 – E-mail: info@bnaconsultoria.com
|
GoldMining Inc.
NI 43-101 Report – São Jorge Project
|
Page 139 |
Figure 14.12 - Comparison of Contoured Grades vs Block Model Estimates, Domain 303
BNA Mining Solutions - R. Des. Leão Starling, 200 - Ouro Preto, BH - MG, 31310-370 – Phone: +55 (31) 2514-8733 – E-mail: info@bnaconsultoria.com
|
GoldMining Inc.
NI 43-101 Report – São Jorge Project
|
Page 140 |
14.11.2 Swath Plots
Swath plots were constructed for selected mineralized domains that compared the average grade of the informing capped, composite samples with the estimated block gold grades along a series of north-south vertical planes (Figure 14.13, Figure 14.14, and Figure 14.15). A good agreement was observed between the informing samples and the estimated grades.
Figure 14.13 - Swath Plot by Easting, Domain 201
Figure 14.14 - Swath Plot by Easting, Domain 303
BNA Mining Solutions - R. Des. Leão Starling, 200 - Ouro Preto, BH - MG, 31310-370 – Phone: +55 (31) 2514-8733 – E-mail: info@bnaconsultoria.com
|
GoldMining Inc.
NI 43-101 Report – São Jorge Project
|
Page 141 |
Figure 14.15 - Swath Plot by Easting, Domain 104
14.11.3 3D Polygonal De-clustered Mean Grades
The de-clustered mean grades of the informing samples were determined for selected mineralized wireframes using a three-dimensional de-clustering workflow where the average grade of the mineralized interval for each drill hole is calculated in the block model using weights according to the tonnes contained within the drill holes volume of influence. These tonnes-weighted average grades are then compared with the full-length average grades of each drill hole in both tabular and graphic formats.
The average estimated block grades are in good agreement with the de-clustered mean grades of the informing capped, composited samples (Table 14.10). Comparisons of the mean grades of the full-length capped composited average grades with the estimated block grades weighted by drill hole are presented in Figure 14.16, Figure 14.17, and Figure 14.18.
Table 14.10 - Comparison of Three Dimensional De-clustered Mean Grades with Estimated Block Model Grades
|
Domain
|
Polygonal De-clustered Composite
Mean
(g/t Au)
|
Block Model Average Grade
(g/t Au)
|
|
201
|
0.61
|
0.59
|
|
303
|
0.40
|
0.46
|
|
104
|
0.70
|
0.70
|
BNA Mining Solutions - R. Des. Leão Starling, 200 - Ouro Preto, BH - MG, 31310-370 – Phone: +55 (31) 2514-8733 – E-mail: info@bnaconsultoria.com
|
GoldMining Inc.
NI 43-101 Report – São Jorge Project
|
Page 142 |
Figure 14.16 - Polygonally De-clustered DDH Grades vs Block Model Estimated Grades, Domain 201
Figure 14.17 - Polygonally De-clustered DDH Grades vs Block Model Estimated Grades, Domain 303
BNA Mining Solutions - R. Des. Leão Starling, 200 - Ouro Preto, BH - MG, 31310-370 – Phone: +55 (31) 2514-8733 – E-mail: info@bnaconsultoria.com
|
GoldMining Inc.
NI 43-101 Report – São Jorge Project
|
Page 143 |
Figure 14.18 - Polygonally De-clustered DDH Grades vs Block Model Estimated Grades, Domain 104
BNA Mining Solutions - R. Des. Leão Starling, 200 - Ouro Preto, BH - MG, 31310-370 – Phone: +55 (31) 2514-8733 – E-mail: info@bnaconsultoria.com
|
GoldMining Inc.
NI 43-101 Report – São Jorge Project
|
Page 144 |
14.12 Classification
The mineralized material for each domain was classified into the Indicated or Inferred Mineral Resource category considering the ranges obtained from the variography study, the demonstrated continuity of the gold grades observed from the trend analysis study, the demonstrated spatial continuity of the mineralized wireframe domains, and the density of drill hole information. Clipping polygons were used to apply the final classification codes to the block model.
In general, those portions of the mineralized wireframes for domains 104, 201, and 303 were classified into the Indicated Mineral Resource category (Class = 2) where the drill hole information was at a drill hole spacing of 60 m or less. Those portions of the mineralized wireframes were classified into the Inferred Mineral Resource category (Class = 3) where the drill hole information was at a drill hole spacing of 100 m or less. The portions of the mineralized wireframes which received estimated grades that were not classified into either the Indicated or Inferred categories were assigned to the estimated, but unclassified category (Class = 4). All remaining blocks in the mineralized wireframes that were not assigned into one of these three categories retained the default classification (Figure 14.19).
BNA Mining Solutions - R. Des. Leão Starling, 200 - Ouro Preto, BH - MG, 31310-370 – Phone: +55 (31) 2514-8733 – E-mail: info@bnaconsultoria.com
|
GoldMining Inc.
NI 43-101 Report – São Jorge Project
|
Page 145 |
Figure 14.19 - Longitudinal View of the Classified Mineral Resources, Domain 201
BNA Mining Solutions - R. Des. Leão Starling, 200 - Ouro Preto, BH - MG, 31310-370 – Phone: +55 (31) 2514-8733 – E-mail: info@bnaconsultoria.com
|
GoldMining Inc.
NI 43-101 Report – São Jorge Project
|
Page 146 |
14.13 Determination of Reasonable Prospects for Eventual Economic Extraction (“RPEEE”)
The current conceptual operating scenario envisions the mineralized material to be excavated by means of an open pit mine at an envisioned production rate of between 5,000 tpd and 15,000 tpd. The material would then be processed at an on-site facility where gold would be recovered using a cyanide leaching flowsheet. The SLR QP estimates operating costs of US$ 2.50/t for mining, US$ 10.00/t for milling, and US$ 5.50/t for general and administrative costs.
A long-term gold price of US$ 1,950/oz Au was used in the preparation of the cut-off grade estimate. Along with overall metallurgical recoveries of 90%, a selling cost of US$ 6.00/oz Au, and a royalty rate of 3.5%, the SLR QP estimates the breakeven cut-off grade to be 0.27 g/t Au and the pit discard cut-off grade to be 0.22 g/t Au.
A base case pit shell surface was created using the pseudoflow algorithm option of the Whittle software package. Overall wall slopes of 50° were used for fresh rock and wall slopes of 35° were used for the soil and saprolite layers (Figure 14.20).
The SLR QP recommends that geotechnical studies be carried out in support of the selection of overall wall slope angles for fresh rock and for the soil and saprolite layers.
BNA Mining Solutions - R. Des. Leão Starling, 200 - Ouro Preto, BH - MG, 31310-370 – Phone: +55 (31) 2514-8733 – E-mail: info@bnaconsultoria.com
|
GoldMining Inc.
NI 43-101 Report – São Jorge Project
|
Page 147 |
Figure 14.20 - Isometric View of the Mineral Resource Pit Shell
BNA Mining Solutions - R. Des. Leão Starling, 200 - Ouro Preto, BH - MG, 31310-370 – Phone: +55 (31) 2514-8733 – E-mail: info@bnaconsultoria.com
|
GoldMining Inc.
NI 43-101 Report – São Jorge Project
|
Page 148 |
14.14 Mineral Resource Reporting
As a result of the concepts and processes described in this report, the Mineral Resource Estimate for the São Jorge deposit is presented in Table 14.11.
Open pit Mineral Resources at a breakeven cut-off grade of 0.27 g/t Au are estimated to total 19,418,000 t at an average grade of 1.00 g/t Au containing approximately 624 thousand ounces (“koz”) Au in the Indicated Resource category. An additional 5,557,000 t at an average grade of 0.72 g/t Au containing approximately 129 koz Au are estimated to be present in the Inferred Mineral Resource category.
Table 14.11 - Mineral Resources as at January 28, 2025
|
Category
|
Domain ID
|
Tonnage
(000 t)
|
Grade
(g/t Au)
|
Contained Metal
(000 oz Au)
|
|
Indicated (Class = 2)
|
104
|
798
|
1.21
|
31
|
| |
201
|
17,195
|
0.99
|
547
|
| |
303
|
1,425
|
1.04
|
48
|
|
Sub-total, Indicated
|
|
19,418
|
1.00
|
624
|
|
Inferred (Class = 3)
|
101
|
133
|
0.65
|
3
|
| |
102
|
367
|
0.52
|
7
|
| |
103
|
153
|
0.70
|
3
|
| |
104
|
656
|
0.94
|
20
|
| |
201
|
2,438
|
0.75
|
59
|
| |
301
|
103
|
0.47
|
2
|
| |
302
|
734
|
0.59
|
14
|
| |
303
|
103
|
0.98
|
3
|
| |
401
|
275
|
0.61
|
5
|
| |
402
|
565
|
0.74
|
13
|
|
Sub-total, Inferred
|
|
5,557
|
0.72
|
129
|
Notes:
| |
1.
|
CIM (2014) definitions were followed for Mineral Resources.
|
| |
2.
|
Mineral Resources are estimated at a break-even cut-off grade of 0.27 g/t Au for classified blocks above a constraining pit shell.
|
| |
3.
|
Mineral Resources are estimated using a long-term gold price of US$ 1,950 per ounce.
|
| |
4.
|
A minimum mining width of five meters was used.
|
| |
5.
|
There are no Mineral Reserves estimated at the São Jorge Project. Mineral Resources that are not Mineral Reserves do not have demonstrated economic viability.
|
| |
6.
|
Numbers may not add due to rounding.
|
A breakdown of the Mineral Resources by material type is presented in Table 14.12. Approximately 5% of the contained gold in the Indicated Mineral Resources category resides within the weathered layer. Approximately 16% of the contained gold in the Inferred Mineral Resources category resides within the weathered layer.
BNA Mining Solutions - R. Des. Leão Starling, 200 - Ouro Preto, BH - MG, 31310-370 – Phone: +55 (31) 2514-8733 – E-mail: info@bnaconsultoria.com
|
GoldMining Inc.
NI 43-101 Report – São Jorge Project
|
Page 149 |
Table 14.12 - Mineral Resources as at January 28, 2025 by Material Type
|
Category
|
Tonnage
(000 t)
|
Grade
(g/t Au)
|
Contained Metal
(000 oz Au)
|
Tonnage
(000 t)
|
|
Indicated (Class = 2)
|
saprolite
|
1,054
|
0.92
|
31
|
| |
monzonite
|
18,178
|
1.01
|
590
|
| |
syenite
|
186
|
0.88
|
5
|
|
Sub-total, Indicated
|
|
19,418
|
1.00
|
624
|
|
Inferred (Class = 3)
|
saprolite
|
827
|
0.76
|
20
|
| |
monzonite
|
4,641
|
0.72
|
107
|
| |
syenite
|
89
|
0.76
|
2
|
|
Sub-total, Inferred
|
|
5,557
|
0.72
|
129
|
Notes:
| |
1.
|
CIM (2014) definitions were followed for Mineral Resources.
|
| |
2.
|
Mineral Resources are estimated at a breakeven cut-off grade of 0.27 g/t Au for classified blocks above a constraining pit shell.
|
| |
3.
|
Mineral Resources are estimated using a long-term gold price of US$ 1,950 per ounce.
|
| |
4.
|
A minimum mining width of five meters was used.
|
| |
5.
|
There are no Mineral Reserves estimated at the São Jorge Project. Mineral Resources that are not Mineral Reserves do not have demonstrated economic viability.
|
| |
6.
|
Numbers may not add due to rounding
|
14.15 Factors Affecting the Mineral Resource
Mineral Resources, which are not Mineral Reserves, do not have demonstrated economic viability. At the present time, the SLR QP is not aware of any environmental, permitting, legal, title, taxation, socio-political, marketing, or other relevant issues that may have a material impact on the São Jorge deposit Mineral Resource estimate other than those discussed below.
Factors that may affect the São Jorge deposit Mineral Resource estimates include:
| |
●
|
Metal price and exchange rate assumptions,
|
| |
●
|
Changes to the assumptions used to generate grade thresholds used for construction of the mineralized wireframe domains,
|
| |
●
|
Changes to geological and mineralization shape and geological and grade continuity assumptions and interpretations,
|
| |
●
|
Due to the natural geological variability inherent with mineralized zones intrusive-related gold deposits, the presence, location, size, shape, and grade of the actual mineralization located between the existing sample points may differ from the current interpretation. The level of uncertainty in these items is lower for the Indicated Mineral Resource category and is higher for the Inferred Mineral Resource category,
|
| |
●
|
Changes to the understanding of the current geological and mineralization shapes and geological and grade continuity resulting from acquisition of additional geological and assay information from future drilling or sampling programs,
|
| |
●
|
Changes to the assumed metallurgical recoveries,
|
| |
●
|
Changes in the treatment of high-grade gold values,
|
BNA Mining Solutions - R. Des. Leão Starling, 200 - Ouro Preto, BH - MG, 31310-370 – Phone: +55 (31) 2514-8733 – E-mail: info@bnaconsultoria.com
|
GoldMining Inc.
NI 43-101 Report – São Jorge Project
|
Page 150 |
| |
●
|
Changes due to the assignment of density values,
|
| |
●
|
Changes to the input and design parameter assumptions that pertain to the assumptions for creation of open pit constraining surfaces,
|
| |
●
|
Portions of material currently classified into the Inferred Mineral Resource category may not be upgraded into higher categories with completion of further sampling activities, and
|
| |
●
|
Changes to the Mineral Resource reporting cut-off grade value.
|
14.16 Sensitivity Analysis
A sensitivity analysis was performed to examine the impact of varying gold prices on the size and shape of the resulting pit surfaces from the base case scenario. All parameters other than the gold price were kept constant, which were varied from a low of US$ 195/oz to a high of US$ 2,925/oz. A total of 15 pit shells were created. A summary of the results from selected pit shells is presented in Table 14.13. The tonnages and grades were derived by reporting all blocks classified into either the Indicated or Inferred Resource categories containing estimated grades above the nominated break-even cut-off grade located above the appropriate pit shell.
An isometric view of the selected pit shells is presented in Figure 14.21, and a typical cross section is presented in Figure 14.22.
Table 14.13 - Sensitivity Analysis for Selected Pit Shells
|
Cut-off Grade
(Break Even)
|
Category
|
Tonnage
(000 t)
|
Grade
(g/t Au)
|
Contained Metal
(000 oz Au)
|
|
Pit Shell #10 (Base Case, US$ 1,950/oz)
|
|
>= 0.27
|
Indicated
|
19,418
|
1.00
|
624
|
|
>= 0.27
|
Inferred
|
5,557
|
0.72
|
129
|
|
0.00 to 0.27
|
Waste
|
119,609
|
|
|
|
Pit Shell #8 (US$ 1,560/oz)
|
|
>= 0.34
|
Indicated
|
15,371
|
1.1
|
544
|
|
>= 0.34
|
Inferred
|
3,103
|
0.77
|
77
|
|
0.00 to 0.34
|
Waste
|
72,207
|
|
|
|
Pit Shell #5 (US$ 975/oz)
|
|
>= 0.54
|
Indicated
|
9,630
|
1.32
|
409
|
|
>= 0.54
|
Inferred
|
1,200
|
1.06
|
41
|
|
0.00 to 0.54
|
Waste
|
46,206
|
|
|
|
Pit Shell #3 (US$ 585/oz)
|
|
>= 0.91
|
Indicated
|
2,107
|
1.89
|
128
|
|
>= 0.91
|
Inferred
|
195
|
1.51
|
9
|
|
0.00 to 0.91
|
Waste
|
8,727
|
|
|
BNA Mining Solutions - R. Des. Leão Starling, 200 - Ouro Preto, BH - MG, 31310-370 – Phone: +55 (31) 2514-8733 – E-mail: info@bnaconsultoria.com
|
GoldMining Inc.
NI 43-101 Report – São Jorge Project
|
Page 151 |
Figure 14.21 - Isometric View of Selected Pit Shells from the Sensitivity Analysis
BNA Mining Solutions - R. Des. Leão Starling, 200 - Ouro Preto, BH - MG, 31310-370 – Phone: +55 (31) 2514-8733 – E-mail: info@bnaconsultoria.com
|
GoldMining Inc.
NI 43-101 Report – São Jorge Project
|
Page 152 |
Figure 14.22 - Cross Section 657,500E Showing Selected Pit Shells from the Sensitivity Analysis
BNA Mining Solutions - R. Des. Leão Starling, 200 - Ouro Preto, BH - MG, 31310-370 – Phone: +55 (31) 2514-8733 – E-mail: info@bnaconsultoria.com
|
GoldMining Inc.
NI 43-101 Report – São Jorge Project
|
Page 153 |
|
15
|
Mineral Reserve Estimate
|
No Mineral Reserves have been estimated for the São Jorge Project.
This Technical Report has been prepared as a Preliminary Economic Assessment and, as such, does not include the estimation of Mineral Reserves.
BNA Mining Solutions - R. Des. Leão Starling, 200 - Ouro Preto, BH - MG, 31310-370 – Phone: +55 (31) 2514-8733 – E-mail: info@bnaconsultoria.com
|
GoldMining Inc.
NI 43-101 Report – São Jorge Project
|
Page 154 |
This section describes the mining method, mine design, production schedule, and supporting assumptions for the São Jorge Project, developed at a Preliminary Economic Assessment level.
The mine plan is based on the Mineral Resource estimate presented in Section 14 and represents a conceptual extraction sequence designed to evaluate the potential economic viability of the Project. The mine plan includes Indicated and Inferred Mineral Resources and does not constitute Mineral Reserves.
For the purposes of this PEA, the term “mineralized material” is used to describe material contained within the conceptual mine plan derived from the Mineral Resource estimate and scheduled for processing. The term does not imply the existence of Mineral Reserves or economically mineable mineralized material as defined under NI 43-101.
The mine design and production schedule were developed using industry-standard mine planning software and methodologies, including pit optimization, operational pit design, and production sequencing.
The level of detail presented reflects the accuracy and confidence appropriate for a PEA and is subject to further refinement in subsequent phases of project development.
|
16.2
|
Geotechnical Studies
|
Geotechnical studies for the Project were conducted by Gabriel Neiva, based on available geological, exploration drilling, geotechnical and structural data provided by GMI.
The analyses were performed at a Preliminary Economic Assessment level and included rock mass characterization using the Rock Mass Rating (“RMR”) and Geological Strength Index (“GSI”) systems, slope stability analyses, and kinematic assessments for planar failure using industry-standard methodologies such as Hoek–Brown failure criterion, limit equilibrium methods, and kinematic analysis tools.
16.2.1 Geological Context
The geological framework of the São Jorge Project has been considered in the development of the geotechnical model and mine design. A detailed description of the regional and local geology is provided in Item 7.
The Project is hosted within granitic intrusive rocks of the Tapajós Gold Province, with mineralization structurally controlled by regional NW–SE trends, including the Cuiú-Cuiú–Tocantinzinho lineament.
The geological interpretation applied in this study is based on the mineral exploration database, including drilling information, and has been validated through field observations and core logging.
BNA Mining Solutions - R. Des. Leão Starling, 200 - Ouro Preto, BH - MG, 31310-370 – Phone: +55 (31) 2514-8733 – E-mail: info@bnaconsultoria.com
|
GoldMining Inc.
NI 43-101 Report – São Jorge Project
|
Page 155 |
16.2.2 Technical Visit
For this stage of the work, a technical visit was carried out, led by geologist Gabriel Neiva between February 25 and 27, 2026. The visit provided a reasonable level of confidence regarding the consistency of the previously acquired geological and drillhole description data by the GoldMining team.
As part of this work, drillhole SJD-120-24 was reviewed (Figure 16.1), along with visits to active artisanal mining sites to observe near-surface geological exposures (Figure 16.2).
Figure 16.1 - Validation of drillhole SJD-120-24
BNA Mining Solutions - R. Des. Leão Starling, 200 - Ouro Preto, BH - MG, 31310-370 – Phone: +55 (31) 2514-8733 – E-mail: info@bnaconsultoria.com
|
GoldMining Inc.
NI 43-101 Report – São Jorge Project
|
Page 156 |
Figure 16.2 - Visit to active artisanal mining area within the São Jorge deposit
16.2.3 Pit
The definition of the geomechanical parameters for the São Jorge deposit was conducted based on an integrated approach combining validation of field data, established technical references, and the adoption of conservative assumptions, consistent with the level of detail of this stage of the study.
The field campaign carried out between February 25 and 27, 2026, allowed for consistent validation of previously executed drilling descriptions by the GoldMining team, including direct verification of drill core — particularly drillhole SJD-120-24 — as well as complementary observations in active artisanal mining faces. This integration of indirect data (drilling) and natural exposures of the rock mass provided a adequate basis for geomechanical characterization.
Core analysis indicated low geomechanical variability of the intact rock throughout the deposit. Although certain zones exhibit significant improvements in rock mass quality, it was decided not to subdivide the model into multiple classes. Instead, a single representative class was adopted, constrained by the worst observed conditions. This approach follows established practice in early-stage projects, prioritizing robustness and safety in the analyses by avoiding overestimation of geotechnical performance.
BNA Mining Solutions - R. Des. Leão Starling, 200 - Ouro Preto, BH - MG, 31310-370 – Phone: +55 (31) 2514-8733 – E-mail: info@bnaconsultoria.com
|
GoldMining Inc.
NI 43-101 Report – São Jorge Project
|
Page 157 |
Even under this conservative approach, the rock mass presents favorable characteristics, with a Geological Strength Index (“GSI”) in the range of 70 to 75 in the more fractured portions, indicating a globally competent geomechanical framework.
With respect to the unit weight of the rocks, its definition was based on two complementary approaches: (i) typical values reported in geotechnical and mineralogical literature for granitic rocks (e.g., Hoek & Marinos, 2000; International Society for Rock Mechanics guidelines), and (ii) density test results obtained from the actual materials composing the pit rock mass. This combination allowed for the adoption of a representative and technically consistent value, reflecting both expected theoretical behavior and in situ conditions.
The parameters of the Hoek–Brown criterion were defined following the same rationale. The GSI was estimated based on core observations, with penalization applied to more fractured zones. The uniaxial compressive strength was fixed at a conservative value, consistent with early-stage classifications of partially altered rock masses, ensuring alignment with systems such as RMR and avoiding overestimation. The parameter mi was selected from classical tables for granitic rocks, while the disturbance factor (“D”) was set to 1.0, representing a scenario of high disturbance induced by excavation and blasting, reinforcing the conservative nature of the modeling. Although the in-situ rock mass quality is considered good, a disturbance factor D = 1.0 was conservatively adopted at this stage to account for potential excavation-induced damage, blast-related disturbance, and uncertainties associated with the limited geotechnical database available at the PEA level.
The decision not to differentiate between monzogranite and syenogranite was also deliberate, as despite mineralogical variations, their geomechanical behavior at the rock mass scale is similar, not justifying further subdivision at this stage.
For weathered materials (soils and saprolites), parameter definition followed a different approach. Considering their limited thickness and lower representativeness within the overall pit context, their properties have a reduced influence on global stability analyses. Nevertheless, parameters were defined based on literature and analogies with similar deposits, using the Mohr–Coulomb criterion. It is emphasized that, despite their relatively lower influence, these approximations were deliberately conservative, ensuring that local variations in these materials do not compromise the safety of the analyses.
In summary, the adopted approach sought to balance geotechnical realism and conservatism, using field-validated data, support from technical literature, and prudent assumptions. This ensures that the defined parameters are suitable for preliminary analyses while maintaining technical consistency and safety in the geomechanical interpretation of the deposit.
16.2.4 Waste Dump
The definition of the geotechnical parameters for the materials constituting the waste rock dump at the São Jorge deposit considered three main domains:
| |
I.
|
rockfill waste (coarser fraction);
|
BNA Mining Solutions - R. Des. Leão Starling, 200 - Ouro Preto, BH - MG, 31310-370 – Phone: +55 (31) 2514-8733 – E-mail: info@bnaconsultoria.com
|
GoldMining Inc.
NI 43-101 Report – São Jorge Project
|
Page 158 |
| |
II.
|
waste rock with greater granulometric heterogeneity;
|
The approach adopted combined classical references from geotechnical and mining literature with practical experience in analogous materials, consistently applying a conservative bias.
Rockfill Waste (c’ = 5 kPa; φ’peak = 40°; φ’cs = 36°; γ = 22 kN/m³)
Rockfill is characterised by coarse rock fragments, with high shear strength governed essentially by friction and interlocking between particles. The adopted peak friction angle (40°) is consistent with values reported for rockfill materials in geotechnical works, as compiled by Karl Terzaghi, Ralph B. Peck and Gholamreza Mesri (1996), as well as guidelines from the International Commission on Large Dams for coarse granular materials, which indicate typical ranges between 38° and 45°.
The critical friction angle (36°) reflects post-peak conditions, considering the partial loss of interlocking with deformation, and is consistent with recommendations by Evert Hoek and Edwin T. Brown (1980), which suggest a reduction in friction for long-term conditions.
The cohesion value (5 kPa) represents apparent cohesion associated with mechanical interlocking and possible suction effects under unsaturated conditions, which is common practice in rockfill modelling (J. Michael Duncan, 2014).
The unit weight (22 kN/m³) was defined based on typical values for compacted granitic rockfill, as reported in manuals for rockfill dams by the U.S. Army Corps of Engineers (EM 1110-2-2300), which indicate typical ranges between 20 and 24 kN/m³.
Waste Rock Dump (c’ = 9 kPa; φ’peak = 36°; φ’cs = 32°; γ = 20 kN/m³)
The waste rock dump represents a more heterogeneous material, composed of a mixture of blocks, gravels, and fine fractions. The peak friction angle (36°) was adopted based on compilations of granular materials derived from blasted hard rock, as presented by Evert Hoek and Paul Marinos (2000/2018), and guidelines from the International Society for Rock Mechanics, which indicate typical values between 34° and 40°.
The critical friction angle (32°) reflects the residual strength condition after particle rearrangement and is consistent with recommended practice for global stability analyses of waste dumps, as discussed by J. Michael Duncan and Stephen G. Wright (2005).
The apparent cohesion (9 kPa) is slightly higher than that of rockfill due to the presence of fines and possible matric suction and is consistent with values suggested for granular soils with fine content (Braja M. Das, 2010).
BNA Mining Solutions - R. Des. Leão Starling, 200 - Ouro Preto, BH - MG, 31310-370 – Phone: +55 (31) 2514-8733 – E-mail: info@bnaconsultoria.com
|
GoldMining Inc.
NI 43-101 Report – São Jorge Project
|
Page 159 |
The unit weight (20 kN/m³) falls within the typical range for loosely compacted waste rock dumps, as reported in mining studies and guidance from the U.S. Army Corps of Engineers and mining engineering literature, which indicate typical values between 18 and 22 kN/m³.
Clayey Layer (c’ = 22 kPa; φ’peak = 24°; φ’cs = 18°; γ = 19 kN/m³)
The clayey layer represents finer and more cohesive materials, with behaviour governed by effective cohesion and a lower contribution from friction. The adopted cohesion (22 kPa) is consistent with typical values for medium consistency clays, as reported by Karl Terzaghi et al. (1996) and Braja M. Das (2010), which indicate typical ranges between 15 and 40 kPa.
The peak friction angle (24°) and critical friction angle (18°) reflect the typical behaviour of clays, where a significant reduction in strength occurs with deformation, particularly under drained conditions, as discussed by Andrew N. Schofield and Peter Wroth (1968) in critical state soil mechanics theory.
The unit weight (19 kN/m³) was adopted based on typical values for natural clay soils, according to guidelines from the International Society for Soil Mechanics and Geotechnical Engineering, which indicate typical ranges between 17 and 20 kN/m³.
Overall, the parameters adopted for the three domains adequately represent the expected behaviour of the materials, based on established literature and engineering practice, while maintaining a conservative approach.
This approach is particularly important at this stage of study, ensuring stability analyses are conducted with appropriate safety margins despite uncertainties related to material variability and the construction conditions of the waste rock dump.
16.2.5 Final Consideration
Overall, the parameters adopted for the three domains adequately represent the expected behavior of the materials, based on established literature and engineering practice, while maintaining a conservative approach. This is essential at this stage of the study, ensuring safety in the analyses despite uncertainties related to material variability and construction conditions of the waste dump.
The geotechnical assessment presented herein is based on existing geotechnical-specific investigation data available at the PEA stage. Additional drilling, laboratory testing, hydrogeological characterization, and structural mapping are recommended to support future Pre-Feasibility and Feasibility level studies.
The final recommended parameters adopted in this study are presented in Table 16.1 and Table 16.2.
BNA Mining Solutions - R. Des. Leão Starling, 200 - Ouro Preto, BH - MG, 31310-370 – Phone: +55 (31) 2514-8733 – E-mail: info@bnaconsultoria.com
|
GoldMining Inc.
NI 43-101 Report – São Jorge Project
|
Page 160 |
Table 16.1 - Final Pit Design Parameters
|
Parameter
|
Unit
|
Value
|
|
Bench Height
|
meters
|
10.00
|
|
Minimum Berm Width
|
meters
|
6.00
|
|
Road Width
|
meters
|
12.00
|
|
Road Gradient
|
%
|
10.00
|
|
Overall Slope Angle - Saprolite
|
degrees
|
29.17
|
|
Overall Slope Angle - Fresh Rock
|
degrees
|
46.01
|
|
Bench Face Angle - Saprolite
|
degrees
|
40.00
|
|
Bench Face Angle - Fresh Rock
|
degrees
|
70.00
|
Table 16.2 - Final Waste Dump Parameters
|
Parameter
|
Unit
|
Value
|
|
Bench Height
|
meters
|
10
|
|
Berm Width
|
meters
|
4
|
|
Safety Berm Width
|
meters
|
8
|
|
Safety Berm Frequency
|
benches
|
Every four benches
|
|
Main Access Width
|
meters
|
12
|
|
Ramp Gradient
|
%
|
10
|
|
Overall Slope Angle
|
degrees
|
26
|
|
Bench Face Angle
|
degrees
|
32
|
16.3 Base Data, Design Criteria and Project Parameters
16.3.1 Technical and Economic Parameters Used for Final Pit Generation
The technical and economic parameters are used to generate the optimal mathematical pit, which represents the pit that maximizes the project value. This pit is obtained through the application of the Lerchs–Grossmann algorithm. The optimization process was carried out using the tools available in Micromine 2025.
The classical methodology for selecting the optimal mathematical pit consists of generating a set of pit shells by applying Revenue Adjustment Factors (“RAF”). This factor is applied to the product selling price(s), such that a mathematical pit is generated for each factor applied. The results from this set of pit shells are then analysed to define the optimal pit for the Project.
The mineralization classified as indicated and inferred was considered mineralized material for the optimization, while the mineralization classified as potential was considered waste. There is no material classified as measured in the current model.
The parameters were provided by GMI and are presented in Table 16.3.
BNA Mining Solutions - R. Des. Leão Starling, 200 - Ouro Preto, BH - MG, 31310-370 – Phone: +55 (31) 2514-8733 – E-mail: info@bnaconsultoria.com
|
GoldMining Inc.
NI 43-101 Report – São Jorge Project
|
Page 161 |
Table 16.3 - Technical and Economic Parameters Used for Final Pit Optimization
|
Optimisation Parameters
|
|
Parameter
|
Unit
|
Value
|
|
Mining cost
|
USD/t Mov.
|
2.50
|
|
Process Cost
|
USD/t
|
10.00
|
|
G&A Cost
|
$/t milled
|
5.50
|
|
Refining Cost
|
USD/oz
|
6.00
|
|
Royalty
|
%
|
3.50
|
|
Mining Recovery
|
%
|
97.0
|
|
Mining Dilution
|
%
|
5.0
|
|
Discount Rate
|
% year
|
8.0
|
|
Cut-off Grade
|
g/t
|
0.25
|
|
Gold Price
|
USD/oz
|
2,500
|
|
Metallurgical Recovery
|
%
|
90.0
|
|
Processing Rate
|
t x 106 / year
|
2.00
|
|
Overall Slope Angle - Saprolite
|
degrees
|
29.17
|
|
Overall Slope Angle - Fresh Rock
|
degrees
|
46.01
|
A gold selling price of US$ 2,500/oz Au was used for pit optimization purposes. This value is lower than the gold price adopted in the economic analysis and was selected as a more conservative assumption for defining the optimized pit shell. The use of a lower gold price in the optimization provides a more robust and constrained pit geometry, reducing the risk of including marginal material that may only become economic under higher gold price assumptions. The economic analysis was subsequently completed using the selected project gold price assumptions; however, the pit optimization results presented in this section were generated using the US$ 2,500/oz Au price and should be reproduced using this same value.
A discount rate of 8% was initially applied solely to compare the relative economic attractiveness of the pit shells generated under each Revenue Adjustment Factor (“RAF”) scenario. As pit shell geometries are determined independently of the discount rate, this parameter did not influence the resulting shell configurations. For the Project’s economic evaluation, a discount rate of 5% was adopted and applied consistently to all projected revenue, capital expenditure (“CAPEX”), and operating expenditure (“OPEX”) cash flows. This discount rate was used in the calculation of all economic indicators presented herein.
16.3.2 Surface Constraints
The spatial constraints were provided by GMI and evaluated by BNA. Based on this assessment, it was concluded that the constraint areas do not interfere with the optimized pit and therefore do not impact its definition.
The constraints received are presented in Figure 16.3.
BNA Mining Solutions - R. Des. Leão Starling, 200 - Ouro Preto, BH - MG, 31310-370 – Phone: +55 (31) 2514-8733 – E-mail: info@bnaconsultoria.com
|
GoldMining Inc.
NI 43-101 Report – São Jorge Project
|
Page 162 |
Figure 16.3 - Surface Constraints
16.4 Optimal Pit Selection
The final pit optimization was conducted using the geological modelling and mine planning software Micromine 2025, which applies the Lerchs–Grossmann algorithm to generate pit shells.
For the purposes of this PEA, the term “mineralized material” is used to describe material contained within the conceptual mine plan derived from the Mineral Resource estimate and scheduled for processing. The term does not imply the existence of Mineral Reserves or that the material is economically mineable as defined under NI 43-101.
For the generation of pit shells, a Revenue Adjustment Factor (“RAF”) was applied to the final product selling price, such that each factor resulted in a distinct pit shell, forming a set of nested pits. The RAF values ranged from 0.20 to 1.00, with increments of 0.05; from 1.10 to 2.00, with increments of 0.10; and from 3.00 to 10.00, with increments of 1.00.
RAF values greater than 2.00 were included to assess the sensitivity of the model to more favourable economic scenarios. Although such values are not considered representative of short-term market conditions, their application allows for the evaluation of pit geometry and block model response under higher price assumptions, supporting the definition of the economic limit of the deposit and long-term upside potential.
BNA Mining Solutions - R. Des. Leão Starling, 200 - Ouro Preto, BH - MG, 31310-370 – Phone: +55 (31) 2514-8733 – E-mail: info@bnaconsultoria.com
|
GoldMining Inc.
NI 43-101 Report – São Jorge Project
|
Page 163 |
Waste material was subdivided into the following categories:
| |
●
|
Low-Grade Waste – material with gold grades but not economically viable, and therefore treated as waste by the optimization process;
|
| |
●
|
Potential Waste – material classified in the block model as potentially mineralized but not included as Mineralized Material under the base economic scenario;
|
| |
●
|
Waste – material with no economic value.
|
The results of the optimization are presented in Table 16.4, Figure 16.4 and Figure 16.5.
BNA Mining Solutions - R. Des. Leão Starling, 200 - Ouro Preto, BH - MG, 31310-370 – Phone: +55 (31) 2514-8733 – E-mail: info@bnaconsultoria.com
|
GoldMining Inc.
NI 43-101 Report – São Jorge Project
|
Page 164 |
Table 16.4 - Final Pit Optimization Results
|
PIT OPTIMISATION RESULT - INDICATED AND INFERRED RESOURCES - NO SPATIAL CONSTRAINTS
|
| |
USD x oz
|
Tonnes X 106
|
g/t - Diluted
|
x103
|
USD x 106
|
Strip Ratio
|
|
RAF
|
Gold
Price
|
Indicated Mineralized Material
|
Inferred Mineralized
Material
|
Total Mineralized
Material2
|
Waste
|
Low Grade Waste
|
Potential Mineralized
Material
|
Total Waste
|
Au Indicated Mineralized Material
|
Au Inferred Mineralized Material
|
Au Total
|
Ounces Produced
|
Cashflow
Best Case
|
Cashflow
CL4
|
Undiscounted
Cashflow
|
|
0.20
|
500
|
1.1
|
0.1
|
1.2
|
1.3
|
0.3
|
0.0
|
1.5
|
1.38
|
0.99
|
1.35
|
44.47
|
80.51
|
80.51
|
86.95
|
1.28
|
|
0.25
|
625
|
2.3
|
0.2
|
2.5
|
3.1
|
0.5
|
0.0
|
3.7
|
1.30
|
1.17
|
1.28
|
88.11
|
153.44
|
153.24
|
168.69
|
1.47
|
|
0.30
|
750
|
3.6
|
0.4
|
4.0
|
5.6
|
1.1
|
0.0
|
6.7
|
1.21
|
1.02
|
1.19
|
130.17
|
215.29
|
214.72
|
240.83
|
1.70
|
|
0.35
|
875
|
6.1
|
0.7
|
6.8
|
10.7
|
2.6
|
0.0
|
13.3
|
1.10
|
0.89
|
1.08
|
201.40
|
301.79
|
300.00
|
353.86
|
1.97
|
|
0.40
|
1,000
|
9.1
|
1.0
|
10.1
|
19.0
|
3.9
|
0.0
|
22.9
|
1.04
|
0.87
|
1.02
|
284.48
|
388.59
|
385.61
|
480.25
|
2.28
|
|
0.45
|
1,125
|
10.4
|
1.2
|
11.6
|
24.4
|
4.6
|
0.0
|
29.0
|
1.03
|
0.84
|
1.01
|
322.64
|
422.80
|
417.75
|
534.55
|
2.51
|
|
0.50
|
1,250
|
13.7
|
1.7
|
15.4
|
41.4
|
6.3
|
0.0
|
47.7
|
1.00
|
0.78
|
0.98
|
415.02
|
487.04
|
480.27
|
651.85
|
3.10
|
|
0.55
|
1,375
|
14.9
|
2.3
|
17.2
|
49.3
|
6.8
|
0.1
|
56.3
|
0.99
|
0.75
|
0.96
|
455.11
|
510.69
|
500.97
|
699.05
|
3.26
|
|
0.60
|
1,500
|
15.6
|
2.6
|
18.2
|
53.4
|
7.2
|
0.1
|
60.7
|
0.98
|
0.73
|
0.95
|
474.21
|
520.57
|
509.68
|
719.40
|
3.34
|
|
0.65
|
1,625
|
16.1
|
3.0
|
19.1
|
58.6
|
7.5
|
0.1
|
66.2
|
0.98
|
0.71
|
0.94
|
493.54
|
528.93
|
516.94
|
737.46
|
3.46
|
|
0.70
|
1,750
|
16.5
|
3.2
|
19.7
|
61.2
|
7.7
|
0.1
|
69.0
|
0.97
|
0.70
|
0.93
|
503.31
|
532.53
|
520.30
|
745.23
|
3.51
|
|
0.75
|
1,875
|
17.5
|
3.5
|
21.0
|
71.9
|
8.2
|
0.2
|
80.3
|
0.97
|
0.69
|
0.92
|
531.15
|
540.12
|
527.68
|
764.11
|
3.83
|
|
0.80
|
2,000
|
17.7
|
3.6
|
21.3
|
74.3
|
8.4
|
0.2
|
82.9
|
0.96
|
0.68
|
0.92
|
537.82
|
541.71
|
529.11
|
767.82
|
3.89
|
|
0.85
|
2,125
|
18.1
|
3.9
|
22.0
|
79.9
|
8.8
|
0.2
|
88.9
|
0.96
|
0.68
|
0.91
|
551.08
|
544.03
|
531.24
|
773.45
|
4.03
|
|
0.90
|
2,250
|
18.5
|
4.1
|
22.6
|
85.0
|
9.2
|
0.2
|
94.4
|
0.95
|
0.68
|
0.90
|
561.64
|
545.24
|
531.97
|
776.50
|
4.18
|
|
0.95
|
2,375
|
18.7
|
4.3
|
23.0
|
88.4
|
9.3
|
0.3
|
98.0
|
0.95
|
0.68
|
0.90
|
568.26
|
545.77
|
532.35
|
777.83
|
4.27
|
|
1.00
|
2,500
|
18.9
|
4.5
|
23.4
|
93.0
|
9.6
|
0.3
|
102.9
|
0.94
|
0.68
|
0.89
|
576.34
|
545.92
|
532.34
|
778.22
|
4.40
|
|
1.10
|
2,750
|
20.7
|
6.6
|
27.3
|
144.2
|
11.9
|
0.3
|
156.4
|
0.93
|
0.68
|
0.87
|
655.66
|
540.04
|
525.56
|
774.14
|
5.72
|
|
1.20
|
3,000
|
20.9
|
7.3
|
28.1
|
156.8
|
12.4
|
0.3
|
169.5
|
0.93
|
0.69
|
0.87
|
672.11
|
537.75
|
522.03
|
767.97
|
6.02
|
|
1.30
|
3,250
|
21.3
|
7.6
|
28.9
|
169.6
|
12.8
|
0.3
|
182.8
|
0.92
|
0.69
|
0.86
|
687.30
|
534.94
|
517.54
|
759.03
|
6.32
|
|
1.40
|
3,500
|
21.4
|
7.9
|
29.3
|
175.8
|
13.0
|
0.3
|
189.1
|
0.92
|
0.69
|
0.86
|
693.80
|
533.06
|
514.89
|
753.08
|
6.46
|
|
1.50
|
3,750
|
21.6
|
8.2
|
29.8
|
187.4
|
13.3
|
0.3
|
201.0
|
0.92
|
0.69
|
0.86
|
704.37
|
529.05
|
510.26
|
740.35
|
6.74
|
2 “Mineralized Material” refers to potentially mineable material derived from pit optimization and does not constitute Mineral Reserves. At the current level of study. Mineral Reserves have not been defined.
BNA Mining Solutions - R. Des. Leão Starling, 200 - Ouro Preto, BH - MG, 31310-370 – Phone: +55 (31) 2514-8733 – E-mail: info@bnaconsultoria.com
|
GoldMining Inc.
NI 43-101 Report – São Jorge Project
|
Page 165 |
|
PIT OPTIMISATION RESULT - INDICATED AND INFERRED RESOURCES - NO SPATIAL CONSTRAINTS
|
| |
USD x oz
|
Tonnes X 106
|
g/t - Diluted
|
x103
|
USD x 106
|
Strip Ratio
|
|
RAF
|
Gold Price
|
Indicated Mineralized Material
|
Inferred Mineralized
Material
|
Total Mineralized
Material2
|
Waste
|
Low Grade Waste
|
Potential Mineralized
Material
|
Total Waste
|
Au Indicated Mineralized Material
|
Au Inferred Mineralized Material
|
Au Total
|
Ounces Produced
|
Cashflow Best Case
|
Cashflow CL4
|
Undiscounted Cashflow
|
|
1.60
|
4,000
|
21.7
|
8.3
|
30.0
|
190.5
|
13.5
|
0.3
|
204.3
|
0.92
|
0.69
|
0.86
|
707.13
|
527.80
|
508.93
|
736.39
|
6.81
|
|
1.70
|
4,250
|
22.0
|
8.6
|
30.6
|
203.6
|
13.8
|
0.3
|
217.7
|
0.91
|
0.70
|
0.85
|
717.82
|
522.40
|
502.96
|
719.16
|
7.12
|
|
1.80
|
4,500
|
22.0
|
8.9
|
30.9
|
209.9
|
14.1
|
0.3
|
224.3
|
0.91
|
0.69
|
0.85
|
722.92
|
519.54
|
499.74
|
709.35
|
7.25
|
|
1.90
|
4,750
|
22.2
|
9.0
|
31.2
|
215.3
|
14.3
|
0.4
|
229.9
|
0.91
|
0.69
|
0.85
|
726.94
|
516.96
|
497.01
|
700.52
|
7.37
|
|
2.00
|
5,000
|
22.3
|
9.1
|
31.4
|
218.6
|
14.3
|
0.4
|
233.3
|
0.91
|
0.69
|
0.84
|
729.23
|
515.32
|
495.28
|
694.90
|
7.44
|
|
3.00
|
7,500
|
22.6
|
11.1
|
33.6
|
286.1
|
15.7
|
0.4
|
302.3
|
0.90
|
0.66
|
0.82
|
762.05
|
477.26
|
456.53
|
564.60
|
8.99
|
|
4.00
|
10,000
|
22.7
|
11.4
|
34.1
|
302.7
|
16.0
|
0.5
|
319.2
|
0.90
|
0.66
|
0.82
|
767.93
|
467.58
|
446.25
|
528.90
|
9.36
|
|
5.00
|
12,500
|
22.7
|
11.6
|
34.3
|
314.5
|
16.1
|
0.6
|
331.2
|
0.90
|
0.65
|
0.82
|
771.00
|
460.99
|
438.80
|
502.53
|
9.65
|
|
6.00
|
15,000
|
23.0
|
12.1
|
35.1
|
354.7
|
16.9
|
0.6
|
372.3
|
0.89
|
0.65
|
0.81
|
779.28
|
437.18
|
412.44
|
407.39
|
10.62
|
|
7.00
|
17,500
|
23.0
|
12.4
|
35.4
|
375.4
|
17.2
|
0.7
|
393.3
|
0.89
|
0.64
|
0.80
|
782.82
|
424.79
|
399.17
|
357.89
|
11.12
|
|
8.00
|
20,000
|
23.0
|
12.5
|
35.5
|
382.1
|
17.3
|
0.7
|
400.1
|
0.89
|
0.64
|
0.80
|
783.80
|
420.83
|
395.01
|
342.05
|
11.28
|
|
9.00
|
22,500
|
23.0
|
12.6
|
35.6
|
393.9
|
17.4
|
0.7
|
412.0
|
0.89
|
0.64
|
0.80
|
785.30
|
413.76
|
387.72
|
313.81
|
11.58
|
|
10.00
|
25,000
|
23.0
|
12.6
|
35.7
|
402.2
|
17.7
|
0.7
|
420.6
|
0.89
|
0.64
|
0.80
|
786.24
|
408.63
|
382.50
|
293.32
|
11.80
|
BNA Mining Solutions - R. Des. Leão Starling, 200 - Ouro Preto, BH - MG, 31310-370 – Phone: +55 (31) 2514-8733 – E-mail: info@bnaconsultoria.com
|
GoldMining Inc.
NI 43-101 Report – São Jorge Project
|
Page 166 |
Figure 16.4 - Final Pit Optimization Results
Figure 16.5 - Optimized Pit Shell - RAF 0.75
The selection of the final pit based on RAF 0.75 was carried out through the analysis of optimization results, considering cash flow behaviour, average grade, strip ratio, and total material movement.
BNA Mining Solutions - R. Des. Leão Starling, 200 - Ouro Preto, BH - MG, 31310-370 – Phone: +55 (31) 2514-8733 – E-mail: info@bnaconsultoria.com
|
GoldMining Inc.
NI 43-101 Report – São Jorge Project
|
Page 167 |
The cash flow values presented at this stage correspond to pit optimization outputs and, therefore, do not represent the actual project economic cash flow. These values are calculated solely based on the simplified parameters presented in Table 16.3 (Optimization Parameters), including average unit mining, processing, G&A and refining costs, as well as fixed assumptions for gold price, metallurgical recovery, mining recovery, and dilution. As such, the reported cash flow is indicative and comparative in nature and is intended only for relative evaluation between different RAF scenarios.
It is observed that, up to approximately RAF 0.75, there is a consistent increase in project cash flow. Beyond this point, the incremental gains become progressively smaller, indicating a stabilization trend and limited additional economic benefit relative to further pit expansion. This behaviour is consistent across all scenarios evaluated.
In contrast, the strip ratio increases significantly beyond RAF 0.75, rising from approximately 3.83 to values above 4.40 at RAF 1.00, and increasing substantially to values exceeding 5.70 for RAF greater than 1.10. This trend indicates a disproportionate increase in waste movement for marginal economic gains.
Additionally, a gradual decrease in the average in situ mineralized material grade is observed with increasing RAF, declining from approximately 0.92 g/t at RAF 0.75 to values below 0.89 g/t at RAF values approaching 1.00, reflecting the inclusion of lower-grade material.
Accordingly, RAF 0.75 represents a balance between value maximization and operational risk control, avoiding excessive increases in strip ratio and grade dilution, while capturing the majority of the economic value of the deposit. Therefore, this factor was selected as the basis for defining the final pit for the Project.
16.5 Mining Method
Considering that the deposit outcrops at surface, open pit mining has been selected as the mining method.
16.6 Final Pit Design
The contours of the optimal pit shell were operationalized following standard industry practice, consisting of the layout of bench toes and crests, access ramps, and berms, allowing for the safe and efficient development of the planned mining operations.
The mining design parameters adopted for this process are presented in Table 16.5, and the resulting pit design is summarized in Table 16.6.
BNA Mining Solutions - R. Des. Leão Starling, 200 - Ouro Preto, BH - MG, 31310-370 – Phone: +55 (31) 2514-8733 – E-mail: info@bnaconsultoria.com
|
GoldMining Inc.
NI 43-101 Report – São Jorge Project
|
Page 168 |
Table 16.5 - Final Pit Design Parameters
|
Operational Parameters
|
|
Parameter
|
|
Value
|
|
Bench Height
|
meters
|
10.00
|
|
Minimum Berm Width
|
meters
|
6.00
|
|
Road Width
|
meters
|
12.00
|
|
Road Gradient
|
%
|
10.00
|
|
Overall Slope Angle - Saprolite
|
degrees
|
29.17
|
|
Overall Slope Angle - Fresh Rock
|
degrees
|
46.01
|
|
Bench Face Angle - Saprolite
|
degrees
|
40.00
|
|
Bench Face Angle - Fresh Rock
|
degrees
|
70.00
|
BNA Mining Solutions - R. Des. Leão Starling, 200 - Ouro Preto, BH - MG, 31310-370 – Phone: +55 (31) 2514-8733 – E-mail: info@bnaconsultoria.com
|
GoldMining Inc.
NI 43-101 Report – São Jorge Project
|
Page 169 |
Table 16.6 - Final Operational Pit Results
|
FINAL PIT RESULTS
|
| |
Tonnes X 106
|
g/t
|
x103
|
Strip Ratio
|
|
Pit
|
Indicated
Mineralized
Material
|
Inferred
Mineralized
Material
|
Total
Mineralized
Material 3
|
Waste
|
Low
Grade
Waste
|
Potential Mineralized Material
|
Total
Waste
|
Au Mineralized Material (Diluted)
|
Au Mineralized Material (Diluted)
|
Au Total
(Diluted)
|
Ounces
Produced
|
|
Mathematical RAF 0.75
|
17.5
|
3.5
|
21.0
|
71.9
|
8.2
|
0.2
|
80.3
|
0.97
|
0.69
|
0.92
|
557.71
|
3.83
|
|
Operational Pit
|
17.2
|
3.5
|
20.7
|
79.8
|
8.4
|
0.2
|
88.4
|
0.95
|
0.67
|
0.91
|
543.25
|
4.27
|
|
Difference
|
-1.50%
|
0.95%
|
-1.09%
|
10.96%
|
2.57%
|
4.24%
|
10.09%
|
-2.06%
|
-2.90%
|
-1.09%
|
-2.17%
|
11.31%
|
3 “Mineralized Material” refers to potentially mineable material derived from pit optimization and does not constitute Mineral Reserves. At the current level of study. Mineral Reserves have not been defined.
BNA Mining Solutions - R. Des. Leão Starling, 200 - Ouro Preto, BH - MG, 31310-370 – Phone: +55 (31) 2514-8733 – E-mail: info@bnaconsultoria.com
|
GoldMining Inc.
NI 43-101 Report – São Jorge Project
|
Page 170 |
Figure 16.6 presents the final pit design.
Figure 16.6 - Final Pit Design
The combined operational pit designs, after adjustment, contain approximately 20.7 million tonnes of Mineralized Material and 88.4 million tonnes of total waste, resulting in a strip ratio (“SR”) of 4.27. This corresponds to an estimated mine life of approximately 10 years, based on a production rate of 2 million tonnes of ROM per year.
16.7 Mine Preparation
Before production start-up, there will be a mine preparation or development stage. During this stage the mine will be prepared to ensure a continuity of mineralized material production that is both necessary and sufficient to feed the crusher. This step should precede the effective initiation of the crushing operation.
Mine preparation will begin with land clearance where necessary. The organic soil will then be removed and stored in a previously prepared place for future use in the recovery of degraded areas. Track tractors, hydraulic excavators, wheel loaders and trucks equipped with dump buckets may be used in this removal operation.
BNA Mining Solutions - R. Des. Leão Starling, 200 - Ouro Preto, BH - MG, 31310-370 – Phone: +55 (31) 2514-8733 – E-mail: info@bnaconsultoria.com
|
GoldMining Inc.
NI 43-101 Report – São Jorge Project
|
Page 171 |
Initially, the track tractor will scrape the layer of organic soil, forming hills at locations accessible to trucks. Then, a loader or a bulldozer will load the material into the trucks, which will haul it to the storage locations where it will be unloaded.
Once the organic soil is removed, the overburden will be stripped. This removal is planned in advance so that it results in a sufficient volume of exposed mineralized material to feed the crusher for a period of roughly 6 months.
The land clearance, organic soil removal and overburden stripping operations will be repeated throughout the mining operation as the pit is enlarged.
During the mine preparation phase, some mineralized material is usually produced and stored separately to be used later. This mineralized material will be stocked in an area close to the crusher and will serve as a buffer stock to supply the crusher in the event of any interruption in the supply of mineralized material directly from the mine.
The next step is to prepare the mining fronts by opening the benches to form an initial stock of mineralized material sufficient for the first few months of operation, as well as to ensure the continuity of the production required to feed the crusher.
16.8 Production Schedule
16.8.1 Annual Production Rate
For the mine sequencing, a production rate of 1.5 Mt was adopted for Year 1 and 2.0 Mt for the subsequent years.
The lower production rate in the first year reflects the typical operational ramp-up conditions of the Project. During this initial period, mining activities are in the development phase, including the establishment of access roads, development of initial mining faces, equipment commissioning, and stabilization of operational processes.
In addition, the reduced production rate in Year 1 accounts for the time required for fleet mobilization, workforce training, operational adjustments, and integration with the processing plant. This ramp up period is essential to ensure safe and efficient operating conditions prior to reaching nominal capacity.
From Year 2 onwards, with operations stabilized and mining faces fully developed, production increases to 2.0 Mt per year, corresponding to the nominal processing capacity of the Project.
16.8.2 Mine Sequencing
For the development of the mine sequencing, the final pit design was used as the basis. The mine sequencing study was carried out using the geological modelling and mine planning software Micromine 2025 and involved the definition of annual production schedules, the sequencing of mineralized material and waste blocks, and the progression of pit geometries over the life of mine (“LOM”).
BNA Mining Solutions - R. Des. Leão Starling, 200 - Ouro Preto, BH - MG, 31310-370 – Phone: +55 (31) 2514-8733 – E-mail: info@bnaconsultoria.com
|
GoldMining Inc.
NI 43-101 Report – São Jorge Project
|
Page 172 |
The objective of the mine sequencing was to maximize cash flow by prioritizing higher-grade mineralized material in the early years and managing the strip ratio over the life of mine. For the development of the mine production schedule, mining areas were defined for Years 1, 2, 3, 4, 5, 8, and final depletion. The sequencing strategy aimed to maximize the project NPV by prioritizing higher gold grades in the early years of operation.
The results of the mine sequencing are presented in Table 16.7 and Figure 16.7 to Figure 16.15.
BNA Mining Solutions - R. Des. Leão Starling, 200 - Ouro Preto, BH - MG, 31310-370 – Phone: +55 (31) 2514-8733 – E-mail: info@bnaconsultoria.com
|
GoldMining Inc.
NI 43-101 Report – São Jorge Project
|
Page 173 |
Table 16.7 - Mine Schedule Results
|
MINING PLANS RESULTS
|
| |
Tonnes X 106
|
g/t
|
x103
|
Strip Ratio
|
|
Period
|
Indicated Mineralized Material
|
Inferred Mineralized Material
|
Total
Mineralized
Material 4
|
Waste
|
Low
Grade
Waste
|
Potential Mineralized Material
|
Total
Waste
|
Au Indicated Mineralized Material (Diluted)
|
Au Inferred Mineralized Material (Diluted)
|
Au Total
(Diluted)
|
Ounces
Produced
|
|
Year 1
|
1.24
|
0.28
|
1.52
|
3.52
|
0.33
|
|
3.85
|
1.05
|
1.00
|
1.05
|
45.98
|
2.52
|
|
Year 2
|
1.81
|
0.19
|
2.00
|
5.47
|
0.99
|
0.00
|
6.45
|
1.04
|
0.76
|
1.01
|
58.49
|
3.23
|
|
Year 3
|
1.80
|
0.21
|
2.01
|
6.34
|
1.03
|
|
7.37
|
1.02
|
0.59
|
0.97
|
56.57
|
3.66
|
|
Year 4
|
1.86
|
0.15
|
2.01
|
6.55
|
0.97
|
0.02
|
7.55
|
1.00
|
0.58
|
0.97
|
56.51
|
3.75
|
|
Year 5
|
1.76
|
0.26
|
2.02
|
6.47
|
0.92
|
0.02
|
7.41
|
0.86
|
0.78
|
0.85
|
49.48
|
3.67
|
|
Year 6 to 8
|
4.25
|
1.77
|
6.02
|
29.36
|
2.07
|
0.12
|
31.55
|
0.91
|
0.66
|
0.83
|
145.34
|
5.24
|
|
Year 8 to 11 (Final Pit)
|
4.49
|
0.66
|
5.14
|
22.09
|
2.10
|
0.04
|
24.23
|
0.93
|
0.54
|
0.88
|
130.87
|
4.71
|
|
Total
|
17.22
|
3.51
|
20.72
|
79.80
|
8.41
|
0.20
|
88.41
|
0.95
|
0.67
|
0.91
|
543.25
|
4.27
|
4 “Mineralized material” refers to potentially mineable mineralized material derived from pit design and does not constitute Mineral Reserves. Mineral Reserves have not been defined.
BNA Mining Solutions - R. Des. Leão Starling, 200 - Ouro Preto, BH - MG, 31310-370 – Phone: +55 (31) 2514-8733 – E-mail: info@bnaconsultoria.com
|
GoldMining Inc.
NI 43-101 Report – São Jorge Project
|
Page 174 |
Figure 16.7 - Mined Material Schedule
Figure 16.8 - Process Schedule
BNA Mining Solutions - R. Des. Leão Starling, 200 - Ouro Preto, BH - MG, 31310-370 – Phone: +55 (31) 2514-8733 – E-mail: info@bnaconsultoria.com
|
GoldMining Inc.
NI 43-101 Report – São Jorge Project
|
Page 175 |
Figure 16.9 - Mine Sequencing Results – Year 1
Figure 16.10 - Mine Sequencing Results – Year 2
BNA Mining Solutions - R. Des. Leão Starling, 200 - Ouro Preto, BH - MG, 31310-370 – Phone: +55 (31) 2514-8733 – E-mail: info@bnaconsultoria.com
|
GoldMining Inc.
NI 43-101 Report – São Jorge Project
|
Page 176 |
Figure 16.11 - Mine Sequencing Results – Year 3
Figure 16.12 - Mine Sequencing Results – Year 4
BNA Mining Solutions - R. Des. Leão Starling, 200 - Ouro Preto, BH - MG, 31310-370 – Phone: +55 (31) 2514-8733 – E-mail: info@bnaconsultoria.com
|
GoldMining Inc.
NI 43-101 Report – São Jorge Project
|
Page 177 |
Figure 16.13 - Mine Sequencing Results – Year 5
Figure 16.14 - Mine Sequencing Results – Year 8
BNA Mining Solutions - R. Des. Leão Starling, 200 - Ouro Preto, BH - MG, 31310-370 – Phone: +55 (31) 2514-8733 – E-mail: info@bnaconsultoria.com
|
GoldMining Inc.
NI 43-101 Report – São Jorge Project
|
Page 178 |
Figure 16.15 - Mine Sequencing Results – Year 11 – Final Pit
BNA recommends that future studies evaluate alternative mining plan scenarios incorporating low-grade stockpiling strategies during the early years of operation as a potential opportunity to improve project cash flow. Preliminary grade-tonnage evaluations indicate that selective stockpiling may provide operational flexibility and support optimization of the processing schedule over the life of mine.
16.9 Waste Disposal
Mining operations will generate three main types of waste materials, all in solid form: organic soil, fresh rock waste, and low-grade mineralized material (considered as waste in this study). Organic soil will be stripped separately and stockpiled for future use in areas designated for reclamation.
Low-grade material is currently directed to the waste rock dump under the present mining scenario. The potential segregation of this material for dedicated stockpiling (low-grade stockpile) shall be evaluated in future studies, based on more detailed economic, metallurgical, and operational analyses.
The materials will be placed in previously selected and prepared locations in a controlled manner to ensure dump stability.
The waste dump design parameters are presented in Table 16.8. A swell factor of 25% and a compaction factor of 10% were applied in the waste dump design.
BNA Mining Solutions - R. Des. Leão Starling, 200 - Ouro Preto, BH - MG, 31310-370 – Phone: +55 (31) 2514-8733 – E-mail: info@bnaconsultoria.com
|
GoldMining Inc.
NI 43-101 Report – São Jorge Project
|
Page 179 |
Table 16.8 - Waste Rock Dump Design Parameters
|
Operational Parameters
|
|
Parameter
|
|
Value
|
|
Bench Height
|
meters
|
10.00
|
|
Minimum Berm Width
|
meters
|
4.00
|
|
Safety berm (every four benches)
|
meters
|
8.00
|
|
Road Width
|
meters
|
12.00
|
|
Road Gradient
|
%
|
10.00
|
|
Overall Slope Angle
|
degrees
|
29.17
|
|
Bench Face Angle
|
degrees
|
40.00
|
Information regarding the waste dump is summarized below:
| |
✔
|
Disturbed area ≈ 0.5 ha
|
The dump geometry was developed for the same periods as the mine sequencing. Quantities and corresponding layouts are presented in Table 16.9 and Figure 16.16 to Figure 16.22.
Table 16.9 - Waste Rock Volumes by Period
|
Year
|
Volume Mm3
|
|
Year 1
|
2.69
|
|
Year 2
|
3.73
|
|
Year 3
|
3.18
|
|
Year 4
|
5.04
|
|
Year 5
|
3.45
|
|
Year 8
|
13.99
|
|
Final Waste Dump
|
14.36
|
|
Total
|
46.44
|
BNA Mining Solutions - R. Des. Leão Starling, 200 - Ouro Preto, BH - MG, 31310-370 – Phone: +55 (31) 2514-8733 – E-mail: info@bnaconsultoria.com
|
GoldMining Inc.
NI 43-101 Report – São Jorge Project
|
Page 180 |
Figure 16.16 – Waste Rock Dump – Year 1
Figure 16.17 – Waste Rock Dump – Year 2
BNA Mining Solutions - R. Des. Leão Starling, 200 - Ouro Preto, BH - MG, 31310-370 – Phone: +55 (31) 2514-8733 – E-mail: info@bnaconsultoria.com
|
GoldMining Inc.
NI 43-101 Report – São Jorge Project
|
Page 181 |
Figure 16.18 – Waste Rock Dump – Year 3
Figure 16.19 – Waste Rock Dump – Year 4
BNA Mining Solutions - R. Des. Leão Starling, 200 - Ouro Preto, BH - MG, 31310-370 – Phone: +55 (31) 2514-8733 – E-mail: info@bnaconsultoria.com
|
GoldMining Inc.
NI 43-101 Report – São Jorge Project
|
Page 182 |
Figure 16.20 – Waste Rock Dump – Year 5
Figure 16.21 – Waste Rock Dump – Year 8
BNA Mining Solutions - R. Des. Leão Starling, 200 - Ouro Preto, BH - MG, 31310-370 – Phone: +55 (31) 2514-8733 – E-mail: info@bnaconsultoria.com
|
GoldMining Inc.
NI 43-101 Report – São Jorge Project
|
Page 183 |
Figure 16.22 – Final Waste Rock Dump
16.10 Geotechnical Considerations
The geotechnical analysis presented herein is conceptual in nature and reflects the level of confidence appropriate for a PEA study.
16.10.1 Materials and Lithotypes (Pit)
In this study, the geological model adopted was the one previously developed by GoldMining, and the main geomechanical classes were derived from the pre-defined classification of soils, saprolite, and fresh rock. This correlation was considered appropriate due to the limited variability of the rock mass classification within the intact granitic units, combined with the existing distinction between surficial soils, mature residual soils, and saprolite in the available classifications.
Based on this premise, representative cross-sections were extracted to validate the geometry of the proposed pit through slope stability analyses using the limit equilibrium method. Accordingly, Figure 16.23 illustrates the location of the section axes, while Figure 16.24 to Figure 16.26 present the proposed geological–geotechnical model.
BNA Mining Solutions - R. Des. Leão Starling, 200 - Ouro Preto, BH - MG, 31310-370 – Phone: +55 (31) 2514-8733 – E-mail: info@bnaconsultoria.com
|
GoldMining Inc.
NI 43-101 Report – São Jorge Project
|
Page 184 |
Figure 16.23 - Section Axes Relative to the São Jorge Pit
Figure 16.24 – Geological–Geotechnical Cross-Section A–A′
BNA Mining Solutions - R. Des. Leão Starling, 200 - Ouro Preto, BH - MG, 31310-370 – Phone: +55 (31) 2514-8733 – E-mail: info@bnaconsultoria.com
|
GoldMining Inc.
NI 43-101 Report – São Jorge Project
|
Page 185 |
Figure 16.25 – Geological–Geotechnical Cross-Section B–B′
Figure 16.26 - Geological–Geotechnical Cross-Section C–C′
BNA Mining Solutions - R. Des. Leão Starling, 200 - Ouro Preto, BH - MG, 31310-370 – Phone: +55 (31) 2514-8733 – E-mail: info@bnaconsultoria.com
|
GoldMining Inc.
NI 43-101 Report – São Jorge Project
|
Page 186 |
Given the predefined geomechanical classes, core logging observations indicate that the intact rock does not exhibit significant variability in rock mass classification. At the current level of study, it is therefore considered appropriate to adopt a single representative class, based on the most adverse conditions identified, in order to maintain a conservative design approach, recognizing that improved rock mass conditions are present in several areas.
It is also noted that, even under these conservative assumptions, the rock mass quality remains favourable, with a baseline GSI in the range of 70 to 75 for the more fractured portions of the São Jorge deposit, as shown in Figure 16.27.
Figure 16.27 - Baseline GSI range, highlighted in red, for the rock mass of the São Jorge deposit. The arrow indicates the trend of improving rock mass quality toward less fractured zones
Accordingly, the following parameters derived from the Hoek–Brown methodology were adopted, as presented in Table 16.10.
Table 16.10 - Parameterization of the intact granitic rock mass of the São Jorge deposit
|
Lithotype
|
Unit Weight (kN/m³)
|
GSI
|
RC
|
mi
|
D
|
mb
|
UCS (MPA)
|
|
Granitic Rock
|
27
|
70
|
3.5
|
30
|
1
|
3.5
|
150
|
BNA Mining Solutions - R. Des. Leão Starling, 200 - Ouro Preto, BH - MG, 31310-370 – Phone: +55 (31) 2514-8733 – E-mail: info@bnaconsultoria.com
|
GoldMining Inc.
NI 43-101 Report – São Jorge Project
|
Page 187 |
| |
1.
|
The unit weight (“γ”) was adopted based on typical values from geotechnical and mineralogical literature for similar rock types (e.g., Hoek & Marinos, 2000; Rocscience; standard ISRM tables). Lower values were considered representative of non-mineralized rocks, as the final pit is predominantly developed within non-mineralized or low-grade rock domains.
|
| |
2.
|
The Geological Strength Index (“GSI”) was defined based on core logging observations and a conservative characterization of the rock mass, particularly for more fractured and blocky zones.
|
| |
3.
|
The intact uniaxial compressive strength (“σci” or “RC”) was conservatively fixed at 3.5 (dimensionless index), representing a typical value for weak to moderately weathered rock in early-stage studies, conservatively fixed at 3.5 MPa for preliminary modelling purposes et all. This value was calibrated to align with the average UCS rating within the RMR system (Bieniawski, 1989), where UCS ratings for the lithotypes typically range between 2 and 7 points (corresponding to UCS values of approximately 5–100 MPa). A conservative value of 3.5 was adopted to avoid overestimation in weak rock zones and to ensure appropriate safety margins in slope stability analyses.
|
| |
4.
|
The parameter mi (Hoek–Brown constant representing intact rock strength) was selected from published reference tables (Hoek and Marinos, 2000, 2018 edition and subsequent updates), considering the corresponding lithological group of granitic rocks, for which mi typically ranges from 25 to 35.
|
| |
5.
|
The disturbance factor (“D”) in the Hoek–Brown criterion was conservatively set to 1.0, reflecting moderate to high disturbance associated with blasting and mechanical excavation. This assumption accounts for potential damage to the rock mass surrounding the pit due to fracture propagation and stress relief.
|
| |
6.
|
The Hoek–Brown constants s and a were maintained as standard for the generalized criterion (s = 1 and a = 0.5 for intact rock when GSI = 100) and subsequently adjusted automatically based on the adopted GSI for each lithotype.
|
| |
7.
|
Although the granitic lithologies at São Jorge are generally competent, conservative strength assumptions representative of the more fractured and disturbed portions of the rock mass were intentionally adopted for preliminary slope stability modelling. This approach aimed to evaluate pit performance under lower-bound geotechnical conditions, ensuring that acceptable stability conditions could still be achieved even within the least favorable rock mass domains identified at this stage of the Project.
|
| |
8.
|
Accordingly, reduced equivalent strength parameters were applied during the conceptual-level analyses, recognizing that future project phases (PFS and FS) are expected to refine the geomechanical domains and potentially optimize slope geometries based on additional geotechnical investigation data.
|
| |
9.
|
The analysis intentionally focused on lower-bound geotechnical conditions representative of the most fractured sectors of the deposit. Fresh monzogranitic and syenogranitic lithologies would typically present intact UCS values within significantly higher ranges, commonly between approximately 80 MPa and 200 MPa according to published references for felsic intrusive rocks (ISRM, Hoek & Brown, Rocscience compilations, and related literature).
|
It is important to note that granitic rocks were not subdivided into separate geomechanical units, as monzogranite and syenogranite are expected to exhibit similar mechanical behaviour. The primary difference between these lithologies lies in the proportion of potassium feldspar and plagioclase. Syenogranite is enriched in alkali feldspar, whereas monzogranite contains a more balanced composition with higher plagioclase content. These differences are considered mineralogical nuances that do not significantly affect the overall mechanical behaviour of the granitic rock mass.
BNA Mining Solutions - R. Des. Leão Starling, 200 - Ouro Preto, BH - MG, 31310-370 – Phone: +55 (31) 2514-8733 – E-mail: info@bnaconsultoria.com
|
GoldMining Inc.
NI 43-101 Report – São Jorge Project
|
Page 188 |
For the weathering horizons of granitic rocks, including saprolite and mature residual soils, geotechnical parameters were defined based on published literature and comparable case studies, including similar materials characterized in adjacent projects. In particular, reference was made to the NI 43-101 Feasibility Study for the Tocantinzinho Project (2021, G Mining Ventures), a gold deposit hosted in granitic rocks within the Tapajós Province (Pará), considered analogous to the São Jorge Project.
Accordingly, the Mohr–Coulomb parameters adopted for the analysis are presented in Table 16.11.
Table 16.11 - Geotechnical Parameterization of the São Jorge Granitic Rock Mass
|
Lithotype
|
Unit Weight (kN/m³)
|
Cohesion (kPa)
|
Friction Angle (°)
|
|
Soil
|
15
|
17
|
21
|
|
Saprolite
|
18
|
18
|
25
|
16.10.2 Final Pit Geometry
To provide information on the slope geometries to be excavated for each lithotype within the pit, and to ensure minimum safety conditions for the final pit configuration, slope stability analyses were conducted considering the specific characteristics of each lithotype/material in order to validate the proposed geometries.
The proposed design includes 10 m high benches with 6 m berm widths. For benches developed in soil and saprolite materials, a face angle of 40° was adopted, increasing to approximately 70° in competent rock.
Based on the proposed geometry and the geological–geotechnical cross-sections, two-dimensional limit equilibrium slope stability analyses were performed using Rocscience Slide2, a commercial slope stability software package developed by Rocscience Inc. The analyses considered local and global failure mechanisms and were conducted using the Bishop and GLE/Morgenstern–Price methods, with the most critical calculated factor of safety reported for each section. The results of these analyses are summarized in Table 16.12 and presented in Figure 16.28 to Figure 16.30.
BNA Mining Solutions - R. Des. Leão Starling, 200 - Ouro Preto, BH - MG, 31310-370 – Phone: +55 (31) 2514-8733 – E-mail: info@bnaconsultoria.com
|
GoldMining Inc.
NI 43-101 Report – São Jorge Project
|
Page 189 |
Table 16.12 - Stability Analysis Results
|
Section
|
Analysis
|
Calculated FS
|
Minimum FS
|
Condition
|
Figure
|
|
Section A
|
Local
|
1.4
|
1.3
|
Acceptable
|
Figure 16.28
|
|
Global
|
1.3
|
1.3
|
Acceptable
|
|
Section B
|
Local
|
1.3
|
1.3
|
Acceptable
|
Figure 16.29
|
|
Global
|
1.5
|
1.3
|
Acceptable
|
|
Section C
|
Local (North)
|
1.3
|
1.3
|
Acceptable
|
Figure 16.30
|
|
Global (North)
|
1.4
|
1.3
|
Acceptable
|
|
Local (South)
|
1.3
|
1.3
|
Acceptable
|
|
Global (South)
|
1.4
|
1.3
|
Acceptable
|
Notes :
| |
1.
|
Strength parameters assigned to the different lithotypes are consistent with those defined in the geological model and parameterization section;
|
| |
2.
|
Stability analyses were conducted using both the Bishop method and the GLE/Morgenstern–Price method, with only the most critical (lowest Factor of Safety) results reported;
|
| |
3.
|
Non-circular failure surfaces were evaluated, without automated optimization of the critical failure surface geometry;
|
| |
4.
|
Both local (bench-scale) and global slope failures were assessed;
|
| |
5.
|
Slope faces were assumed to be drained, considering the effectiveness of the planned pit dewatering system;
|
| |
6.
|
A minimum factor of safety of 1.3 was adopted, consistent with standard geotechnical engineering practice and industry guidelines.
|
BNA Mining Solutions - R. Des. Leão Starling, 200 - Ouro Preto, BH - MG, 31310-370 – Phone: +55 (31) 2514-8733 – E-mail: info@bnaconsultoria.com
|
GoldMining Inc.
NI 43-101 Report – São Jorge Project
|
Page 190 |
Figure 16.28 - Stability Analysis Results – Section A
Figure 16.29 - Stability Analysis Results – Section B
BNA Mining Solutions - R. Des. Leão Starling, 200 - Ouro Preto, BH - MG, 31310-370 – Phone: +55 (31) 2514-8733 – E-mail: info@bnaconsultoria.com
|
GoldMining Inc.
NI 43-101 Report – São Jorge Project
|
Page 191 |
Figure 16.30 - Stability Analysis Results – Section C
Based on the results of the stability analyses, all evaluated sections exhibit factors of safety exceeding the minimum recommended values for both local and global conditions, even when conservative strength parameters are applied.
16.10.3 Definition of Geotechnical Domains
The final pit was subdivided into geotechnical domains based on slope configurations with well-defined orientations and angles, as presented in Figure 16.31 and Table 16.13. This segmentation resulted in five distinct sectors.
BNA Mining Solutions - R. Des. Leão Starling, 200 - Ouro Preto, BH - MG, 31310-370 – Phone: +55 (31) 2514-8733 – E-mail: info@bnaconsultoria.com
|
GoldMining Inc.
NI 43-101 Report – São Jorge Project
|
Page 192 |
Figure 16.31 - Pit sectorization based on slope geometry. The magenta lines represent the average slope orientation, while the cyan lines indicate the primary sector boundaries.
Table 16.13 - Geometric Sector Definition
|
Geometric Sector
|
5Dip¹ / Dip²
|
Dip Direction
|
|
Sector 01
|
42 / 70
|
177
|
|
Sector 02
|
42 / 70
|
220
|
|
Sector 03
|
40 / 70
|
20
|
|
Sector 04
|
31/ 70
|
248
|
|
Sector 05
|
36 / 70
|
66
|
Subsequently, each predefined geometric sector was evaluated for potential kinematic failure mechanisms, including planar sliding, wedge failure, and toppling, all considered within a structurally controlled rock mass context.
16.10.4 Criteria and Assumptions
The following assumptions were considered for the kinematic analysis carried out in this study:
| |
I.
|
Granitic rocks (monzogranite and syenogranite) were grouped due to their similar geotechnical and geomechanical behaviour.
|
| |
II.
|
For this group of granitic lithotypes, a friction angle of 36° was adopted, based on material behaviour, GSI, strength characteristics, and overall rock mass conditions.
|
| |
III.
|
These values are considered representative of the more weathered and structurally controlled domains of the rock mass, including areas with higher fracture density, lower RQD, and joint infilling. It is recognized that more competent portions of the rock mass may exhibit higher friction angles; however, adopting such values could mask weaker zones and underestimate the potential for kinematic instability. A conservative approach was therefore applied.
|
5 Dip¹ / Dip²: Dip¹ corresponds to the overall slope angle, while Dip² refers to the bench face angle.
BNA Mining Solutions - R. Des. Leão Starling, 200 - Ouro Preto, BH - MG, 31310-370 – Phone: +55 (31) 2514-8733 – E-mail: info@bnaconsultoria.com
|
GoldMining Inc.
NI 43-101 Report – São Jorge Project
|
Page 193 |
| |
IV.
|
Kinematic analyses were performed following the Markland method (“A Useful Technique for Estimating the Stability of Rock Slopes when the Rigid Wedge Slide Type of Failure is Expected,” 1972).
|
| |
V.
|
Structural measurements used to define discontinuities were obtained from the GoldMining database, compiled from multiple drilling campaigns. Discontinuities were grouped into structural sets and characterized using modal orientations for each set.
|
| |
VI.
|
The final pit was subdivided into five geometric sectors based on the orientation of the main slope faces.
|
| |
VII.
|
Kinematic failure analyses (planar, wedge, and toppling) focused primarily on bench-scale failures, given the uncertainty associated with the persistence and continuity of discontinuities at larger scales. This approach is consistent with the expected behaviour of the rock mass, where smaller-scale failures are more likely than large-scale failures.
|
| |
VIII.
|
Kinematic analyses were conducted using Swedge and RocPlane, commercial geotechnical software packages developed by Rocscience Inc., to evaluate the potential for wedge and planar failure mechanisms, respectively.
|
Based on item (iv) above, the initial predisposition of each sector to kinematic failure mechanisms is presented in Table 16.14.
Table 16.14 - Results of Probabilistic Kinematic Assessment (blue: no potential; red: potential for failure)
|
Geometric Sector
|
Global
|
Local
|
|
Planar
|
Wedge
|
Toppling
|
Planar
|
Wedge
|
Toppling
|
|
Sector 01
|
|
|
|
|
|
|
|
Sector 02
|
|
|
|
|
|
|
|
Sector 03
|
|
|
|
|
|
|
|
Sector 04
|
|
|
|
|
|
|
|
Sector 05
|
|
|
|
|
|
|
It is emphasized that the presence of kinematic predisposition alone does not necessarily indicate failure. It must be evaluated in conjunction with the corresponding factors of safety for each mechanism. Based on this initial probabilistic assessment, the pit is considered stable with respect to global failure mechanisms, while exhibiting susceptibility to localized, bench-scale instabilities. This behaviour is typical and expected for open pit mining operations, where minor instabilities at the bench scale are commonly observed.
In addition to this qualitative assessment, a quantitative evaluation of unstable planes was carried out using the full dataset of structural measurements. The comparison between qualitative and quantitative assessments allows correlation between the percentage of unstable planes and their respective typologies, orientations, and domains, supporting the identification of areas requiring more detailed analysis.
BNA Mining Solutions - R. Des. Leão Starling, 200 - Ouro Preto, BH - MG, 31310-370 – Phone: +55 (31) 2514-8733 – E-mail: info@bnaconsultoria.com
|
GoldMining Inc.
NI 43-101 Report – São Jorge Project
|
Page 194 |
The results of the quantitative assessment are summarized in Table 16.15.
Table 16.15 - Results of Probabilistic Kinematic Assessment (blue: no potential; red: potential for failure)
|
Geometric Sector
|
Global
|
Local
|
|
Planar
|
Wedge
|
Toppling
|
Planar
|
Wedge
|
Toppling
|
|
Sector 01
|
|
|
|
|
|
|
|
Sector 02
|
|
|
|
|
|
|
|
Sector 03
|
|
|
|
|
|
|
|
Sector 04
|
|
|
|
|
|
|
|
Sector 05
|
|
|
|
|
|
|
Following this assessment, it is concluded that small-scale instability events are limited to potential wedge failures that may develop in Sector 05. These can be effectively mitigated at the operational level through minor adjustments to slope orientation, aimed at promoting a confining effect and eliminating the triggering conditions for wedge formation.
Accordingly, the São Jorge pit is expected to experience localized bench-scale instabilities typical of open pit mining operations, which are not anticipated to materially affect mineability or overall project viability.
16.10.5 Pit Instrumentation and Monitoring Plan
Considering the geological, hydrogeological, and operational conditions of the São Jorge pit, industry best practices recommend the implementation of a geotechnical monitoring system to track slope performance and surrounding ground behaviour during and after mining operations.
In this context, an initial instrumentation plan is proposed, including the installation of standpipe piezometers (“MNA”) and Casagrande piezometers (“PZ”). The layout of these instruments is presented in Figure 16.32, while Table 16.16 summarizes the planned quantities. The plan also includes the future installation of inclinometers (“INC”) and surface monitoring points (“MT”).
BNA Mining Solutions - R. Des. Leão Starling, 200 - Ouro Preto, BH - MG, 31310-370 – Phone: +55 (31) 2514-8733 – E-mail: info@bnaconsultoria.com
|
GoldMining Inc.
NI 43-101 Report – São Jorge Project
|
Page 195 |
Figure 16.32 - Proposed Instrumentation Plan for the São Jorge Pit
Table 16.16 - Installation Specifications for Proposed Pit Instrumentation
|
Instrument
|
Quantity
|
Unit
|
|
Survey Monuments
|
30
|
units
|
|
Standpipe Piezometers (Water Level Indicators)
|
800
|
m
|
|
Piezometers
|
800
|
m
|
|
Inclinometers
|
500
|
m
|
These instruments will enable the identification of anomalies that may compromise the stability of the pit slopes.
16.10.6 Waste Rock Dump Studies
The waste rock dump for the São Jorge Project, located in Novo Progresso, Pará State, will be constructed using waste material derived from mining operations, with no tailings disposal planned. The structure is a dry stack waste rock dump, constructed in staged upstream advancing lifts with mechanical compaction, and conservatively designed to ensure long-term stability, including consideration of natural leaching processes over time.
The dump geometry was defined based on conservative design criteria, adopting reduced overall slope angles to maximize the factor of safety. The facility will be developed on a prepared foundation area, including the removal of approximately 1.0 m of organic topsoil and weathered material to ensure adequate foundation conditions.
In accordance with alignment with the project technical team, the main geometric design parameters for the waste rock dump are as follows:
BNA Mining Solutions - R. Des. Leão Starling, 200 - Ouro Preto, BH - MG, 31310-370 – Phone: +55 (31) 2514-8733 – E-mail: info@bnaconsultoria.com
|
GoldMining Inc.
NI 43-101 Report – São Jorge Project
|
Page 196 |
| |
●
|
Safety berm: 8 m every four benches
|
| |
●
|
Main access width: 12 m
|
| |
●
|
Overall slope angle: 26°
|
The adopted configuration results in stable slopes and facilitates maintenance activities, with berms designed to allow safe access for inspection, monitoring, and potential interventions during operations and closure.
|
16.10.6.1
|
Foundation Preparation
|
Prior to waste dump construction, approximately 1.0 m of surface material (organic topsoil and weathered material) will be stripped across the entire footprint of the facility. This material will be stockpiled separately for future use in reclamation activities.
Following excavation, the foundation will be graded to ensure uniform contact with the first waste lift.
|
16.10.6.2
|
Foundation Geotechnical Investigation
|
For the geotechnical characterization of the foundation, a total of 20 combined geotechnical boreholes, consisting of standard penetration testing in soil and weathered materials followed by rotary core drilling in rock, will be completed across the waste rock dump footprint. The boreholes will be distributed to adequately characterize subsurface conditions and will have a minimum depth of 15 m.
|
16.10.6.3
|
Geotechnical Testing of the Foundation
|
The following laboratory and field tests will be conducted on collected samples and cores:
| |
●
|
Grain size distribution and Atterberg limits
|
| |
●
|
Proctor compaction tests (Standard and Modified)
|
| |
●
|
Triaxial tests (CD and UU)
|
| |
●
|
Unconfined compressive strength tests (where applicable)
|
| |
●
|
Determination of natural and saturated unit weight
|
These tests are intended to refine and calibrate the geotechnical parameters of the foundation materials.
|
16.10.6.4
|
Stability Assessment
|
At this stage of the Project, slope stability analyses were conducted on two representative cross-sections of the waste rock dump (Section 1 and Section 2), as shown in Figure 16.33 and Figure 16.34
BNA Mining Solutions - R. Des. Leão Starling, 200 - Ouro Preto, BH - MG, 31310-370 – Phone: +55 (31) 2514-8733 – E-mail: info@bnaconsultoria.com
|
GoldMining Inc.
NI 43-101 Report – São Jorge Project
|
Page 197 |
Figure 16.34, using the Mohr–Coulomb failure criterion and the geotechnical parameters defined in Table 16.17 (shear strength parameters for the waste material and foundation parameters consistent with those applied for the pit design).
For each section, a downstream rockfill buttress condition using waste rock was also simulated. This configuration is considered to represent the most stable condition for both the final geometry and closure of the structure.
Figure 16.33 - Location of Cross-sections A and B on the Waste Rock Dump.
BNA Mining Solutions - R. Des. Leão Starling, 200 - Ouro Preto, BH - MG, 31310-370 – Phone: +55 (31) 2514-8733 – E-mail: info@bnaconsultoria.com
|
GoldMining Inc.
NI 43-101 Report – São Jorge Project
|
Page 198 |
Figure 16.34 - Proposed conceptual geological–geotechnical model incorporating a downstream rockfill buttress
Table 16.17 - Geotechnical Parameters for São Jorge Waste Rock Dump Materials
|
Material
|
Cohesion
(c')
|
Peak Friction Angle
(φ′ peak)
|
Critical State Friction
Angle (φ′₍cs₎)
|
Unit Weight (γ)
|
|
Waste Rock (rockfill)
|
5KPa
|
40°
|
36°
|
22 kN/m³
|
|
Waste Rock (dump)
|
9 KPa
|
36°
|
32°
|
20 kN/m³
|
|
Clay Layer
|
22 KPa
|
24°
|
18°
|
19 kN/m³
|
The stability analyses considered the following conditions:
| |
●
|
Operational static condition (φ′ peak);
|
| |
●
|
Long-term / post-closure static condition (φ′₍cs₎ – critical state friction angle);
|
| |
●
|
Pseudo-static condition (using φ′₍cs₎ and seismic coefficients kh = 0.05 g and kv = 0.03 g, based on Eletrobras criteria);
|
All calculated factors of safety exceed the minimum values required by NBR 13029:2024 (FS ≥ 1.5 for long-term drained conditions and FS ≥ 1.1 for pseudo-static conditions), confirming both global and local stability of the waste rock dump throughout all phases of the Project, as presented in Table 16.18.
BNA Mining Solutions - R. Des. Leão Starling, 200 - Ouro Preto, BH - MG, 31310-370 – Phone: +55 (31) 2514-8733 – E-mail: info@bnaconsultoria.com
|
GoldMining Inc.
NI 43-101 Report – São Jorge Project
|
Page 199 |
Table 16.18 - Stability Analysis Results for the São Jorge Waste Rock Dump
|
Section A
|
Section B
|
|
Geometry
|
Scenario
|
FS (Peak)
|
FS (Critical State)
|
Geometry
|
Scenario
|
FS (Peak)
|
FS (Critical State)
|
|
With
Rockfill
Buttress
|
Static
|
1.6
|
1.5
|
With Rockfill
Buttress
|
Static
|
1.7
|
1.6
|
|
Pseudo-static (Upstream)
|
-
|
1.3
|
Pseudo-static (Upstream)
|
-
|
1.4
|
|
Pseudo-static (Downstream)
|
-
|
1.3
|
Pseudo-static (Downstream)
|
-
|
1.4
|
|
Without
Rockfill
Buttress
|
Static
|
1.6
|
1.5
|
Without
Rockfill
Buttress
|
Static
|
1.7
|
1.6
|
|
Pseudo-static (Upstream)
|
-
|
1.3
|
Pseudo-static (Upstream)
|
-
|
1.4
|
|
Pseudo-static (Downstream)
|
-
|
1.3
|
Pseudo-static (Downstream)
|
-
|
1.4
|
BNA Mining Solutions - R. Des. Leão Starling, 200 - Ouro Preto, BH - MG, 31310-370 – Phone: +55 (31) 2514-8733 – E-mail: info@bnaconsultoria.com
|
GoldMining Inc.
NI 43-101 Report – São Jorge Project
|
Page 200 |
|
16.10.6.5
|
Basic Instrumentation
|
To monitor the behaviour of the waste rock dump during operations and post-closure, a basic instrumentation system will be installed, consisting of six instrumented sections strategically distributed across the facility (three sections on the northern downstream face and three sections on the southern downstream face). Each instrumented section will include:
Four piezometers (two vibrating wire and two Casagrande type) installed at different depths to monitor pore pressure and groundwater levels.
A total of 24 piezometers is planned (6 sections × 4 piezometers), as shown in Figure 16.35.
Figure 16.35 - Instrumentation Plan for the São Jorge Waste Rock Dump
Piezometers will be installed during waste rock dump construction, with monitoring frequencies ranging from daily to weekly during operations and from biweekly to monthly during the post-closure period.
BNA Mining Solutions - R. Des. Leão Starling, 200 - Ouro Preto, BH - MG, 31310-370 – Phone: +55 (31) 2514-8733 – E-mail: info@bnaconsultoria.com
|
GoldMining Inc.
NI 43-101 Report – São Jorge Project
|
Page 201 |
16.10.7 Conclusions
This study presents a preliminary integrated geotechnical assessment at a conceptual level for the main structures of the São Jorge Project — including the open pit and waste rock dump — based on available data, limited field validation, and conservative assumptions consistent with the current stage of project development.
Overall, the results indicate that the proposed geometries for the assessed structures exhibit satisfactory stability conditions, with factors of safety consistent with minimum values typically adopted in geotechnical engineering practice and in accordance with applicable standards and guidelines.
For the pit, stability analyses demonstrate that, even under conservative parameter assumptions (including rock mass penalization and the adoption of GSI values representative of the most adverse conditions), all evaluated sections exhibit factors of safety equal to or greater than the minimum value of 1.3 for static conditions. Kinematic assessments indicate low susceptibility to global instability, with localized bench-scale mechanisms identified in specific sectors, particularly associated with wedge formation. These instabilities are considered typical of open pit mining operations and can be mitigated through minor operational adjustments, without materially impacting project viability.
The waste rock dump, designed as a dry stack structure with conservative geometry and appropriate construction control, demonstrated satisfactory geotechnical performance under all evaluated conditions (short- and long-term, including pseudo-static scenarios). The calculated factors of safety meet or exceed criteria typically adopted in Brazilian (NBR 13029) and industry practice for conceptual-level mining studies, indicating adequate global and local stability during both operation and closure. The proposed configuration, combined with proper foundation preparation and planned instrumentation, supports the robustness of the design at this stage.
It is important to note that, as a PEA level study, there are inherent limitations associated with the level of detail available, including:
| |
●
|
Partial reliance on secondary data and pre-existing geological models;
|
| |
●
|
Lack of extensive laboratory testing programs for all materials;
|
| |
●
|
Limited understanding of local hydrogeological conditions;
|
| |
●
|
Simplifications in stability analyses consistent with the conceptual level of the study.
|
| |
●
|
Accordingly, the following steps are recommended to advance the Project:
|
| |
●
|
Execution of additional geotechnical investigation programs (drilling, laboratory testing, and detailed material characterization);
|
| |
●
|
Refinement of geomechanical parameters based on site-specific data;
|
| |
●
|
Development of a representative hydrogeological model;
|
| |
●
|
Advancement to detailed engineering design of the structures;
|
| |
●
|
Implementation and operation of a comprehensive geotechnical instrumentation and monitoring system;
|
| |
●
|
Ongoing updating of stability models based on field performance data.
|
BNA Mining Solutions - R. Des. Leão Starling, 200 - Ouro Preto, BH - MG, 31310-370 – Phone: +55 (31) 2514-8733 – E-mail: info@bnaconsultoria.com
|
GoldMining Inc.
NI 43-101 Report – São Jorge Project
|
Page 202 |
In summary, this study demonstrates that the São Jorge Project, from a geotechnical perspective, presents favourable conditions for advancement at the conceptual level, with technically viable solutions, manageable risks, and alignment with industry best practices. Continued project development should be supported by progressive refinement of geotechnical understanding and active risk management through subsequent study phases (PFS and FS), ensuring the safety and reliability of the proposed structures.
16.11 Mine Drainage
Draining operations will be carried out throughout the life of mine, for open pit mining operations.
Once mining operations begin to produce pits, rainwater will be carried through ditches to collection boxes, installed at strategic locations, from where it will be continuously pumped. The water will also be dispersed by percolation and evaporation. Solids carried to the pit by rainwater will be removed during the dry season.
With regard to groundwater, hydrogeological surveys will be carried out and the best alternatives, either lowering the water table or directing the groundwater to collection boxes via ditches from where it is pumped out, will be studied.
16.11.1 Pit Drainage
Due to operational or blending needs and the deepening of the orebody, some sites will be mined to lower levels in the pit. As a result, the water that accumulates inside those pits must be drained.
In such cases, the water to be drained from the pits can originate from two main sources:
The first step in reducing the volume of rainwater is to ensure that runoff from rainfall outside the boundaries of the pits does not enter the pits. Therefore, drainage ditches and/or protection lines will be opened and these will divert these waters to the natural drainage system.
The rainwater within the boundaries of the pits will be led through ditches to strategically located sumps from where they will be pumped out of the pits and into the natural drainage system. Particulate retention dikes will be installed in these drains. Berms will be topographically controlled in a manner that creates a slight slope, on the order of 1% to 3%, towards the crests in order to avoid the formation of puddles on the surface of the benches.
If groundwater reaches the pits, it will also be led through ditches to the same sumps to be pumped out. Once there is a better understanding of the behavior of the groundwater, a study of the available solutions, including water table drawdown through wells, will be conducted.
BNA Mining Solutions - R. Des. Leão Starling, 200 - Ouro Preto, BH - MG, 31310-370 – Phone: +55 (31) 2514-8733 – E-mail: info@bnaconsultoria.com
|
GoldMining Inc.
NI 43-101 Report – São Jorge Project
|
Page 203 |
16.11.2 Waste Pile Drainage
Before the beginning of waste disposal in the selected area, geotechnical and hydrogeological studies will be carried out to evaluate the need to construct drains at the base of the pile. If necessary, ditches with dimensions defined by geotechnical and hydrogeological studies will be opened. The ditches will then be filled with rocky material of different particle sizes, in descending scale from bottom to top, with the last layer consisting of pebbles up to 20 mm in diameter. Finally, a geotextile blanket will be placed over this material. This fabric should cover a safety strip on the edges, beyond the width of the ditches. The first layer of waste must be placed carefully to avoid shifting the blanket.
Upstream of the waste pile, ditches and/or protection lines will be constructed to divert runoff. In the lower parts of the pile, along the toes of the lower benches, ditches associated with protection lines will be built (the material dug to form the ditches will be arranged by their sides) to protect against possible landslides.
The berms will have a trim, in the transversal direction, on the order of 1% to 3% towards the toe, to prevent erosion of their faces. In the longitudinal direction, the benches will have a small slope, on the order of 1.5%, in opposing directions every 25 m. At the lower ends of these slopes, concrete rainwater collection boxes fitted with pipes will be built. These pipes will have diameters dimensioned in accordance with the maximum volumes for each location, perpendicular to the face of the bench, with a slope on the order of 10%. Concrete stairs will be constructed from the ends of these pipes to allow the water to flow down. These stairs connect to the lower bench boxes, through to the last bench at the bottom of the pile. From these points the water will be led through ditches to particulate sedimentation ponds. From these ponds the water will be released into the natural drainage system. Dikes will be built at strategic points in these drains to ensure particulate retention.
16.11.3 Roads and Access Route Drainage
Roads and access routes will feature a narrow shoulder. Ditches will be opened along the sides of the roads for water collection and drainage. At specified distances, where possible, exits will be opened to allow the water to flow into the natural landscape. Depending on the region through which the road is passing, it may be necessary to build collection boxes and culverts to allow the water to flow to the other side of the road. When crossing valleys, culverts, dimensioned to handle the maximum expected flow in the area, will be installed.
16.12 Mining Operation
The main mining operations are:
| |
●
|
Excavation and loading;
|
| |
●
|
Mineralized material haulage to the primary crusher and waste haulage to the waste pile;
|
| |
●
|
Ancillary support services.
|
BNA Mining Solutions - R. Des. Leão Starling, 200 - Ouro Preto, BH - MG, 31310-370 – Phone: +55 (31) 2514-8733 – E-mail: info@bnaconsultoria.com
|
GoldMining Inc.
NI 43-101 Report – São Jorge Project
|
Page 204 |
Excavating and truck loading operations will be performed using hydraulic crawler excavators for both mineralized material and waste.
Trucks will haul the mineralized material to the primary crusher and the waste to the waste piles.
In order to ensure a proper and adequate performance of the main mining operations, they will be supported by ancillary services, such as the maintenance of roads and access routes, dust control, drainage, lubrication, etc. These activities will be performed by a fleet of auxiliary equipment consisting of motor graders, irrigation tank trucks, road trains, track tractors, loaders and utility vehicles.
|
16.13.1
|
Estimation of Average Haul Distances
|
To estimate haul distances, the centroids of the mined material for each period of the mine sequencing were used. For mineralized material, the destination considered was the primary crusher. For waste material, the destination corresponded to the centroid of the waste rock dump planned for each period.
Haul distances were estimated based on the haul roads defined in the mine sequencing. The results are presented in Table 16.19.
Table 16.19 - Estimation of Average Haul Distances
|
Year
|
Type
|
Average Distance(m)
|
|
1
|
Mineralized Material
|
1,209
|
|
Waste
|
4,629
|
|
2
|
Mineralized Material
|
1,606
|
|
Waste
|
4,687
|
|
3
|
Mineralized Material
|
1,771
|
|
Waste
|
5,224
|
|
4
|
Mineralized Material
|
2,167
|
|
Waste
|
5,928
|
|
5
|
Mineralized Material
|
1,918
|
|
Waste
|
5,508
|
|
8
|
Mineralized Material
|
2,444
|
|
Waste
|
6,283
|
|
11
|
Mineralized Material
|
2,137
|
|
Waste
|
6,918
|
16.13.2 Drill and Blast
The blasting design adopts conventional drilling and blasting practices for open pit mining, with parameters defined at a conceptual level based on expected rock mass conditions.
BNA Mining Solutions - R. Des. Leão Starling, 200 - Ouro Preto, BH - MG, 31310-370 – Phone: +55 (31) 2514-8733 – E-mail: info@bnaconsultoria.com
|
GoldMining Inc.
NI 43-101 Report – São Jorge Project
|
Page 205 |
A differentiated drill pattern has been adopted for mineralized material (3.0 m × 5.0 m) and waste (4.0 m × 6.0 m), with 10 m bench height, vertical drill holes of 4” diameter, and 10% subdrilling. The charging configuration considers an explosive column of approximately 10 m, with 1 m stemming and an explosive density of 1.10 g/cm³.
The estimated powder factor is approximately 210 g/t for mineralized material and 131 g/t for waste, reflecting the higher energy required for adequate fragmentation of mineralized material.
The main blasting parameters are summarized in Table 16.20.
The parameters presented are conceptual in nature and are expected to be refined during the operational phase based on field testing and contractor definition. Drilling and blasting operations are expected to be carried out by specialized contractors, although no contractor has been selected at this stage.
Table 16.20 - Blasting Pattern Parameters
|
BLAST DESIGN
|
|
Description
|
Unit
|
Mineralized
Material
|
Waste
|
|
Drill Pattern
|
|
|
|
|
Burden
|
m
|
3.0
|
4.0
|
|
Spacing
|
m
|
5.0
|
6.0
|
|
Material Density
|
t/m3
|
2.84
|
2.84
|
|
Bench Height
|
m
|
10
|
10
|
|
Volume Blasted per Hole (in situ)
|
m3/year (in situ)
|
150
|
240
|
|
Mass Blasted per Hole
|
t
|
425
|
680
|
|
Hole Inclination
|
°
|
0
|
0
|
|
Subdrilling
|
%
|
10%
|
10%
|
|
Total Hole Length
|
m
|
11.00
|
11.00
|
|
Hole Diameter (in)
|
pol.
|
4
|
4
|
|
cm
|
10.2
|
10.2
|
|
Hole Volume
|
cm3/m hole
|
8,107
|
8,107
|
|
Stemming Length
|
m
|
1
|
1
|
|
Explosive Column Length
|
m
|
10.0
|
10.0
|
|
Explosive Density
|
g/cm3
|
1.10
|
1.10
|
|
Hole Charging Factor
|
%
|
100%
|
100%
|
|
Explosive Charge per Hole
|
g
|
89,181
|
89,181
|
|
Powder Factor
|
g/t
|
210
|
131
|
BNA Mining Solutions - R. Des. Leão Starling, 200 - Ouro Preto, BH - MG, 31310-370 – Phone: +55 (31) 2514-8733 – E-mail: info@bnaconsultoria.com
|
GoldMining Inc.
NI 43-101 Report – São Jorge Project
|
Page 206 |
16.13.3 Equipment Selection
A preliminary selection of the main mining equipment was carried out based on the selected mining method, pit geometry, physical characteristics of the materials to be mined, required production scale, and capital and operating costs, among other factors. The selected equipment is commonly used in similar operations and is widely applied in mining and earthmoving activities.
The equipment selection is conceptual in nature and reflects the level of accuracy appropriate for a PEA study. The mining equipment fleet includes:
| |
●
|
Service truck (fuel and lubrication truck);
|
| |
●
|
Crane truck (Hiab/Munck);
|
A brief description of the equipment functions is provided below:
| |
●
|
Hydraulic crawler excavator with an operating weight of approximately 69 t, equipped with a 2.3 m³ bucket, used for excavation and loading of mineralized material, both in the pit and at the ROM stockpile;
|
| |
●
|
On-road truck with a nominal payload capacity of 25 t, equipped with a 16 m³ dump box, used for hauling both mineralized material and waste;
|
| |
●
|
Crawler dozer with approximately 250 HP engine power, used for waste spreading at the waste dumps and for auxiliary operations;
|
| |
●
|
Wheel loader equipped with a 2.3 m³ bucket, used for various support activities and as a backup loading unit if required;
|
| |
●
|
Water truck with a capacity of 20 m³, used for dust suppression on roads and working areas;
|
| |
●
|
Motor grader with approximately 140 HP engine power, used for road and yard maintenance and other auxiliary services;
|
| |
●
|
Utility pickup vehicle, used for supervision and transport of small loads.
|
Mining operations are planned to occur over eight months per year (dry season). Table 16.10 presents the basic project parameters.
BNA Mining Solutions - R. Des. Leão Starling, 200 - Ouro Preto, BH - MG, 31310-370 – Phone: +55 (31) 2514-8733 – E-mail: info@bnaconsultoria.com
|
GoldMining Inc.
NI 43-101 Report – São Jorge Project
|
Page 207 |
Table 16.21 - Basic Project Parameters
|
Item
|
Unit
|
Value
|
|
1. Work Schedule
|
|
|
|
Mining and Crushing
|
|
|
|
Days per year
|
day
|
365
|
|
Shifts per day
|
shifts
|
3
|
|
Hours per shift (average)
|
h /d
|
8
|
|
Break time per day (meals/rest)
|
h
|
2.25
|
|
Number of crews
|
nº
|
4
|
|
Absenteeism rate (including vacation)
|
%
|
16.5%
|
|
2. Material Densities and Moisture (in situ)
|
|
|
|
Average Density
|
|
|
|
Dry basis
|
|
|
|
Mineralized Material
|
t/m3
|
2.56
|
|
Waste
|
t/m3
|
2.37
|
|
Fresh Rock Density
|
|
|
|
Dry basis
|
|
|
|
Mineralized Material
|
t/m3
|
2.70
|
|
Waste
|
t/m3
|
2.70
|
|
Average Moisture
|
|
|
|
Mineralized Material
|
%
|
5%
|
|
Waste
|
%
|
5%
|
|
3. Swell, Spreading and Compaction
|
|
|
|
3.1 Swell
|
|
|
|
Mineralized Material and Waste
|
%
|
25%
|
|
3.2 Waste Compaction
|
%
|
10%
|
|
3.3 Material spread by dozer
|
%
|
75%
|
|
4. Pit Parameters
|
|
|
|
Bench height (blasting)
|
|
|
|
Mineralized Material
|
m
|
10
|
|
Waste
|
m
|
10
|
|
Maximum road gradient
|
%
|
10%
|
|
5. Blasting
|
|
|
|
Explosive
|
|
|
|
Density (Emulsion)
|
g/cm3
|
1.10
|
|
Stemming Mineralized Material
|
m
|
1
|
|
Stemming Waste
|
m
|
1
|
|
Hole filling factor
|
%
|
100%
|
|
6. Main Equipment
|
|
|
|
Drill rig / air compressor
|
|
|
|
Hole diameter Mineralized Material
|
pol
|
4.0
|
|
Hole diameter Waste
|
pol
|
4.0
|
|
Hole inclination
|
º
|
0
|
|
Subdrilling
|
%
|
10%
|
|
Penetration rate
|
m/h
|
36
|
BNA Mining Solutions - R. Des. Leão Starling, 200 - Ouro Preto, BH - MG, 31310-370 – Phone: +55 (31) 2514-8733 – E-mail: info@bnaconsultoria.com
|
GoldMining Inc.
NI 43-101 Report – São Jorge Project
|
Page 208 |
|
Item
|
Unit
|
Value
|
|
Vf/Vp factor
|
%
|
60%
|
|
Drill pattern
|
|
|
|
Burden Mineralized Material
|
m
|
3.00
|
|
Spacing Mineralized Material
|
m
|
5.00
|
|
Burden Waste
|
m
|
4.00
|
|
Spacing Waste
|
m
|
6.00
|
|
Hydraulic excavator - Mineralized Material
|
|
|
|
Bucket capacity Mineralized Material
|
m3
|
1.8
|
|
Bucket capacity Waste
|
m3
|
3.6
|
|
Average cycle time
|
s
|
30
|
|
Bucket fill factor
|
%
|
95%
|
|
Haul truck - Mineralized Material
|
|
|
|
Payload capacity
|
t
|
19
|
|
Body volume
|
m3
|
12
|
|
Haul truck - waste
|
|
|
|
Payload capacity
|
t
|
40
|
|
Body volume
|
m3
|
25
|
|
7. Equipment Performance Factors
|
|
|
|
Drill
|
|
|
|
Physical availability
|
%
|
80%
|
|
Utilization
|
%
|
65%
|
|
Hydraulic excavator
|
|
|
|
Physical availability
|
%
|
85%
|
|
Utilization
|
%
|
78%
|
|
Truck
|
|
|
|
Physical availability
|
%
|
85%
|
|
Utilization
|
%
|
80%
|
|
8. Operational Efficiency Factors
|
|
|
|
Hourly efficiency
|
%
|
90.0%
|
|
Overall operating efficiency
|
%
|
95%
|
|
Weather factor
|
%
|
100%
|
|
9. Truck Speeds
|
|
|
|
Truck - mine/plant and mine/waste dump
|
|
|
|
Loaded (haul)
|
km/h
|
25
|
|
Empty (return)
|
km/h
|
30
|
|
10. Fixed Truck Times
|
|
|
|
Spotting/loading manoeuvres
|
min
|
1.00
|
|
Dumping including manoeuvre
|
min
|
1.25
|
|
Fleet rounding limit
|
%
|
3%
|
BNA Mining Solutions - R. Des. Leão Starling, 200 - Ouro Preto, BH - MG, 31310-370 – Phone: +55 (31) 2514-8733 – E-mail: info@bnaconsultoria.com
|
GoldMining Inc.
NI 43-101 Report – São Jorge Project
|
Page 209 |
16.13.4 Mining Fleet Sizing
The sizing of the main mining equipment fleet was based on the operational parameters presented in the previous section. The equipment was sized to perform excavation, loading, and haulage of material from the mining faces to the primary crusher and waste rock dumps. The fleet sizing reflects average operating conditions and does not consider short-term operational variability.
The following tables present the calculation basis used for fleet sizing, as well as a summary of the resulting equipment fleet (Table 16.22 to Table 16.27).
BNA Mining Solutions - R. Des. Leão Starling, 200 - Ouro Preto, BH - MG, 31310-370 – Phone: +55 (31) 2514-8733 – E-mail: info@bnaconsultoria.com
|
GoldMining Inc.
NI 43-101 Report – São Jorge Project
|
Page 210 |
Table 16.22 - Drill Rig Sizing for Mineralized Material
|
Drill Rig
|
Hole Diameter Mineralized Material
|
Penetration Rate (Vp)
|
Efficiency Factor (Vp/Vf)
|
Drilling Rate (Vf)
|
Burden Mineralized Material
|
Spacing Mineralized Material
|
|
|
|
|
|
(pol.)
|
(mm)
|
(m/h)
|
(%)
|
(m/h)
|
(m)
|
(m)
|
|
|
|
|
| |
4
|
102
|
36
|
60%
|
21.6
|
3.00
|
5.00
|
|
|
|
|
|
Hole
|
Bench Height
|
Hole
|
Hole
|
Subdrilling
|
Hole
|
Blasted Volume
|
|
|
|
|
|
(m)
|
(°)
|
(m)
|
(%)
|
(m)
|
(m)
|
(m3/hole)
|
|
|
|
|
| |
10
|
0
|
10.0
|
10%
|
1.0
|
11.0
|
150.0
|
|
|
|
|
|
Blasting
|
Explosive
|
Density
|
Stemming
|
Hole
|
Charging Factor
|
Explosive
|
Powder Factor
|
|
|
|
|
|
g/cm3
|
m
|
cm3
|
%
|
kg
|
g/t
|
|
|
|
|
| |
|
1.10
|
1.00
|
8,107
|
100%
|
89
|
210
|
|
|
|
|
|
Efficiencies
|
In-situ Density
|
Blasted Mass
|
Hole
|
Hole
|
Operating Efficiency
|
Physical Availability
|
Utilisation
|
|
|
|
|
|
(t/m3)
|
(t/furo)
|
(min)
|
|
|
|
|
| |
2.84
|
425
|
31
|
1.96
|
90%
|
80%
|
65%
|
|
|
|
|
|
Hourly Production
|
Nominal Production
|
Effective Production (Operating Hour)
|
Effective Production (Scheduled Hour)
|
|
|
|
|
|
|
(m3/h)
|
(t/h)
|
(m3/h)
|
(t/h)
|
(m3/h)
|
(t/h)
|
|
|
|
|
|
| |
295
|
835
|
265
|
752
|
138
|
391
|
|
|
|
|
|
| |
|
|
|
|
|
|
|
|
|
|
|
|
Work Schedule
|
365
|
days/year
|
|
|
|
|
|
|
|
|
|
|
3
|
shifts/day
|
|
|
|
|
|
|
|
|
|
|
8
|
h/shift
|
|
|
|
|
|
|
|
|
|
|
Weather Factor
|
1.00
|
|
|
|
|
|
|
|
|
|
|
|
Break Time
|
2.25
|
h/day
|
|
|
|
|
|
|
|
|
|
| |
|
|
|
|
|
|
|
|
|
|
|
|
Scenario
|
1
|
2
|
3
|
4
|
5
|
6
|
7
|
8
|
9
|
10
|
11
|
|
Number of Units Calculated
|
| |
|
Mineralized Material (φ 4,0")
|
|
|
Nominal Production
|
0.09
|
0.27
|
0.28
|
0.30
|
0.31
|
0.30
|
0.30
|
0.30
|
0.32
|
0.32
|
0.31
|
|
Effective Production (Operating Hour)
|
0.10
|
0.30
|
0.32
|
0.33
|
0.34
|
0.34
|
0.34
|
0.34
|
0.35
|
0.35
|
0.35
|
|
Effective Production (Scheduled Hour)
|
0.20
|
0.58
|
0.61
|
0.63
|
0.66
|
0.65
|
0.65
|
0.65
|
0.68
|
0.68
|
0.67
|
| |
|
|
|
|
|
|
|
|
|
|
|
|
Mineralized Material (φ 4,0")
|
|
Total (Operating Hours)
|
0.10
|
0.30
|
0.32
|
0.33
|
0.34
|
0.34
|
0.34
|
0.34
|
0.35
|
0.35
|
0.35
|
|
Total (Scheduled Hours)
|
0.20
|
0.58
|
0.61
|
0.63
|
0.66
|
0.65
|
0.65
|
0.65
|
0.68
|
0.68
|
0.67
|
BNA Mining Solutions - R. Des. Leão Starling, 200 - Ouro Preto, BH - MG, 31310-370 – Phone: +55 (31) 2514-8733 – E-mail: info@bnaconsultoria.com
|
GoldMining Inc.
NI 43-101 Report – São Jorge Project
|
Page 211 |
Table 16.23 - Drill Rig Sizing for Waste
|
Drill Rig
|
Hole Diameter Waste
|
Penetration Rate (Vp)
|
Efficiency Factor (Vp/Vf)
|
Drilling Rate (Vf)
|
Burden Waste
|
Spacing Waste
|
|
|
|
|
|
(pol.)
|
(mm)
|
(m/h)
|
(%)
|
(m/h)
|
(m)
|
(m)
|
|
|
|
|
| |
4
|
102
|
36
|
60%
|
21.6
|
4.00
|
6.00
|
|
|
|
|
|
Hole
|
Bench Height
|
Hole
|
Hole
|
Subdrilling
|
Hole
|
Blasted Volume
|
|
|
|
|
|
(m)
|
(°)
|
(m)
|
(%)
|
(m)
|
(m)
|
(m3/hole)
|
|
|
|
|
| |
10
|
0
|
10.0
|
10%
|
1.0
|
11.0
|
240.0
|
|
|
|
|
|
Blasting
|
Explosive
|
Density
|
Stemming
|
Hole
|
Charging Factor
|
Explosive
|
Powder Factor
|
|
|
|
|
|
g/cm3
|
m
|
cm3
|
%
|
kg
|
g/t
|
|
|
|
|
| |
|
1.10
|
1.00
|
8,107
|
100%
|
89
|
131
|
|
|
|
|
|
Efficiencies
|
In-situ Density
|
Blasted Mass
|
Hole
|
Hole
|
Operating Efficiency
|
Physical Availability
|
Utilisation
|
|
|
|
|
|
(t/m3)
|
(t/hole)
|
(min)
|
|
|
|
|
| |
2.84
|
680
|
31
|
1.96
|
90%
|
80%
|
65%
|
|
|
|
|
|
Hourly Production
|
Nominal Production
|
Effective Production (Operating Hour)
|
Effective Production (Scheduled Hour)
|
|
|
|
|
|
|
(m3/h)
|
(t/h)
|
(m3/h)
|
(t/h)
|
(m3/h)
|
(t/h)
|
|
|
|
|
|
| |
471
|
1,336
|
424
|
1,202
|
221
|
625
|
|
|
|
|
|
| |
|
|
|
|
|
|
|
|
|
|
|
|
Work Schedule
|
365
|
days/year
|
|
|
|
|
|
|
|
|
|
|
3
|
shifts/day
|
|
|
|
|
|
|
|
|
|
|
8
|
h/shift
|
|
|
|
|
|
|
|
|
|
|
Climate factor
|
1.00
|
|
|
|
|
|
|
|
|
|
|
|
Meal/break time
|
2.25
|
h/day
|
|
|
|
|
|
|
|
|
|
| |
|
|
|
|
|
|
|
|
|
|
|
|
Scenario
|
1
|
2
|
3
|
4
|
5
|
6
|
7
|
8
|
9
|
10
|
11
|
|
Number of Units Calculated
|
| |
|
|
|
|
|
|
|
|
|
|
|
Waste (φ 4,0")
|
|
|
Nominal Production
|
0.05
|
0.29
|
0.52
|
0.54
|
0.59
|
0.80
|
0.80
|
0.80
|
0.93
|
0.93
|
0.92
|
|
Effective Production (Operating Hour)
|
0.05
|
0.32
|
0.58
|
0.61
|
0.65
|
0.89
|
0.89
|
0.89
|
1.04
|
1.04
|
1.02
|
|
Effective Production (Scheduled Hour)
|
0.11
|
0.61
|
1.11
|
1.16
|
1.26
|
1.71
|
1.71
|
1.71
|
1.99
|
1.99
|
1.96
|
| |
|
|
|
|
|
|
|
|
|
|
|
|
Waste (φ 4,0")
|
|
Total (Operating Hours)
|
0.05
|
0.32
|
0.58
|
0.61
|
0.65
|
0.89
|
0.89
|
0.89
|
1.04
|
1.04
|
1.02
|
|
Total (Scheduled Hours)
|
0.11
|
0.61
|
1.11
|
1.16
|
1.26
|
1.71
|
1.71
|
1.71
|
1.99
|
1.99
|
1.96
|
BNA Mining Solutions - R. Des. Leão Starling, 200 - Ouro Preto, BH - MG, 31310-370 – Phone: +55 (31) 2514-8733 – E-mail: info@bnaconsultoria.com
|
GoldMining Inc.
NI 43-101 Report – São Jorge Project
|
Page 212 |
Table 16.24 - Hydraulic Excavator Sizing for Mineralized Material and Waste
|
Hydraulic Excavator
|
Bucket Capacity
|
Cycle Time
|
Operating Efficiency
|
Combined Operating Efficiency
|
Bucket Fill
Factor
|
Moist Density
|
Swell Factor
(%)
|
Physical Availability
(%)
|
Utilisation
|
|
|
|
|
(m3)
|
(s)
|
(%)
|
(%)
|
(%)
|
(t/m³)
|
(%)
|
(%)
|
(%)
|
|
|
|
|
Mineralized Material
|
1.8
|
30
|
90%
|
95%
|
95%
|
2.69
|
25%
|
85%
|
78%
|
|
|
|
|
Waste
|
3.6
|
30
|
90%
|
95%
|
95%
|
2.49
|
25%
|
85%
|
78%
|
|
|
|
| |
|
|
|
|
|
|
|
|
|
|
|
|
|
Hourly Production
|
|
Nominal Production
|
|
Effective Production per
Operating Hour
|
|
Effective Production per
Scheduled Hour
|
|
|
|
| |
(t/h)
|
(m3/h) in situ
|
|
(t/h)
|
(m3/h) in situ
|
|
(t/h)
|
(m3/h) in situ
|
|
|
|
|
Mineralized Material
|
|
464
|
173
|
|
377
|
140
|
|
250
|
93
|
|
|
|
|
Waste
|
|
860
|
346
|
|
699
|
281
|
|
463
|
186
|
|
|
|
|
Work Schedule
|
365
|
Days per year
|
|
|
|
|
|
|
Mass per Pass
|
|
|
|
|
3
|
Shifts per day
|
|
|
|
|
|
|
(t)
|
|
|
|
|
8
|
Hours per shift
|
|
|
|
Mineralized Material
|
3.7
|
|
|
|
|
Weather Factor
|
1
|
|
|
|
|
Waste
|
6.8
|
|
|
|
|
Break Time (h/day)
|
2
|
h/day
|
|
|
|
|
|
|
|
|
|
|
|
Fleet Rounding Limit
|
3%
|
|
|
|
|
|
|
|
|
|
| |
|
|
|
|
|
|
|
|
|
|
|
|
|
Material
|
Scenario
|
1
|
2
|
3
|
4
|
5
|
6
|
7
|
8
|
9
|
10
|
11
|
|
Number of Equipment Required
|
|
Mineralized Material
|
Nominal Production
|
0.43
|
0.57
|
0.57
|
0.57
|
0.58
|
0.57
|
0.57
|
0.57
|
0.57
|
0.57
|
0.56
|
|
Effective Production per Operating Hour (OH)
|
0.53
|
0.7
|
0.71
|
0.71
|
0.71
|
0.7
|
0.7
|
0.7
|
0.7
|
0.7
|
0.69
|
|
Effective Production per Scheduled Hour (SH)
|
0.81
|
1.06
|
1.06
|
1.06
|
1.07
|
1.06
|
1.06
|
1.06
|
1.06
|
1.06
|
1.04
|
|
Waste
|
Nominal Production
|
0.59
|
0.99
|
1.13
|
1.16
|
1.14
|
1.62
|
1.62
|
1.62
|
1.45
|
1.45
|
1.43
|
|
Effective Production per Operating Hour (OH)
|
0.73
|
1.22
|
1.4
|
1.43
|
1.4
|
1.99
|
1.99
|
1.99
|
1.78
|
1.78
|
1.76
|
|
Effective Production per Scheduled Hour (SH)
|
1.1
|
1.84
|
2.1
|
2.15
|
2.12
|
3
|
3
|
3
|
2.69
|
2.69
|
2.65
|
|
Mineralized Material and Waste
|
Total / Operating Hours (OH)
|
1.26
|
1.92
|
2.1
|
2.13
|
2.11
|
2.69
|
2.69
|
2.69
|
2.49
|
2.49
|
2.45
|
|
Total / Scheduled Hours (SH)
|
1.9
|
2.9
|
3.17
|
3.22
|
3.19
|
4.06
|
4.06
|
4.06
|
3.75
|
3.75
|
3.69
|
|
Rounded Number of Units
|
2
|
3
|
4
|
4
|
4
|
4
|
4
|
4
|
4
|
4
|
4
|
BNA Mining Solutions - R. Des. Leão Starling, 200 - Ouro Preto, BH - MG, 31310-370 – Phone: +55 (31) 2514-8733 – E-mail: info@bnaconsultoria.com
|
GoldMining Inc.
NI 43-101 Report – São Jorge Project
|
Page 213 |
Table 16.25 - Truck Sizing for Mineralized Material and Waste
|
From
|
Pit
|
To
|
|
Various
|
|
Moist Density (t/m3)
|
|
|
Average Swell Factor
(%)
|
|
|
|
|
|
|
|
Mineralized Material
|
2.69
|
|
|
|
25%
|
|
|
|
|
|
|
|
Waste
|
2.49
|
|
|
|
25%
|
|
|
|
|
|
|
|
LOADING EQUIPMENT
|
|
|
|
|
|
|
|
|
|
|
|
|
|
|
Brand
|
|
Bucket Capacity
|
Cycle Time
|
Bucket Fill Factor
|
|
Model
|
|
(m3)
|
(s)
|
(%)
|
|
Hydraulic Excavator
|
Mineralized Material
|
1.80
|
30
|
95%
|
|
Hydraulic Excavator
|
Waste
|
3.60
|
30
|
95%
|
|
Truck
|
|
|
|
|
|
|
|
|
|
|
|
|
|
|
Brand
|
|
Capacity
|
Actual Load
|
Number of Passes
|
Operating Efficiency
|
Overall
Operating
Efficiency
|
Physical
Availability
|
Utilisation
|
|
Model
|
|
(m3)
|
(t)
|
(t)
|
(%)
|
(%)
|
(%)
|
(%)
|
|
Conventional haul truck
|
Mineralized Material
|
12
|
19
|
19.0
|
6
|
90%
|
95%
|
85%
|
80%
|
|
Conventional haul truck
|
Waste
|
25
|
40
|
40.0
|
6
|
90%
|
95%
|
85%
|
80%
|
|
Material
|
Fixed Times (min)
|
|
|
|
|
Work Schedule
|
365
|
days/year
|
Weather Factor
|
|
Carga
|
Spotting for
Loading
|
Dumping (incl.
manoeuvre)
|
Total
|
|
|
|
|
3
|
shifts/day
|
|
100%
|
|
Mineralized Material
|
3.0
|
1.00
|
1.25
|
5.3
|
|
|
|
|
8
|
h/shift
|
|
100%
|
|
Waste
|
3.0
|
1.00
|
1.25
|
5.3
|
|
|
|
|
Break Time
|
2.25
|
h/day
|
|
|
| |
|
|
|
|
|
|
|
|
|
|
|
|
|
|
Breakdown
|
Year of Operation
|
|
|
|
1
|
2
|
3
|
4
|
5
|
6
|
7
|
8
|
9
|
10
|
11
|
|
|
|
Total Cycle Time – manoeuvring, loading, dumping, haul and return (min)
|
|
|
|
Mineralized Material
|
10.6
|
12.3
|
13.0
|
14.3
|
13.7
|
15.1
|
15.1
|
15.1
|
16.0
|
16.0
|
16.0
|
|
|
|
Waste
|
26.6
|
26.9
|
29.4
|
31.8
|
31.6
|
33.4
|
33.4
|
33.4
|
37.2
|
37.2
|
37.2
|
|
|
|
Hourly Production per Scheduled Hour
|
|
|
|
Mineralized Material
|
62.7
|
53.8
|
50.8
|
46.2
|
48.4
|
43.8
|
43.8
|
43.8
|
41.5
|
41.5
|
41.5
|
|
|
|
Waste
|
52.4
|
51.9
|
47.5
|
43.9
|
44.2
|
41.8
|
41.8
|
41.8
|
37.5
|
37.5
|
37.5
|
|
|
|
Nominal Fleet
|
|
|
|
|
|
|
|
|
|
|
|
|
|
|
Mineralized Material
|
1.9
|
2.9
|
3.0
|
3.3
|
3.2
|
3.5
|
3.5
|
3.5
|
3.7
|
3.7
|
2.1
|
|
|
|
Waste
|
5.6
|
9.6
|
11.9
|
13.2
|
12.9
|
19.4
|
19.4
|
19.4
|
19.3
|
19.3
|
11.0
|
|
|
|
Fleet per Operating Hours
|
|
|
|
|
|
|
|
|
|
|
|
|
|
|
Mineralized Material
|
2.2
|
3.3
|
3.6
|
3.9
|
3.8
|
4.1
|
4.1
|
4.1
|
4.3
|
4.3
|
4.3
|
|
|
|
Waste
|
6.6
|
11.2
|
14.0
|
15.4
|
15.1
|
22.6
|
22.6
|
22.6
|
22.6
|
22.6
|
22.3
|
|
|
|
Fleet per Scheduled Hours
|
|
|
|
|
|
|
|
|
|
|
|
|
|
|
Mineralized Material
|
3.2
|
4.9
|
5.2
|
5.8
|
5.5
|
6.1
|
6.1
|
6.1
|
6.4
|
6.4
|
6.3
|
|
|
|
Waste
|
9.7
|
16.5
|
20.5
|
22.7
|
22.2
|
33.3
|
33.3
|
33.3
|
33.2
|
33.2
|
32.8
|
|
|
|
TOTAL FLEET REQUIRED
|
|
|
|
Mineralized Material e Waste
|
|
|
|
Total/HT
|
8.8
|
14.5
|
17.5
|
19.4
|
18.8
|
26.8
|
26.8
|
26.8
|
26.9
|
26.9
|
26.5
|
|
|
|
Total/HP
|
12.9
|
21.4
|
25.8
|
28.5
|
27.7
|
39.3
|
39.3
|
39.3
|
39.6
|
39.6
|
39.0
|
|
|
|
Rounded Number of Units
|
13
|
21
|
25
|
28
|
27
|
39
|
39
|
39
|
39
|
39
|
39
|
|
|
|
Fleet Rounding Limit
|
3%
|
|
|
|
|
|
|
|
|
|
|
BNA Mining Solutions - R. Des. Leão Starling, 200 - Ouro Preto, BH - MG, 31310-370 – Phone: +55 (31) 2514-8733 – E-mail: info@bnaconsultoria.com
|
GoldMining Inc.
NI 43-101 Report – São Jorge Project
|
Page 214 |
Table 16.26 - Crawler Dozer for Stockpile and Waste
|
Service Description:
|
Waste spreading on stockpile
|
Work Condition Correction Factors (CAT Manual)
|
|
| |
|
|
|
|
|
Operator
|
Material
|
Trenching
|
L/L
|
Visibility
|
Total
|
|
|
Density (t/m3)
|
2.49
|
Swell Factor (%)
|
25%
|
|
0.75
|
0.9
|
1.0
|
1.0
|
1.0
|
0.68
|
|
| |
|
|
|
|
|
|
|
|
|
|
|
|
|
Equipment
|
Blade Capacity
|
Hourly Efficiency
|
Operating Efficiency
|
Fill Factor
|
Moist Density
|
Swell Factor
|
Physical Availability
|
Utilisation
|
Material
|
|
|
(Type)
|
Type
|
m3
|
%
|
%
|
|
|
(%)
|
(%)
|
|
|
35 t Class
|
SU
|
8.7
|
83%
|
100%
|
100%
|
2.49
|
25%
|
85%
|
80%
|
Waste
|
|
| |
|
|
|
|
|
|
|
|
|
|
|
|
HOURLY PRODUCTION – WASTE HANDLING FOR PIT BACKFILL
|
|
|
|
|
|
|
|
|
|
|
Equipment
|
Average Operating Distance
|
|
|
|
|
Downhill
|
Horizontal
|
Uphill
|
Total
|
|
|
|
|
(Type)
|
Grade (%)
|
Factor
|
Dist. (m)
|
Dist. (m)
|
Grade (%)
|
Factor
|
Dist. (m)
|
Dist. (m)
|
Factor
|
|
|
|
|
35 t Class
|
0.0
|
0.00
|
0.0
|
30.0
|
0.0
|
0.0
|
0.00
|
30.0
|
1.00
|
|
|
|
|
Work Schedule
|
365
|
days/year
|
|
Hourly Production
|
|
3
|
shifts/day
|
|
Curve
|
Nominal
|
Effective (Operating Hour)
|
Effective (Scheduled Hour)
|
Material
|
|
8
|
h/shift
|
|
m3 (in situ)
|
t
|
m3 (in situ)
|
t
|
m3 (in situ)
|
t
|
m3 (in situ)
|
|
Weather Factor
|
1.00
|
|
|
1,300
|
1,747
|
702
|
1,450
|
583
|
986
|
396
|
Waste
|
|
Break Time
|
2.25
|
h/day
|
|
|
|
|
|
|
|
|
|
| |
|
|
|
|
Annual Production
|
| |
|
|
|
|
Nominal
|
Effective (Operating Hour)
|
Effective (Scheduled Hour)
|
Material
|
| |
|
|
|
|
t
|
m3 (in situ)
|
t
|
m3 (in situ)
|
t
|
m3 (in situ)
|
| |
|
|
|
|
13,868,417
|
5,573,003
|
11,510,786
|
4,625,592
|
7,827,334
|
3,145,403
|
Waste
|
| |
|
|
|
|
|
|
|
|
|
|
|
|
|
Description
|
1
|
2
|
3
|
4
|
5
|
6
|
7
|
8
|
9
|
10
|
11
|
|
|
Nominal Fleet
|
0.3
|
0.5
|
0.5
|
0.5
|
0.5
|
0.7
|
0.7
|
0.7
|
0.6
|
0.6
|
0.6
|
|
|
Fleet / Operating Hour
|
0.4
|
0.6
|
0.6
|
0.7
|
0.6
|
0.9
|
0.9
|
0.9
|
0.8
|
0.8
|
0.8
|
|
|
Fleet / Scheduled Hour
|
0.5
|
0.9
|
0.9
|
1.0
|
0.9
|
1.3
|
1.3
|
1.3
|
1.1
|
1.1
|
1.1
|
|
|
Rounded Units
|
1
|
1
|
1
|
1
|
1
|
2
|
2
|
2
|
2
|
2
|
2
|
|
|
Rounding Limit 3%
|
|
|
|
|
|
|
|
|
|
|
BNA Mining Solutions - R. Des. Leão Starling, 200 - Ouro Preto, BH - MG, 31310-370 – Phone: +55 (31) 2514-8733 – E-mail: info@bnaconsultoria.com
|
GoldMining Inc.
NI 43-101 Report – São Jorge Project
|
Page 215 |
Table 16.27 - Mining Fleet Sizing Summary
|
Equipment
|
Specification
|
Year
|
|
1
|
2
|
3
|
4
|
5
|
6
|
7
|
8
|
9
|
10
|
11
|
|
Hydraulic Drill
|
φ 4,0"
|
1
|
2
|
2
|
2
|
2
|
3
|
3
|
3
|
3
|
3
|
3
|
|
Hydraulic Excavator
|
|
2
|
3
|
4
|
4
|
4
|
4
|
4
|
4
|
4
|
4
|
4
|
|
Haul Truck
|
|
13
|
21
|
25
|
28
|
27
|
39
|
39
|
39
|
39
|
39
|
39
|
|
Crawler Dozer
|
D7
|
1
|
1
|
1
|
1
|
1
|
2
|
2
|
2
|
2
|
2
|
2
|
|
Crawler Dozer (Additional)
|
D6
|
1
|
1
|
1
|
1
|
1
|
1
|
1
|
1
|
1
|
1
|
1
|
|
Wheel Loader (2) / Hydraulic Excavator (1) - Auxiliary
|
3,6 m3
|
3
|
3
|
3
|
3
|
3
|
3
|
3
|
3
|
3
|
3
|
3
|
|
Water Truck
|
20000 L
|
3
|
3
|
3
|
3
|
3
|
3
|
3
|
3
|
3
|
3
|
3
|
|
Motor Grader
|
140 hp
|
1
|
1
|
1
|
1
|
1
|
1
|
1
|
1
|
1
|
1
|
1
|
|
Lighting Tower (Diesel)
|
4.000 w
|
9
|
9
|
9
|
9
|
9
|
9
|
9
|
9
|
9
|
9
|
9
|
|
Service Truck (Fuel/Lube)
|
|
1
|
1
|
1
|
1
|
1
|
1
|
1
|
1
|
1
|
1
|
1
|
|
Backhoe
|
|
2
|
2
|
2
|
2
|
2
|
2
|
2
|
2
|
2
|
2
|
2
|
|
Crane Truck (Munck)
|
|
1
|
1
|
1
|
1
|
1
|
1
|
1
|
1
|
1
|
1
|
1
|
|
Utility Vehicle (Pick-up)
|
|
5
|
5
|
5
|
5
|
5
|
5
|
5
|
5
|
5
|
5
|
5
|
BNA Mining Solutions - R. Des. Leão Starling, 200 - Ouro Preto, BH - MG, 31310-370 – Phone: +55 (31) 2514-8733 – E-mail: info@bnaconsultoria.com
|
GoldMining Inc.
NI 43-101 Report – São Jorge Project
|
Page 216 |
16.14 Personnel Requirements
The Project is planned to operate 24 hours per day, 365 days per year, based on a three-shift schedule (3 × 8-hour shifts) to ensure continuous operations. The administrative team operates on a standard weekday schedule, from 7:20 am to 5:20 pm, observing national holidays. Personnel requirements over the Life of Mine (“LOM”) are presented in Table 16.28.
It should be noted that maintenance personnel for the mining operations were not accounted for separately, as maintenance activities are integrated with the processing plant. Accordingly, all maintenance workforce has been allocated under the plant personnel.
Table 16.28 - Personnel Requirements for Mine Operations
|
Description
|
Year
|
|
1
|
2
|
3
|
4
|
5
|
6
|
7
|
8
|
9
|
10
|
11
|
|
Geology, Planning and Exploration
|
12
|
12
|
12
|
12
|
12
|
12
|
12
|
12
|
12
|
12
|
12
|
|
Mining Engineer
|
2
|
2
|
2
|
2
|
2
|
2
|
2
|
2
|
2
|
2
|
2
|
|
Geologist
|
2
|
2
|
2
|
2
|
2
|
2
|
2
|
2
|
2
|
2
|
2
|
|
Technician
|
3
|
3
|
3
|
3
|
3
|
3
|
3
|
3
|
3
|
3
|
3
|
|
Surveyor
|
2
|
2
|
2
|
2
|
2
|
2
|
2
|
2
|
2
|
2
|
2
|
|
Assistant
|
3
|
3
|
3
|
3
|
3
|
3
|
3
|
3
|
3
|
3
|
3
|
|
Mining Operations
|
124
|
164
|
184
|
195
|
195
|
247
|
247
|
247
|
247
|
247
|
247
|
|
Supervisor
|
3
|
3
|
3
|
3
|
3
|
3
|
3
|
3
|
3
|
3
|
3
|
|
Mining Engineer
|
2
|
2
|
2
|
2
|
2
|
2
|
2
|
2
|
2
|
2
|
2
|
|
Mining Equipment Operators
|
|
|
|
|
|
|
|
|
|
|
|
|
Hydraulic Drill
|
4
|
8
|
8
|
8
|
8
|
12
|
12
|
12
|
12
|
12
|
12
|
|
Hydraulic Excavator
|
8
|
12
|
16
|
16
|
16
|
16
|
16
|
16
|
16
|
16
|
16
|
|
Haul Truck
|
52
|
84
|
100
|
111
|
111
|
155
|
155
|
155
|
155
|
155
|
155
|
|
Crawler Dozer
|
4
|
4
|
4
|
4
|
4
|
8
|
8
|
8
|
8
|
8
|
8
|
|
Crawler Dozer (Additional)
|
4
|
4
|
4
|
4
|
4
|
4
|
4
|
4
|
4
|
4
|
4
|
|
Wheel Loader (Auxiliary)
|
12
|
12
|
12
|
12
|
12
|
12
|
12
|
12
|
12
|
12
|
12
|
|
Water Truck
|
12
|
12
|
12
|
12
|
12
|
12
|
12
|
12
|
12
|
12
|
12
|
|
Motor Grader
|
4
|
4
|
4
|
4
|
4
|
4
|
4
|
4
|
4
|
4
|
4
|
|
Service Truck
|
4
|
4
|
4
|
4
|
4
|
4
|
4
|
4
|
4
|
4
|
4
|
|
Backhoe
|
8
|
8
|
8
|
8
|
8
|
8
|
8
|
8
|
8
|
8
|
8
|
|
Crane Truck
|
4
|
4
|
4
|
4
|
4
|
4
|
4
|
4
|
4
|
4
|
4
|
|
Service Helper
|
3
|
3
|
3
|
3
|
3
|
3
|
3
|
3
|
3
|
3
|
3
|
|
TOTAL WORKFORCE
|
136
|
176
|
196
|
207
|
207
|
259
|
259
|
259
|
259
|
259
|
259
|
BNA Mining Solutions - R. Des. Leão Starling, 200 - Ouro Preto, BH - MG, 31310-370 – Phone: +55 (31) 2514-8733 – E-mail: info@bnaconsultoria.com
|
GoldMining Inc.
NI 43-101 Report – São Jorge Project
|
Page 217 |
The process plant design for the São Jorge Project is primarily based on the metallurgical test work completed by Testwork Desenvolvimento de Processo Ltda in 2012, supplemented by historical metallurgical investigations conducted by SGS Lakefield Research in 2006 and additional leaching test work completed by Testwork Desenvolvimento de Processo Ltda in 2013.
The Process Plant was designed for a capacity of 2 Mtpa, equivalent to approximately 260 t/h. The Process Plant will treat mineralized material using conventional unit operations, including comminution, gravity concentration, cyanide leaching with Carbon in Leach, gold adsorption, carbon elution, and gold recovery circuits.
|
17.1
|
Process Design Criteria
|
The proposed process plant will consist of the following unit operations:
| |
●
|
Primary, secondary, and tertiary crushing of ROM material, including stockpiling and reclaim.
|
| |
●
|
Grinding consisting of a ball mill with hydrocyclones producing a final product with a P80 of 75 μm.
|
| |
●
|
Gravity concentration (50% of the total hydrocyclone underflow) to produce a gold-rich concentrate for intensive leaching and gold recovery via electrowinning.
|
| |
●
|
Pre-leach thickening, cyanide leaching, and carbon adsorption through a Carbon in Leach circuit.
|
| |
●
|
Carbon elution using the ADR process.
|
| |
●
|
Carbon handling and regeneration.
|
| |
●
|
Electrowinning and smelting to produce gold doré.
|
| |
●
|
Cyanide destruction of CIL tailings using the SO₂/air process.
|
| |
●
|
Tailings thickening and pumping to the tailings storage facility.
|
| |
●
|
Reagent circuits, including air and oxygen systems.
|
| |
●
|
Water systems including potable water, raw water, gland seal water, and process water.
|
Key process design criteria are summarized in Table 17.1.
BNA Mining Solutions - R. Des. Leão Starling, 200 - Ouro Preto, BH - MG, 31310-370 – Phone: +55 (31) 2514-8733 – E-mail: info@bnaconsultoria.com
|
GoldMining Inc.
NI 43-101 Report – São Jorge Project
|
Page 218 |
Table 17.1 - Process Design Criteria – General
|
Criteria
|
Crushing
|
Process Plant
|
|
Days/year
|
365
|
365
|
|
Hours/day
|
24
|
24
|
|
Hours/year
|
8,760
|
8,760
|
|
Availability (%)
|
65%
|
88%
|
|
Operating hours/year
|
5,694
|
7,709
|
|
ROM throughput (t/year)
|
2,000,000
|
2,000,000
|
|
Feed rate (t/h)
|
351.25
|
259.44
|
|
ROM throughput – LOM total (t)
|
20,729,315
|
20,729,315
|
Key process design criteria for the principal unit operations included in the conceptual process flowsheet are summarized in Table 17.2. The design criteria were developed based on the available historical metallurgical test work and are considered appropriate for a PEA level evaluation of the Project.
Table 17.2 - Process Design – Unit Operations
|
Area
|
Criteria / Unit
|
Nominal Value
|
|
Crushing and Stockpile
|
Run of Mine (ROM), Maximum Size - mm
|
700
|
|
Crushing and Stockpile
|
Crusher Circuit Product Size (P80) - mm
|
5
|
|
Crushing and Stockpile
|
Stockpile Capacity (live) - hr
|
8
|
|
Crushing and Stockpile
|
Conveyor Belt Speed - Average
|
2 m/sec
|
|
Crushing and Stockpile
|
Belt Filling - Maximum
|
80%
|
|
Crushing and Stockpile
|
Maximum Belt Inclination
|
12 degrees
|
|
Crushing and Stockpile
|
Feeder Speed
|
0.2 m/sec
|
|
Crushing and Stockpile
|
Feeder Filling
|
95%
|
|
Mill and Classification
|
Bond Ball Mill Work Index @106 mm - P80 - kWh/t
|
15.5
|
|
Mill and Classification
|
Mill - % ball filling
|
40%
|
|
Mill and Classification
|
Grinding Circuit Product Size (P80) - µm
|
75
|
|
Mill and Classification
|
Cyclone Feed Pressure
|
Max. 2 kgf/cm²
|
|
Gravity Concentration
|
Gold Centrifuge - 50% Feed - 1 unit
|
-
|
|
Gravity Concentration
|
Intensive Leach Reactor - ILR - 1 unit
|
ILR 2000BA
|
|
ILR-Intensive Leach Reactor-Gravimetric Gold
|
Number Batches/day
|
1
|
|
ILR-Intensive Leach Reactor-Gravimetric Gold Gravity Concentration-IRL
|
Residence time - hr
|
10 to 12
|
|
Pre-Leach Thickening
|
Thickener Underflow Density - % w/w
|
60
|
|
Pre-Leach Thickening
|
Pre-Leach Residence Time - hr
|
5
|
|
CIL
|
CIL Tanks - unit
|
8
|
|
CIL
|
Overall CIL Residence Time - hr Total
|
24
|
|
CIL
|
Coal Concentration in Tanks - g/L
|
30
|
|
CIL
|
Circuit Density - % w/w
|
50
|
|
ADR
|
Elution time - hr
|
6 to 8
|
|
ADR
|
Number of Desorption Cycles per Mont
|
20
|
|
ADR
|
Elution Batch Size (Carbon) - t/d
|
3
|
|
ADR
|
Amount of Coal in each Elution - t
|
3
|
|
Cyanide Destruction
|
Cyanide Destruction Technology
|
SO₂/air
|
|
Cyanide Destruction
|
Number of Stages
|
2
|
|
Cyanide Destruction
|
Total Retention Time
|
To be defined
|
BNA Mining Solutions - R. Des. Leão Starling, 200 - Ouro Preto, BH - MG, 31310-370 – Phone: +55 (31) 2514-8733 – E-mail: info@bnaconsultoria.com
|
GoldMining Inc.
NI 43-101 Report – São Jorge Project
|
Page 219 |
17.2 Overall Flowsheet and General Layout
The overall flowsheet illustrates the unit operations of the Process Plant. The general arrangement layouts are presented below (Figure 17.1 to Figure 17.4).
Figure 17.1 - Flowsheet – Crushing, Classification, and Stockpile
BNA Mining Solutions - R. Des. Leão Starling, 200 - Ouro Preto, BH - MG, 31310-370 – Phone: +55 (31) 2514-8733 – E-mail: info@bnaconsultoria.com
|
GoldMining Inc.
NI 43-101 Report – São Jorge Project
|
Page 220 |
Figure 17.2 - Flowsheet – Grinding, Gravity Recovery, Intensive Leaching, and Electrowinning
Figure 17.3 - Flowsheet – Cyanide Leaching, Gold Adsorption, Electrowinning, Bullion, and Tailings
BNA Mining Solutions - R. Des. Leão Starling, 200 - Ouro Preto, BH - MG, 31310-370 – Phone: +55 (31) 2514-8733 – E-mail: info@bnaconsultoria.com
|
GoldMining Inc.
NI 43-101 Report – São Jorge Project
|
Page 221 |
Figure 17.4 - General Layout
BNA Mining Solutions - R. Des. Leão Starling, 200 - Ouro Preto, BH - MG, 31310-370 – Phone: +55 (31) 2514-8733 – E-mail: info@bnaconsultoria.com
|
GoldMining Inc.
NI 43-101 Report – São Jorge Project
|
Page 222 |
|
17.3
|
Process Plant Description
|
|
17.3.1
|
Primary, Secondary, and Tertiary Crushing – Stockpile
|
The Process Plant is fed by haul trucks that directly discharge mineralized material into the ROM bin.
Alternatively, trucks may discharge material onto the ROM pad. The ROM pad will primarily be used for emergency storage and blending of saprolite and sulphide mineralized material, when required by the mine plan. Material will be reclaimed to the ROM pad using a front-end loader.
Mineralized material will be withdrawn from the ROM bin by a variable-speed apron feeder and discharged directly onto a vibrating grizzly with an aperture size of approximately 100 mm. Oversize material from the grizzly will feed the jaw crusher operating in open circuit.
Crushed mineralized material from the primary crusher discharge, together with grizzly undersize material, will be conveyed to a double-deck screen with 60 mm and 22 mm apertures.
Oversize material from the first deck will be conveyed to a secondary cone crusher. The crushed product will return to the screen in closed circuit.
Oversize material from the second deck will be conveyed to a tertiary cone crusher. The crushed product will feed a second double-deck classification screen with 12 mm and 8 mm apertures.
Undersize material from the first classification screen will be conveyed to the second classification screen.
Oversize material from both decks of the second classification screen will return to the tertiary crusher in closed circuit.
Undersize material from the second classification screen will be conveyed to the stockpile by belt conveyor. The final product particle size will be below 8 mm, with a P80 of approximately 5 mm.
The stockpiled mineralized material will be reclaimed using two apron feeders located beneath the stockpile. These feeders will be equipped with variable-speed drives to control the feed rate to the grinding circuit. The crushed mineralized material, with a P80 of approximately 5 mm, will be transported by conveyor belt to the grinding circuit.
|
17.3.2
|
Grinding and Classification
|
Grinding will be performed in a ball mill operating in closed circuit with hydrocyclone classification. The mill dimensions are 8.5 m in diameter by 5.0 m effective grinding length (“EGL”).
The cyclone underflow will be divided into two streams, with 50% of the flow returning directly to the ball mill and the remaining 50% directed to the gravity concentration circuit for coarse gold recovery.
The cyclone overflow, with a P80 of approximately 75 μm, will be pumped to the pre-leach thickener and subsequently to the CIL circuit.
BNA Mining Solutions - R. Des. Leão Starling, 200 - Ouro Preto, BH - MG, 31310-370 – Phone: +55 (31) 2514-8733 – E-mail: info@bnaconsultoria.com
|
GoldMining Inc.
NI 43-101 Report – São Jorge Project
|
Page 223 |
|
17.3.3
|
Gravity Gold Recovery
|
The gravity recovery circuit will consist of one centrifugal gravity concentrator unit and one intensive leach reactor (“ILR”). The circuit has been designed to treat 50% of the cyclone underflow.
Cyclone underflow will be screened using a vibrating screen to remove material coarser than 2 mm. The oversize material will discharge directly to the ball mill feed.
The undersize product will feed the centrifugal gravity concentrator. Gravity concentrator tailings will discharge to the cyclone feed pump box and return to the grinding circuit.
The gravity concentrate will be pumped to the ILR.
The gravity concentrate will be processed in batch mode in the intensive cyanidation unit at 12-hour intervals. The concentrate will be leached using a solution containing sodium cyanide, caustic solution, and leach accelerant reagents. After completion of the leach cycle, the pregnant solution will be pumped to the gravity electrowinning circuit, while the residue from the intensive cyanidation unit will be pumped to the pre-leach thickener.
|
17.3.4
|
Pre-Leach Thickening and CIL
|
Cyclone overflow will be pumped to a 15 m diameter pre-leach thickener to increase slurry density prior to cyanidation. Flocculant will be added to the thickener feed to improve solids settling.
The thickener underflow, at approximately 60% solids by weight, will be pumped to the CIL circuit consisting of two pre-leach tanks and eight CIL tanks. The CIL circuit will provide a total residence time of approximately 24 hours.
Oxygen will be sparged into the leach tanks and water will be added to maintain slurry density at approximately 45% solids by weight.
Reagents added to the CIL circuit will include sodium cyanide for gold dissolution and hydrated lime to maintain the pH between approximately 10.5 and 11.5.
The CIL tanks will be equipped with interstage screens and pumps to advance loaded carbon counter-currently through the circuit. Activated carbon will be added to CIL Tank 6, while loaded carbon will exit the circuit from the first and second CIL tanks.
Loaded carbon will be transferred to the carbon stripping circuit, while leach residue from the final tank will be directed to a carbon safety screen for carbon recovery.
|
17.3.5
|
Cyanide Recovery, Detoxification, and Tailings
|
The cyanide destruction circuit will consist of two tanks providing a total residence time of approximately 200 minutes. The circuit will treat slurry discharged from the CIL tanks.
BNA Mining Solutions - R. Des. Leão Starling, 200 - Ouro Preto, BH - MG, 31310-370 – Phone: +55 (31) 2514-8733 – E-mail: info@bnaconsultoria.com
|
GoldMining Inc.
NI 43-101 Report – São Jorge Project
|
Page 224 |
SO₂/air will be added to the tanks for cyanide destruction. Hydrated lime will be added to maintain a pH of approximately 8.5, and copper sulphate will be added as a catalyst.
The process is designed to reduce total cyanide in solution to approximately 0.4 mg/L and WAD cyanide to approximately 0.2 mg/L.
The treated slurry will be pumped to a tailings thickener. Flocculant will be added to the thickener feed.
The thickener overflow will return to the CIL circuit, while the underflow will be pumped to the tailings storage facility (“TSF”).
|
17.3.6
|
Acid Wash and Elution
|
Loaded carbon will be screened from the CIL circuit and transferred to the acid wash column. Typical gold loading is approximately 3,000 g/t in batch operation.
Fresh acid will be pumped from drums to the acid wash tank as required. The carbon will subsequently be rinsed with fresh water to remove acid and mineral impurities.
Typical operating conditions are as follows:
| |
●
|
Acid concentration: 2–5% HCl
|
| |
●
|
Temperature: ambient to 60°C
|
| |
●
|
Contact time: 30 minutes to several hours
|
Carbon slurry will then be pumped directly into the top of the elution vessel.
The elution process removes adsorbed gold and silver from loaded carbon into solution for recovery by electrowinning and smelting.
The selected elution process is pressure Zadra.
A caustic cyanide solution containing 0.2% NaCN and 1% NaOH will be prepared and circulated through the desorption column. The solution will enter from the bottom and exit from the top under an operating pressure of approximately 3 kgf/cm², at a temperature of approximately 130°C, and at a flow rate of approximately 2 BVH (approximately 6 m³/h).
Hot water or solution will heat the carbon bed to operating temperature while the eluant solution circulates through the carbon. Gold will desorb into solution.
BNA Mining Solutions - R. Des. Leão Starling, 200 - Ouro Preto, BH - MG, 31310-370 – Phone: +55 (31) 2514-8733 – E-mail: info@bnaconsultoria.com
|
GoldMining Inc.
NI 43-101 Report – São Jorge Project
|
Page 225 |
The carbon stripping cycle will utilize barren solution to strip gold-rich carbon and generate a pregnant solution.
Following stripping, barren carbon will be transferred to the thermal regeneration feed tank using ejectors over a transfer period of approximately one hour.
Gold-rich eluate will discharge from the column and flow to the electrowinning cells.
17.3.7 Electrowinning and Gold Room
Two electrowinning cells will be installed, one dedicated to electrodepositing ionized gold recovered from the CIL circuit and the other dedicated to ionized gold recovered from intensive leaching of the gravity concentrate.
Each cell will contain four cathodes and five anodes operating at 4.5 V to 6.0 V, with a current density ranging from 20 A/m² to 50 A/m² and a 200-amp rectifier.
The electrowinning process cycle is expected to occur over approximately 12 hours. Including filling and emptying of the column, the total desorption and electrowinning cycle is expected to be approximately 14 hours.
The resulting sludge will be filtered using a filter press. The filter cake will be dried in a drying oven, while the filtrate will be returned to the barren solution pump box within the refinery.
The dried filter cake will then be manually transferred to the electric smelting furnace, where gold doré bars will be produced and stored in a secure vault.
17.3.8 Tailings Storage Facility
To receive the tailings from the CIL circuit, a tailings storage facility (“TSF”) was designed to be constructed in five stages.
The geotechnical considerations, design description, and construction staging are described in Section 18.
17.3.9 Carbon Regeneration
Before regeneration, the eluted carbon will pass through a screen for dewatering and removal of fines.
Oversize carbon from the screen will discharge by gravity to the carbon regeneration kiln feed hopper. Screen undersize material, containing carbon fines and water, will drain by gravity into the carbon fines tank.
Regeneration will be carried out in a rotary kiln operating at a temperature of 700°C, at a rate of 75 kg/h, with a residence time of 20 minutes, 12.5% kiln filling, and an assumed thermal efficiency of 60%.
BNA Mining Solutions - R. Des. Leão Starling, 200 - Ouro Preto, BH - MG, 31310-370 – Phone: +55 (31) 2514-8733 – E-mail: info@bnaconsultoria.com
|
GoldMining Inc.
NI 43-101 Report – São Jorge Project
|
Page 226 |
Carbon discharge will occur into the quench tank containing cold water, which will also receive fresh carbon introduced into the process. From this tank, the carbon (fresh and regenerated) will be transferred by ejector to the final CIL tank, which will receive approximately 3 t of carbon daily.
17.3.10 Plant Services and Reagents
The system will comprise the receiving, preparation, storage, and dosing of reagents, as well as plant services including compressed air, potable water, process water, gland seal water, fresh water, and fire water systems.
Reagents consumed within the process plant will be prepared on site and distributed through dedicated handling and preparation systems. These reagents include sodium cyanide, hydrated lime, hydrochloric acid, sodium hydroxide, copper sulphate, antiscalant, flocculant, sodium metabisulphite, and activated carbon.
To manage potential reagent spills, reagent preparation and storage facilities will be located within containment areas designed to accommodate volumes greater than the contents of the largest storage tank. Where required, each reagent system will be located within an independent containment area to avoid mixing incompatible reagents and to facilitate reagent recovery.
Storage tanks will be equipped with level indicators, instrumentation, and alarms to reduce the risk of spills during normal operation. Appropriate ventilation, fire and safety protection systems, eyewash stations, safety showers, and Material Safety Data Sheet (“MSDS”) stations will be provided throughout the facilities. Sumps and sump pumps will also be installed for spill containment and recovery.
The reagents will be mixed, stored, and distributed to the ILR, thickening, CIL, acid wash, elution, and cyanide destruction circuits. Reagent dosages will be controlled through flow meters and control valves. Storage tank capacities will generally be designed to provide approximately one day of operating inventory.
Hydrated lime will be received in powder form and transferred pneumatically to one of two storage silos. One silo will feed the preparation tank while the second silo will remain available for storage or reagent receiving operations.
Based on an estimated consumption of 600 kg/h and a strategic storage requirement of one week, total storage capacity will be approximately 84 t, corresponding to two silos of approximately 52 m³ each.
The lime slurry will be prepared at 15% solids by weight for dosing to the pre-leach, CIL, and detoxification circuits. Preparation will be conducted daily, requiring preparation and dosing tanks with a total volume of approximately 76 m³, each with a diameter of 4.3 m and a height of 5.2 m, including a design factor of 1.2.
BNA Mining Solutions - R. Des. Leão Starling, 200 - Ouro Preto, BH - MG, 31310-370 – Phone: +55 (31) 2514-8733 – E-mail: info@bnaconsultoria.com
|
GoldMining Inc.
NI 43-101 Report – São Jorge Project
|
Page 227 |
Sodium cyanide (“NaCN”) will be received in briquette form in one-tonne bags, unloaded by forklift, and stored in a dedicated cyanide warehouse.
Based on an estimated consumption of approximately 150 kg/h and a strategic storage requirement of 30 days, storage capacity will be approximately 90 t.
NaCN solution will be prepared at 20% solids by weight for dosing. Preparation will be carried out daily, requiring preparation and dosing tanks with a volume of approximately 16 m³ each, with a diameter of 2.6 m and a height of 3.1 m, including a design factor of 1.2.
|
17.3.10.3
|
Sodium Hydroxide
|
Sodium hydroxide (“NaOH”) will be received in 50 kg bags, manually unloaded, and stored in the general reagent warehouse.
Based on an estimated consumption of approximately 125 kg/h and a strategic storage requirement of 30 days, storage capacity will be approximately 75 t.
NaOH solution will be prepared at 20% solids by weight for dosing. Preparation will be conducted daily, requiring preparation and dosing tanks with a volume of approximately 9.7 m³ each, with a diameter of 2.2 m and a height of 2.6 m, including a design factor of 1.2.
|
17.3.10.4
|
Hydrochloric Acid
|
Hydrochloric acid (“HCl”) will be received in 50 L drums at a concentration of 33% v/v, manually unloaded, and stored in the general reagent warehouse.
Based on an estimated consumption of approximately 270 kg/day (dry basis) and a strategic storage requirement of 30 days, storage capacity will be approximately 8.1 t.
HCl solution will be prepared at 3% concentration for dosing. The 33% HCl solution will be transferred from drums using a dedicated mobile pump. Preparation will be conducted daily, requiring preparation and dosing tanks with a volume of approximately 9.7 m³ each, with a diameter of 2.2 m and a height of 2.6 m, including a design factor of 1.2.
|
17.3.10.5
|
Copper Sulphate
|
Copper sulphate (“CuSO₄”) will be received in 25 kg bags, manually unloaded, and stored in the general reagent warehouse.
Based on an estimated consumption of approximately 48 kg/h and a strategic storage requirement of 30 days, storage capacity will be approximately 28 t.
BNA Mining Solutions - R. Des. Leão Starling, 200 - Ouro Preto, BH - MG, 31310-370 – Phone: +55 (31) 2514-8733 – E-mail: info@bnaconsultoria.com
|
GoldMining Inc.
NI 43-101 Report – São Jorge Project
|
Page 228 |
CuSO₄ solution will be prepared at 20% solids by weight for dosing. Preparation will be conducted daily, requiring preparation and dosing tanks with a volume of approximately 5 m³ each, with a diameter of 1.7 m and a height of 2.1 m, including a design factor of 1.2.
|
17.3.10.6
|
Sodium Metabisulphite
|
Sodium metabisulphite (“Na₂S₂O₅”) will be received in 25 kg bags, manually unloaded, and stored in the general reagent warehouse.
Based on an estimated consumption of approximately 150 kg/h and a strategic storage requirement of 30 days, storage capacity will be approximately 90 t.
Sodium metabisulphite solution will be prepared at 20% solids by weight for dosing. Preparation will be conducted daily, requiring preparation and dosing tanks with a volume of approximately 16 m³ each, with a diameter of 2.5 m and a height of 3.0 m, including a design factor of 1.2.
Flocculant will be received in powder form and prepared in mixing tanks using dilution water to achieve a concentration of approximately 0.5%, with slow agitation for approximately two hours. The prepared solution will then be stored and distributed to the thickening circuits.
Plant services will include an air supply system distributing compressed air for instrumentation, process services, and the CIL and pre-leach circuits. Instrument air will be dried prior to distribution.
The system will be designed considering five service points operating simultaneously for 15 seconds each, at a flow rate of approximately 1.3 m³/s per point.
The plant air compressors will also supply air to the oxygen generation circuit. The oxygen generation system will provide oxygen for the CIL and cyanide destruction circuits and will include an air dryer, pressure swing adsorption (“PSA”) oxygen generator, and oxygen receiver.
The air compressors may also bypass the oxygen generation circuit and feed the leaching circuit directly, if required.
|
17.3.10.9
|
Fresh Water and Gland Seal Water
|
Fresh water will be supplied to the fire suppression and gland seal water systems through a dedicated fire water tank. The tank will be partitioned, with the lower section reserved for fire water storage.
Water from this tank will be distributed throughout the process plant, including to the gland seal system. The gland seal system will also receive cooling water returning from the elution circuit heat exchanger.
BNA Mining Solutions - R. Des. Leão Starling, 200 - Ouro Preto, BH - MG, 31310-370 – Phone: +55 (31) 2514-8733 – E-mail: info@bnaconsultoria.com
|
GoldMining Inc.
NI 43-101 Report – São Jorge Project
|
Page 229 |
Potable water will be treated in a dedicated water treatment plant and distributed throughout the industrial area. A separate treatment plant is planned for the camp facilities.
Process water without cyanide, stored in dedicated tanks, will be used throughout the plant for slurry dilution and solids density adjustment.
Process water containing cyanide recovered from the cyanide destruction thickener overflow will be recycled back to the CIL circuit.
|
17.3.11
|
Metallurgical Control
|
Several sampling points are planned throughout the process plant to support metallurgical accounting and process control.
Metallurgical samplers will collect feed and tailings samples to support the preparation of metallurgical balances. Sampling points are planned at the cyclone overflow and CIL tailings streams.
Process control samplers will generate samples used to monitor unit operations within the process plant. Sampling locations are planned for leach feed, tailings, pregnant solution to electrowinning, and barren solution after electrowinning.
Within the comminution circuit, a weightometer is planned for installation on the stockpile feed conveyor, together with an additional weightometer on the ball mill feed conveyor.
|
17.4
|
Process Plant Consumption
|
Energy consumption was estimated based on preliminary equipment sizing. Table 17.3 summarizes the estimated annual power consumption based on installed capacity, is summarized in Table 17.3.
It was confirmed by Equatorial Energia that the projected power demand can be supplied.
Table 17.3 - Power Requirements
|
Description
|
Hours/year
|
Average Power (kW)
|
kWh/year
|
|
Crusher and Stockpile
|
5,694
|
687.10
|
3,912,347.40
|
|
Process Plant
|
7,709
|
6,936.00
|
53,469,624.00
|
|
Others
|
2,4
|
150.00
|
360,000.00
|
|
Total
|
57,741,971.40
|
BNA Mining Solutions - R. Des. Leão Starling, 200 - Ouro Preto, BH - MG, 31310-370 – Phone: +55 (31) 2514-8733 – E-mail: info@bnaconsultoria.com
|
GoldMining Inc.
NI 43-101 Report – São Jorge Project
|
Page 230 |
17.4.2 Water
The process water balance included estimates of all plant water requirements. Process plant make-up water demand was estimated at approximately 90 m³/h, sourced from the São Jorge River.
17.4.3 Reagents and Consumables
Reagent storage, mixing, and pumping facilities will be provided for all process reagents.
The estimated average reagent and consumable consumption rates are summarized in Table 17.4 and Table 17.5.
Table 17.4 - Reagents – Average
|
Reagent
|
Quantity
|
Unit
|
|
Sodium Cyanide (NaCN)
|
550
|
g/t
|
|
Sodium Hydroxide (NaOH)
|
1
|
g/cycle
|
|
Intensive Leaching Aid (LeachAid)
|
2.5
|
g/cycle
|
|
Activated Carbon
|
35
|
g/t
|
|
Hydrated Lime
|
1,83
|
g/t
|
|
Hydrochloric Acid 32% (HCl)
|
125
|
g/t
|
|
Sodium Metabisulphite (Na₂S₂O₅)
|
900
|
g/t
|
|
Copper Sulphate (CuSO₄)
|
400
|
g/t
|
|
Flocculant – Two Thickeners
|
40
|
g/t
|
Table 17.5 - Consumables – Average
|
Description
|
Quantity
|
Unit
|
|
Fixed Jaw – Jaw Crusher
|
12
|
sets/year
|
|
Movable Jaw – Jaw Crusher
|
8
|
sets/year
|
|
Grinding Media
|
7.5
|
g/t mineralized material
|
|
Mill Liners
|
1
|
set/year
|
|
Cone Crusher Wear Parts
|
6
|
sets/year
|
|
Screen Panels
|
2.5
|
sets/year
|
|
Interstage Screen Panels
|
2
|
sets/year
|
|
Cyclone Body
|
1
|
set/year
|
|
Cyclone Apex and Vortex
|
3.5
|
sets/year
|
17.4.4 Control Philosophy
The control philosophy will be conventional for a process plant of this type. Instrumentation will be provided throughout the plant to monitor and control key process parameters.
Main operational parameters, including feed rate, grinding circuit flow rates, and flows within the CIL and elution circuits, will be monitored through a Programmable Logic Controller (“PLC”) system.
BNA Mining Solutions - R. Des. Leão Starling, 200 - Ouro Preto, BH - MG, 31310-370 – Phone: +55 (31) 2514-8733 – E-mail: info@bnaconsultoria.com
|
GoldMining Inc.
NI 43-101 Report – São Jorge Project
|
Page 231 |
Instrumentation will also be installed to monitor operating pressure, tank levels, hopper levels, and other process variables.
Reagent preparation and dosing systems will also be monitored and controlled through the PLC system.
17.4.5 Workforce
It was established that the plant should operate on an 8 hour/shift, 3 shifts/day schedule, with 4 teams to handle the rotation.
The estimated process plant operational workforce is summarized in Table 17.6.
Table 17.6 - Process Plant Workforce
|
Item
|
SECTOR/POSITION
|
Total Shift 1
|
Total Shift 2
|
Total Shift 3
|
Shift Days Off
|
|
1
|
Process Plant
|
|
|
|
|
|
1.1
|
Plant manager
|
1
|
|
|
|
|
1.2
|
Senior Metallurgist
|
1
|
|
|
|
|
1.3
|
Plant Superintend
|
1
|
|
|
|
|
1.4
|
General Supervisor
|
1
|
0
|
0
|
0
|
|
1.5
|
Shift Supervisor
|
1
|
1
|
1
|
1
|
|
1.6
|
Control Room Operators
|
2
|
1
|
1
|
1
|
|
1.7
|
Crushing Operators
|
2
|
1
|
1
|
1
|
|
1.8
|
Process Plant Operators
|
3
|
3
|
3
|
3
|
|
1.9
|
Reagents Operators
|
2
|
2
|
2
|
2
|
|
1.10
|
General Helpers
|
2
|
2
|
2
|
2
|
|
1.11
|
Smelter and Refinery Supervisor
|
1
|
0
|
0
|
0
|
|
1.12
|
Smelter and Refinery Operators
|
2
|
0
|
0
|
0
|
|
1.13
|
Shipping and Receiving Operator
|
2
|
0
|
0
|
0
|
|
1.14
|
Driver- General Service
|
1
|
1
|
1
|
1
|
|
1.15
|
TOTAL
|
22
|
11
|
11
|
11
|
BNA Mining Solutions - R. Des. Leão Starling, 200 - Ouro Preto, BH - MG, 31310-370 – Phone: +55 (31) 2514-8733 – E-mail: info@bnaconsultoria.com
|
GoldMining Inc.
NI 43-101 Report – São Jorge Project
|
Page 232 |
|
18
|
Project Infrastructure
|
The infrastructure layout for the Project was developed based on the following information:
| |
●
|
Topographic surveys of the Project area, including orthophotos and aerial imagery;
|
| |
●
|
Cadastral surveys of the exploration areas to avoid construction over potentially mineralized zones;
|
| |
●
|
Information collected during technical site visits; and
|
| |
●
|
Engineering criteria aimed at minimizing environmental impacts and optimizing earthworks requirements.
|
The overall Project layout is presented in Figure 18.1.
BNA Mining Solutions - R. Des. Leão Starling, 200 - Ouro Preto, BH - MG, 31310-370 – Phone: +55 (31) 2514-8733 – E-mail: info@bnaconsultoria.com
|
GoldMining Inc.
NI 43-101 Report – São Jorge Project
|
Page 233 |
Figure 18.1 - General Site Layout
BNA Mining Solutions - R. Des. Leão Starling, 200 - Ouro Preto, BH - MG, 31310-370 – Phone: +55 (31) 2514-8733 – E-mail: info@bnaconsultoria.com
|
GoldMining Inc.
NI 43-101 Report – São Jorge Project
|
Page 234 |
18.2 Access Roads
The site road network will provide access between all major Project facilities, including the open pit, waste rock storage facility, tailings storage facility, process plant, administrative areas, and maintenance facilities.
The following access roads are planned:
| |
●
|
Road 1 – External Access Road: Access from the federal highway (BR-163) will utilize an existing road requiring rehabilitation. The distance from the highway to the Project entrance is approximately 3 km.
|
| |
●
|
Road 2 – Waste Storage Facility Access: Access to the waste rock storage facility will extend approximately 3.2 km. Part of the route will utilize rehabilitated existing roads, while the remaining section will be newly constructed.
|
| |
●
|
Road 3 – Tailings Storage Facility Access: A new 4.0 km access road will be constructed to the tailing’s storage facility.
|
| |
●
|
Road 4 – Pit Access Roads: Internal pit access roads totaling approximately 220 m and 700 m in length will be constructed.
|
| |
●
|
Road 5 – Explosives Magazine Access: A 500 m access road will be constructed to the explosive’s storage facility.
|
| |
●
|
Road 6 – Helipad Access: A 195 m access road will provide access to the helipad.
|
A gatehouse and security checkpoint will be installed at the entrance to the Project site at the end of Road 1.
Construction of two bridges is planned: one along Road 1 and another crossing the São Jorge River within the industrial area.
18.3 Camp Accommodations
An area of approximately 2,000 m² near the BR-163 federal highway was selected for construction of the camp accommodations.
The camp area will be located approximately 3.0 km from the industrial area.
The camp facilities are designed to accommodate approximately 135 personnel, including 15 staff accommodations. The planned built areas include:
| |
●
|
Accommodation facilities for 120 personnel (650 m²);
|
| |
●
|
Staff accommodations (150 m²);
|
| |
●
|
Recreation area (200 m²);
|
| |
●
|
Kitchen and laundry facilities (300 m²); and
|
| |
●
|
Camp office and medical centre (150 m²).
|
BNA Mining Solutions - R. Des. Leão Starling, 200 - Ouro Preto, BH - MG, 31310-370 – Phone: +55 (31) 2514-8733 – E-mail: info@bnaconsultoria.com
|
GoldMining Inc.
NI 43-101 Report – São Jorge Project
|
Page 235 |
|
18.4
|
Support Infrastructure – Mine, Process Plant, and Administrative Area
|
|
18.4.1.1
|
Mine Infrastructure
|
The mining infrastructure will include:
| |
●
|
An open pit mine with internal haul roads;
|
| |
●
|
One waste rock storage facility with total storage capacity of approximately 46.44 Mt of waste material;
|
| |
●
|
Maintenance workshop for heavy and light mobile equipment (800 m²);
|
| |
●
|
Heavy vehicle wash bay;
|
| |
●
|
Fuel storage station with storage capacity of approximately 60,000 L, equivalent to approximately 10 days of operation; and
|
| |
●
|
Explosives storage facility consisting of two magazines with approximately 30 days of storage capacity.
|
|
18.4.1.2
|
Administrative Area
|
The administrative area will include:
| |
●
|
Offices for administration, mine management, engineering, geology, and general and administrative (“G&A”) functions (400 m²);
|
| |
●
|
Change rooms and restrooms (250 m²);
|
| |
●
|
Cafeteria facilities with capacity for approximately 150 personnel, supplied by the camp kitchen (250 m²);
|
| |
●
|
Reception and gatehouse facilities (60 m²);
|
| |
●
|
Warehouse (200 m²) and laydown area (300 m²);
|
| |
●
|
Assay laboratory for exploration, grade control, and metallurgical samples (700 m²);
|
| |
●
|
Solid and hazardous waste management facilities; and
|
|
18.4.1.3
|
Process Plant Infrastructure
|
The process plant infrastructure will include equipment and facilities for:
| |
●
|
Comminution;
|
| |
●
|
Gravity concentration and intensive leaching;
|
| |
●
|
Concentrate leaching and carbon in leach processing;
|
| |
●
|
Carbon handling systems;
|
| |
●
|
Gold room operations;
|
| |
●
|
Cyanide destruction;
|
| |
●
|
Tailings pumping systems;
|
| |
●
|
Reagents; and
|
| |
●
|
Industrial Water.
|
BNA Mining Solutions - R. Des. Leão Starling, 200 - Ouro Preto, BH - MG, 31310-370 – Phone: +55 (31) 2514-8733 – E-mail: info@bnaconsultoria.com
|
GoldMining Inc.
NI 43-101 Report – São Jorge Project
|
Page 236 |
Supporting services will include compressed air, oxygen, and process water systems.
Separate facilities are planned for reagent storage and preparation, as well as a dedicated maintenance workshop for the process plant.
18.5 Power Supply and Distribution
The electrical system is planned to include:
| |
●
|
A 3.5 km, 138 kV primary transmission line interconnected to the SE Novo Progresso high-voltage substation;
|
| |
●
|
Main site substation including metering and a 138/13.8 kV main transformer;
|
| |
●
|
Site-wide power distribution system including 13.8/440 V transformers and two electrical centres for the crushing and process plant areas;
|
| |
●
|
Electrical distribution systems for Process Plant;
|
| |
●
|
Emergency backup power provided by two 0.75 MW generators; and
|
| |
●
|
Electrical distribution systems for camp facilities.
|
18.6 Water Infrastructure
A pumping station located on the São Jorge River will supply up to 180 m³/h of raw water for Project operations.
Raw water will be pumped to an industrial water reservoir, with the lower section allocated for firewater storage. Water from the São Jorge River will be treated for industrial use, while a portion will receive additional treatment for potable consumption.
|
18.6.1.1
|
Industrial and Fire Water
|
The industrial water reservoir will include a dedicated firewater storage compartment.
Firewater will be distributed through a pumping system equipped with electric and diesel-driven pumps supplying hydrants throughout the process plant area.
Industrial water will be distributed to the site and process plant through the industrial reservoir and associated process plant storage tanks.
|
18.6.1.2
|
Raw Water Treatment
|
Raw water treatment will include removal of suspended solids and pH adjustment prior to distribution to the process plant and administrative facilities.
|
18.6.1.3
|
Sewage Treatment and Oil-Water Separation
|
Two sewage treatment plants are planned to treat effluents generated from the process plant and camp facilities.
BNA Mining Solutions - R. Des. Leão Starling, 200 - Ouro Preto, BH - MG, 31310-370 – Phone: +55 (31) 2514-8733 – E-mail: info@bnaconsultoria.com
|
GoldMining Inc.
NI 43-101 Report – São Jorge Project
|
Page 237 |
Domestic sewage will be collected through conventional septic systems and treated using biological treatment systems prior to discharge.
Potable water supply for the camp facilities is planned to be sourced from artesian wells.
Water will be treated in a dedicated potable water treatment plant located within the camp area.
An additional potable water treatment system will also be installed to supply the process plant and administrative areas.
|
18.7
|
Tailings Disposal System
|
|
18.7.1
|
Geological-Geotechnical Studies
|
The geotechnical parameters adopted for the tailings storage facility are considered preliminary and appropriate for a Preliminary Economic Assessment level study.
At this stage, no site specific geotechnical investigation has been completed for the dam materials or tailings. Therefore, the parameters have been developed based on published literature, analogy with similar materials, and the application of conservative engineering assumptions.
This approach is considered reasonable for the purposes of conceptual design and stability assessment; however, additional geotechnical investigations and laboratory testing will be required to support future study phases.
The definition of geotechnical parameters for the dam embankment and tailings materials was based on the use of established literature references, analogy with similar materials, and the application of conservative assumptions consistent with the current level of study.
Embankment Material (c’ = 17 kPa; φ’ = 28°; γ = 19 kN/m³)
The embankment material, as modelled, represents a compacted material with a significant fines content (likely a clayey-silty soil or a mixture with residual material), whose behaviour is governed by a combination of effective cohesion and friction.
The adopted cohesion value (17 kPa) falls within the typical range for medium consistency soils used in compacted embankments, as reported by Karl Terzaghi, Ralph B. Peck and Gholamreza Mesri (1996), who indicate typical values between 10 and 30 kPa for compacted clayey soils. This value reflects a material with some structure and cohesive strength, without overestimating behaviour under saturated conditions.
BNA Mining Solutions - R. Des. Leão Starling, 200 - Ouro Preto, BH - MG, 31310-370 – Phone: +55 (31) 2514-8733 – E-mail: info@bnaconsultoria.com
|
GoldMining Inc.
NI 43-101 Report – São Jorge Project
|
Page 238 |
The friction angle (φ’ = 28°) was selected based on typical values for compacted fine- to intermediate-grained soils, as described by Braja M. Das (2010), who reports values ranging between 25° and 30° for such materials. This value is consistent with homogeneous embankment materials or transition zones with a predominance of fines and is considered representative for global stability analyses.
The unit weight (γ = 19 kN/m³) was defined based on typical values for compacted soils in embankment construction, according to guidelines from the U.S. Army Corps of Engineers (EM 1110-2-1902), which indicate values between 18 and 21 kN/m³. This value is consistent with materials compacted to an adequate degree and near optimum moisture content.
Overall, the adopted parameters represent a material with intermediate behaviour, with a significant contribution from cohesion, and are considered consistent with embankments constructed using locally available compacted soils.
Tailings (c’ = 2 kPa; φ’ = 30°; γ = 18 kN/m³)
The tailings were modelled as a predominantly fine-grained granular material (silty-sandy), with low cohesion and shear strength governed primarily by interparticle friction.
The adopted cohesion value (2 kPa) represents a very low apparent cohesion, consistent with non-cemented materials, and may be associated with suction effects or slight initial structuring. This approach is commonly applied to tailings materials, as discussed by David G. Fredlund and Harianto Rahardjo (1993), particularly under partially saturated conditions.
The friction angle (φ’ = 30°) was selected based on typical values for silty-sandy tailings, as reported in tailings dam and mining literature, including compilations from the International Commission on Large Dams, which indicate values generally ranging between 28° and 34°, depending on grain size distribution and relative density. This value is representative of a material with predominantly frictional behaviour, without assuming high density conditions.
The unit weight (γ = 18 kN/m³) is consistent with typical values for deposited tailings, as reported in technical guidance from the U.S. Army Corps of Engineers and mining engineering literature, which typically indicate values between 16 and 20 kN/m³. This value reflects a material with a loose to moderately dense structure, commonly observed in hydraulically deposited tailings.
|
18.7.1.2
|
General Considerations
|
The parameters adopted for both the embankment and the tailings are consistent with widely accepted values in technical literature and engineering practice.
As with other materials considered in this study, a conservative approach has been applied. This is particularly important at this stage, where uncertainties remain regarding material variability, construction methods, and saturation conditions.
BNA Mining Solutions - R. Des. Leão Starling, 200 - Ouro Preto, BH - MG, 31310-370 – Phone: +55 (31) 2514-8733 – E-mail: info@bnaconsultoria.com
|
GoldMining Inc.
NI 43-101 Report – São Jorge Project
|
Page 239 |
This approach is considered appropriate for a PEA level assessment and ensures that stability analyses are conducted with adequate margins of safety, without overestimating the geotechnical performance of the materials involved.
18.7.2 Design Description
The Tailings Storage Facility (“TSF”) will be constructed to receive the tailings generated by the process plant following cyanide detoxification. The tailings transport system, consisting of a pumping pipeline with an estimated length of approximately 4 km, will be further evaluated during subsequent engineering phases. This section presents the preliminary studies and design criteria adopted for the TSF.
The detailed TSF design, including the selected construction methodology, will be developed during the next phase of project advancement.
The TSF will be constructed in six stages, corresponding to the planned tailings deposition schedule. Initial site preparation and construction activities will commence in Year -1, with the starter embankment scheduled for completion in Year 0.
Six progressive TSF development stages were considered, reflecting the planned advancement of tailings deposition throughout the Life of Mine (“LOM”):
| |
●
|
Year 0 – Starter embankment (20% of total storage capacity);
|
| |
●
|
Year 2 – Expansion to 30% of total storage capacity;
|
| |
●
|
Year 3 – Expansion to 40% of total storage capacity;
|
| |
●
|
Year 4 – Expansion to 50% of total storage capacity;
|
| |
●
|
Year 5 – Expansion to 75% of total storage capacity;
|
| |
●
|
Year 9 – Final embankment configuration (100% of total storage capacity).
|
The TSF storage capacity was designed to accommodate the total volume of tailings expected to be generated over the approximately 11 year operating period.
The total storage volume is estimated at approximately 45.85 million cubic metres.
18.7.3 Geotechnical Considerations
The tailings storage facility of the São Jorge Project, located in Novo Progresso (Pará, Brazil), was evaluated using a single representative geological-geotechnical section considered conservative and representative of the highest embankment condition currently envisaged for the Project, was adopted for the preliminary analyses. This section was defined in the region of maximum embankment height, oriented as perpendicular as possible to the geometry of the embankment slopes, as illustrated in Figure 18.2.
BNA Mining Solutions - R. Des. Leão Starling, 200 - Ouro Preto, BH - MG, 31310-370 – Phone: +55 (31) 2514-8733 – E-mail: info@bnaconsultoria.com
|
GoldMining Inc.
NI 43-101 Report – São Jorge Project
|
Page 240 |
Figure 18.2 - Geological–Geotechnical Section of the Dam Including Staged Raises
This section incorporates the same foundation conditions for all analysed scenarios, consisting of residual soil and saprolite derived from monzogranite and syenite. A mandatory removal of 1 metre of superficial material (organic soil and low-strength residual soil) was assumed to ensure direct contact with more competent foundation material.
As previously described, six stages of TSF development were considered, reflecting the progressive deposition of tailings over the life of the Project.
Table 18.1 shows the evolution of costs due to dam advancements over time.
BNA Mining Solutions - R. Des. Leão Starling, 200 - Ouro Preto, BH - MG, 31310-370 – Phone: +55 (31) 2514-8733 – E-mail: info@bnaconsultoria.com
|
GoldMining Inc.
NI 43-101 Report – São Jorge Project
|
Page 241 |
Table 18.1 – Evolution of Costs Throughout the Construction of the Dam.
|
YEAR
|
0 (20%)
|
2 (10%)
|
3 (10%)
|
4 (10%)
|
5 (25%)
|
9 (25%)
|
Total
|
|
Volume
|
508,872
|
227,442
|
263,662
|
247,082
|
558,743
|
611,910
|
2,417,711
|
|
Elevation
|
216.84
|
225
|
228.13
|
231.25
|
235
|
241
|
|
|
Height
|
16.95
|
25.44
|
28.62
|
31.75
|
36.51
|
42.92
|
|
|
Unit Cost (USD$ /m³) – Excavation
|
$3.40
|
|
|
|
|
|
|
|
Unit Cost (USD$ /m³) – Excavation Haulage
|
$0.94
|
|
|
|
|
|
|
|
Total Unit Cost (USD$ /m³) – Excavation
|
$4.34
|
$4.34
|
$4.34
|
$4.34
|
$4.34
|
$4.34
|
|
|
Unit Cost (USD$ /m³) – Fill (Including Compaction)
|
$5.28
|
$5.28
|
$5.28
|
$5.28
|
$5.28
|
$5.28
|
|
|
Excavation – 40%
|
203,548.80
|
90,976.80
|
105,464.80
|
98,832.80
|
223,497.20
|
244,764.00
|
|
|
Fill – 60%
|
305,323.20
|
136,465.20
|
158,197.20
|
148,249.20
|
335,245.80
|
367,146.00
|
|
|
Total Cost – Excavation (USD$)
|
$883,324.98
|
$394,804.98
|
$457,677.43
|
$428,897.06
|
$969,893.51
|
$1,062,183.40
|
|
|
Total Cost – Fill (USD$)
|
$1,613,028.23
|
$720,948.23
|
$835,758.79
|
$783,203.32
|
$1,771,109.89
|
$1,939,639.25
|
|
|
Total Cost
|
$2,496,353.21
|
$1,115,753.21
|
$1,293,436.23
|
$1,212,100.38
|
$2,741,003.40
|
$3,001,822.64
|
$11,860,469.06
|
BNA Mining Solutions - R. Des. Leão Starling, 200 - Ouro Preto, BH - MG, 31310-370 – Phone: +55 (31) 2514-8733 – E-mail: info@bnaconsultoria.com
|
GoldMining Inc.
NI 43-101 Report – São Jorge Project
|
Page 242 |
For the starter dyke, specific end of construction stability analyses were performed, evaluating both upstream and downstream slopes. For the subsequent stages (Year 2 to Year 9), long-term (steady-state) conditions were analysed, considering drained conditions and the consolidated behaviour of the embankment.
All stability analyses were carried out using limit equilibrium methods (Morgenstern-Price and Spencer) in the Slide software, adopting Mohr-Coulomb and Hoek-Brown strength parameters calibrated for the materials involved.
The results obtained demonstrated compliance with the applicable technical standards (ABNT NBR 13.028 – Tailings Dams and ABNT NBR 13.030 – Design Criteria). The adopted approach is also generally consistent with conceptual-level practices commonly applied in international mining projects and guidance from organizations such as ICOLD and CDA. The following actions are recommended as essential for the detailed design and permitting of the dam:
| |
●
|
Systematic removal of 1 meter of superficial soil across the entire dam foundation area;
|
| |
●
|
A complementary geotechnical investigation campaign, including drilling for characterization of the foundation and the dam embankment, totaling approximately 750 meters of drilling;
|
| |
●
|
Implementation of a Geotechnical Instrumentation Plan with 16 instruments (mainly piezometers – PZ), strategically distributed along the dam axis, in the embankment and in the foundation, for continuous monitoring of pore pressures, displacements, and behavior of the structure;
|
| |
●
|
For all stability analyses carried out in this study, both using the limit equilibrium method and in the specific evaluations of the tailings dam, a minimum freeboard of 1.0 meter above the dam crest was considered, in accordance with the operational and safety conditions provided;
|
| |
●
|
Additionally, the seismic accelerations defined by Eletrobras (2020) for the Novo Progresso region (Pará) were adopted, using the peak ground acceleration (“PGA”) values recommended for the São Jorge Project site, both for the operational seismic event and for the maximum considered earthquake (“MCE”). This seismic assumption was applied consistently across all analyzed sections and evolutionary stages, ensuring that the factors of safety obtained meet the requirements of the applicable Brazilian standards (ABNT NBR 13.028 and ABNT NBR 13.030), even under dynamic conditions.
|
The results of these investigations and tests will allow refinement of the geotechnical parameters and updating of the stability models, ensuring the safety and performance of the tailings dam throughout the entire life of the São Jorge Project, as shown in Table 18.2.
BNA Mining Solutions - R. Des. Leão Starling, 200 - Ouro Preto, BH - MG, 31310-370 – Phone: +55 (31) 2514-8733 – E-mail: info@bnaconsultoria.com
|
GoldMining Inc.
NI 43-101 Report – São Jorge Project
|
Page 243 |
Table 18.2 - Safety factor summary.
|
Scenario
|
Description
|
FS
|
|
C1 Upstream Slope
|
Starter Dyke
|
2.8
|
|
C1 Downstream Slope
|
Starter Dyke
|
1.9
|
|
C1 Full Reservoir
|
Starter Dyke
|
2.9
|
|
C1 Critical Drawdown
|
Starter Dyke
|
2.9
|
|
C2
|
Year 2
|
2.1
|
|
C3
|
Year 3
|
2
|
|
C4
|
Year 4
|
1.8
|
|
C5
|
Year 5
|
1.9
|
|
C6
|
Year 9
|
1.7
|
During all construction stages of the tailings dam embankment of the São Jorge Project, a rigorous Construction Quality Control and Quality Assurance Programme for the placed material shall be implemented, with the objective of ensuring that the geotechnical parameters adopted in the design models (unit weight, cohesion, friction angle, and permeability) are effectively achieved in the field.
This programme will include the systematic execution of the tests specified in the detailed design, such as grain size distribution and Atterberg limits tests, Standard and Modified Proctor tests for compaction control, triaxial tests CD and UU, determination of natural and saturated unit weight, permeability tests, and, where applicable, unconfined compression tests. The controls shall be carried out at a frequency defined by the applicable standard (ABNT NBR 13.028, ICOLD and CDA) and project technical specifications, including representative sampling of borrow material, verification of layer-by-layer compaction (minimum degree of compaction of 95–98% of Modified Proctor), control of optimum moisture content, and continuous monitoring of fill quality.
Any significant deviation from the design parameters shall be immediately corrected, including the possibility of rejection of layers or recompaction, thereby ensuring the homogeneity, density, and expected mechanical behaviour of the embankment throughout its entire service life.
For the laboratory characterisation of the foundation and embankment materials (tailings and rockfill), the following tests shall be performed:
| |
●
|
Grain size distribution and Atterberg limits tests;
|
| |
●
|
Standard and Modified Proctor tests;
|
| |
●
|
Triaxial tests CD (“Consolidated Drained”) and UU (“Unconsolidated Undrained”);
|
| |
●
|
Unconfined compression tests (where applicable);
|
| |
●
|
Determination of natural and saturated unit weight;
|
| |
●
|
Permeability tests (constant and falling head).
|
To support the detailed design and ensure the safety of the São Jorge Project tailings dam, an integrated plan of complementary geotechnical investigations and instrumentation has been developed.
BNA Mining Solutions - R. Des. Leão Starling, 200 - Ouro Preto, BH - MG, 31310-370 – Phone: +55 (31) 2514-8733 – E-mail: info@bnaconsultoria.com
|
GoldMining Inc.
NI 43-101 Report – São Jorge Project
|
Page 244 |
The Geotechnical Investigation Plan predict the execution of approximately 16 boreholes (Figure 18.3), with the objective of providing detailed characterisation of the dam foundation, identifying lateral and vertical variations of residual soils and saprolite, determining the groundwater level, and obtaining samples for laboratory characterisation testing (grain size distribution, Atterberg limits, Proctor, triaxial CD and UU, permeability, among others).
Figure 18.3 - Initial investigation plan for foundation characterization
Complementarily, a Geotechnical Instrumentation Plan has been developed, which includes the installation of 16 instruments, predominantly piezometers (“PZ”), strategically distributed along the dam axis, within the embankment, the foundation, and the transition zones.
This set of instruments will enable continuous monitoring of pore pressures, displacements, and the hydro-mechanical behaviour of the structure throughout its service life, allowing periodic verification and ongoing assessment of stability conditions of stability conditions and the early implementation of corrective measures, if required.
Figure 18.4 illustrates the preliminary layout proposed for the foundation geotechnical investigations and the final arrangement of the tailings dam monitoring instruments.
BNA Mining Solutions - R. Des. Leão Starling, 200 - Ouro Preto, BH - MG, 31310-370 – Phone: +55 (31) 2514-8733 – E-mail: info@bnaconsultoria.com
|
GoldMining Inc.
NI 43-101 Report – São Jorge Project
|
Page 245 |
Figure 18.4 - Initial Instrumentation Plan
|
18.7.3.1
|
Final Considerations – Tailings Storage Facility
|
The present study constitutes a preliminary integrated geotechnical assessment, at a conceptual level, of the tailings storage facility (“TSF”) of the São Jorge Project, based on available data, limited field validation, and conservative assumptions consistent with this stage of project development.
The results of the analyses carried out for the different construction stages of the TSF indicate that the proposed embankment geometries present satisfactory stability conditions, with factors of safety consistent with the minimum values commonly adopted in geotechnical practice and in accordance with applicable standards and guidelines.
For the tailings dam, the analyses performed for the various construction stages indicate adequate factors of safety, consistent with the criteria of ABNT NBR 13.028, NBR 13.030, ICDOL and CDA, even under conservative conditions and including seismic loading based on recommendations from Eletrobras (Brazil). The construction arrangement, combined with rigorous quality control and the proposed instrumentation plan, indicates that the structure is preliminarily considered capable of achieving acceptable safety and performance conditions throughout its operational life, subject to confirmation through future investigation, detailed design, and ongoing monitoring.
It should be noted that, as this is a PEA level study, there are inherent limitations associated with the level of detail available, including:
| |
●
|
Partial reliance on secondary data and pre-existing geological models;
|
| |
●
|
Absence of extensive laboratory testing programmes for all materials;
|
BNA Mining Solutions - R. Des. Leão Starling, 200 - Ouro Preto, BH - MG, 31310-370 – Phone: +55 (31) 2514-8733 – E-mail: info@bnaconsultoria.com
|
GoldMining Inc.
NI 43-101 Report – São Jorge Project
|
Page 246 |
| |
●
|
Limited understanding of local hydrogeological conditions;
|
| |
●
|
Simplifications adopted in the stability analyses, consistent with the conceptual level of the study.
|
Accordingly, the following steps are recommended to support the advancement of the project:
| |
●
|
Execution of additional geotechnical investigation programmes (drilling, laboratory testing, and detailed material characterisation);
|
| |
●
|
Refinement of the geomechanical parameters based on project-specific data;
|
| |
●
|
Development of a representative hydrogeological model;
|
| |
●
|
Advancement of the detailed engineering design of the TSF;
|
| |
●
|
Implementation and operation of a robust geotechnical instrumentation and monitoring system;
|
| |
●
|
Continuous updating of the stability models based on actual field data.
|
In summary, the present study indicates that, from a geotechnical perspective, the tailings storage facility of the São Jorge Project presents favourable conditions for implementation at a pre-conceptual level, with technically viable solutions, manageable risks, and alignment with good engineering practice. The continuation of the project should be based on the progressive improvement of geotechnical knowledge and active risk management throughout the subsequent phases (PFS and FS), ensuring the safety and reliability of the structure. Tailings geotechnical behaviour may vary depending on future processing characteristics, grain size distribution, deposition methodology, and operational water management practices, which should be further evaluated in subsequent project phases.
Detailed evaluation of static and seismic liquefaction susceptibility was beyond the scope of the current PEA level assessment and should be addressed during future geotechnical investigation and detailed design stages.
18.8 Site Personnel and Support Services
Operation of the São Jorge Project will require personnel associated with administration, maintenance, laboratory services, environmental management, camp operations, security, and other support functions. These personnel provide the services necessary to support mining and processing operations and maintain site infrastructure. The estimated workforce requirements are summarized in Table 18.3.
BNA Mining Solutions - R. Des. Leão Starling, 200 - Ouro Preto, BH - MG, 31310-370 – Phone: +55 (31) 2514-8733 – E-mail: info@bnaconsultoria.com
|
GoldMining Inc.
NI 43-101 Report – São Jorge Project
|
Page 247 |
Table 18.3 - Estimated Administration, Maintenance, Quality Control and Support Personnel Requirements
|
Item
|
SECTOR/POSITION
|
Total
Shift 1
|
Total
Shift 2
|
Total
Shift 3
|
Shift
Days Off
|
Total
Persons
|
|
2
|
Administration and support
|
|
|
|
|
|
| |
General Manager
|
1
|
|
|
|
1
|
| |
Administrative Manager
|
1
|
|
|
|
1
|
| |
Administrative Assistants
|
2
|
|
|
|
2
|
| |
HR Manager
|
1
|
|
|
|
1
|
| |
HR Assistants
|
2
|
|
|
|
2
|
| |
Supply Manager
|
1
|
|
|
|
1
|
| |
Buyers
|
3
|
|
|
|
3
|
| |
Driver for General Services
|
2
|
1
|
|
|
3
|
| |
Security Supervisor
|
1
|
|
|
|
1
|
| |
Security Technician
|
1
|
1
|
1
|
1
|
4
|
| |
IT Technician
|
1
|
|
|
|
1
|
| |
General Services Supervisor
|
1
|
|
|
|
1
|
| |
Cleaning Assistant
|
2
|
|
|
|
2
|
| |
Environmental Technician
|
1
|
|
|
|
1
|
| |
Environmental Assistant
|
2
|
|
|
|
2
|
| |
Occupational Physician (part-time)
|
1
|
|
|
|
1
|
| |
Nurse
|
1
|
1
|
|
|
2
|
| |
Sub total
|
24
|
3
|
1
|
1
|
29
|
|
3
|
Quality control
|
|
|
|
|
|
| |
Supervisor - Chemist
|
1
|
|
|
|
1
|
| |
Chemical Technicians
|
3
|
|
|
|
3
|
| |
Assistants
|
4
|
|
|
|
4
|
| |
Samplers
|
2
|
1
|
1
|
1
|
5
|
| |
Sub total
|
10
|
1
|
1
|
1
|
13
|
|
4
|
Mechanical/electrical maintenance
|
|
|
|
|
|
| |
Maintenance Manager
|
1
|
|
|
|
1
|
| |
Mechanical Supervisor
|
1
|
|
|
|
1
|
| |
Mechanical Technician - Light and Heavy Vehicles
|
3
|
|
|
|
3
|
| |
Mechanical Helper
|
2
|
2
|
2
|
1
|
7
|
| |
Welder
|
2
|
|
|
|
2
|
| |
Lubricator
|
2
|
1
|
1
|
1
|
5
|
| |
Tire Technician
|
2
|
|
|
|
2
|
| |
Tire Technician Helper
|
1
|
|
|
|
1
|
| |
Electrical and Instrumentation Supervisor
|
1
|
|
|
|
1
|
| |
Electrician Technician
|
2
|
|
|
|
2
|
| |
Automation Technician
|
1
|
|
|
|
1
|
| |
Electrician Helper
|
2
|
1
|
1
|
1
|
5
|
| |
Storekeeper
|
1
|
|
|
1
|
2
|
BNA Mining Solutions - R. Des. Leão Starling, 200 - Ouro Preto, BH - MG, 31310-370 – Phone: +55 (31) 2514-8733 – E-mail: info@bnaconsultoria.com
|
GoldMining Inc.
NI 43-101 Report – São Jorge Project
|
Page 248 |
|
Item
|
SECTOR/POSITION
|
Total
Shift 1
|
Total
Shift 2
|
Total
Shift 3
|
Shift
Days Off
|
Total
Persons
|
| |
Storekeeper Helper
|
2
|
1
|
1
|
1
|
5
|
| |
General Laborer
|
1
|
1
|
1
|
2
|
5
|
| |
Vehicle Driver
|
2
|
|
|
|
2
|
| |
Sub total
|
26
|
6
|
6
|
7
|
45
|
|
5
|
Camp / Kitchen
|
|
|
|
|
|
| |
Camp Manager
|
1
|
|
|
|
1
|
| |
Purchasing Assistant
|
1
|
|
|
|
1
|
| |
Bricklayer
|
1
|
|
|
|
1
|
| |
Carpenter
|
1
|
|
|
|
1
|
| |
General Services
|
1
|
1
|
1
|
1
|
4
|
| |
Laundry
|
2
|
|
|
|
2
|
| |
Canteen
|
1
|
|
|
|
1
|
| |
Cleaners
|
4
|
|
|
|
4
|
| |
Kitchen Manager
|
1
|
|
|
|
1
|
| |
Nutritionist
|
1
|
|
|
|
1
|
| |
Cooks
|
4
|
|
|
|
4
|
| |
Kitchen Assistants
|
4
|
2
|
2
|
2
|
10
|
| |
Drivers for General Services
|
2
|
|
|
|
2
|
| |
Sub total
|
24
|
3
|
3
|
3
|
33
|
BNA Mining Solutions - R. Des. Leão Starling, 200 - Ouro Preto, BH - MG, 31310-370 – Phone: +55 (31) 2514-8733 – E-mail: info@bnaconsultoria.com
|
GoldMining Inc.
NI 43-101 Report – São Jorge Project
|
Page 249 |
|
19
|
Market Studies and Contracts
|
Gold is a commodity that is freely traded on global markets at widely transparent prices, and as such, the sale of production is not expected to be constrained.
The gold price assumptions used in this report were provided by GMI and are based on analyst consensus forecasts. The selected prices are considered reasonable long-term assumptions, taking into account the anticipated Life of Mine (“LOM”) of the Project.
A gold price of US$ 2,500/oz was used for pit optimization purposes, while a price of US$ 3,500/oz was applied in the economic analysis.
No material uptake contracts are currently in place.
No external consultants or independent market studies were relied upon to support the sales assumptions used in this report. The Qualified Person (“QP”) considers the pricing assumptions and projections provided by GMI to be reasonable for a study at the PEA level.
BNA Mining Solutions - R. Des. Leão Starling, 200 - Ouro Preto, BH - MG, 31310-370 – Phone: +55 (31) 2514-8733 – E-mail: info@bnaconsultoria.com
|
GoldMining Inc.
NI 43-101 Report – São Jorge Project
|
Page 250 |
|
20
|
Environmental Studies, Permitting and Social or Community Impact
|
Environmental studies and permitting requirements for the Project have not yet been developed in detail and remain at a conceptual level, consistent with the project stage.
Based on the current understanding of the Project location and planned mining activities, no significant environmental or social constraints have been identified that would be expected to materially impact the development of the Project.
The company intends to initiate, in parallel with the PFS studies, the EIA/RIMA (Environmental Baseline Studies and reports) to submit to the SEMAS-PA, the environmental agency of Pará State, the application for the Preliminary License.
Closure costs have been estimated based on benchmarking with comparable projects at $12M (plus $3.0M contingency).
Additional permits that may be required for vegetation suppression, tailings dam construction, and water use will be submitted as needed as the PFS studies advance, in time for the issuance of the Installation Environmental Licence and the construction decision.
BNA Mining Solutions - R. Des. Leão Starling, 200 - Ouro Preto, BH - MG, 31310-370 – Phone: +55 (31) 2514-8733 – E-mail: info@bnaconsultoria.com
|
GoldMining Inc.
NI 43-101 Report – São Jorge Project
|
Page 251 |
|
21
|
Capital and Operating Costs
|
This chapter presents the economic analysis of the São Jorge Project, based on the Mineral Resources defined in this report and the mine plan developed under the assumptions of a preliminary economic assessment.
The objective of this chapter is to evaluate the potential economic viability of the Project through the estimation of capital and operating costs, production schedules, and cash flow projections. The analysis incorporates technical parameters derived from preceding sections, including mining, processing, infrastructure, and environmental considerations.
The economic evaluation has been conducted using standard industry methodologies and reflects the level of confidence associated with a PEA study. As such, it is based on Inferred and Indicated Mineral Resources, which are considered too speculative geologically to have the economic considerations applied to them that would enable them to be categorized as Mineral Reserves.
Key assumptions adopted in the analysis include commodity prices, exchange rates, metallurgical recoveries, and cost estimates, all of which are considered reasonable for the level of study but are subject to uncertainties inherent to early-stage evaluations.
The results presented herein are intended to provide an initial indication of the Project’s economic potential and to support further technical and economic studies.
The Project's technical team has prepared an estimate of the capital expenditures required to support the development and operation of the mining and processing facilities for the São Jorge Project.
The capital cost estimate has been developed to a level of accuracy consistent with a Preliminary Economic Assessment and is based on conceptual engineering, preliminary layouts, and benchmark data, where applicable. As such, the estimate is subject to a higher degree of uncertainty than estimates prepared at more advanced levels of study.
The Project's Life of Mine (“LOM”) capital costs are estimated at a total of US$ 267.2 million and consist of the following three distinct phases:
| |
●
|
Initial Capital Expenditure – This phase includes all costs associated with the development of the Project over a two year period (Year -1 and Year 0), including engineering and design, early works, infrastructure development, procurement of mining and process plant equipment, construction, pre-production activities, and commissioning. Initial capital costs are estimated at US$ 202.2 million.
|
| |
●
|
Sustaining Capital Expenditure – This phase includes all costs related to the acquisition, replacement, major refurbishment, or upgrade of assets required to sustain operations throughout the mine life. Sustaining capital expenditures are incurred during the 11 years of operation (Year 1 to Year 11) and include the costs associated with the staged construction and raising of the Tailings Storage Facility (TSF) embankments. Sustaining capital costs are estimated at US$ 53.0 million.
|
BNA Mining Solutions - R. Des. Leão Starling, 200 - Ouro Preto, BH - MG, 31310-370 – Phone: +55 (31) 2514-8733 – E-mail: info@bnaconsultoria.com
|
GoldMining Inc.
NI 43-101 Report – São Jorge Project
|
Page 252 |
| |
●
|
Closure Costs – This phase includes all costs associated with mine closure, reclamation, and post-closure monitoring activities. Closure activities commence in Year 10 and continue through Year 13, for a total period of four years. Closure costs are estimated at US$ 12.0 million.
|
The capital cost estimate includes, but is not limited to, the following major components:
| |
●
|
Mine development and pre-stripping activities;
|
| |
●
|
Process plant construction and associated infrastructure;
|
| |
●
|
Tailings Storage Facility (“TSF”) and water management systems;
|
| |
●
|
Site infrastructure, including access roads, power supply, and support facilities;
|
| |
●
|
Owner's costs, engineering, procurement, and construction management (“EPCM”);
|
| |
●
|
Contingency allowances appropriate for the level of study, estimated at 25% of total capital costs.
|
Where appropriate, the estimate incorporates information obtained from equipment suppliers, contractor quotations, and industry cost databases, adjusted for site location, logistics, and project-specific conditions.
Further details regarding the capital cost assumptions, methodology, and cost breakdown are provided in the following sections.
The estimate is based on first-quarter 2026 pricing, with a foreign exchange rate of US$ 1.00 = R$ 5.30.
21.1.1 CAPEX Summary
The initial capital cost estimate for the São Jorge Project was developed to a level of accuracy consistent with a Preliminary Economic Assessment. The estimate is based on conceptual engineering, preliminary equipment sizing, site layouts, budget quotations, and benchmark data from comparable mining and mineral processing projects.
Initial capital expenditures are distributed between Year -1 and Year 0 and include mining equipment, mine development, Site General & Pre-Construction costs, power supply and distribution systems, process plant construction, tailings management facilities, water management infrastructure, engineering and construction services, and pre-production activities.
The largest capital component is the process plant, representing approximately US$ 47.0 million, followed by general and engineering services (US$ 26.5 million), site general & pre-construction costs (US$ 33.0 million), and power supply and automation infrastructure (US$ 16.8 million).
The direct capital cost is estimated at US$ 139.4 million. In addition, indirect costs and owner's costs, each estimated at 10% of the direct capital cost, amount to US$ 13.9 million each. A contingency allowance of US$ 34.9 million, equivalent to 25% of the direct capital cost, was applied to reflect the level of confidence associated with the current stage of project development.
BNA Mining Solutions - R. Des. Leão Starling, 200 - Ouro Preto, BH - MG, 31310-370 – Phone: +55 (31) 2514-8733 – E-mail: info@bnaconsultoria.com
|
GoldMining Inc.
NI 43-101 Report – São Jorge Project
|
Page 253 |
The total initial capital expenditure for the São Jorge Project is estimated at approximately US$ 202.2 million, as summarized in Table 21.1.
Table 21.1 - Summary of Initial Capital Cost Estimate
|
Description
|
CAPEX (US$ x 1,000)
|
|
-1
|
0
|
Total
|
|
Mining Equipment
|
|
8,639
|
8,639
|
|
Mine Preparation and Development
|
|
866
|
866
|
|
Site General & Pre-Construction
|
20,551
|
12,465
|
33,016
|
|
Power Line- Electrical and Automation
|
418
|
16,390
|
16,807
|
|
Processing Plant
|
2,656
|
44,344
|
47,000
|
|
Tailings Dam
|
142
|
2,496
|
2,638
|
|
Water Management
|
-
|
1,828
|
1,828
|
|
General Services and Engineering Services
|
3,422
|
23,115
|
26,537
|
|
Pre-production, Start-up and First Fill
|
-
|
2,104
|
2,104
|
|
Sub-total 1
|
27,189
|
112,246
|
139,435
|
|
Indirect Costs
|
10%
|
2,719
|
11,225
|
13,944
|
|
Owner Costs
|
10%
|
2,719
|
11,225
|
13,944
|
|
Contingency
|
25%
|
6,797
|
28,062
|
34,859
|
|
TOTAL CAPEX
|
39,424
|
162,757
|
202,181
|
21.1.2 Preliminary Initial Capital
These costs were estimated based on benchmark data from similar projects and preliminary budget quotations.
The estimate includes the costs associated with the construction of the infrastructure required to support project development, as well as expenditures related to permitting, technical studies, engineering, and preliminary design activities.
The Preliminary Investments capital cost estimate is summarized in Table 21.2.
BNA Mining Solutions - R. Des. Leão Starling, 200 - Ouro Preto, BH - MG, 31310-370 – Phone: +55 (31) 2514-8733 – E-mail: info@bnaconsultoria.com
|
GoldMining Inc.
NI 43-101 Report – São Jorge Project
|
Page 254 |
Table 21.2 - Preliminary Initial Capital
|
ITEM
|
YEAR -1
|
YEAR 0
|
|
US$ M
|
US$M
|
|
1
|
Preliminary Investments - TOTAL
|
1,886.79
|
6,403.21
|
|
1.1
|
Licenses - ANM and Environmental
|
1,886.79
|
943.40
|
|
1.2
|
Construction Offices, Auxiliary Services, Temporary Containers Shops
|
|
45.28
|
|
1.3
|
Shops and Construction Equipment & Tools - Storage facilities
|
|
235.85
|
|
1.4
|
Energy for Construction - Generator and distribution
|
|
141.51
|
|
1.5
|
Temporary Warehouse
|
|
41.51
|
|
1.6
|
Compensation for environmental licensing
|
|
1,000.00
|
|
1.7
|
Others, preliminary studies
|
|
3,995.66
|
21.1.3 Mining
|
21.1.3.1
|
Initial Investment in Mining Equipment
|
The initial investment in mining equipment was estimated based on the defined initial fleet, using informal market quotations and reference data from the BNA database.
A provision equivalent to 10% of the total equipment cost was included for the acquisition of an initial inventory of spare parts.
Table 21.3 presents the estimate of the initial investment in mining equipment.
Table 21.3 - Initial Investment in Mining Equipment
|
Item
|
Unit Cost
|
Fleet Size
|
MINING
EQUIPMENT
CAPITAL COST
|
|
(US$ x 1,000)
|
(#)
|
(US$ x 1,000)
|
|
Hydraulic Drill
|
533
|
1
|
533
|
|
Hydraulic Excavator Waste
|
415
|
1
|
415
|
|
Hydraulic Excavator Ore
|
377
|
1
|
377
|
|
Haul Truck Waste
|
259
|
9
|
2,331
|
|
Haul Truck Ore
|
236
|
4
|
943
|
|
Crawler Dozer
|
340
|
1
|
340
|
|
Crawler Dozer (Additional)
|
317
|
1
|
317
|
|
Wheel Loader (Auxiliary)
|
208
|
3
|
623
|
|
Water Truck
|
245
|
3
|
735
|
|
Motor Grader
|
217
|
1
|
217
|
|
Lighting Tower (Diesel)
|
11
|
9
|
103
|
|
Service Truck
|
224
|
1
|
224
|
|
Backhoe
|
85
|
2
|
170
|
|
Crane Truck
|
258
|
1
|
258
|
|
Utility Vehicle (Pick-up)
|
54
|
5
|
268
|
|
Sub-total 1
|
|
7,853
|
|
Spare Parts (10%)
|
10%
|
|
785
|
|
Total Mining Capital Cost
|
|
8,639
|
BNA Mining Solutions - R. Des. Leão Starling, 200 - Ouro Preto, BH - MG, 31310-370 – Phone: +55 (31) 2514-8733 – E-mail: info@bnaconsultoria.com
|
GoldMining Inc.
NI 43-101 Report – São Jorge Project
|
Page 255 |
|
21.1.3.2
|
Pre-Production Mining Capital
|
Pre-production capital includes expenditures required to prepare the mining operation for commissioning and the commencement of commercial production.
The estimate includes the acquisition and implementation of mining software required for mine planning and operational control, as well as mine preparation and development activities necessary to establish initial access to the orebody and support the start-up phase.
The estimated pre-production capital costs are summarized in Table 21.4.
Table 21.4 - Estimated Pre-Production Mining Capital Costs
|
Item
|
Cost
|
|
(US$ x 1,000)
|
|
Pre-Production Capital
|
|
|
Mining Software
|
300
|
|
Mine Preparation and Development
|
566
|
|
Total Pre-Production Capital
|
866
|
21.1.4 Process Plant
The major process plant equipment was budgeted based on supplier quotations, including several equipment packages.
The costs for piping, structural steel, platework, and process plant services were estimated using benchmark data from comparable mining and mineral processing projects.
A conceptual Tailings Storage Facility (“TSF”) design was developed to establish the quantities required for the capital cost estimate of the initial TSF construction phase.
The capital cost estimate for the Process Plant is summarized in Table 21.5.
BNA Mining Solutions - R. Des. Leão Starling, 200 - Ouro Preto, BH - MG, 31310-370 – Phone: +55 (31) 2514-8733 – E-mail: info@bnaconsultoria.com
|
GoldMining Inc.
NI 43-101 Report – São Jorge Project
|
Page 256 |
Table 21.5 - Estimated Capital Costs for the Process Plant and Initial Tailings Storage Facility Construction
|
ITEM
|
YEAR -1
|
YEAR 0
|
|
US$ M
|
US$ M
|
|
4
|
Process Plant – TOTAL
|
2,656.42
|
44,343.58
|
|
4.1
|
Process Plant Equipment Procurement – Subtotal
|
2,485.00
|
30,951.74
|
|
4.1.1
|
Crushing and Stockpile Facilities
|
747.64
|
4,068.72
|
|
4.1.2
|
Grinding and Classification
|
1,737.37
|
6,674.07
|
|
4.1.3
|
Gravity Recovery, Intensive Leach and Electrowinning
|
|
1,473.55
|
|
4.1.4
|
CIL Circuit and Cyanide Detoxification
|
|
8,886.24
|
|
4.1.5
|
Elution, Carbon Regeneration, Electrowinning, Smelting and Gold Room
|
|
6,821.13
|
|
4.1.6
|
Tailings Thickener System
|
|
643.74
|
|
4.1.7
|
Reagent Storage and Distribution Systems
|
|
2,384.28
|
|
4.2
|
Miscellaneous and Auxiliary Equipment
|
|
|
|
4.2
|
Structural Steel and Platework – Subtotal
|
|
2,488.66
|
|
4.3
|
Process Piping – Subtotal
|
|
3,797.29
|
|
4.3.1
|
Piping and Valves
|
|
3,358.30
|
|
4.3.2
|
Piping Miscellaneous Items
|
|
439.00
|
|
4.4
|
Process Plant Services – Compressed Air, Industrial Water and Oxygen Systems – Subtotal
|
|
4,201.81
|
|
4.4.1
|
Plant Air, Process Water, Industrial Water, Gland Water and Oxygen Systems
|
|
4,201.81
|
|
4.5
|
Tailings Storage Facility (“TSF”) - Subtotal
|
171.42
|
2,904.08
|
|
4.5.1
|
Investigation, Instrumentation, Testing and Geotechnical Studies
|
171.42
|
|
|
4.5.2
|
Initial TSF Construction Phase (Year 0)
|
|
2,904.08
|
Note:
Only the engineering, investigation, and initial construction phase costs of the Tailings Storage Facility (“TSF”) were included in the Initial Capital Estimate. The costs associated with subsequent TSF expansion stages were included in the Sustaining Capital Estimate.
21.1.5 Site Infrastructure, Camp Facilities and Civil Works
The site infrastructure capital cost estimate was developed based on quantities derived from the conceptual project layouts and preliminary engineering studies. The estimate includes access and internal roads, bridges, camp facilities, administrative and maintenance buildings, process plant support infrastructure, information technology and communication systems, and concrete foundations and civil works.
Unit costs were estimated using benchmark data from comparable projects and cost references commonly applied in Brazil, with particular consideration given to prevailing construction costs in the State of Pará.
The capital cost estimate for Site Infrastructure, including roads, bridges, camp facilities, and general earthworks, is summarized in Table 21.6.
BNA Mining Solutions - R. Des. Leão Starling, 200 - Ouro Preto, BH - MG, 31310-370 – Phone: +55 (31) 2514-8733 – E-mail: info@bnaconsultoria.com
|
GoldMining Inc.
NI 43-101 Report – São Jorge Project
|
Page 257 |
Table 21.6 - Estimated Capital Costs for Site Infrastructure
|
ITEM
|
YEAR -1
|
YEAR 0
|
|
US$ M
|
US$M
|
|
2
|
Site Infrastructure- Roads, Bridges, Camp and General Earthwork - TOTAL
|
1,909.02
|
7,817.41
|
|
2.1
|
Roads, Bridges and General Earthwork - Subtotal
|
1,824.54
|
1,294.73
|
|
2.1.1
|
Mobilization and demobilization of construction work and equipment
|
706.40
|
176.60
|
|
2.1.2
|
External and Internal Road - Earthwork, Drainage, Paving Road, Vegetation Suppression, Explosives Depot Road and Helipad Road
|
835.11
|
835.11
|
|
2.1.3
|
Bridges - 2 about 30 m each
|
283.02
|
283.02
|
|
2.2
|
Camp Facilities and Administrative Areas – Subtotal
|
|
1,060.84
|
|
2.2.1
|
Dormitories - 120 persons
|
|
302.07
|
|
2.2.2
|
Dormitories – Staff - 15 persons
|
|
81.03
|
|
2.2.3
|
Camp Office and Medical Center
|
|
69.71
|
|
2.2.4
|
Kitchen and Laundry
|
|
198.11
|
|
2.2.5
|
Recreational Area
|
|
92.94
|
|
2.2.6
|
Solid and Hazardous Waste Management
|
|
5.66
|
|
2.2.7
|
Domestic Waste
|
|
141.51
|
|
2.2.8
|
Sewage Water
|
|
169.81
|
|
2.4
|
Support Infrastructure - Buildings Administrative/Maintenance - Subtotal
|
27.88
|
1,212.14
|
|
2.3.1
|
Office and Training Room
|
|
102.24
|
|
2.4.2
|
Changing Rooms and Restrooms
|
|
100.47
|
|
2.4.3
|
Reception and entrance gatehouse
|
27.88
|
|
|
2.4.4
|
Maintenance workshop
|
|
47.17
|
|
2.4.5
|
Truck Shop with oil and tires
|
|
267.92
|
|
2.4.6
|
Warehouse
|
|
56.60
|
|
2.4.7
|
Laydown area - Fence and floor
|
|
5.66
|
|
2.4.8
|
Complete chemical analysis laboratory - Include equipment’s
|
|
528.30
|
|
2.4.9
|
Fuel Systems Storage - 60,000 litre
|
|
37.74
|
|
2.4.10
|
Restaurant in administrative area
|
|
66.04
|
|
2.5
|
Process Plant Infrastructure – Subtotal
|
|
381.77
|
|
2.5.1
|
Reagents Storage Buildings
|
|
259.43
|
|
2.5.2
|
Control Room
|
|
46.47
|
|
2.5.3
|
Mill Office (with Canteen)
|
|
20.09
|
|
2.5.4
|
Process Plant Security Gate
|
|
55.77
|
|
2.6
|
IT Network/Hardware’s and Communication - Subtotal
|
56.60
|
94.34
|
|
2.7
|
Concrete Foundations and Civil Works - Subtotal
|
|
3,773.58
|
21.1.6 Power Supply, Distribution and Automation Infrastructure
The capital cost estimate for the power supply infrastructure was developed based on budget quotations and benchmark data from comparable projects.
The high-voltage transmission line was budgeted based on information provided by Equatorial, the regional power utility. Budget quotations were obtained for the main substation, electrical rooms, and associated transformers. The electrical distribution system, including plant power distribution, electrical equipment, materials, and automation systems, was estimated using benchmark data from similar mining and mineral processing projects.
The capital cost estimate for the power line, electrical distribution, and automation systems is summarized in Table 21.7.
BNA Mining Solutions - R. Des. Leão Starling, 200 - Ouro Preto, BH - MG, 31310-370 – Phone: +55 (31) 2514-8733 – E-mail: info@bnaconsultoria.com
|
GoldMining Inc.
NI 43-101 Report – São Jorge Project
|
Page 258 |
Table 21.7 - Estimated Capital Costs for Power Supply, Electrical Distribution and Automation Infrastructure
|
ITEM
|
YEAR -1
|
YEAR 0
|
|
US$ M
|
US$M
|
|
3
|
Power Line- Electrical and Automation - TOTAL
|
417.66
|
16,389.64
|
|
3.1
|
Power Line Main Stion and Electrical Room - Subtotal
|
417.66
|
15,644.36
|
|
3.1.1
|
Power Transmission Line - 3.5 km - 138 Kv - SE Sec.
|
417.66
|
974.55
|
|
3.1.2
|
Site Main Substation - Main Substation Including Metering Equipment and Step-Down Transformers
|
|
5,471.70
|
|
3.1.3
|
Electric Room - Crushing
|
|
1,320.75
|
|
3.1.4
|
Electric Room - Process Plant
|
|
4,150.94
|
|
3.1.5
|
Others - Electric Distribution, Cables, Materials, Power Infrastructure
|
|
3,726.42
|
|
3.4
|
Automation - Subtotal
|
|
745.28
|
The capital cost estimate for the water management infrastructure is summarized in Table 21.8. The estimate includes freshwater supply and distribution systems, domestic water systems, sewage collection and treatment facilities, and associated electrical and support infrastructure.
Table 21.8 - Estimated Capital Costs for Water Management Infrastructure
|
ITEM
|
YEAR -1
|
YEAR 0
|
|
US$ M
|
US$M
|
|
5
|
Water Management - TOTAL
|
|
1,828.30
|
|
5.1
|
Freshwater Pumping Station
|
|
101.89
|
|
5.2
|
Freshwater Pipeline
|
|
150.94
|
|
5.3
|
Freshwater Storage and Distribution System
|
|
283.02
|
|
5.4
|
Domestic Water Supply System
|
|
264.15
|
|
5.5
|
Sewage Collection and Treatment System
|
|
943.40
|
|
5.6
|
Electrical Distribution, Cables and Supporting Infrastructure
|
|
84.91
|
21.1.7 General and Engineering Services
The capital cost estimate for General and Engineering Services is summarized in Table 21.9. The estimate includes engineering, project management, construction management, administration, human resources, logistics, telecommunications, freight, insurance, and other services required to support project development and construction.
BNA Mining Solutions - R. Des. Leão Starling, 200 - Ouro Preto, BH - MG, 31310-370 – Phone: +55 (31) 2514-8733 – E-mail: info@bnaconsultoria.com
|
GoldMining Inc.
NI 43-101 Report – São Jorge Project
|
Page 259 |
Table 21.9 - Estimated Capital Costs for General and Engineering Services
|
ITEM
|
YEAR -1
|
YEAR 0
|
|
US$ M
|
US$M
|
|
6
|
General Services and Engineering Services - TOTAL
|
3,424.35
|
23,136.76
|
|
6.1
|
Engineering and construction management
|
920.64
|
4,603.20
|
|
6.2
|
Mechanical and Electrical Construction and Assembly
|
410.29
|
8,913.46
|
|
6.3
|
General Management
|
849.06
|
849.06
|
|
6.4
|
HR & Training
|
94.34
|
1,037.74
|
|
6.5
|
Accounting and Finances
|
377.36
|
943.40
|
|
6.6
|
Supply Chain
|
377.36
|
943.40
|
|
6.7
|
Telecommunications Service – IT
|
94.34
|
566.04
|
|
6.8
|
Logistics / Taxes / Insurance
|
218.91
|
3,226.27
|
|
6.9
|
Freight Process Plant, Other Equipment and Materials
|
82,06
|
2,054.21
|
21.1.8 Pre-Production, Start-Up, First Fill and Ramp-Up
The estimated costs cover management and technical services required to support and supervise all pre-production activities.
For the process plant, the estimate includes initial fills, labour, reagents, spare parts, consumables, commissioning activities, and ramp-up costs incurred prior to achieving design production capacity.
Pre-production, start-up, first fill, and ramp-up costs are estimated at US$2.1 million in Year 0.
21.1.9 Indirect Costs, Owner's Costs and Contingency
Indirect costs were estimated as 10% of total direct costs and include administrative, project support, and general overhead expenses associated with project development and construction.
Owner's costs were estimated as 10% of total direct costs and include project oversight, owner's team expenses, and corporate support functions.
Given the preliminary level of engineering associated with this PEA, a contingency allowance equivalent to 25% of the estimated capital costs was applied.
The estimated indirect costs, owner's costs, and contingency allowances are summarized in Table 21.10.
Table 21.10 - Estimated Indirect Costs, Owner's Costs and Contingency Allowances
|
ITEM
|
YEAR -1
|
YEAR 0
|
|
US$ M
|
US$M
|
|
9
|
Indirect Costs (10% of Direct Costs)
|
2,718.90
|
11,224.70
|
|
10
|
Owner's Costs (10% of Direct Costs)
|
2,718.90
|
11,224.70
|
|
11
|
Contingency (25% of Estimated Capital Costs)
|
6,797.20
|
28,061.50
|
BNA Mining Solutions - R. Des. Leão Starling, 200 - Ouro Preto, BH - MG, 31310-370 – Phone: +55 (31) 2514-8733 – E-mail: info@bnaconsultoria.com
|
GoldMining Inc.
NI 43-101 Report – São Jorge Project
|
Page 260 |
21.1.10 Mine Closure
Mine closure activities are planned to commence during the final years of operation and continue through the post-closure period. The closure cost estimate includes engineering and planning studies, demolition and site rehabilitation activities, water management measures, geotechnical monitoring, revegetation, contaminated soil management, fencing, environmental monitoring programs, and Tailings Storage Facility (“TSF”) closure activities.
The closure cost estimate was developed using benchmark data from comparable mining operations and reflects the level of detail appropriate for a Preliminary Economic Assessment (“PEA”). The closure plan and associated costs should be further refined during subsequent phases of project development.
The estimated closure costs are distributed between Years 10 and 13 and total approximately US$ 15.0 million, as summarized in Table 21.11.
Table 21.11 - Estimated Mine Closure Costs by Year
|
Mine Closure Activity
|
Year 10
US$ M
|
Year 11
US$ M
|
Year 12
US$ M
|
Year 13
US$ M
|
TOTAL
US$ M
|
|
Closure Planning Studies and Engineering
|
0.13
|
0.05
|
|
|
0.18
|
|
Demolition and Water Management
|
|
1.30
|
|
|
1.30
|
|
Geotechnical Monitoring
|
|
|
0.05
|
0.05
|
0.10
|
|
Revegetation, Contaminated Soil Management and Fencing
|
|
0.78
|
1.56
|
|
2.35
|
|
Environmental Monitoring (Fauna, Water and Drainage)
|
|
0.13
|
0.05
|
0.05
|
0.23
|
|
Environmental Programs
|
0.52
|
0.26
|
|
|
0.78
|
|
TSF Closure and Decommissioning
|
|
0.52
|
3.91
|
2.61
|
7.04
|
|
Contingency (25%)
|
0.16
|
0.76
|
1.40
|
0.68
|
3.00
|
|
Total
|
0.82
|
3.82
|
6.98
|
3.39
|
15.00
|
21.1.11 Sustaining Capital
Sustaining capital expenditures are required throughout the Life of Mine (“LOM”) to maintain the planned production capacity and support ongoing operations. The principal drivers of sustaining capital requirements include:
| |
●
|
Expansion of the mining fleet to accommodate increases in stripping requirements and/or haulage distances;
|
| |
●
|
Replacement or major refurbishment of equipment reaching the end of its economic service life;
|
| |
●
|
Expansion and staged construction of the Tailings Storage Facility (“TSF”);
|
| |
●
|
Other infrastructure upgrades required to support continued operations.
|
BNA Mining Solutions - R. Des. Leão Starling, 200 - Ouro Preto, BH - MG, 31310-370 – Phone: +55 (31) 2514-8733 – E-mail: info@bnaconsultoria.com
|
GoldMining Inc.
NI 43-101 Report – São Jorge Project
|
Page 261 |
A contingency allowance equivalent to 25% of the annual sustaining capital estimate was applied to reflect the level of accuracy associated with a Preliminary Economic Assessment. The contingency allowance includes $3M in contingency relating to Closure costs.
Table 21.12 presents the estimated annual sustaining capital expenditures for the São Jorge Project.
BNA Mining Solutions - R. Des. Leão Starling, 200 - Ouro Preto, BH - MG, 31310-370 – Phone: +55 (31) 2514-8733 – E-mail: info@bnaconsultoria.com
|
GoldMining Inc.
NI 43-101 Report – São Jorge Project
|
Page 262 |
Table 21.12 - Estimated Life of Mine Sustaining Capital Expenditures by Year
|
Description
|
SUSTAINING CAPITAL (USD x 1,000)
|
|
2
|
3
|
4
|
5
|
6
|
7
|
8
|
9
|
10
|
11
|
12
|
13
|
Total
|
|
Mining Equipment
|
3,322
|
1,596
|
4,818
|
2,279
|
6,104
|
855
|
6,284
|
5,412
|
-
|
-
|
-
|
-
|
30,670
|
|
Tailings Dam
|
1,116
|
1,293
|
1,212
|
2,741
|
-
|
-
|
-
|
3,002
|
-
|
-
|
-
|
-
|
9,364
|
|
Mine Closure Cost
|
|
|
|
|
|
|
|
|
652
|
3,052
|
5,583
|
2,713
|
12,000
|
|
Sub-total
|
4,438
|
2,889
|
6,030
|
5,020
|
6,104
|
855
|
6,284
|
8,414
|
652
|
3,052
|
5,583
|
2,713
|
52,034
|
|
Contingency
|
25%
|
1,109
|
722
|
1,508
|
1,255
|
1,526
|
214
|
1,571
|
2,104
|
163
|
763
|
1,396
|
678
|
13,008
|
|
TOTAL CAPEX
|
5,547
|
3,612
|
7,538
|
6,275
|
7,631
|
1,068
|
7,855
|
10,518
|
815
|
3,815
|
6,978
|
3,391
|
65,042
|
BNA Mining Solutions - R. Des. Leão Starling, 200 - Ouro Preto, BH - MG, 31310-370 – Phone: +55 (31) 2514-8733 – E-mail: info@bnaconsultoria.com
|
GoldMining Inc.
NI 43-101 Report – São Jorge Project
|
Page 263 |
|
21.2
|
Operating Cost Expenditures
|
|
21.2.1
|
Operating Costs Summary
|
The operating cost estimate for the São Jorge Project was developed to a level of accuracy consistent with a Preliminary Economic Assessment and is based on the mine production schedule, process plant throughput, workforce requirements, equipment fleet, metallurgical test work, and benchmark data from comparable mining operations.
The Life of Mine operating costs include expenditures associated with mining activities, process plant operations, administration and infrastructure maintenance, and general overhead costs.
Mining costs vary throughout the mine life in response to changes in material movement requirements, haulage distances, and stripping ratios. Process plant operating costs remain relatively stable during full production years due to the constant plant throughput of approximately 2.0 Mtpa. Administration, maintenance, and general costs were estimated based on the workforce requirements and supporting services necessary to sustain project operations.
A contingency allowance equivalent to 25% of the estimated operating costs was applied to reflect the level of confidence associated with the current stage of project development.
Total Life of Mine operating costs, including contingency, are estimated at approximately US$ 635.7 million. Annual operating costs range from approximately US$ 48.8 million in Year 1 to US$ 64.6 million during peak production years, decreasing to approximately US$ 36.8 million in the final year of operation.
The estimated annual operating costs are summarized in Table 21.13.
BNA Mining Solutions - R. Des. Leão Starling, 200 - Ouro Preto, BH - MG, 31310-370 – Phone: +55 (31) 2514-8733 – E-mail: info@bnaconsultoria.com
|
GoldMining Inc.
NI 43-101 Report – São Jorge Project
|
Page 264 |
Table 21.13 - Summary of Annual Operating Costs
|
Description
|
Annual Operating Costs (US$ x 1,000)
|
|
1
|
2
|
3
|
4
|
5
|
6
|
7
|
8
|
9
|
10
|
11
|
Total
|
|
A - Mine
|
11,296
|
15,686
|
17,873
|
18,879
|
18,847
|
23,790
|
23,790
|
23,790
|
23,968
|
23,968
|
13,675
|
215,562
|
|
B - Process Plant
|
20,465
|
20,465
|
20,465
|
20,465
|
20,465
|
20,465
|
20,465
|
20,465
|
20,465
|
20,465
|
11,665
|
216,312
|
|
C - Administration, Maintenance and Others
|
4,736
|
4,736
|
4,736
|
4,736
|
4,736
|
4,736
|
4,736
|
4,736
|
4,736
|
4,736
|
2,700
|
50,062
|
|
D - Overhead and General Costs
|
2,520
|
2,520
|
2,520
|
2,520
|
2,520
|
2,520
|
2,520
|
2,520
|
2,520
|
2,520
|
1,436
|
26,637
|
|
Sub-total
|
39,017
|
43,407
|
45,594
|
46,600
|
46,568
|
51,511
|
51,511
|
51,511
|
51,690
|
51,690
|
29,476
|
508,573
|
|
Contingency
|
25%
|
9,754
|
10,852
|
11,398
|
11,650
|
11,642
|
12,878
|
12,878
|
12,878
|
12,922
|
12,922
|
7,369
|
127,143
|
|
TOTAL OPERATING COST
|
48,771
|
54,259
|
56,992
|
58,250
|
58,210
|
64,389
|
64,389
|
64,389
|
64,612
|
64,612
|
36,845
|
635,716
|
BNA Mining Solutions - R. Des. Leão Starling, 200 - Ouro Preto, BH - MG, 31310-370 – Phone: +55 (31) 2514-8733 – E-mail: info@bnaconsultoria.com
|
GoldMining Inc.
NI 43-101 Report – São Jorge Project
|
Page 265 |
21.2.2 Mining
Table 21.14 presents a summary of the estimated annual mining operating costs over the Life of Mine .
Mining operating costs include workforce expenses, equipment operating costs, fuel and lubricants, drilling consumables, explosives and accessories, maintenance materials and spare parts, and tyre replacement costs.
Mining costs vary throughout the mine life as a function of annual mining rates, equipment requirements, haulage distances, and changes in the stripping ratio.
Total mining operating costs are estimated at approximately US$ 215.6 million over the LOM, ranging from US$ 11.3 million in Year 1 to approximately US$ 24.0 million during peak production years.
A detailed breakdown of the mining operating costs by category is presented in the following subsections.
BNA Mining Solutions - R. Des. Leão Starling, 200 - Ouro Preto, BH - MG, 31310-370 – Phone: +55 (31) 2514-8733 – E-mail: info@bnaconsultoria.com
|
GoldMining Inc.
NI 43-101 Report – São Jorge Project
|
Page 266 |
Table 21.14 - Mining Operating Costs
|
Description
|
Annual Operating Costs (US$ x 1,000)
|
|
1
|
2
|
3
|
4
|
5
|
6
|
7
|
8
|
9
|
10
|
11
|
Total
|
|
A - Workforce
|
|
5,774
|
7,349
|
8,137
|
8,571
|
8,571
|
10,619
|
10,619
|
10,619
|
10,619
|
10,619
|
6,069
|
97,567
|
|
Salaries and Benefits
|
5,774
|
7,349
|
8,137
|
8,571
|
8,571
|
10,619
|
10,619
|
10,619
|
10,619
|
10,619
|
6,069
|
97,567
|
|
B - Mining
|
5,522
|
8,336
|
9,736
|
10,308
|
10,276
|
13,171
|
13,171
|
13,171
|
13,349
|
13,349
|
7,606
|
117,995
|
|
Fuel and Lubricants
|
3,676
|
5,295
|
6,049
|
6,441
|
6,343
|
8,292
|
8,292
|
8,292
|
8,244
|
8,244
|
4,688
|
73,855
|
|
Drilling Consumables
|
5
|
21
|
30
|
32
|
34
|
42
|
42
|
42
|
47
|
47
|
32
|
373
|
|
Explosives and Accessories
|
236
|
916
|
1,320
|
1,383
|
1,475
|
1,819
|
1,819
|
1,819
|
2,056
|
2,056
|
1,175
|
16,074
|
|
Maintenance Parts and Materials
|
1,263
|
1,640
|
1,808
|
1,886
|
1,868
|
2,293
|
2,293
|
2,293
|
2,273
|
2,273
|
1,299
|
21,190
|
|
Tyres
|
342
|
464
|
528
|
567
|
556
|
725
|
725
|
725
|
729
|
729
|
412
|
6,503
|
|
Sub-total
|
11,296
|
15,686
|
17,873
|
18,879
|
18,847
|
23,790
|
23,790
|
23,790
|
23,968
|
23,968
|
13,675
|
215,562
|
BNA Mining Solutions - R. Des. Leão Starling, 200 - Ouro Preto, BH - MG, 31310-370 – Phone: +55 (31) 2514-8733 – E-mail: info@bnaconsultoria.com
|
GoldMining Inc.
NI 43-101 Report – São Jorge Project
|
Page 267 |
|
21.2.2.1
|
Mining Personnel Costs
|
Annual personnel costs were estimated based on the workforce required for each function in each year, considering the respective salaries plus labour burdens and benefits.
The workforce estimate is presented in Section 16.
The main criteria adopted for the estimation of personnel costs were:
| |
●
|
The number of operators was estimated based on the quantity of equipment for each year, average equipment availability, number of shifts, and an absence factor (absenteeism, vacation, training, etc.) estimated at 16.5%;
|
| |
●
|
Geology and mine planning team requirements;
|
| |
●
|
Labour burdens and benefits equivalent to 190% of nominal salaries.
|
It should be noted that maintenance personnel for the mining operations were not accounted for separately, as maintenance activities are integrated with the processing plant. Accordingly, all maintenance workforce has been allocated under the process plant personnel.
Table 21.15 presents a summary of the total estimated personnel costs.
BNA Mining Solutions - R. Des. Leão Starling, 200 - Ouro Preto, BH - MG, 31310-370 – Phone: +55 (31) 2514-8733 – E-mail: info@bnaconsultoria.com
|
GoldMining Inc.
NI 43-101 Report – São Jorge Project
|
Page 268 |
Table 21.15 - Mining Personnel Costs
|
Description
|
Salary
|
Year of Operation (US$ x 1,000)
|
|
(US$/month)
|
1
|
2
|
3
|
4
|
5
|
6
|
7
|
8
|
9
|
10
|
11
|
|
Geology, Planning and Exploration
|
676
|
676
|
676
|
676
|
676
|
676
|
676
|
676
|
676
|
676
|
386
|
|
Mining Engineer
|
3,396
|
236
|
236
|
236
|
236
|
236
|
236
|
236
|
236
|
236
|
236
|
135
|
|
Geologist
|
2,830
|
197
|
197
|
197
|
197
|
197
|
197
|
197
|
197
|
197
|
197
|
113
|
|
Technician
|
1,038
|
108
|
108
|
108
|
108
|
108
|
108
|
108
|
108
|
108
|
108
|
62
|
|
Surveyor
|
1,132
|
79
|
79
|
79
|
79
|
79
|
79
|
79
|
79
|
79
|
79
|
45
|
|
Assistant
|
528
|
55
|
55
|
55
|
55
|
55
|
55
|
55
|
55
|
55
|
55
|
32
|
|
Mining Operations
|
5,098
|
6,674
|
7,462
|
7,895
|
7,895
|
9,944
|
9,944
|
9,944
|
9,944
|
9,944
|
5,683
|
|
Supervisor
|
2,264
|
236
|
236
|
236
|
236
|
236
|
236
|
236
|
236
|
236
|
236
|
135
|
|
Mining Engineer
|
3,396
|
236
|
236
|
236
|
236
|
236
|
236
|
236
|
236
|
236
|
236
|
135
|
|
Equipment Operators
|
|
|
|
|
|
|
|
|
|
|
|
|
|
Hydraulic Drill
|
1,132
|
158
|
315
|
315
|
315
|
315
|
473
|
473
|
473
|
473
|
473
|
270
|
|
Hydraulic Excavator
|
1,132
|
315
|
473
|
630
|
630
|
630
|
630
|
630
|
630
|
630
|
630
|
360
|
|
Haul Truck
|
1,132
|
2,049
|
3,309
|
3,940
|
4,373
|
4,373
|
6,106
|
6,106
|
6,106
|
6,106
|
6,106
|
3,490
|
|
Crawler Dozer
|
1,132
|
158
|
158
|
158
|
158
|
158
|
315
|
315
|
315
|
315
|
315
|
180
|
|
Crawler Dozer (Additional)
|
1,132
|
158
|
158
|
158
|
158
|
158
|
158
|
158
|
158
|
158
|
158
|
90
|
|
Wheel Loader (Auxiliary)
|
1,132
|
473
|
473
|
473
|
473
|
473
|
473
|
473
|
473
|
473
|
473
|
270
|
|
Water Truck
|
1,132
|
473
|
473
|
473
|
473
|
473
|
473
|
473
|
473
|
473
|
473
|
270
|
|
Motor Grader
|
1,132
|
158
|
158
|
158
|
158
|
158
|
158
|
158
|
158
|
158
|
158
|
90
|
|
Service Truck
|
1,132
|
158
|
158
|
158
|
158
|
158
|
158
|
158
|
158
|
158
|
158
|
90
|
|
Backhoe
|
1,132
|
315
|
315
|
315
|
315
|
315
|
315
|
315
|
315
|
315
|
315
|
180
|
|
Crane Truck
|
1,132
|
158
|
158
|
158
|
158
|
158
|
158
|
158
|
158
|
158
|
158
|
90
|
|
Drill Assistant
|
472
|
0
|
0
|
0
|
0
|
0
|
0
|
0
|
0
|
0
|
0
|
0
|
|
Service Helper
|
528
|
55
|
55
|
55
|
55
|
55
|
55
|
55
|
55
|
55
|
55
|
32
|
|
Total Operating Cost
|
5,774
|
7,349
|
8,137
|
8,571
|
8,571
|
10,619
|
10,619
|
10,619
|
10,619
|
10,619
|
6,069
|
BNA Mining Solutions - R. Des. Leão Starling, 200 - Ouro Preto, BH - MG, 31310-370 – Phone: +55 (31) 2514-8733 – E-mail: info@bnaconsultoria.com
|
GoldMining Inc.
NI 43-101 Report – São Jorge Project
|
Page 269 |
|
21.2.2.2
|
Drilling Consumables Cost Estimate
|
Drilling consumables were estimated based on the projected drilling requirements associated with mining operations, including production drilling activities.
The main components considered in this estimate include drill bits, drill rods, coupling sleeves, and shank adapters. Consumption rates were defined based on equipment service life, expected operating conditions, and reference data from similar mining operations.
The estimated consumption of drilling consumables was calculated as a function of total drilling metres, equipment productivity, and component wear rates.
Table 21.16 presents the estimated consumption of drilling consumables (drill string components) over the life of mine.
The costs associated with drilling consumables were estimated based on unit prices obtained from supplier quotations, database references, and benchmarking with similar operations.
Table 21.17 presents the estimated costs of drilling consumables.
These estimates are considered appropriate for a Preliminary Economic Assessment (PEA) level study and may be refined as additional operational data and supplier information become available.
Table 21.16 - Estimated Drilling Consumables Consumption
|
Equipment
|
Service
Life
|
Year
|
|
hr
|
1
|
2
|
3
|
4
|
5
|
6
|
7
|
8
|
9
|
10
|
11
|
|
4" Diameter Hole
|
|
|
|
|
|
|
|
|
|
|
|
|
|
Drill Bit
|
150
|
8
|
33
|
47
|
49
|
53
|
65
|
65
|
65
|
73
|
73
|
49
|
|
Drill Rod
|
500
|
3
|
10
|
14
|
15
|
16
|
19
|
19
|
19
|
22
|
22
|
15
|
|
Coupling Sleeve
|
120
|
11
|
41
|
59
|
62
|
66
|
81
|
81
|
81
|
92
|
92
|
62
|
|
Shank Adapter
|
150
|
8
|
33
|
47
|
49
|
53
|
65
|
65
|
65
|
73
|
73
|
49
|
BNA Mining Solutions - R. Des. Leão Starling, 200 - Ouro Preto, BH - MG, 31310-370 – Phone: +55 (31) 2514-8733 – E-mail: info@bnaconsultoria.com
|
GoldMining Inc.
NI 43-101 Report – São Jorge Project
|
Page 270 |
Table 21.17 - Estimated Drilling Consumables Costs
|
Equipment
|
Price
|
Annual Drilling Consumables Cost (US$ x 1,000)
|
|
US$/unit
|
1
|
2
|
3
|
4
|
5
|
6
|
7
|
8
|
9
|
10
|
11
|
|
Drill Bit
|
172
|
1.5
|
5.6
|
8.1
|
8.5
|
9.1
|
11.2
|
11.2
|
11.2
|
12.7
|
12.7
|
8.5
|
|
Drill Rod
|
526
|
1.3
|
5.2
|
7.4
|
7.8
|
8.3
|
10.3
|
10.3
|
10.3
|
11.6
|
11.6
|
7.8
|
|
Coupling Sleeve
|
57
|
0.6
|
2.3
|
3.4
|
3.5
|
3.8
|
4.7
|
4.7
|
4.7
|
5.3
|
5.3
|
3.5
|
|
Shank Adapter
|
240
|
2.0
|
7.8
|
11.3
|
11.8
|
12.6
|
15.6
|
15.6
|
15.6
|
17.6
|
17.6
|
11.8
|
|
Total Cost
|
5
|
21
|
30
|
32
|
34
|
42
|
42
|
42
|
47
|
47
|
32
|
|
21.2.2.3
|
Explosives and Blasting Accessories Cost Estimate
|
Explosives and blasting accessories consumption was estimated based on the projected production requiring blasting, considering both mineralized material and waste material.
Consumption rates were defined based on typical blasting practices, powder factors, and reference data from similar open-pit mining operations.
The main consumables considered include bulk explosives and blasting accessories such as boosters, delays, detonating cord, and detonators.
Table 21.18 presents the estimated consumption of explosives and blasting accessories over the life of mine.
The costs associated with explosives and blasting accessories were estimated based on unit prices obtained from supplier information, database references, and industry benchmarks.
Table 21.19 presents the estimated costs of explosives and blasting accessories.
These estimates are considered appropriate for a Preliminary Economic Assessment (“PEA”) level study and may be refined as additional operational data and supplier information become available.
BNA Mining Solutions - R. Des. Leão Starling, 200 - Ouro Preto, BH - MG, 31310-370 – Phone: +55 (31) 2514-8733 – E-mail: info@bnaconsultoria.com
|
GoldMining Inc.
NI 43-101 Report – São Jorge Project
|
Page 271 |
Table 21.18 - Estimated Explosives and Blasting Accessories Consumption
|
Description
|
Unit
|
Year
|
|
1
|
2
|
3
|
4
|
5
|
6
|
7
|
8
|
9
|
10
|
11
|
|
Production (requiring blasting)
|
|
|
|
|
|
|
|
|
|
|
|
|
|
Mineralized Material
|
kt
|
625
|
1,797
|
1,884
|
1,957
|
2,040
|
2,008
|
2,008
|
2,008
|
2,100
|
2,100
|
1,200
|
|
Waste
|
kt
|
523
|
3,027
|
5,493
|
5,777
|
6,240
|
8,507
|
8,507
|
8,507
|
9,889
|
9,889
|
5,652
|
|
Explosives Consumption
|
|
|
|
|
|
|
|
|
|
|
|
|
|
Mineralized Material
|
t
|
131
|
377
|
395
|
410
|
428
|
421
|
421
|
421
|
440
|
440
|
252
|
|
Waste
|
t
|
69
|
397
|
720
|
757
|
818
|
1,115
|
1,115
|
1,115
|
1,296
|
1,296
|
741
|
|
TOTAL EXPLOSIVES
|
t
|
200
|
774
|
1,115
|
1,168
|
1,246
|
1,536
|
1,536
|
1,536
|
1,737
|
1,737
|
992
|
|
Accessories Consumption
|
|
|
|
|
|
|
|
|
|
|
|
|
|
Booster
|
103 units
|
2
|
9
|
13
|
13
|
14
|
18
|
18
|
18
|
20
|
20
|
11
|
|
Delays
|
103 units
|
0.8
|
3.0
|
4.3
|
4.5
|
4.8
|
5.9
|
5.9
|
5.9
|
6.7
|
6.7
|
3.8
|
|
Detonating Cord
|
103 units
|
44
|
172
|
248
|
260
|
277
|
342
|
342
|
342
|
386
|
386
|
221
|
|
Non-electric Detonator
|
103 units
|
3.1
|
13.5
|
21.2
|
22.2
|
23.8
|
30.6
|
30.6
|
30.6
|
35.0
|
35.0
|
20.0
|
|
Electric Detonator
|
103 units
|
1.5
|
4.4
|
4.6
|
4.7
|
4.9
|
4.9
|
4.9
|
4.9
|
5.1
|
5.1
|
2.9
|
Table 21.19 - Estimated Explosives and Blasting Accessories Costs
|
Item
|
Annual Cost of Explosives and Accessories (US$ x 1,000)
|
|
1
|
2
|
3
|
4
|
5
|
6
|
7
|
8
|
9
|
10
|
11
|
|
Explosives
|
217
|
841
|
1,212
|
1,269
|
1,354
|
1,670
|
1,670
|
1,670
|
1,888
|
1,888
|
1,079
|
|
Explosive
|
217
|
841
|
1,212
|
1,269
|
1,354
|
1,670
|
1,670
|
1,670
|
1,888
|
1,888
|
1,079
|
|
Accessories
|
19
|
75
|
108
|
113
|
121
|
149
|
149
|
149
|
169
|
169
|
96
|
|
Delays
|
3
|
11
|
16
|
17
|
18
|
22
|
22
|
22
|
25
|
25
|
14
|
|
Detonating Cord
|
12
|
46
|
67
|
70
|
74
|
92
|
92
|
92
|
104
|
104
|
59
|
|
Non-electric Detonator
|
3
|
13
|
21
|
22
|
24
|
31
|
31
|
31
|
35
|
35
|
20
|
|
Electric Detonator
|
2
|
4
|
5
|
5
|
5
|
5
|
5
|
5
|
5
|
5
|
3
|
|
Total Cost
|
236
|
916
|
1,320
|
1,383
|
1,475
|
1,819
|
1,819
|
1,819
|
2,056
|
2,056
|
1,175
|
|
21.2.2.4
|
Fuel and Lubricant Costs
|
Fuel costs were estimated based on the projected consumption for each piece of equipment.
A diesel price of US$ 1.28 per litre was adopted, and lubricant costs were estimated at 7% of total fuel costs. Table 21.20 and Table 21.21 present a summary of these costs.
BNA Mining Solutions - R. Des. Leão Starling, 200 - Ouro Preto, BH - MG, 31310-370 – Phone: +55 (31) 2514-8733 – E-mail: info@bnaconsultoria.com
|
GoldMining Inc.
NI 43-101 Report – São Jorge Project
|
Page 272 |
Table 21.20 - Fuel and Lubricant Consumption
|
Equipment
|
Consumption
|
Annual Consumption (thousand litres)
|
|
L/h
|
1
|
2
|
3
|
4
|
5
|
6
|
7
|
8
|
9
|
10
|
11
|
|
Hydraulic Drill
|
22
|
28
|
108
|
156
|
163
|
174
|
214
|
214
|
214
|
242
|
242
|
162
|
|
Wheel Loader
|
46
|
461
|
702
|
767
|
779
|
772
|
984
|
984
|
984
|
908
|
908
|
511
|
|
Haul Truck
|
18
|
1,256
|
2,077
|
2,503
|
2,766
|
2,693
|
3,823
|
3,823
|
3,823
|
3,849
|
3,849
|
2,168
|
|
Crawler Dozer
|
22
|
64
|
101
|
112
|
114
|
113
|
150
|
150
|
150
|
137
|
137
|
77
|
|
Crawler Dozer (Additional)
|
22
|
61
|
61
|
61
|
61
|
61
|
61
|
61
|
61
|
61
|
61
|
35
|
|
Wheel Loader (Auxiliary)
|
18
|
257
|
257
|
257
|
257
|
257
|
257
|
257
|
257
|
257
|
257
|
147
|
|
Water Truck
|
12
|
200
|
200
|
200
|
200
|
200
|
200
|
200
|
200
|
200
|
200
|
114
|
|
Motor Grader
|
13
|
72
|
72
|
72
|
72
|
72
|
72
|
72
|
72
|
72
|
72
|
41
|
|
Lighting Tower (Diesel)
|
1
|
25
|
25
|
25
|
25
|
25
|
25
|
25
|
25
|
25
|
25
|
14
|
|
Service Truck
|
12
|
61
|
61
|
61
|
61
|
61
|
61
|
61
|
61
|
61
|
61
|
35
|
|
Backhoe
|
8
|
51
|
51
|
51
|
51
|
51
|
51
|
51
|
51
|
51
|
51
|
29
|
|
Crane Truck
|
12
|
38
|
38
|
38
|
38
|
38
|
38
|
38
|
38
|
38
|
38
|
22
|
|
Utility Vehicle (Pick-up)
|
4
|
103
|
103
|
103
|
103
|
103
|
103
|
103
|
103
|
103
|
103
|
59
|
Table 21.21 - Fuel and Lubricant Costs
|
Equipment
|
Annual Cost (US$ x 1,000)
|
|
1
|
2
|
3
|
4
|
5
|
6
|
7
|
8
|
9
|
10
|
11
|
|
Hydraulic Drill
|
36
|
139
|
200
|
209
|
223
|
275
|
275
|
275
|
311
|
311
|
208
|
|
Wheel Loader
|
591
|
901
|
984
|
1,000
|
990
|
1,262
|
1,262
|
1,262
|
1,165
|
1,165
|
656
|
|
Haul Truck
|
1,611
|
2,665
|
3,211
|
3,549
|
3,455
|
4,905
|
4,905
|
4,905
|
4,939
|
4,939
|
2,781
|
|
Crawler Dozer
|
82
|
130
|
144
|
147
|
145
|
192
|
192
|
192
|
175
|
175
|
99
|
|
Crawler Dozer (Additional)
|
78
|
78
|
78
|
78
|
78
|
78
|
78
|
78
|
78
|
78
|
45
|
|
Wheel Loader (Auxiliary)
|
330
|
330
|
330
|
330
|
330
|
330
|
330
|
330
|
330
|
330
|
189
|
|
Water Truck
|
257
|
257
|
257
|
257
|
257
|
257
|
257
|
257
|
257
|
257
|
147
|
|
Motor Grader
|
93
|
93
|
93
|
93
|
93
|
93
|
93
|
93
|
93
|
93
|
53
|
|
Lighting Tower (Diesel)
|
32
|
32
|
32
|
32
|
32
|
32
|
32
|
32
|
32
|
32
|
18
|
|
Service Truck
|
78
|
78
|
78
|
78
|
78
|
78
|
78
|
78
|
78
|
78
|
45
|
|
Backhoe
|
65
|
65
|
65
|
65
|
65
|
65
|
65
|
65
|
65
|
65
|
37
|
|
Crane Truck
|
49
|
49
|
49
|
49
|
49
|
49
|
49
|
49
|
49
|
49
|
28
|
|
Utility Vehicle (Pick-up)
|
132
|
132
|
132
|
132
|
132
|
132
|
132
|
132
|
132
|
132
|
76
|
|
Diesel Cost
|
3,435
|
4,949
|
5,653
|
6,019
|
5,928
|
7,750
|
7,750
|
7,750
|
7,704
|
7,704
|
4,381
|
|
Lubricants Cost
|
240
|
346
|
396
|
421
|
415
|
542
|
542
|
542
|
539
|
539
|
307
|
|
Total Cost
|
3,676
|
5,295
|
6,049
|
6,441
|
6,343
|
8,292
|
8,292
|
8,292
|
8,244
|
8,244
|
4,688
|
BNA Mining Solutions - R. Des. Leão Starling, 200 - Ouro Preto, BH - MG, 31310-370 – Phone: +55 (31) 2514-8733 – E-mail: info@bnaconsultoria.com
|
GoldMining Inc.
NI 43-101 Report – São Jorge Project
|
Page 273 |
|
21.2.2.5
|
Maintenance Parts and Materials Costs
|
These costs were estimated based on data from similar projects and operations, supplier information, technical literature, and database references.
Table 21.3 presents a summary of the estimated costs for this category.
Table 21.22 - Maintenance Parts and Materials Costs
|
t
|
Cost
|
Annual Maintenance Cost – Parts and Materials (US$ x 1,000)
|
|
US$/h
|
1
|
2
|
3
|
4
|
5
|
6
|
7
|
8
|
9
|
10
|
11
|
|
Hydraulic Drill
|
11.39
|
14
|
56
|
81
|
84
|
90
|
111
|
111
|
111
|
125
|
125
|
84
|
|
Wheel Loader
|
16.60
|
166
|
253
|
277
|
281
|
278
|
355
|
355
|
355
|
328
|
328
|
184
|
|
Haul Truck
|
4.61
|
322
|
532
|
641
|
709
|
690
|
979
|
979
|
979
|
986
|
986
|
555
|
|
Crawler Dozer
|
22.41
|
65
|
103
|
114
|
116
|
115
|
152
|
152
|
152
|
139
|
139
|
78
|
|
Crawler Dozer (Additional)
|
22.41
|
62
|
62
|
62
|
62
|
62
|
62
|
62
|
62
|
62
|
62
|
36
|
|
Wheel Loader (Auxiliary)
|
16.60
|
237
|
237
|
237
|
237
|
237
|
237
|
237
|
237
|
237
|
237
|
136
|
|
Water Truck
|
8.08
|
135
|
135
|
135
|
135
|
135
|
135
|
135
|
135
|
135
|
135
|
77
|
|
Motor Grader
|
12.91
|
72
|
72
|
72
|
72
|
72
|
72
|
72
|
72
|
72
|
72
|
41
|
|
Lighting Tower (Diesel)
|
0.37
|
9
|
9
|
9
|
9
|
9
|
9
|
9
|
9
|
9
|
9
|
5
|
|
Service Truck
|
5.90
|
30
|
30
|
30
|
30
|
30
|
30
|
30
|
30
|
30
|
30
|
17
|
|
Backhoe
|
4.94
|
31
|
31
|
31
|
31
|
31
|
31
|
31
|
31
|
31
|
31
|
18
|
|
Crane Truck
|
5.90
|
19
|
19
|
19
|
19
|
19
|
19
|
19
|
19
|
19
|
19
|
11
|
|
Utility Vehicle (Pick-up)
|
3.87
|
100
|
100
|
100
|
100
|
100
|
100
|
100
|
100
|
100
|
100
|
57
|
|
Total Maintenance Cost
|
|
1,263
|
1,640
|
1,808
|
1,886
|
1,868
|
2,293
|
2,293
|
2,293
|
2,273
|
2,273
|
1,299
|
|
21.2.2.6
|
Estimated Tire Costs
|
Tire costs were estimated based on the projected operating hours of each piece of equipment, the expected service life of each tire type, and the respective purchase costs.
Table 21.23 and Table 21.24 present a summary of these costs.
BNA Mining Solutions - R. Des. Leão Starling, 200 - Ouro Preto, BH - MG, 31310-370 – Phone: +55 (31) 2514-8733 – E-mail: info@bnaconsultoria.com
|
GoldMining Inc.
NI 43-101 Report – São Jorge Project
|
Page 274 |
Table 21.23 - Estimated Tire Consumption
|
Equipment
|
Qty per Unit
|
Tire Life
(hr)
|
Year
|
|
1
|
2
|
3
|
4
|
5
|
6
|
7
|
8
|
9
|
10
|
11
|
|
Dump Truck
|
10
|
2,000
|
349
|
577
|
695
|
768
|
748
|
1,062
|
1,062
|
1,062
|
1,069
|
1,069
|
602
|
|
Wheel Loader
|
4
|
4,000
|
14
|
14
|
14
|
14
|
14
|
14
|
14
|
14
|
14
|
14
|
8
|
|
Water Truck
|
10
|
2,000
|
83
|
83
|
83
|
83
|
83
|
83
|
83
|
83
|
83
|
83
|
48
|
|
Motor Grader
|
6
|
3,500
|
10
|
10
|
10
|
10
|
10
|
10
|
10
|
10
|
10
|
10
|
5
|
|
Service Truck
|
10
|
2,000
|
25
|
25
|
25
|
25
|
25
|
25
|
25
|
25
|
25
|
25
|
15
|
|
Crane Truck
|
10
|
2,000
|
16
|
16
|
16
|
16
|
16
|
16
|
16
|
16
|
16
|
16
|
9
|
|
Utility Vehicle (Pick-up)
|
4
|
800
|
129
|
129
|
129
|
129
|
129
|
129
|
129
|
129
|
129
|
129
|
74
|
Table 21.24 - Estimated Tire Costs
|
Equipment
|
Price
|
Annual Cost (US$ x 1,000)
|
|
US$/unit
|
1
|
2
|
3
|
4
|
5
|
6
|
7
|
8
|
9
|
10
|
11
|
|
Dump Truck
|
538
|
188
|
310
|
374
|
413
|
402
|
571
|
571
|
571
|
575
|
575
|
324
|
|
Wheel Loader
|
2,560
|
37
|
37
|
37
|
37
|
37
|
37
|
37
|
37
|
37
|
37
|
21
|
|
Water Truck
|
500
|
42
|
42
|
42
|
42
|
42
|
42
|
42
|
42
|
42
|
42
|
24
|
|
Motor Grader
|
2,066
|
20
|
20
|
20
|
20
|
20
|
20
|
20
|
20
|
20
|
20
|
11
|
|
Service Truck
|
500
|
13
|
13
|
13
|
13
|
13
|
13
|
13
|
13
|
13
|
13
|
7
|
|
Crane Truck
|
500
|
8
|
8
|
8
|
8
|
8
|
8
|
8
|
8
|
8
|
8
|
5
|
|
Utility Vehicle (Pick-up)
|
276
|
36
|
36
|
36
|
36
|
36
|
36
|
36
|
36
|
36
|
36
|
20
|
|
Total Tyre Cost
|
342
|
464
|
528
|
567
|
556
|
725
|
725
|
725
|
729
|
729
|
412
|
21.2.3 Process Plant Consumption
The process plant description and processing flowsheet are presented in Section 17 – Recovery Methods.
Grinding media consumption, reagent consumption, and associated operating costs were estimated based on metallurgical test work completed on the São Jorge mineralized material, including comminution and leaching test results. These estimates were benchmarked against comparable gold projects processing mineralization with similar metallurgical characteristics.
Additional operating costs, including labour, electrical power, maintenance, consumables, and general plant operating expenses, were estimated using project specific assumptions and benchmark data. Power costs were based on the electricity tariffs provided by Equatorial Energia.
Total annual processing costs, including process plant operations and supporting infrastructure, are summarized in Table 21.25.
BNA Mining Solutions - R. Des. Leão Starling, 200 - Ouro Preto, BH - MG, 31310-370 – Phone: +55 (31) 2514-8733 – E-mail: info@bnaconsultoria.com
|
GoldMining Inc.
NI 43-101 Report – São Jorge Project
|
Page 275 |
Table 21.25 - Estimated Annual Processing Operating Costs
|
ITEM
|
Description
|
US$ x 1000
|
|
YEAR 1
|
YEAR 2
|
YEAR 3
|
YEAR 4
|
YEAR 5
|
YEAR 6
|
YEAR 7
|
YEAR 8
|
YEAR 9
|
YEAR 10
|
YEAR 11
|
|
1
|
Process Plant
|
20,464.74
|
20,464.74
|
20,464.74
|
20,464.74
|
20,464.74
|
20,464.74
|
20,464.74
|
20,464.74
|
20,464.74
|
20,464.74
|
11,664.90
|
|
1.1
|
Labour
|
1,589.64
|
1,589.64
|
1,589.64
|
1,589.64
|
1,589.64
|
1,589.64
|
1,589.64
|
1,589.64
|
1,589.64
|
1,589.64
|
906.09
|
|
1.2
|
Reagents and Grinding Media
|
10,134.09
|
10,134.09
|
10,134.09
|
10,134.09
|
10,134.09
|
10,134.09
|
10,134.09
|
10,134.09
|
10,134.09
|
10,134.09
|
5,776.43
|
|
1.3
|
Maintenance Materials, Spare Parts and Wear Components
|
2,953.65
|
2,953.65
|
2,953.65
|
2,953.65
|
2,953.65
|
2,953.65
|
2,953.65
|
2,953.65
|
2,953.65
|
2,953.65
|
1,683.58
|
|
1.4
|
Contracted Services
|
188.68
|
188.68
|
188.68
|
188.68
|
188.68
|
188.68
|
188.68
|
188.68
|
188.68
|
188.68
|
107.55
|
|
1.5
|
Lubricants and Greases
|
28.30
|
28.30
|
28.30
|
28.30
|
28.30
|
28.30
|
28.30
|
28.30
|
28.30
|
28.30
|
16.13
|
|
1.6
|
Electrical Power – Process Plant and Infrastructure
|
5,570.38
|
5,570.38
|
5,570.38
|
5,570.38
|
5,570.38
|
5,570.38
|
5,570.38
|
5,570.38
|
5,570.38
|
5,570.38
|
3,175.12
|
BNA Mining Solutions - R. Des. Leão Starling, 200 - Ouro Preto, BH - MG, 31310-370 – Phone: +55 (31) 2514-8733 – E-mail: info@bnaconsultoria.com
|
GoldMining Inc.
NI 43-101 Report – São Jorge Project
|
Page 276 |
|
21.2.3.1
|
Process Plant Personnel Costs
|
Process plant labour requirements were estimated based on the proposed operating philosophy, staffing requirements for continuous operation, and the personnel necessary to support gold processing activities, including crushing, grinding, leaching, gold recovery, refinery operations, and general plant services.
The annual labour cost estimate includes salaries, labour burden, benefits, and associated employment charges. The estimated workforce and annual labour costs are summarized in Table 21.26.
Table 21.26 - Process Plant Personnel Costs
|
Position
|
Total Personnel
|
Annual Payroll
(US$ × 1,000/year)
|
Total Cost Including Labour
Burden (US$ × 1,000/year)
|
|
Plant Manager
|
1
|
79.25
|
150.57
|
|
Senior Metallurgist
|
1
|
40.75
|
77.43
|
|
Plant Superintendent
|
1
|
33.96
|
64.53
|
|
General Foreman
|
1
|
27.17
|
51.62
|
|
Shift Foremen
|
4
|
54.34
|
103.25
|
|
Control Room Operators
|
5
|
39.62
|
75.28
|
|
Crushing Operators
|
5
|
33.96
|
64.53
|
|
Process Plant Operators
|
12
|
76.08
|
144.54
|
|
Reagent Operators
|
8
|
54.34
|
103.25
|
|
General Helpers
|
8
|
36.23
|
68.83
|
|
Smelter and Refinery Supervisor
|
1
|
13.58
|
25.81
|
|
Smelter and Refinery Operators
|
2
|
13.58
|
25.81
|
|
Shipping and Receiving Operators
|
2
|
18.11
|
34.42
|
|
Drivers – General Services
|
4
|
27.17
|
51.62
|
|
Total
|
55
|
548.15
|
1,041.49
|
|
21.2.3.2
|
Power Consumption
|
Electrical power requirements were estimated based on the installed equipment, operating hours, and expected power demand for the crushing circuit, process plant, and site infrastructure. Power costs were estimated using the electricity tariffs provided by Equatorial Energia.
The estimated annual power consumption and associated operating costs are summarized in Table 21.27.
Table 21.27 - Estimated Annual Power Consumption and Power Costs
|
Area
|
Operating Hours
per Year
|
Installed
Load (hp)
|
Installed Load
(kW)
|
Annual Power
Consumption (kWh)
|
Annual Cost
(US$ × 1,000)
|
|
Crushing
|
5,694.00
|
1,221.50
|
916.13
|
5,216,415.75
|
492.11
|
|
Process Plant
|
7,709.00
|
9,248.00
|
6,936.00
|
53,469,624.00
|
5,044.30
|
|
Site Infrastructure
|
2,400.00
|
200
|
150
|
360,000.00
|
33.96
|
|
Total
|
–
|
–
|
–
|
59,046,039.75
|
5,570.38
|
BNA Mining Solutions - R. Des. Leão Starling, 200 - Ouro Preto, BH - MG, 31310-370 – Phone: +55 (31) 2514-8733 – E-mail: info@bnaconsultoria.com
|
GoldMining Inc.
NI 43-101 Report – São Jorge Project
|
Page 277 |
|
21.2.3.3
|
Reagents and Grinding Media
|
Reagent consumption estimates were developed from metallurgical test work and process design criteria. Consumption rates were established for the principal reagents used in gold recovery, detoxification, thickening, and carbon adsorption circuits. Grinding media consumption was estimated based on ore characteristics, throughput, and comminution requirements.
The estimated annual consumption and costs of reagents and grinding media are summarized in Table 21.28.
Table 21.28 - Estimated Annual Reagent and Grinding Media Costs
|
Reagent / Consumable
|
Consumption Rate
|
Unit
|
Annual Cost (US$ × 1,000)
|
|
Sodium Cyanide (NaCN)
|
550
|
g/t ore
|
3,320.75
|
|
Sodium Hydroxide (NaOH)
|
1
|
g/cycle
|
37.74
|
|
Intensive Leach Aid (LeachAid)
|
2.5
|
kg/cycle
|
21.26
|
|
Activated Carbon
|
35
|
g/t ore
|
396.23
|
|
Hydrated Lime
|
1,830
|
g/t ore
|
414.34
|
|
Hydrochloric Acid (32% HCl)
|
125
|
g/t ore
|
94.34
|
|
Sodium Metabisulfite (Na₂S₂O₅)
|
900
|
g/t ore
|
1,358.49
|
|
Copper Sulfate (CuSO₄)
|
400
|
g/t ore
|
2,716.98
|
|
LPG / Natural Gas*
|
195,000
|
g/h
|
170.18
|
|
Flocculant (Two Thickeners)
|
40
|
g/t ore
|
188.68
|
|
Grinding Media (Mill Balls)
|
750
|
g/t ore
|
1,415.09
|
|
Total
|
10,134.08
|
|
21.2.3.4
|
Maintenance Materials and Other Operating Costs
|
Maintenance costs were estimated based on benchmark data from comparable operations and include spare parts, wear components, consumables, lubricants, and miscellaneous operating expenses required to support continuous plant operation.
The estimated annual maintenance and miscellaneous operating costs are summarized in Table 21.29.
Table 21.29 - Estimated Annual Maintenance and Other Process Plant Operating Costs
|
Cost Component
|
Annual Cost (US$ × 1,000/year)
|
|
Maintenance Materials, Spare Parts and Wear Components
|
2,764.97
|
|
Miscellaneous Operating Costs
|
188.68
|
|
Contracted Services
|
94.34
|
|
Lubricants and Greases
|
5.66
|
|
Total
|
3,053.65
|
BNA Mining Solutions - R. Des. Leão Starling, 200 - Ouro Preto, BH - MG, 31310-370 – Phone: +55 (31) 2514-8733 – E-mail: info@bnaconsultoria.com
|
GoldMining Inc.
NI 43-101 Report – São Jorge Project
|
Page 278 |
21.2.4 Administration, Infrastructure Maintenance and Other Costs
These costs include labour associated with administration, maintenance, quality control, camp operations, and site support services required for the operation of the São Jorge Project.
The estimate also includes general administrative expenses, camp and catering services, infrastructure maintenance, consumables, and miscellaneous operating costs associated with supporting mining and processing activities.
Annual administration, infrastructure maintenance, and other operating costs are estimated at approximately US$ 4.74 million during full production years (Years 1 to 10), decreasing to approximately US$ 2.70 million in Year 11 due to the reduced production rate during the final year of operation.
The estimated annual costs are summarized in Table 21.30.
BNA Mining Solutions - R. Des. Leão Starling, 200 - Ouro Preto, BH - MG, 31310-370 – Phone: +55 (31) 2514-8733 – E-mail: info@bnaconsultoria.com
|
GoldMining Inc.
NI 43-101 Report – São Jorge Project
|
Page 279 |
Table 21.30 - Estimated Annual Administration, Infrastructure Maintenance and Other Operating Costs
|
Item
|
Description
|
US$ M/year
|
|
Year 1
|
Year 2
|
Year 3
|
Year 4
|
Year 5
|
Year 6
|
Year 7
|
Year 8
|
Year 9
|
Year 10
|
Year 11
|
|
2
|
Administration, Infrastructure Maintenance and Other Costs
|
4.74
|
4.74
|
4.74
|
4.74
|
4.74
|
4.74
|
4.74
|
4.74
|
4.74
|
4.74
|
2.70
|
|
2.1
|
Personnel Costs
|
3.65
|
3.65
|
3.65
|
3.65
|
3.65
|
3.65
|
3.65
|
3.65
|
3.65
|
3.65
|
2.08
|
|
2.2
|
General Expenses and Miscellaneous Costs (Meals, Materials, Maintenance and Other Services)
|
1.09
|
1.09
|
1.09
|
1.09
|
1.09
|
1.09
|
1.09
|
1.09
|
1.09
|
1.09
|
0.62
|
BNA Mining Solutions - R. Des. Leão Starling, 200 - Ouro Preto, BH - MG, 31310-370 – Phone: +55 (31) 2514-8733 – E-mail: info@bnaconsultoria.com
|
GoldMining Inc.
NI 43-101 Report – São Jorge Project
|
Page 280 |
The personnel cost estimate includes administration and support personnel, quality control personnel, mechanical and electrical maintenance personnel, and camp and catering personnel. The estimated workforce and annual personnel costs are summarized in Table 21.31.
Table 21.31 - Administration, Maintenance, Quality Control and Camp Personnel Costs
|
Item
|
Position
|
Total Personnel
|
Annual Cost (US$
× 1,000)
|
|
2
|
Administration and Support
|
|
|
|
General Manager
|
1
|
172.08
|
|
Administrative Manager
|
1
|
86.04
|
|
Administrative Assistants
|
2
|
34.42
|
|
Human Resources Manager
|
1
|
51.62
|
|
Human Resources Assistants
|
2
|
34.42
|
|
Supply Chain Manager
|
1
|
51.62
|
|
Buyers
|
3
|
64.53
|
|
Driver – General Services
|
1
|
12.91
|
|
Security Supervisor
|
1
|
34.42
|
|
Security Technicians
|
4
|
86.04
|
|
IT Technician
|
1
|
21.51
|
|
General Services Supervisor
|
1
|
30.11
|
|
Cleaning Assistants
|
2
|
21.51
|
|
Environmental Technician
|
1
|
25.81
|
|
Environmental Assistants
|
2
|
21.51
|
|
Occupational Physician (Part-Time)
|
1
|
25.81
|
|
Nurses
|
2
|
43.02
|
| |
Subtotal – Administration and Support
|
27
|
817.36
|
|
3
|
Quality Control
|
|
|
|
Laboratory Supervisor – Chemist
|
1
|
6.45
|
|
Chemical Technicians
|
3
|
7.74
|
|
Laboratory Assistants
|
4
|
5.16
|
|
Samplers
|
5
|
6.45
|
| |
Subtotal – Quality Control
|
13
|
25.81
|
|
4
|
Mechanical and Electrical Maintenance
|
|
|
|
Maintenance Manager
|
1
|
10.75
|
|
Mechanical Supervisor
|
1
|
6.45
|
|
Mechanical Technicians – Light and Heavy Vehicles
|
3
|
6.45
|
|
Mechanical Helpers
|
7
|
9.03
|
|
Welders
|
2
|
3.44
|
|
Lubricators
|
5
|
6.45
|
|
Tire Technicians
|
2
|
2.58
|
|
Tire Technician Helper
|
1
|
0.86
|
|
Electrical and Instrumentation Supervisor
|
1
|
6.45
|
|
Electrician Technicians
|
2
|
4.3
|
|
Automation Technician
|
1
|
2.15
|
BNA Mining Solutions - R. Des. Leão Starling, 200 - Ouro Preto, BH - MG, 31310-370 – Phone: +55 (31) 2514-8733 – E-mail: info@bnaconsultoria.com
|
GoldMining Inc.
NI 43-101 Report – São Jorge Project
|
Page 281 |
|
Item
|
Position
|
Total Personnel
|
Annual Cost (US$
× 1,000)
|
| |
Electrician Helpers
|
5
|
6.45
|
|
Storekeepers
|
2
|
5.16
|
|
Storekeeper Helpers
|
5
|
6.45
|
|
General Labourers
|
5
|
4.73
|
|
Vehicle Drivers
|
2
|
2.58
|
| |
Subtotal – Mechanical and Electrical Maintenance
|
45
|
84.32
|
|
5
|
Camp and Catering Services
|
|
|
|
Camp Manager
|
1
|
5.16
|
|
Purchasing Assistant
|
1
|
1.72
|
|
Bricklayer
|
1
|
1.72
|
|
Carpenter
|
1
|
1.72
|
|
General Services Personnel
|
4
|
4.3
|
|
Laundry Personnel
|
2
|
2.58
|
|
Canteen Attendant
|
1
|
1.29
|
|
Cleaners
|
4
|
3.79
|
|
Kitchen Manager
|
1
|
4.3
|
|
Nutritionist
|
1
|
3.01
|
|
Cooks
|
4
|
6.02
|
|
Kitchen Assistants
|
10
|
9.46
|
|
Drivers – General Services
|
2
|
2.15
|
| |
Subtotal – Camp and Catering Services
|
33
|
47.23
|
BNA Mining Solutions - R. Des. Leão Starling, 200 - Ouro Preto, BH - MG, 31310-370 – Phone: +55 (31) 2514-8733 – E-mail: info@bnaconsultoria.com
|
GoldMining Inc.
NI 43-101 Report – São Jorge Project
|
Page 282 |
This preliminary economic assessment is preliminary in nature, and there is no certainty that the reported results will be realized. The Mineral Resource estimate used for the PEA includes Inferred Mineral Resources which are considered too speculative geologically to have the economic considerations applied to them that would enable them to be categorized as Mineral Reserves, and there is no certainty that the projected economic performance will be realized. The basis of the PEA is to demonstrate the economic viability of the São Jorge Project, and the results are only intended as an initial, first-pass review of the Project economics based on preliminary information. Mineral Resources are not Mineral Reserves and do not have demonstrated economic viability. There is no certainty that all or any part of the Mineral Resources estimated will be converted into Mineral Reserves.
The economic evaluation for the São Jorge Project was completed based on technical information developed by BNA Mining Solutions and GMI.
The analysis was prepared on an annual basis and reflects the level of accuracy associated with a Preliminary Economic Assessment. The economic model incorporates the production schedule, capital expenditures, operating costs, metallurgical recovery, taxation, royalties, and other project-specific assumptions.
All costs and revenues are presented in United States dollars (US$).
|
22.1
|
Principal Assumptions
|
The economic analysis was developed using the mine production schedule presented in Section 16, the process recovery assumptions presented in Section 17, the infrastructure requirements described in Section 18, and the capital and operating cost estimates presented in Sections 21.1 and 21.2.
Key assumptions adopted in the economic evaluation include:
| |
●
|
Mine life of 10.6 years;
|
| |
●
|
Process plant throughput of approximately 2.0 Mtpa;
|
| |
●
|
Average feed grade of approximately 0.91 g/t Au;
|
| |
●
|
Average gold recovery of 90%;
|
| |
●
|
Total payable gold production of approximately 540.5 koz;
|
| |
●
|
Gold price assumption of US$ 3,500/oz;
|
| |
●
|
Exchange rate of US$1.00 = R$5.30;
|
| |
●
|
Discount rate of 5% per annum;
|
| |
●
|
Gold payability: 99.5%;
|
| |
●
|
Initial capital expenditure of US$ 202.2 million;
|
| |
●
|
Sustaining capital expenditure of US$ 53.0 million;
|
| |
●
|
Mine closure cost of US$ 15.0 million (including US$ 3.0 million contingency).
|
The economic model was developed on an ungeared basis and assumes 100% equity financing.
BNA Mining Solutions - R. Des. Leão Starling, 200 - Ouro Preto, BH - MG, 31310-370 – Phone: +55 (31) 2514-8733 – E-mail: info@bnaconsultoria.com
|
GoldMining Inc.
NI 43-101 Report – São Jorge Project
|
Page 283 |
22.2 Cashflow Forecasts and Annual Production Forecasts
Annual production and cash flow forecasts were developed based on the Life of Mine production schedule.
The economic model incorporates annual production, revenues, operating costs, royalties, taxes, capital expenditures, and working capital requirements over the LOM.
The Project is expected to generate strong operating margins throughout the operating period, with EBITDA margins ranging from approximately 70% to 79%.
The annual production and cash flow forecasts are summarized in Table 22.1.
22.3 Taxes, Royalties and Other Interests
As described in the following sections, the Project is subject to applicable Brazilian taxes, royalties, and contractual obligations, including:
| |
●
|
Federal corporate income tax (IRPJ);
|
| |
●
|
Social Contribution on Net Profit (CSLL);
|
| |
●
|
Financial Compensation for the Exploitation of Mineral Resources (CFEM);
|
| |
●
|
Mining Activity Inspection, Monitoring and Control Fee (TFRM-PA); and
|
| |
●
|
Finder’s fee payable under the applicable contractual arrangements (“Finder’s Fee”).
|
22.3.1 Federal Income Tax
Income taxes were estimated based on the fiscal assumptions incorporated into the Project's financial model.
The Project is located within the area of operation of the Superintendence for the Development of the Amazon (“SUDAM”) and is assumed to qualify for the regional tax incentive program applicable to eligible mining projects.
Accordingly, Brazilian federal corporate income tax (“IRPJ”) was applied at an effective rate of 6.25%, reflecting a 75% reduction from the standard 25% IRPJ rate.
In addition, the Social Contribution on Net Profit (“CSLL”) was applied at a rate of 9.0% of taxable income.
The combined effective income tax rate adopted in the economic model is therefore 15.25%.
The estimated annual income tax and CSLL expenses are presented in Table 22.1.
BNA Mining Solutions - R. Des. Leão Starling, 200 - Ouro Preto, BH - MG, 31310-370 – Phone: +55 (31) 2514-8733 – E-mail: info@bnaconsultoria.com
|
GoldMining Inc.
NI 43-101 Report – São Jorge Project
|
Page 284 |
22.3.2 Mining Royalties
The Financial Compensation for the Exploitation of Mineral Resources (“CFEM”) is a royalty payable to the Brazilian federal government.
For gold operations, CFEM is levied at a rate of 1.5 % of gross revenue, net of applicable taxes.
The Project is also subject to the Mining Activity Inspection, Monitoring and Control Fee (“TFRM-PA”), established by the State of Pará.
22.3.3 Other Taxes
No costs associated with the Social Integration Program and Contribution for Social Security Financing (“PIS/COFINS”), the Tax on Circulation of Goods and Services (“ICMS”), or the Tax on Financial Operations (“IOF”) were included in the Project's financial model.
PIS and COFINS are federal taxes levied on the gross revenue of Brazilian companies. For the Project, these taxes were assumed to be zero because revenues are based on the export of gold products. Under current Brazilian tax legislation, export revenues are exempt from PIS and COFINS.
ICMS is a state value-added tax applied to the circulation of goods, transportation services, and communication services. In accordance with the Brazilian Constitution and Complementary Law No. 87/1996 (Lei Kandir), exports of mineral products are exempt from ICMS. Therefore, no ICMS charges were considered in the economic analysis.
IOF is a federal tax levied on financial transactions, including loans, foreign exchange transactions, insurance, and securities transactions. IOF was not considered in the economic analysis because the financial model was prepared on an ungeared basis and assumes 100% equity financing, with no debt financing or other taxable financial operations.
These assumptions are consistent with the level of detail and accuracy associated with a Preliminary Economic Assessment and should be confirmed during subsequent phases of project development.
22.4 Economic Analysis
The economic evaluation was prepared on an ungeared basis and assumes 100% equity financing.
The financial model incorporates annual production forecasts, revenues, operating costs, royalties, taxes, capital expenditures, and working capital requirements over the Life of Mine.
The Project is expected to generate strong operating margins throughout the operating period.
The key economic indicators demonstrate robust project economics under the base case assumptions, including a gold price of US$ 3,500/oz Au.
BNA Mining Solutions - R. Des. Leão Starling, 200 - Ouro Preto, BH - MG, 31310-370 – Phone: +55 (31) 2514-8733 – E-mail: info@bnaconsultoria.com
|
GoldMining Inc.
NI 43-101 Report – São Jorge Project
|
Page 285 |
On a pre-tax basis, the Project generates a Net Present Value (“NPV”), discounted at 5%, of approximately US$ 645.7 million and an Internal Rate of Return (“IRR”) of 48.9%.
On an after-tax basis, the Project generates an NPV, discounted at 5%, of approximately US$ 532.5 million and an IRR of 42.4%.
The estimated payback period is approximately 2.83 years on a pre-tax basis, measured from the commencement of commercial production.
The annual production forecasts, revenues, operating costs, taxation, capital expenditures, and cash flow projections are summarized in Table 22.1.
BNA Mining Solutions - R. Des. Leão Starling, 200 - Ouro Preto, BH - MG, 31310-370 – Phone: +55 (31) 2514-8733 – E-mail: info@bnaconsultoria.com
|
GoldMining Inc.
NI 43-101 Report – São Jorge Project
|
Page 286 |
Table 22.1 - Annual Production and Cash Flow Forecast
|
Item
|
Description
|
Unit
|
Pre-Production Period
|
Operating Period
|
Year
|
|
-1
|
0
|
1
|
2
|
3
|
4
|
5
|
6
|
7
|
8
|
9
|
10
|
11
|
12
|
13
|
|
1
|
Production
|
|
|
|
|
|
|
|
|
|
|
|
|
|
|
|
|
|
|
|
1.1
|
Production
|
103 Oz
|
|
543.2
|
|
|
46
|
58.5
|
56.6
|
56.5
|
49.5
|
48.4
|
48.4
|
48.4
|
50.9
|
50.9
|
29.1
|
|
|
| |
Payability
|
|
|
540.5
|
|
|
45.7
|
58.2
|
56.3
|
56.2
|
49.2
|
48.2
|
48.2
|
48.2
|
50.6
|
50.6
|
28.9
|
|
|
|
2
|
Revenue
|
|
|
|
|
|
|
|
|
|
|
|
|
|
|
|
|
|
|
|
2.3
|
Total Revenue
|
106 USD
|
|
1891.9
|
|
|
160.1
|
203.7
|
197
|
196.8
|
172.3
|
168.7
|
168.7
|
168.7
|
177.2
|
177.2
|
101.3
|
|
|
|
3
|
Total Cost
|
|
|
|
|
|
49
|
54.6
|
57.3
|
58.6
|
58.5
|
64.7
|
64.7
|
64.7
|
64.9
|
64.9
|
37
|
|
|
|
3.1
|
Operating Cost (on-site)
|
106 USD
|
|
635.7
|
|
|
48.8
|
54.3
|
57
|
58.2
|
58.2
|
64.4
|
64.4
|
64.4
|
64.6
|
64.6
|
36.8
|
|
|
| |
Operating Cost (off-site)
|
106 USD
|
|
3.3
|
|
|
0.3
|
0.4
|
0.3
|
0.3
|
0.3
|
0.3
|
0.3
|
0.3
|
0.3
|
0.3
|
0.2
|
|
|
|
4
|
EBTIDA
|
106 USD
|
|
|
|
|
111.1
|
149.1
|
139.7
|
138.2
|
113.8
|
104
|
104
|
104
|
112.3
|
112.3
|
64.3
|
|
|
|
%
|
|
|
|
|
69%
|
73%
|
71%
|
70%
|
66%
|
62%
|
62%
|
62%
|
63%
|
63%
|
63%
|
|
|
|
5
|
Royalty
|
106 USD
|
|
37.8
|
|
|
3.2
|
4.1
|
3.9
|
3.9
|
3.4
|
3.4
|
3.4
|
3.4
|
3.5
|
3.5
|
2
|
|
|
|
6
|
PIS/COFINS
|
106 USD
|
|
|
|
|
0
|
0
|
0
|
0
|
0
|
0
|
0
|
0
|
0
|
0
|
0
|
|
|
|
7
|
ICMS
|
106 USD
|
|
|
|
|
0
|
0
|
0
|
0
|
0
|
0
|
0
|
0
|
0
|
0
|
0
|
|
|
|
8
|
IOF
|
106 USD
|
|
|
|
|
0
|
0
|
0
|
0
|
0
|
0
|
0
|
0
|
0
|
0
|
0
|
|
|
|
9
|
TFRM-PA
|
106 USD
|
|
31.9
|
|
|
2.7
|
3.4
|
3.3
|
3.3
|
2.9
|
2.8
|
2.8
|
2.8
|
3
|
3
|
1.7
|
|
|
|
10
|
Operating Income
|
106 USD
|
|
|
|
|
105.2
|
141.6
|
132.4
|
131
|
107.5
|
97.8
|
97.8
|
97.8
|
105.8
|
105.8
|
60.5
|
|
|
|
11
|
CFEM (Mining Royalty)
|
106 USD
|
|
17.7
|
|
|
1.6
|
2.1
|
2
|
2
|
1.6
|
1.5
|
1.5
|
1.5
|
1.6
|
1.6
|
0.9
|
|
|
|
12
|
Depreciation and Amortization
|
106 USD
|
|
|
|
|
20.2
|
20.2
|
20.2
|
20.2
|
20.2
|
20.2
|
20.2
|
20.2
|
20.2
|
20.2
|
0
|
|
|
|
13
|
Earnings Before Tax (EBT)
|
106 USD
|
|
|
|
|
83.4
|
119.3
|
110.2
|
108.8
|
85.6
|
76.1
|
76.1
|
76.1
|
84
|
84
|
59.6
|
|
|
|
14
|
Income Tax
|
106 USD
|
|
60.2
|
|
|
5.2
|
7.5
|
6.9
|
6.8
|
5.4
|
4.8
|
4.8
|
4.8
|
5.2
|
5.2
|
3.7
|
|
|
|
15
|
Social Contribution Tax (CSLL)
|
106 USD
|
|
86.7
|
|
|
7.5
|
10.7
|
9.9
|
9.8
|
7.7
|
6.9
|
6.9
|
6.9
|
7.6
|
7.6
|
5.4
|
|
|
|
16
|
Net Income
|
106 USD
|
|
|
|
|
70.7
|
101.1
|
93.4
|
92.2
|
72.6
|
64.5
|
64.5
|
64.5
|
71.2
|
71.2
|
50.5
|
|
|
|
17
|
Depreciation and Amortization
|
106 USD
|
|
|
|
|
20.2
|
20.2
|
20.2
|
20.2
|
20.2
|
20.2
|
20.2
|
20.2
|
20.2
|
20.2
|
0
|
|
|
|
18
|
Initial Capital (Initial CAPEX)
|
106 USD
|
202.2
|
|
39.4
|
162.8
|
|
|
|
|
|
|
|
|
|
|
|
|
|
|
19
|
Sustaining Capital (Sustaining CAPEX)
|
106 USD
|
|
50
|
|
|
0
|
5.5
|
3.6
|
7.5
|
6.3
|
7.6
|
1.1
|
7.9
|
10.5
|
|
|
|
|
|
20
|
Residual Value
|
106 USD
|
|
|
|
|
|
|
|
|
|
|
|
|
|
|
|
|
|
BNA Mining Solutions - R. Des. Leão Starling, 200 - Ouro Preto, BH - MG, 31310-370 – Phone: +55 (31) 2514-8733 – E-mail: info@bnaconsultoria.com
|
GoldMining Inc.
NI 43-101 Report – São Jorge Project
|
Page 287 |
|
Item
|
Description
|
Unit
|
Pre-Production Period
|
Operating Period
|
Year
|
|
-1
|
0
|
1
|
2
|
3
|
4
|
5
|
6
|
7
|
8
|
9
|
10
|
11
|
12
|
13
|
|
21
|
Mine Closure Cost
|
106 USD
|
|
15.0
|
|
|
|
|
|
|
|
|
|
|
|
0.82
|
3.82
|
6.98
|
3.39
|
|
22
|
Working Capital
|
106 USD
|
|
|
|
|
12.2
|
|
|
|
|
|
|
|
|
|
-12.2
|
|
|
|
23
|
Cash Flow Pre Tax
|
106 USD
|
|
|
-39
|
-163
|
91
|
134
|
127
|
121
|
100
|
89
|
95
|
89
|
94
|
103
|
68
|
|
|
|
24
|
Cash Flow After Tax
|
106 USD
|
|
|
-39
|
-163
|
79
|
116
|
110
|
105
|
87
|
77
|
84
|
77
|
81
|
91
|
59
|
|
|
|
25
|
Pre-Tax NPV at 5% p.a.
|
106 USD
|
|
|
646
|
|
|
|
|
|
|
|
|
|
|
|
|
|
|
|
26
|
IRR (Internal Rate of Return) Pre Tax
|
%
|
|
|
49%
|
|
|
|
|
|
|
|
|
|
|
|
|
|
|
|
27
|
After-Tax NPV at 5% p.a.
|
106 USD
|
|
|
532
|
|
|
|
|
|
|
|
|
|
|
|
|
|
|
|
28
|
IRR (Internal Rate of Return) After Tax
|
%
|
|
|
42%
|
|
|
|
|
|
|
|
|
|
|
|
|
|
|
|
29
|
Payback Period
|
years
|
|
|
2.83
|
|
|
|
|
|
|
|
|
|
|
|
|
|
|
BNA Mining Solutions - R. Des. Leão Starling, 200 - Ouro Preto, BH - MG, 31310-370 – Phone: +55 (31) 2514-8733 – E-mail: info@bnaconsultoria.com
|
GoldMining Inc.
NI 43-101 Report – São Jorge Project
|
Page 288 |
22.4.1 Leverage to Gold Price
In addition to the base case economic evaluation prepared using a gold price assumption of US$ 3,500/oz Au, a supplementary analysis was completed to evaluate the Project's exposure to higher gold prices.
The leverage case was prepared using a gold price assumption of US$ 4,400/oz Au, representing an increase of approximately 26% relative to the base case gold price.
All technical and economic assumptions used in the leverage case remain unchanged from the base case, including the mine plan, production schedule, metallurgical recovery assumptions, capital costs, operating costs, taxation regime, royalties, and discount rate.
Under the leverage case assumptions, the Project demonstrates a substantial improvement in economic performance.
On a pre-tax basis, the Project generates an NPV, discounted at 5%, of approximately US$ 1,004.8 million and an IRR of 67.3%.
On an after-tax basis, the Project generates an NPV, discounted at 5%, of approximately US$ 836.8 million and an IRR of 58.6%.
The estimated payback period is approximately 1.57 years on an after-tax basis, measured from the commencement of commercial production.
The results highlight the strong leverage of the São Jorge Project to increases in the gold price and demonstrate the potential for significant value enhancement under higher gold price environments.
The leverage case is presented for illustrative purposes only and does not constitute the base case economic evaluation for this PEA.
22.5 Project Sensitivity Analysis
A sensitivity analysis was conducted to evaluate the impact of changes in key economic assumptions on the after-tax NPV of the São Jorge Project.
The base case assumes a long-term gold price of US$ 3,500/oz Au and an after-tax NPV, discounted at 5%, of US$ 532 million, which was used as the reference value for the sensitivity analyses presented in this section.
22.5.1 One-Variable Sensitivity Analysis
The one-variable sensitivity analysis considered individual variations of ±30% relative to the base case assumptions while maintaining all other parameters constant.
| |
●
|
The following parameters were evaluated:
|
BNA Mining Solutions - R. Des. Leão Starling, 200 - Ouro Preto, BH - MG, 31310-370 – Phone: +55 (31) 2514-8733 – E-mail: info@bnaconsultoria.com
|
GoldMining Inc.
NI 43-101 Report – São Jorge Project
|
Page 289 |
| |
●
|
Initial capital expenditure (“CAPEX”);
|
| |
●
|
Operating costs (“OPEX”); and
|
For each parameter, values were varied individually from -30% to +30% relative to the base case assumptions, while all other variables remained unchanged.
For gold price, the evaluated range corresponds to gold prices from US$ 2,450/oz Au to US$ 4,400/oz Au, with US$ 3,500/oz Au representing the base case and US$ 4,400/oz Au representing an additional leverage case.
The results of the one-variable sensitivity analysis are summarized in Table 22.2 and illustrated in Figure 22.1.
Table 22.2 - Sensitivity Analysis of After-Tax NPV (5%) to Variations in CAPEX, OPEX and Gold Price
|
Variation from Base Case
|
NPV (US$M)
|
|
Initial CAPEX
|
Operating Costs
|
Gold Price
|
|
-30%
|
586
|
653
|
177
|
|
-20%
|
568
|
613
|
296
|
|
-10%
|
550
|
573
|
414
|
|
0%
|
532
|
532
|
532
|
|
10%
|
515
|
492
|
651
|
|
20%
|
497
|
452
|
769
|
|
30%
|
479
|
412
|
887
|
BNA Mining Solutions - R. Des. Leão Starling, 200 - Ouro Preto, BH - MG, 31310-370 – Phone: +55 (31) 2514-8733 – E-mail: info@bnaconsultoria.com
|
GoldMining Inc.
NI 43-101 Report – São Jorge Project
|
Page 290 |
Figure 22.1 - Sensitivity of After-Tax NPV (5%) to Changes in CAPEX, OPEX and Gold Price
The results indicate that the Project is most sensitive to changes in gold price, followed by operating costs and initial capital expenditures.
The higher sensitivity to gold price reflects the direct impact of revenue variations throughout the entire mine life. Operating costs represent the second most influential variable, as recurring expenditures directly affect operating margins during all years of production.
Initial capital expenditures have a comparatively lower impact because these costs are concentrated during the project development phase, whereas revenues and operating costs influence cash flows over the full operating period.
22.5.2 Two-Variable Sensitivity Analysis
To complement the one-variable sensitivity analysis, two-dimensional sensitivity matrices were prepared to evaluate the combined impact of simultaneous changes in key economic assumptions.
The combined sensitivity analysis considered gold prices ranging from US$ 2,450/oz Au to US$ 4,400/oz Au. These gold price scenarios were evaluated in combination with variations of ±30% in operating costs and initial capital expenditures.
This approach allows the Project's after-tax NPV to be assessed under a range of combined upside and downside scenarios, including adverse conditions such as lower gold prices combined with higher operating costs or higher initial capital expenditures.
Table 22.3 presents the combined sensitivity of after-tax NPV to changes in gold price and OPEX.
BNA Mining Solutions - R. Des. Leão Starling, 200 - Ouro Preto, BH - MG, 31310-370 – Phone: +55 (31) 2514-8733 – E-mail: info@bnaconsultoria.com
|
GoldMining Inc.
NI 43-101 Report – São Jorge Project
|
Page 291 |
Table 22.3 - Two-Variable Sensitivity of After-Tax NPV (5%): Gold Price versus OPEX (US$ million)
|
NPV Heat Map – Gold Price vs Operating Costs (US$ M)
|
|
-30%
|
-20%
|
-10%
|
0%
|
10%
|
20%
|
30%
|
Gold Price (USD/oz)
|
|
298
|
258
|
218
|
177
|
137
|
97
|
57
|
2,450
|
|
416
|
376
|
336
|
296
|
256
|
215
|
175
|
2,800
|
|
535
|
494
|
454
|
414
|
374
|
334
|
294
|
3,150
|
|
653
|
613
|
573
|
532
|
492
|
452
|
412
|
3,500
|
|
771
|
731
|
691
|
651
|
611
|
570
|
530
|
3,850
|
|
890
|
849
|
809
|
769
|
729
|
689
|
649
|
4,200
|
|
957
|
917
|
877
|
837
|
797
|
756
|
716
|
4,400
|
The combined sensitivity analysis demonstrates the Project's resilience under the range of scenarios evaluated.
The most adverse scenario corresponds to a gold price of US$2,450/oz Au combined with a 30% increase in operating costs, while the most favourable scenario reflects a gold price of US$4,400/oz Au combined with a 30% reduction in operating costs.
Table 22.4 presents the combined sensitivity of after-tax NPV to changes in gold price and initial CAPEX.
Table 22.4 - Two-Variable Sensitivity of After-Tax NPV (5%): Gold Price versus Initial CAPEX (US$ million)
|
NPV Heat Map – Gold Price vs Initial CAPEX (US$ M)
|
|
-30%
|
-20%
|
-10%
|
0%
|
10%
|
20%
|
30%
|
Gold Price (USD/oz)
|
|
231
|
213
|
195
|
177
|
160
|
142
|
124
|
2,450
|
|
349
|
331
|
314
|
296
|
278
|
260
|
242
|
2,800
|
|
468
|
450
|
432
|
414
|
396
|
378
|
361
|
3,150
|
|
586
|
568
|
550
|
532
|
515
|
497
|
479
|
3,500
|
|
704
|
686
|
669
|
651
|
633
|
615
|
597
|
3,850
|
|
823
|
805
|
787
|
769
|
751
|
733
|
716
|
4,200
|
|
890
|
872
|
855
|
837
|
819
|
801
|
783
|
4,400
|
The combined sensitivity between gold price and initial CAPEX confirms that gold price remains the dominant driver of Project economics.
Even under scenarios involving significant increases in initial capital expenditures, the Project maintains a positive after-tax NPV across the range of gold prices evaluated.
The sensitivity matrices indicate that the economic performance of the Project is primarily dependent on the long-term gold price assumption and, to a lesser extent, on operating costs and capital expenditures.
Table 22.5 summarizes the relative impacts of the evaluated variables on the after-tax NPV, while Figure 22.2 presents the corresponding tornado chart.
BNA Mining Solutions - R. Des. Leão Starling, 200 - Ouro Preto, BH - MG, 31310-370 – Phone: +55 (31) 2514-8733 – E-mail: info@bnaconsultoria.com
|
GoldMining Inc.
NI 43-101 Report – São Jorge Project
|
Page 292 |
Table 22.5 - Summary of the Impact of Key Variables on After-Tax NPV (5%)
|
Variable
|
Low Case
|
Low NPV
|
Base NPV
|
High NPV
|
Downside Impact
|
Upside Impact
|
Range
|
|
Gold Price
|
-30% price
|
177
|
532
|
887
|
-355
|
355
|
710
|
|
Operating Costs
|
+30% OPEX
|
412
|
532
|
653
|
-120
|
120
|
241
|
|
Initial CAPEX
|
+30% CAPEX
|
479
|
532
|
586
|
-54
|
54
|
107
|
Figure 22.2 - Tornado Chart of After-Tax NPV (5%) Sensitivity
The tornado chart confirms that gold price is the variable with the greatest influence on the Project's economic performance, followed by operating costs and initial capital expenditures.
Overall, the sensitivity analysis demonstrates that the São Jorge Project maintains a positive after-tax NPV under the range of scenarios evaluated, indicating a robust economic profile under the assumptions adopted in this Preliminary Economic Assessment.
Accordingly, the Project's economic performance is primarily dependent on maintaining favourable market conditions, particularly the long-term gold price assumption, together with effective operating cost control throughout the mine life.
BNA Mining Solutions - R. Des. Leão Starling, 200 - Ouro Preto, BH - MG, 31310-370 – Phone: +55 (31) 2514-8733 – E-mail: info@bnaconsultoria.com
|
GoldMining Inc.
NI 43-101 Report – São Jorge Project
|
Page 293 |
The São Jorge Project is located within a region that hosts several operating mines and advanced stage gold projects with geological characteristics broadly comparable to those observed at the Project.
Information related to these adjacent properties is publicly available and is presented herein solely to provide regional geological context. The Qualified Person (“QP”) has not relied upon such information in the preparation of this report and has not independently verified the data. Accordingly, this information should not be considered indicative of the mineralization, tonnage, grade, or economic potential of the São Jorge Project.
The Tocantinzinho Mine is located approximately 90 km northwest of the São Jorge Project. It is a conventional truck and shovel open pit operation with a processing capacity of approximately 13,000 tpd during the initial years of operation. The overall mine life is approximately 11 years, including a pre-production period (G Mining Ventures, 2022).
The following description is summarized from publicly available information, including disclosures by G Mining Ventures Corp. (GMIN, 2025).
Tocantinzinho is an intrusion-related gold deposit hosted in Paleoproterozoic granites of the south-central Amazon Craton. Mineralization is structurally controlled along a regional northwest-trending fault zone, which governs the emplacement of intrusions and associated gold mineralization. The deposit forms a sub-vertical, northwest-trending body approximately 900 m long and 150 m to 200 m wide, with mineralization defined to depths of approximately 450 m.
The deposit comprises a range of granitic phases, including quartz monzonite, syenite, alkali feldspar granite, and aplite. Mineralization is typically associated with fine vein networks of quartz, chlorite, sulfides, and calcite, developed along grain boundaries and interpreted to be related to late-stage magmatic-hydrothermal processes.
The Mineral Reserves and Mineral Resources for the Tocantinzinho Mine are summarized in Table 23.1 and Table 23.2, respectively.
The BNA Qualified Person (“QP”) has not relied upon information from adjacent properties in the preparation of this report and has not independently verified the information presented. This information is provided for regional context only and should not be considered indicative of the mineralization at the São Jorge Project.
BNA Mining Solutions - R. Des. Leão Starling, 200 - Ouro Preto, BH - MG, 31310-370 – Phone: +55 (31) 2514-8733 – E-mail: info@bnaconsultoria.com
|
GoldMining Inc.
NI 43-101 Report – São Jorge Project
|
Page 294 |
Table 23.1 - Summary of the Tocantinzinho Mine Mineral Reserves as at December 10, 2021
|
Classification
|
Tonnage
(000 t)
|
Grade
(g/t Au)
|
Contained Gold
(000 oz)
|
|
Proven
|
17,976
|
1.46
|
842
|
|
Probable
|
30,703
|
1.22
|
1,200
|
|
Total, Proven & Probable
|
48,676
|
1.31
|
2,042
|
Source: G Mining Ventures Corp. (2025), company website.
Notes:
| |
1.
|
CIM definitions were followed for Mineral Reserves.
|
| |
2.
|
Effective date of the estimate is December 10, 2021.
|
| |
3.
|
Mineral Reserves are estimated for a gold price of US$ 1,400/oz.
|
| |
4.
|
Mineral Reserve cut-off grade is 0.36 g Au/t for all materials.
|
| |
5.
|
A dilution skin of 1m was considered resulting in an average mining dilution of 5.5%.
|
| |
6.
|
Bulk density of ore is variable with an average of 2.67 t/m3.
|
| |
7.
|
The average strip ratio is 3.36:1.
|
| |
8.
|
Numbers may not add due to rounding.
|
Table 23.2 - Summary of the Tocantinzinho Mine Mineral Resources as at December 10, 2021
|
Classification
|
Tonnage
(000 t)
|
Grade
(g/t Au)
|
Contained Gold
(000 oz)
|
|
Measured
|
17,609
|
1.49
|
841
|
|
Indicated
|
29,073
|
1.30
|
1,211
|
|
Sub-total, Measured & Indicated
|
46,682
|
1.37
|
2,052
|
|
Inferred
|
791
|
0.90
|
23
|
Source: G Mining Ventures Corp. (2025), company website.
Notes:
| |
1.
|
Mineral Resources are not Mineral Reserves and do not have demonstrated economic viability.
|
| |
2.
|
All figures are rounded to reflect the relative accuracy of the estimates.
|
| |
3.
|
Assays were capped where appropriate.
|
| |
4.
|
Open pit Mineral Resources are reported at a cut-off grade of 0.30 g/t gold.
|
| |
5.
|
The cut-off grades are based on a gold price of US$ 1,600 per troy ounce and metallurgical recoveries of 78% and 90% for gold in saprolite and rock respectively.
|
23.2 Cuiú Cuiú Deposit
The Cuiú Cuiú Project is located approximately 115 km northwest of the São Jorge Project and approximately 25 km northwest of the Tocantinzinho Mine. The following description is summarized from publicly available information, including the Cuiú Cuiú Gold Project NI 43-101 Technical Report and Updated Pre-Feasibility Study prepared for Cabral Gold Inc. by Ausenco do Brasil Engenharia Ltda. and other report authors, with an effective date of July 29, 2025.
BNA Mining Solutions - R. Des. Leão Starling, 200 - Ouro Preto, BH - MG, 31310-370 – Phone: +55 (31) 2514-8733 – E-mail: info@bnaconsultoria.com
|
GoldMining Inc.
NI 43-101 Report – São Jorge Project
|
Page 295 |
The Cuiú Cuiú Gold Project is located within the Tapajós Mineral Province of the Amazon Craton. The property is underlain by Proterozoic basement rocks, including granite-gneiss formations, which are intruded by younger granitic and volcanic units. Gold mineralization is interpreted to be structurally controlled and related to deformation zones associated with the Trans-Amazonian Orogen, including the regional Tocantinzinho Trend Deformation Zone (“TTDZ”).
Gold mineralization at Cuiú Cuiú occurs in fresh basement rocks, weathered saprolite, and unconformable gold-bearing sedimentary or blanket-style material. Mineralization styles include quartz-sulphide veins, replacement zones, stockwork veining, breccia-hosted mineralization, and disseminated mineralization associated with hydrothermal alteration. Gold mineralization is commonly associated with sulphides, particularly pyrite. The Central, Moreira Gomes (“MG”), and Machichie deposits are the principal deposits included in the current Mineral Resource and Mineral Reserve estimates.
The Mineral Reserves and Mineral Resources for the Cuiú Cuiú Project are summarized in Table 23.3 and Table 23.4, respectively.
The BNA Qualified Person (“QP”) has not relied upon information from adjacent properties in the preparation of this report and has not independently verified the information presented. This information is provided for regional context only and should not be considered indicative of the mineralization, tonnage, grade, or economic potential of the São Jorge Project.
Table 23.3 - Summary of the Cuiú Cuiú Mineral Reserves as at July 23, 2025
|
Classification
|
Tonnage (000 t)
|
Grade (g/t Au)
|
Contained Gold (000 oz)
|
|
Proven
|
0
|
0
|
0
|
|
Probable
|
6,178
|
0.65
|
129
|
|
Total, Proven & Probable
|
6,178
|
0.65
|
129
|
Source: Ausenco et al., 2025.
Notes:
| |
1.
|
CIM (2014) definitions were followed for Mineral Reserves.
|
| |
2.
|
Mineral Reserves have an effective date of July 23, 2025.
|
| |
3.
|
The Qualified Person for the Mineral Reserve estimate is Bruno Yoshida Tomaselli, B.Sc., FAusIMM, an employee of Deswik.
|
| |
4.
|
Mineral Reserves are confined within optimized pit shells using a gold price, including refining costs, of US$ 2,220/oz Au.
|
| |
5.
|
Mineral Reserves include the MG, Central, and Machichie open pit deposits.
|
| |
6.
|
Numbers may not add due to rounding.
|
BNA Mining Solutions - R. Des. Leão Starling, 200 - Ouro Preto, BH - MG, 31310-370 – Phone: +55 (31) 2514-8733 – E-mail: info@bnaconsultoria.com
|
GoldMining Inc.
NI 43-101 Report – São Jorge Project
|
Page 296 |
Table 23.4 - Summary of the Cuiú Cuiú Mineral Resources as at July 23, 2025
|
Classification
|
Tonnage (000 t)
|
Grade (g/t Au)
|
Contained Gold (000 oz)
|
|
Indicated
|
13,557
|
0.5
|
216
|
|
Inferred
|
4,799
|
0.31
|
48
|
Source: Ausenco et al., 2025.
Notes:
| |
1.
|
Mineral Resources are reported at a cut-off grade of 0.1 g/t Au.
|
| |
2.
|
Mineral Resources have been prepared in accordance with NI 43-101.
|
| |
3.
|
The effective date of the Mineral Resource estimate is July 23, 2025, except for MG, which is quoted from the 2024 NI 43-101 Technical Report and Pre-Feasibility Study, with an effective date of October 9, 2024.
|
| |
4.
|
Central and Machichie Mineral Resources were estimated within pit shells using a US$ 2,600/oz Au gold price and a 0.1 g/t Au cut-off grade.
|
| |
5.
|
Mineral Resources are inclusive of Mineral Reserves.
|
| |
6.
|
Mineral Resources that are not Mineral Reserves do not have demonstrated economic viability.
|
| |
7.
|
The table does not include resources in the primary zone or in the PDM target.
|
| |
8.
|
Numbers may not add due to rounding.
|
23.3 Palito and São Chico Mines
The Palito and São Chico mines are located approximately 45 km northwest of the São Jorge Project. The following description is summarized from publicly available information, including Serabi (2023).
The deposits comprise a series of northwest–southeast trending, steeply dipping quartz-gold-copper veins hosted within granitic intrusive rocks and associated volcanic units. Gold mineralization is structurally controlled and occurs within mesothermal quartz-sulphide veins, typically associated with sulphides such as chalcopyrite and pyrite.
Mineralization is hosted in narrow, sub-vertical vein systems, generally averaging around one metre in width, with locally higher-grade zones associated with increased sulphide content. The deposits are interpreted as intrusion-related mesothermal gold systems, with mineralization styles including vein-hosted and structurally controlled zones.
The Mineral Reserves and Mineral Resources for the Palito and São Chico mines are summarized in Table 23.5 and Table 23.6, respectively.
The BNA Qualified Person (QP) has not relied upon information from adjacent properties in the preparation of this report and has not independently verified the information presented. This information is provided for regional context only and should not be considered indicative of the mineralization at the São Jorge Project.
BNA Mining Solutions - R. Des. Leão Starling, 200 - Ouro Preto, BH - MG, 31310-370 – Phone: +55 (31) 2514-8733 – E-mail: info@bnaconsultoria.com
|
GoldMining Inc.
NI 43-101 Report – São Jorge Project
|
Page 297 |
Table 23.5 - Summary of the Palito and São Chico Mines Mineral Reserves as at July 31, 2023
|
Classification
|
Tonnage
(000 t)
|
Grade
(g/t Au)
|
Contained Gold
(000 oz)
|
|
Palito
|
|
Proven
|
567.8
|
8.08
|
147.5
|
|
Probable
|
196.8
|
6.83
|
43.2
|
|
Total, Palito
|
764.6
|
7.76
|
190.8
|
|
São Chico
|
|
Proven
|
46.1
|
8.20
|
12.2
|
|
Probable
|
14.1
|
7.68
|
3.5
|
|
Total, São Chico
|
60.2
|
8.08
|
15.6
|
|
Palito Mining Complex
|
|
Proven
|
614.0
|
8.09
|
159.7
|
|
Probable
|
210.8
|
6.89
|
46.7
|
|
Total, Palito Mining Complex
|
824.8
|
7.78
|
206.4
|
Source: Serabi 2023.
Notes:
| |
1..
|
Mineral Reserves have been rounded to reflect the relative accuracy of the estimates. Proven Mineral Reserves are reported within the Measured classification domain, and Probable Mineral Reserves are reported within the Indicated classification domain.
|
| |
2.
|
Proven and Probable Mineral Reserves are inclusive of external mining dilution and mining loss and are reported at a COG of 4.0 g/t Au assuming an underground shrinkage mining scenario, and metallurgical recoveries of 93.2% for Palito and 93.8% for São Chico.
|
| |
3.
|
Serabi is the operator and owns 100% of the Palito Mine such that gross and net attributable mineral reserves are the same.
|
| |
4.
|
The mineral reserve estimate was prepared by the NCL in accordance with the standard of CIM and NI 43-101, with an effective date of July 31, 2023, and audited and approved by Mr. Carlos Guzmán of NCL, who is a Qualified Person under NI 43-101.
|
BNA Mining Solutions - R. Des. Leão Starling, 200 - Ouro Preto, BH - MG, 31310-370 – Phone: +55 (31) 2514-8733 – E-mail: info@bnaconsultoria.com
|
GoldMining Inc.
NI 43-101 Report – São Jorge Project
|
Page 298 |
Table 23.6 - Summary of the Palito and São Chico Mines Mineral Resources as of July 31, 2023
|
Classification
|
Tonnage
(000 t)
|
Grade
(g/t Au)
|
Contained Gold
(000 oz)
|
|
Palito
|
|
Measured
|
772.3
|
11.03
|
273.8
|
|
Indicated
|
243.0
|
8.39
|
65.6
|
|
Measured & Indicated
|
1,015.3
|
10.40
|
339.3
|
|
Inferred
|
674.2
|
7.02
|
152.2
|
|
São Chico
|
|
Measured
|
122.5
|
8.10
|
31.9
|
|
Indicated
|
28.5
|
7.07
|
6.5
|
|
Measured & Indicated
|
150.9
|
7.91
|
38.4
|
|
Inferred
|
8.2
|
6.53
|
1.7
|
Source: Serabi 2023.
Notes:
| |
1.
|
Mineral Resources are not Mineral Reserves and have not demonstrated economic viability.
|
| |
2.
|
Mineral Resources are reported inclusive of Mineral Reserves.
|
| |
3.
|
Figures are rounded to reflect the relative accuracy of the estimates.
|
| |
4.
|
Mineral Resources are reported within classification domains with no dilution applied at a COG of 3.32 g/t Au assuming an underground extraction scenario, a gold price of US$ 1,950/oz, metallurgical recovery of 95%, and an exchange rate of R$5.5/US$.
|
| |
5.
|
3D block model used for Resource estimates.
|
BNA Mining Solutions - R. Des. Leão Starling, 200 - Ouro Preto, BH - MG, 31310-370 – Phone: +55 (31) 2514-8733 – E-mail: info@bnaconsultoria.com
|
GoldMining Inc.
NI 43-101 Report – São Jorge Project
|
Page 299 |
|
24
|
Other Relevant Data and Information
|
This report has been prepared at a Preliminary Economic Assessment level and reflects the level of confidence appropriate for this stage of study. As such, the Project is subject to a number of uncertainties and risks that may materially impact the results.
Key sources of uncertainty include, but are not limited to, geological interpretation, geotechnical conditions, hydrogeological assumptions, metallurgical performance, operating cost estimates, and market conditions, including gold price assumptions.
The mine design, production schedule, and economic analysis are based on conceptual-level inputs and assumptions that will require further validation through additional technical studies and field investigations.
The Project includes Inferred Mineral Resources that are considered too speculative geologically to have economic considerations applied to them that would enable them to be categorized as Mineral Reserves. There is no certainty that the results of this assessment will be realized.
Further work is recommended to improve the level of confidence in the Project, including additional drilling, geotechnical investigations, metallurgical testing, and refinement of engineering designs.
BNA Mining Solutions - R. Des. Leão Starling, 200 - Ouro Preto, BH - MG, 31310-370 – Phone: +55 (31) 2514-8733 – E-mail: info@bnaconsultoria.com
|
GoldMining Inc.
NI 43-101 Report – São Jorge Project
|
Page 300 |
|
25
|
Interpretation and Conclusions
|
25.1 Interpretation
The São Jorge Project demonstrates the potential to support a technically feasible and economically viable open pit gold mining operation based on the assumptions and methodologies adopted in this Preliminary Economic Assessment (“PEA”).
The mine plan developed for this study contemplates a 10.6 year mine life and the processing of approximately 20.7 Mt of mineralized material at an average diluted grade of 0.91 g/t Au. The process plant is designed for a nominal throughput rate of approximately 2.0 Mtpa and an average metallurgical recovery of 90.0%.
The economic evaluation was prepared on an ungeared basis and assumes 100% equity financing. Using a base case gold price of US$ 3,500/oz Au, the Project generates an after-tax NPV, discounted at 5%, of approximately US$ 532 million and an after-tax IRR of 42.4%.
The Project exhibits significant leverage to increases in the gold price. Under a supplementary gold price scenario of US$ 4,400/oz Au, the after-tax NPV, discounted at 5%, increases to approximately US$ 837 million, demonstrating the Project's exposure to favourable market conditions.
The sensitivity analysis indicates that Project economics are most sensitive to changes in the gold price, followed by operating costs and initial capital expenditures.
The PEA is preliminary in nature and includes Inferred Mineral Resources that are considered too speculative geologically to have the economic considerations applied to them that would enable them to be categorized as Mineral Reserves. There is no certainty that the results of the PEA will be realized.
Risks and uncertainties that could affect the reliability of the PEA results include:
| |
●
|
inclusion of pit constrained Inferred Mineral Resources in the mine plan (approximately 20%),
|
| |
●
|
potential changes in metal prices and operating costs, and
|
| |
●
|
the need for additional technical and environmental studies
|
These risks could materially impact the economic viability of the project as currently envisioned.
25.2 Conclusions
Based on the results of this PEA, the Qualified Persons consider that the São Jorge Project warrants advancement to a Pre-Feasibility Study.
The results of the technical studies completed to date indicate that the Project has the potential to support a conventional open pit mining operation with processing by crushing, grinding, gravity concentration, cyanide leaching, carbon adsorption, and gold recovery by electrowinning.
The Project demonstrates robust economic performance under the base case assumptions and significant upside potential under higher gold price scenarios.
Further technical studies are recommended to reduce project uncertainties and improve the level of confidence in the engineering, cost estimates, and economic assumptions used in this PEA.
BNA Mining Solutions - R. Des. Leão Starling, 200 - Ouro Preto, BH - MG, 31310-370 – Phone: +55 (31) 2514-8733 – E-mail: info@bnaconsultoria.com
|
GoldMining Inc.
NI 43-101 Report – São Jorge Project
|
Page 301 |
The Qualified Persons recommend that additional technical studies to reduce technical uncertainty and support advancement of the Project toward a Pre-Feasibility Study (PFS).
The recommended work programs include:
Continue infill drilling program to upgrade pit constrained Inferred Mineral Resources to Indicated Mineral Resources and also test the deposit continuity at depth.
Complete additional geotechnical investigations to refine pit slope design criteria and review the geometric parameters adopted for pit optimization and operational pit design. Geotechnical investigation should also extend beneath the footprint of all planned infrastructure.
Complete hydrogeological investigations to evaluate the potential interaction between the final pit and the water table. Hydrogeological investigation to extend to the proposed tailings storage and waste rock storage facilities to inform stability determinations and designs.
Complete additional geometallurgical and metallurgical studies to improve understanding of metallurgical variability throughout the deposit.
Continue environmental baseline studies, permitting activities, and stakeholder engagement programs.
26.1 Recommended Future Investments
Table 26.1 summarizes the recommended work programs and associated order-of-magnitude cost estimates to advance the São Jorge Project to the PFS stage.
The estimated costs presented below are preliminary in nature and are intended solely to support future project planning. Actual expenditures may vary as the scope of work is refined.
BNA Mining Solutions - R. Des. Leão Starling, 200 - Ouro Preto, BH - MG, 31310-370 – Phone: +55 (31) 2514-8733 – E-mail: info@bnaconsultoria.com
|
GoldMining Inc.
NI 43-101 Report – São Jorge Project
|
Page 302 |
Table 26.1 - Recommended Work Program and Budget Estimate for Advancement to PFS
|
Recommended Activity
|
Objective
|
Estimated Cost (US$)
|
|
Infill and confirmation drilling
|
● Upgrade in-pit Inferred Mineral Resources to Indicated Mineral Resources.
● Test deposit continuity at depth.
|
2,300,000
|
|
Geotechnical drilling and laboratory testing
|
● Refine pit slope design criteria.
● Geotechnical investigation of footprint of key infrastructure.
|
1,000,000
|
|
Hydrogeological investigations
|
● Define groundwater conditions informing pit dewatering requirements and water management plans for the TSF.
|
750,000
|
|
Geometallurgical testwork
|
● Evaluate spatial variability and support mine-to-mill optimization.
● Geochemical characterization of waste rock and tailings.
|
750,000
|
|
Environmental baseline studies and permitting
|
● Support environmental licensing and permitting activities.
|
1,000,000
|
|
Total
|
|
5,800,000
|
BNA Mining Solutions - R. Des. Leão Starling, 200 - Ouro Preto, BH - MG, 31310-370 – Phone: +55 (31) 2514-8733 – E-mail: info@bnaconsultoria.com
|
GoldMining Inc.
NI 43-101 Report – São Jorge Project
|
Page 303 |
Agência Nacional de Mineração (ANM). 2022. Resolução ANM No. 95, de 7 de fevereiro de 2022. Consolida os atos normativos referentes à segurança de barragens de mineração. Brasília, Brazil.
Associação Brasileira de Normas Técnicas (ABNT). 2017. NBR 13028 – Mineração – Elaboração e apresentação de projeto de barragens para disposição de rejeitos, contenção de sedimentos e reservação de água – Requisitos. Rio de Janeiro, Brazil.
Associação Brasileira de Normas Técnicas (ABNT). 2024. NBR 13029 – Mineração – Estabilidade de taludes. Rio de Janeiro, Brazil.
Associação Brasileira de Normas Técnicas (ABNT). 2017. NBR 13030 – Mineração – Elaboração e apresentação de projeto de disposição de estéril em pilha. Rio de Janeiro, Brazil.
Ausenco do Brasil Engenharia Ltda. 2025. Cuiú Cuiú Gold Project NI 43-101 Technical Report and Updated Pre-Feasibility Study, Itaituba, Pará, Brazil. Prepared for Cabral Gold Inc. Effective date: July 29, 2025. Report date: September 10, 2025. Available at: https://cabralgold.com/wp-content/uploads/2025/12/Cui_-Cui_-Project-NI-43-101-Technical-Report-and-Updated-PFS_FINAL.pdf. Accessed June 26, 2026.
Barton, N., and Choubey, V. 1977. The shear strength of rock joints in theory and practice. Rock Mechanics, 10 (1–2): 1–54.
Bieniawski, Z.T. 1989. Engineering Rock Mass Classifications. John Wiley & Sons, New York, United States.
Brasil. 2010. Lei No. 12.334, de 20 de setembro de 2010. Institui a Política Nacional de Segurança de Barragens. Brasília, Brazil.
Canadian Dam Association (CDA). 2014. Technical Bulletin: Application of Dam Safety Guidelines to Mining Dams. Canadian Dam Association, Canada.
CIM. 2014. Canadian Institute of Mining, Metallurgy and Petroleum (“CIM”) Definition Standards for Mineral Resources and Mineral Reserves. Adopted by CIM Council on May 10, 2014, as amended on May 10, 2014.
Canadian Institute of Mining, Metallurgy and Petroleum (“CIM”). 2019. CIM Estimation of Mineral Resources and Mineral Reserves Best Practice Guidelines. CIM Standing Committee on Reserve Definitions. Montreal, Quebec, Canada.
Canadian Securities Administrators (“CSA”). 2011. National Instrument 43-101 – Standards of Disclosure for Mineral Projects. Canada.
Canadian Securities Administrators (“CSA”). 2011. Form 43-101F1 – Technical Report. Canada.
BNA Mining Solutions - R. Des. Leão Starling, 200 - Ouro Preto, BH - MG, 31310-370 – Phone: +55 (31) 2514-8733 – E-mail: info@bnaconsultoria.com
|
GoldMining Inc.
NI 43-101 Report – São Jorge Project
|
Page 304 |
Coffey Mining. 2010. Brazilian Gold Corporation – São Jorge Gold Project, Pará State, Brazil: National Instrument 43-101 First Technical Report. Prepared for Brazilian Gold Corporation.
Eletrobras. 2020. Critérios de Projeto Civil de Usinas Hidrelétricas – Ações Sísmicas e Parâmetros de Projeto. Rio de Janeiro, Brazil.
Global Tailings Review (“GTR”). 2020. Global Industry Standard on Tailings Management. International Council on Mining and Metals (“ICMM”), United Nations Environment Programme (UNEP), and Principles for Responsible Investment (“PRI”).
GMining Ventures. 2025. Tocantinzinho Project. Website visited on January 29, 2025. URL: https://gmin.gold/tocantinzinho/ .
G Mining Ventures Corp. 2021. NI 43-101 Technical Report – Tocantinzinho Gold Project, Pará, Brazil. Prepared for G Mining Ventures Corp.
G Mining Ventures Corp. 2022. Feasibility Study – NI 43-101 Technical Report, Tocantinzinho Gold Project, Pará, Brazil. Available on the G Mining Ventures Corp. website. Accessed January 29, 2025.
Goldfarb, R. J., Groves D. I., and Gardoll S. 2001. Orogenic Gold and Geologic Time: A Global Synthesis in Ore Geology Reviews 18.
GoldMining Inc. 2013. Relatório Final de Pesquisa Mineral – Projeto São Jorge (PA/SÃO JORGE/R001/2013). October 2013.
Hoek, E., and Bray, J.W. 1981. Rock Slope Engineering. 3rd edition. Institution of Mining and Metallurgy, London, United Kingdom.
Harron, G. 2006. Technical Report on São Jorge Project, Pará State, Brazil prepared for BrazMin Corp.
Hoek, E., Carranza-Torres, C., and Corkum, B. 2002. Hoek-Brown Failure Criterion – 2002 Edition. In: Proceedings of the North American Rock Mechanics Society and Tunnelling Association of Canada Conference (“NARMS-TAC”), Toronto, Ontario, Canada.
International Commission on Large Dams (“ICOLD”). 2016. Tailings Dams – Design, Construction and Operation. Bulletin 181. Paris, France.
International Society for Rock Mechanics (“ISRM”). 2007. The Complete ISRM Suggested Methods for Rock Characterization, Testing and Monitoring: 1974–2006. Compiled by R. Ulusay and J.A. Hudson. International Society for Rock Mechanics, Ankara, Turkey.
Markland, J.T. 1972. A Useful Technique for Estimating the Stability of Rock Slopes when the Rigid Wedge Slide Type of Failure is Expected. Imperial College, London, United Kingdom.
MPH Consulting. 2004. Qualifying Report on São Jorge Project, Pará State, Brazil, prepared for Resource Holdings and Investments.
BNA Mining Solutions - R. Des. Leão Starling, 200 - Ouro Preto, BH - MG, 31310-370 – Phone: +55 (31) 2514-8733 – E-mail: info@bnaconsultoria.com
|
GoldMining Inc.
NI 43-101 Report – São Jorge Project
|
Page 305 |
NASA. 2024. Terra. The EOS Flagship: URL: https://terra.nasa.gov/news/aster-digital-elevation-model-version-3-released .
Pedley, A. 2011. São Jorge Deposit – Description of Geology and Modelling. Internal report prepared for Brazilian Gold Corporation.
Rocscience Inc. 2024a. Slide2 – 2D Limit Equilibrium Analysis for Slopes: User Manual. Toronto, Ontario, Canada.
Rocscience Inc. 2024b. Dips, RocPlane and Swedge – User Manuals. Toronto, Ontario, Canada.
Serabi Gold plc. 2023. Palito Mining Complex, Pará State, Brazil: NI 43-101 Technical Report. Available on the Serabi Gold plc website. Accessed January 29, 2025.
SRK Consulting. 2008. Resource Estimate and Technical Report for the São Jorge Project, Brazil, prepared for BrazMin Corp.
SLR Consulting (Canada) Ltd. 2025. NI 43-101 Technical Report, São Jorge Project, Pará State, Brazil. Effective Date: January 28, 2025. Report Date: February 26, 2025. Prepared for GoldMining Inc.
Thompson, J.F.H., Sillitoe, R.H, Baker, T., Lang, J.R., and Mortensen, J.K. 1999. Intrusion-related gold mineralization associated with W-Sn provinces. Mineralium Deposita, 34:323-334
BNA Mining Solutions - R. Des. Leão Starling, 200 - Ouro Preto, BH - MG, 31310-370 – Phone: +55 (31) 2514-8733 – E-mail: info@bnaconsultoria.com