PAY VERSUS PERFORMANCE
The disclosure in this section shall not be deemed to be incorporated by reference into any prior or subsequent filing by Mesa under the Securities Act or the Exchange Act, except to the extent Mesa specifically incorporates it by reference therein.
Provided below is Mesa's “pay versus performance” disclosure as required pursuant to Item 402(v) of Regulation S-K promulgated under the Exchange Act.
Our Most Important Metrics Used for Linking Pay and Performance
As required by Item 402(v), below are the most important metrics the Compensation Committee used to link executive pay to performance for fiscal year 2026. Our stock price performance, as reflected by our relative TSR, directly impacts the vesting and value of the equity compensation awards we grant to executive officers. The other metrics below are used for purposes of determining payouts under either our executive annual cash incentive compensation program or our executive PSU program:
|
● |
Revenues or Revenues Growth; and |
|
● |
Adjusted Operating Income ("AOI"). |
Pay versus Performance Table
The table below shows compensation actually paid (as defined by the SEC in Item 402(v) of Regulation S-K) for our executives and our net income (loss) for the years shown in the table. For purposes of this discussion, our CEO is also referred to as our principal executive officer or “PEO” and our other Named Executive Officers are referred to as our “Non-PEO NEOs”:
| Value of Initial Fixed $100 Investment Based On: | ||||||||||||||||||||||||||||||||
|
Fiscal Year Ended March 31, |
Summary Compensation Table Total for PEO(1)(2) |
Compensation Actually Paid to PEO(1)(3) |
Average Summary Compensation Table Total for Non-PEO NEOs(1)(2) |
Average Compensation Actually Paid to Non-PEO NEOs(1)(3) |
Total Shareholder Return(4) |
Peer Group Total Shareholder Return(5) |
Net Income (Loss)(6) |
Adjusted Operating Income(7) |
||||||||||||||||||||||||
| 2026 | $ | 6,643,208 | $ | 516,197 | $ | 2,327,030 | $ | 1,320,028 | $ | 37.20 | $ | 35.09 | $ | 6,712,000 | $ | 59,650,000 | ||||||||||||||||
| 2025 | $ | 6,599,891 | $ | 7,940,385 | $ | 2,279,333 | $ | 2,645,565 | $ | 49.55 | $ | 32.86 | $ | (1,974,000) | $ | 54,005,000 | ||||||||||||||||
| 2024 | $ | 5,435,566 | $ | 78,000 | $ | 1,782,956 | $ | 1,100,784 | $ |
45.59 |
$ | 43.39 | $ | (254,246,000) | $ | 45,968,000 | ||||||||||||||||
| 2023 | $ | 5,190,371 | $ | (3,599,238 | ) | $ | 1,480,753 | $ | 544,787 | $ | 72.18 | $ | 45.74 | $ | 930,000 | $ | 44,679,000 | |||||||||||||||
|
2022 |
$ | 18,076,981 | $ | 16,814,532 | $ | 1,452,226 | $ | 1,785,085 | $ | 104.92 | $ | 66.08 | $ | 1,871,000 | $ | 37,899,000 | ||||||||||||||||
|
(1) |
NEOs included in these columns reflect the following individuals: |
| Year | PEO | Non-PEO NEOs |
| 2022 | Gary Owens | John Sakys, Brian Archbold, and Greg DiNoia |
| 2023 | Gary Owens | John Sakys, Brian Archbold, and Greg DiNoia |
| 2024 | Gary Owens | John Sakys and Brian Archbold |
| 2025 | Gary Owens | John Sakys and Brian Archbold |
| 2026 | Gary Owens | John Sakys and Brian Archbold |
|
(2) |
Amounts reflect Summary Compensation Table Total Pay for our NEOs for each corresponding year. |
|
| (3) | Compensation Actually Paid (CAP) has been calculated based on the requirements and methodology set forth in the applicable SEC rules (Item 402(v) of Regulation S-K). To calculate CAP for each of the years in the table above, the following amounts were deducted from and added to the total compensation numbers shown in the applicable Summary Compensation Tables (SCT): |
Reconciliation of Summary Compensation Table Total to Compensation Actually Paid
|
Fiscal Year |
||||||||||||||||||||||||||||||||||||||||
|
2026
|
2025 |
2024 |
2023 |
2022 |
||||||||||||||||||||||||||||||||||||
| (For PEO) | (Average For Non-PEO NEOs) |
(For PEO) |
(Average For Non-PEO NEOs) |
(For PEO) |
(Average For Non-PEO NEOs) |
(For PEO) |
(Average For Non-PEO NEOs) |
(For PEO) |
(Average For Non-PEO NEOs) |
|||||||||||||||||||||||||||||||
|
Summary Compensation Table Total |
$ | 6,643,208 | $ | 2,327,030 | $ | 6,599,891 | $ | 2,279,333 | $ | 5,435,566 | $ | 1,782,956 | $ | 5,190,371 | $ | 1,480,753 | $ | 18,076,981 | $ | 1,452,226 | ||||||||||||||||||||
|
(Minus): Grant Date Fair Value of Equity Awards Granted in the Fiscal Year |
(4,700,017 | ) | (1,475,115 | ) | (4,600,170 | ) | (1,425,252 | ) | (4,334,852 | ) | (1,234,991 | ) | (4,168,237 | ) | (865,766 | ) | (16,417,012 | ) | (848,551 | ) | ||||||||||||||||||||
|
(Minus): Change in Pension Value |
- | - | - | - | - | - | - | - | - | - | ||||||||||||||||||||||||||||||
|
Plus: Fair Value at Fiscal Year End of Outstanding and Unvested Equity Awards Granted in the Fiscal Year |
2,102,401 | 1,283,935 | 6,362,615 | 1,971,307 | 3,304,206 | 941,358 | 2,260,544 | 424,417 | 13,533,230 | 788,665 | ||||||||||||||||||||||||||||||
|
Plus/(Minus): Change in Fair Value of Outstanding and Unvested Equity Awards Granted in Prior Fiscal Years |
(2,554,763 | ) | (669,756 | ) | (366,380 | ) | (160,565 | ) | (3,690,852 | ) | (261,445 | ) | (5,202,624 | ) | (210,448 | ) | 555,610 | 159,474 | ||||||||||||||||||||||
|
Plus: Fair Value at Vesting of Equity Awards Granted and Vested in the Fiscal Year |
- | - | - | - | - | - | - | 45,816 | - | - | ||||||||||||||||||||||||||||||
|
Plus/(Minus): Change in Fair Value as of the Vesting Date of Equity Awards Granted in Prior Fiscal Years that Vested in the Fiscal Year |
(974,632 | ) | (146,066 | ) | (55,571 | ) | (19,258 | ) | (636,068 | ) | (127,094 | ) | (1,679,292 | ) | (329,985 | ) | 1,065,723 | 233,271 | ||||||||||||||||||||||
|
(Minus): Fair Value as of the Prior Fiscal Year End of Equity Awards Granted in Prior Fiscal Years that Failed to Meet Vesting Conditions in the Fiscal Year |
- | - | - | - | - | - | - | - | - | - | ||||||||||||||||||||||||||||||
|
Plus/(Minus): Value of Dividends or Other Earnings Paid on Equity Awards Not Otherwise Reflected in Total Compensation |
- | - | - | - | - | - | - | - | - | - | ||||||||||||||||||||||||||||||
|
Compensation Actually Paid |
$ | 516,197 | $ | 1,320,028 | $ | 7,940,385 | $ | 2,645,565 | $ | 78,000 | $ | 1,100,784 | $ | (3,599,238 | ) | $ | 544,787 | $ | 16,814,532 | $ | 1,785,085 | |||||||||||||||||||
For purposes of the above adjustments, the fair value of equity awards on the applicable date was determined in accordance with FASB’s ASC Topic 718, using valuation methodologies that are generally consistent with those used to determine the grant-date fair value for accounting purposes.
The table below contains ranges of assumptions used in the valuation of outstanding equity awards for the relevant fiscal year(s). For more information, please see the notes to our financial statements in our Annual Report on Form 10-K and the footnotes to the Summary Compensation Table of this proxy statement.
|
Fiscal Year 2026 |
|
|
Restricted Stock Units |
|
|
Stock Price |
$88.42 - $97.10 |
|
Performance Share Units |
|
|
Volatility |
58% - 61% |
|
Risk-Free Interest Rate |
3.6% - 3.7% |
| Stock Price | $76.89 - $97.10 |
| Dividend Yield | 0.74% |
|
Stock Options |
|
|
Expected Term (years) |
1.0 - 2.1 |
|
Strike Price |
$131.67 - $268.85 |
|
Volatility |
51% - 62% |
|
Dividend Yield |
0.6% - 0.7% |
|
Risk-Free Interest Rate |
3.6% - 4.0% |
|
(4) |
TSR represents the cumulative return on a fixed investment of $100 in Mesa's common stock, for the period beginning on the last trading day of fiscal year 2021 through the end of the applicable fiscal year, assuming reinvestment of dividends. |
|
(5) |
Peer Group TSR represents the cumulative return on a fixed investment of $100 in the same peer group considered by the Compensation Committee for purposes of establishing executive compensation targets for fiscal year 2026 (the 2026 compensation peer group, or CD&A peer group) for the period beginning on the last trading day of fiscal year 2021 through the end of the applicable fiscal year, assuming reinvestment of dividends. One peer from the fiscal year 2025 CD&A peer group, Harvard Bioscience, Inc., was not included in the fiscal year 2026 CD&A peer group. Additionally, the following companies were added to the CD&A peer group for 2026 as Mesa included additional peers in compensation benchmarking: |
|
o |
Pacific Biosciences of California, Inc.; and |
|
o |
Sotera Health, LLC |
The following table presents the total shareholder return of the fiscal year 2026 CD&A peer group and the fiscal year 2025 CD&A peer group.
|
|
Value of Initial Fixed $100 Investment Based On: |
||
| Fiscal Year Ended March 31, |
MLAB Total Shareholder Return |
FY26 CD&A Peer Group TSR |
FY25 CD&A Peer Group TSR |
| 2026 | $37.20 |
$35.09 |
$34.13 |
|
2025 |
$49.55 |
$32.86 |
$32.86 |
|
2024 |
$45.59 |
$43.39 |
$43.39 |
|
2023 |
$72.18 |
$45.74 |
$45.74 |
|
2022 |
$104.92 |
$66.08 |
$66.08 |
|
(6) |
The dollar amounts reported represent the net income reflected in Mesa's audited financial statements for the applicable year. |
|
| (7) | Mesa's adjusted operating income, a non-GAAP measure. See Appendix A. |
Reconciliation of Summary Compensation Table Total to Compensation Actually Paid
|
Fiscal Year |
||||||||||||||||||||||||||||||||||||||||
|
2026
|
2025 |
2024 |
2023 |
2022 |
||||||||||||||||||||||||||||||||||||
| (For PEO) | (Average For Non-PEO NEOs) |
(For PEO) |
(Average For Non-PEO NEOs) |
(For PEO) |
(Average For Non-PEO NEOs) |
(For PEO) |
(Average For Non-PEO NEOs) |
(For PEO) |
(Average For Non-PEO NEOs) |
|||||||||||||||||||||||||||||||
|
Summary Compensation Table Total |
$ | 6,643,208 | $ | 2,327,030 | $ | 6,599,891 | $ | 2,279,333 | $ | 5,435,566 | $ | 1,782,956 | $ | 5,190,371 | $ | 1,480,753 | $ | 18,076,981 | $ | 1,452,226 | ||||||||||||||||||||
|
(Minus): Grant Date Fair Value of Equity Awards Granted in the Fiscal Year |
(4,700,017 | ) | (1,475,115 | ) | (4,600,170 | ) | (1,425,252 | ) | (4,334,852 | ) | (1,234,991 | ) | (4,168,237 | ) | (865,766 | ) | (16,417,012 | ) | (848,551 | ) | ||||||||||||||||||||
|
(Minus): Change in Pension Value |
- | - | - | - | - | - | - | - | - | - | ||||||||||||||||||||||||||||||
|
Plus: Fair Value at Fiscal Year End of Outstanding and Unvested Equity Awards Granted in the Fiscal Year |
2,102,401 | 1,283,935 | 6,362,615 | 1,971,307 | 3,304,206 | 941,358 | 2,260,544 | 424,417 | 13,533,230 | 788,665 | ||||||||||||||||||||||||||||||
|
Plus/(Minus): Change in Fair Value of Outstanding and Unvested Equity Awards Granted in Prior Fiscal Years |
(2,554,763 | ) | (669,756 | ) | (366,380 | ) | (160,565 | ) | (3,690,852 | ) | (261,445 | ) | (5,202,624 | ) | (210,448 | ) | 555,610 | 159,474 | ||||||||||||||||||||||
|
Plus: Fair Value at Vesting of Equity Awards Granted and Vested in the Fiscal Year |
- | - | - | - | - | - | - | 45,816 | - | - | ||||||||||||||||||||||||||||||
|
Plus/(Minus): Change in Fair Value as of the Vesting Date of Equity Awards Granted in Prior Fiscal Years that Vested in the Fiscal Year |
(974,632 | ) | (146,066 | ) | (55,571 | ) | (19,258 | ) | (636,068 | ) | (127,094 | ) | (1,679,292 | ) | (329,985 | ) | 1,065,723 | 233,271 | ||||||||||||||||||||||
|
(Minus): Fair Value as of the Prior Fiscal Year End of Equity Awards Granted in Prior Fiscal Years that Failed to Meet Vesting Conditions in the Fiscal Year |
- | - | - | - | - | - | - | - | - | - | ||||||||||||||||||||||||||||||
|
Plus/(Minus): Value of Dividends or Other Earnings Paid on Equity Awards Not Otherwise Reflected in Total Compensation |
- | - | - | - | - | - | - | - | - | - | ||||||||||||||||||||||||||||||
|
Compensation Actually Paid |
$ | 516,197 | $ | 1,320,028 | $ | 7,940,385 | $ | 2,645,565 | $ | 78,000 | $ | 1,100,784 | $ | (3,599,238 | ) | $ | 544,787 | $ | 16,814,532 | $ | 1,785,085 | |||||||||||||||||||
For purposes of the above adjustments, the fair value of equity awards on the applicable date was determined in accordance with FASB’s ASC Topic 718, using valuation methodologies that are generally consistent with those used to determine the grant-date fair value for accounting purposes.
The table below contains ranges of assumptions used in the valuation of outstanding equity awards for the relevant fiscal year(s). For more information, please see the notes to our financial statements in our Annual Report on Form 10-K and the footnotes to the Summary Compensation Table of this proxy statement.
|
Fiscal Year 2026 |
|
|
Restricted Stock Units |
|
|
Stock Price |
$88.42 - $97.10 |
|
Performance Share Units |
|
|
Volatility |
58% - 61% |
|
Risk-Free Interest Rate |
3.6% - 3.7% |
| Stock Price | $76.89 - $97.10 |
| Dividend Yield | 0.74% |
|
Stock Options |
|
|
Expected Term (years) |
1.0 - 2.1 |
|
Strike Price |
$131.67 - $268.85 |
|
Volatility |
51% - 62% |
|
Dividend Yield |
0.6% - 0.7% |
|
Risk-Free Interest Rate |
3.6% - 4.0% |
|
(4) |
TSR represents the cumulative return on a fixed investment of $100 in Mesa's common stock, for the period beginning on the last trading day of fiscal year 2021 through the end of the applicable fiscal year, assuming reinvestment of dividends. |
|
(5) |
Peer Group TSR represents the cumulative return on a fixed investment of $100 in the same peer group considered by the Compensation Committee for purposes of establishing executive compensation targets for fiscal year 2026 (the 2026 compensation peer group, or CD&A peer group) for the period beginning on the last trading day of fiscal year 2021 through the end of the applicable fiscal year, assuming reinvestment of dividends. One peer from the fiscal year 2025 CD&A peer group, Harvard Bioscience, Inc., was not included in the fiscal year 2026 CD&A peer group. Additionally, the following companies were added to the CD&A peer group for 2026 as Mesa included additional peers in compensation benchmarking: |
|
o |
Pacific Biosciences of California, Inc.; and |
|
o |
Sotera Health, LLC |
The following table presents the total shareholder return of the fiscal year 2026 CD&A peer group and the fiscal year 2025 CD&A peer group.
|
|
Value of Initial Fixed $100 Investment Based On: |
||
| Fiscal Year Ended March 31, |
MLAB Total Shareholder Return |
FY26 CD&A Peer Group TSR |
FY25 CD&A Peer Group TSR |
| 2026 | $37.20 |
$35.09 |
$34.13 |
|
2025 |
$49.55 |
$32.86 |
$32.86 |
|
2024 |
$45.59 |
$43.39 |
$43.39 |
|
2023 |
$72.18 |
$45.74 |
$45.74 |
|
2022 |
$104.92 |
$66.08 |
$66.08 |
|
(6) |
The dollar amounts reported represent the net income reflected in Mesa's audited financial statements for the applicable year. |
|
| (7) | Mesa's adjusted operating income, a non-GAAP measure. See Appendix A. |
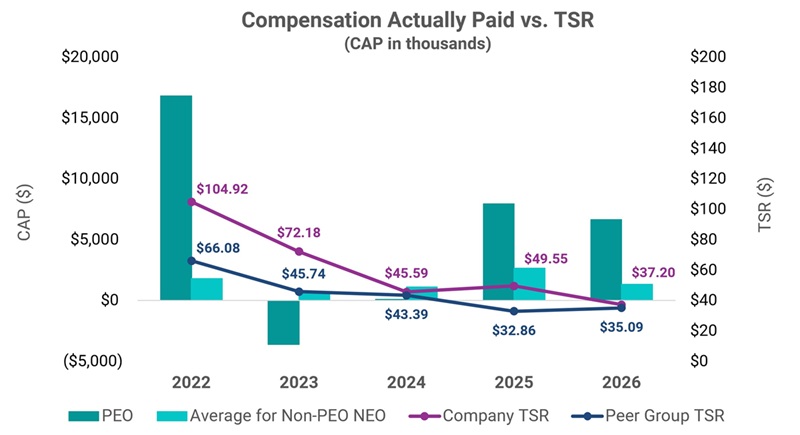
Compensation Actually Paid and Company TSR
The following chart illustrates the relationship between compensation actually paid to Mr. Owens and the average compensation actually paid to Mesa's other NEOs against Mesa’s TSR, as well as the relationship between our TSR and the TSR of our FY26 CD&A peer group. As the chart shows, these relationships are generally aligned, in large part because a significant portion of the compensation actually paid to Mesa's NEOs is in the form of equity awards, the value of which is impacted by stock price changes.
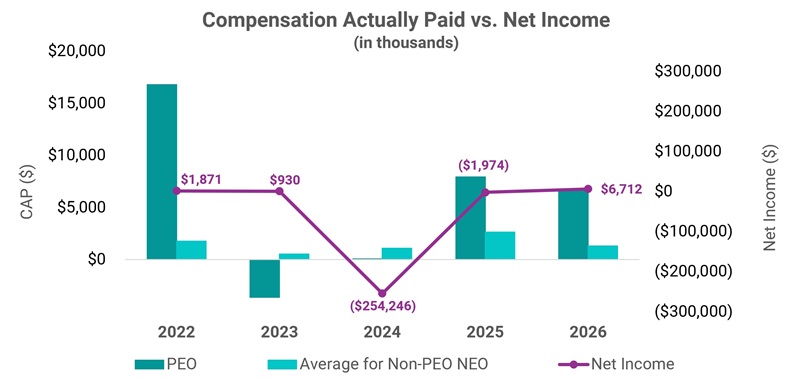
Compensation Actually Paid and GAAP Net Income
The following chart illustrates the relationship between compensation actually paid to Mr. Owens and the average compensation actually paid to Mesa's other NEOs against Mesa's GAAP net income (loss) for the five years presented in the Pay versus Performance Table. Mesa does not use net income as a performance measure in its executive compensation program.
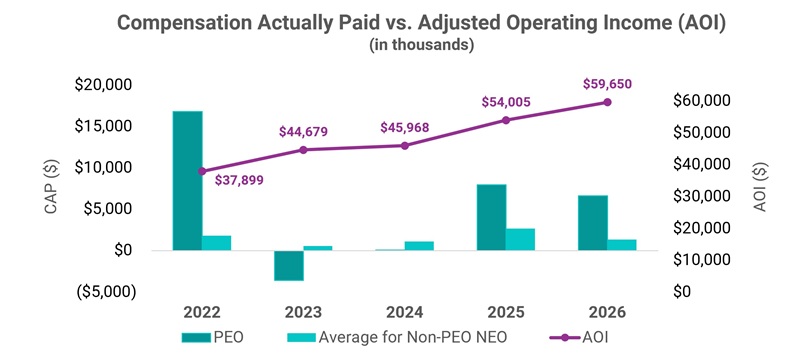
Compensation Actually Paid and Adjusted Operating Income
The following chart illustrates the relationship between compensation actually paid to Mr. Owens and the average compensation actually paid to Mesa's other NEOs against Mesa's adjusted operating income for the five years presented in the Pay versus Performance Table. As described above, adjusted operating income is defined as Mesa's total operating income reported under U.S. GAAP, adjusted to exclude amortization of intangible assets acquired in a business combination, depreciation, stock-based compensation expense, any impairment expense, and certain non-recurring items. While Mesa uses other financial and non-financial performance measures in its compensation programs, Mesa has determined that adjusted operating income is the most important performance measure used to link compensation actually paid to Mesa's NEOs to Company performance.