Shareholder Report
|
12 Months Ended |
|
May 31, 2026
USD ($)
Holding
|
|---|
| Shareholder Report [Line Items] |
|
| Document Type |
N-CSR
|
| Amendment Flag |
false
|
| Registrant Name |
T. ROWE PRICE TOTAL RETURN FUND, INC.
|
| Entity Central Index Key |
0001681576
|
| Entity Investment Company Type |
N-1A
|
| Document Period End Date |
May 31, 2026
|
| Shareholder Report Annual or Semi-Annual |
Annual Shareholder Report
|
| C000174964 |
|
| Shareholder Report [Line Items] |
|
| Fund Name |
Total Return Fund
|
| Class Name |
Investor Class
|
| Trading Symbol |
PTTFX
|
| Annual or Semi-Annual Statement [Text Block] |
This annual shareholder report contains important information about Total Return Fund (the "fund") for the period of June 1, 2025 to May 31, 2026.
|
| Additional Information [Text Block] |
You can find the fund’s prospectus, financial information on Form N‑CSR (which includes required tax information for dividends), holdings, proxy voting information, and other information atwww.troweprice.com/prospectus. You can also request this information without charge by contacting T. Rowe Price at 1‑800‑638‑5660 or info@troweprice.com or contacting your intermediary.
|
| Material Fund Change Notice [Text Block] |
|
| Additional Information Phone Number |
1‑800‑638‑5660
|
| Additional Information Email |
<span style="box-sizing: border-box; color: rgb(0, 0, 0); display: inline; flex-wrap: nowrap; font-size: 13.3333px; font-weight: 400; grid-area: auto; line-height: 17.3333px; margin: 0px; overflow: visible; text-align: justify; text-align-last: left; white-space-collapse: preserve-breaks;">info@troweprice.com</span>
|
| Additional Information Website |
www.troweprice.com/prospectus
|
| Expenses [Text Block] |
What were the fund costs for the last year? (based on a hypothetical $10,000 investment)
Table Summary
|
Costs of a $10,000 investment |
Costs paid as a percentage of a $10,000 investment |
Total Return Fund - Investor Class |
$47 |
0.46% | |
| Expenses Paid, Amount |
$ 47
|
| Expense Ratio, Percent |
0.46%
|
| Factors Affecting Performance [Text Block] |
What drove fund performance during the past 12 months?The U.S. investment-grade bond market delivered positive returns over the 12-month period, driven primarily by attractive coupon income as yields began near multiyear highs. A resilient economy, solid issuer fundamentals, and strong demand for high-quality fixed income securities also supported performance, although rising Treasury yields later in the period created some headwinds. Out-of-benchmark allocations to high yield corporate bonds and non-agency residential mortgage-backed securities combined with an underweight to U.S. Treasuries contributed to performance relative to the Bloomberg U.S. Aggregate Bond Index. Security selection in emerging markets sovereign debt, along with an overweight to the sector, also added value, as did selection within investment-grade corporates. Tactical adjustments to the fund’s duration position as well as the portfolio’s use of Treasury futures to manage interest rate exposure detracted from relative performance versus the benchmark. An underweight to investment-grade corporate cash bonds also hurt performance. The fund invests in a diversified portfolio of bonds and other debt instruments and is designed to respond to a wide variety of market conditions. At period-end, portfolio positioning reflected a favorable view on credit risk, and the fund held notable overweights to securitized credit sectors along with out-of-benchmark positions in high yield bonds and bank loans. Overall, the fund held material exposure to derivatives, including interest rate and credit derivatives that help the investment team more efficiently manage duration and sector positioning. The fund’s positions in interest rate derivatives weighed on absolute performance.
|
| Performance Past Does Not Indicate Future [Text] |
The fund’s past performance is not a good predictor of the fund’s future performance.
|
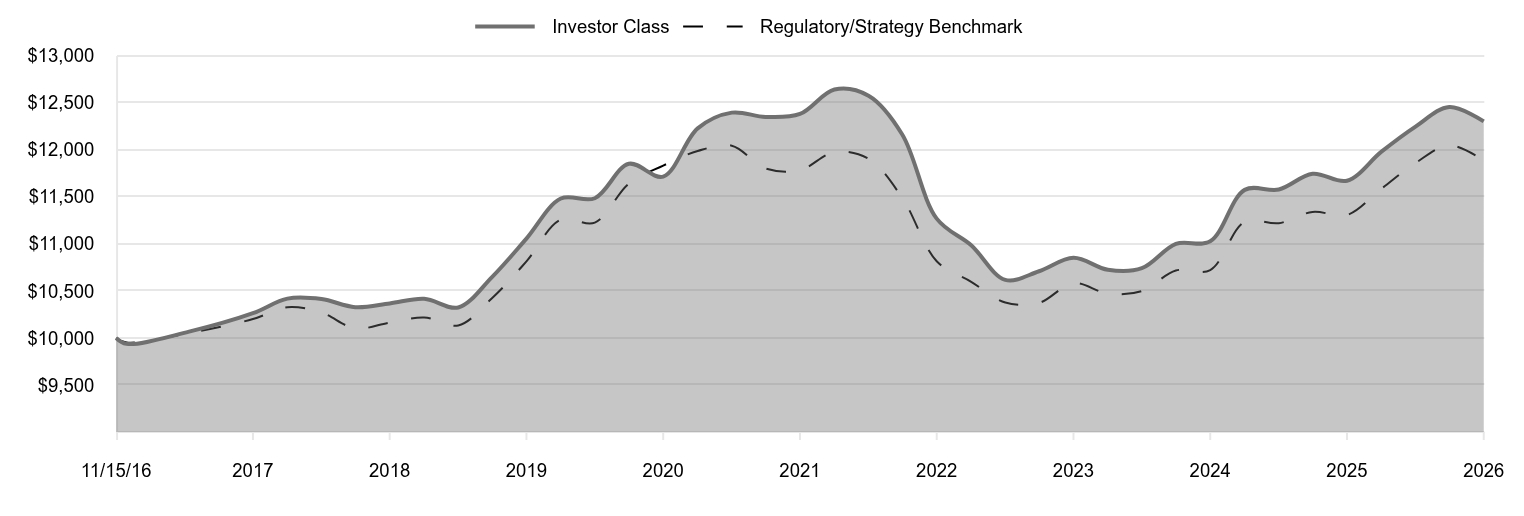
| Line Graph [Table Text Block] |
Table Summary
|
Investor Class |
Regulatory/Strategy Benchmark |
11/15/16 |
10,000 |
10,000 |
11/30/16 |
9,937 |
9,951 |
2/28/17 |
10,067 |
10,051 |
5/31/17 |
10,263 |
10,201 |
8/31/17 |
10,418 |
10,327 |
11/30/17 |
10,413 |
10,270 |
2/28/18 |
10,327 |
10,102 |
5/31/18 |
10,367 |
10,163 |
8/31/18 |
10,417 |
10,218 |
11/30/18 |
10,324 |
10,133 |
2/28/19 |
10,647 |
10,422 |
5/31/19 |
11,056 |
10,814 |
8/31/19 |
11,482 |
11,258 |
11/30/19 |
11,485 |
11,226 |
2/29/20 |
11,851 |
11,640 |
5/31/20 |
11,715 |
11,832 |
8/31/20 |
12,228 |
11,987 |
11/30/20 |
12,395 |
12,044 |
2/28/21 |
12,350 |
11,801 |
5/31/21 |
12,381 |
11,784 |
8/31/21 |
12,641 |
11,977 |
11/30/21 |
12,575 |
11,905 |
2/28/22 |
12,163 |
11,489 |
5/31/22 |
11,268 |
10,815 |
8/31/22 |
10,985 |
10,597 |
11/30/22 |
10,617 |
10,376 |
2/28/23 |
10,709 |
10,372 |
5/31/23 |
10,852 |
10,583 |
8/31/23 |
10,725 |
10,471 |
11/30/23 |
10,741 |
10,499 |
2/29/24 |
11,000 |
10,717 |
5/31/24 |
11,027 |
10,722 |
8/31/24 |
11,574 |
11,235 |
11/30/24 |
11,578 |
11,220 |
2/28/25 |
11,745 |
11,340 |
5/31/25 |
11,671 |
11,307 |
8/31/25 |
11,980 |
11,587 |
11/30/25 |
12,247 |
11,860 |
2/28/26 |
12,455 |
12,049 |
5/31/26 |
12,302 |
11,887 |
|
| Average Annual Return [Table Text Block] |
Table Summary
|
1 Year |
5 Years |
Since Inception 11/15/16 |
Total Return Fund (Investor Class) |
5.41% |
-0.13% |
2.20% |
Bloomberg U.S. Aggregate Bond Index (Regulatory/Strategy Benchmark) |
5.13 |
0.17 |
1.83 | |
| Performance Inception Date |
Nov. 15, 2016
|
| No Deduction of Taxes [Text Block] |
Neither the fund’s returns nor the index returns reflect the deduction of taxes that a shareholder would pay on fund distributions or redemptions of fund shares.
|
| Updated Performance Information Location [Text Block] |
Updated performance information can be found at www.troweprice.com.
|
| Distribution of Capital [Text Block] |
The fund's total return figures reflect the reinvestment of dividends and capital gains, if any.
|
| AssetsNet |
$ 610,571,000
|
| Holdings Count | Holding |
1,573
|
| Advisory Fees Paid, Amount |
$ 1,533,000
|
| InvestmentCompanyPortfolioTurnover |
172.60%
|
| Additional Fund Statistics Significance or Limits [Text Block] |
What are some fund statistics? - Total Net Assets (000s)$610,571
- Number of Portfolio Holdings1,573
|
| Holdings [Text Block] |
Table Summary
U.S. Government & Agency Mortgage-Backed Securities |
25.4% |
U.S. Government Agency Obligations (Excluding Mortgage-Backed) |
22.6 |
Corporate Bonds |
21.3 |
Asset-Backed Securities |
13.8 |
Non-U.S. Government Mortgage-Backed Securities |
10.1 |
Bank Loans |
6.3 |
Foreign Government Obligations & Municipalities |
4.1 |
Municipal Securities |
0.6 |
Commercial Paper |
0.4 |
Short-Term and Other |
-4.6 | |
| Largest Holdings [Text Block] |
Table Summary
U.S. Treasury Bonds |
12.8% |
U.S. Treasury Notes |
9.8 |
Federal National Mortgage Assn. |
9.2 |
Federal Home Loan Mortgage |
5.8 |
Government National Mortgage Assn. |
5.4 |
UMBS |
5.2 |
Carvana Auto Receivables Trust |
1.1 |
EFMT |
0.8 |
Cross Mortgage Trust |
0.7 |
JPMorgan Mortgage Trust |
0.7 | |
| Material Fund Change [Text Block] |
|
| Updated Prospectus Web Address |
www.troweprice.com/paperless
|
| C000174965 |
|
| Shareholder Report [Line Items] |
|
| Fund Name |
Total Return Fund
|
| Class Name |
Advisor Class
|
| Trading Symbol |
PTATX
|
| Annual or Semi-Annual Statement [Text Block] |
This annual shareholder report contains important information about Total Return Fund (the "fund") for the period of June 1, 2025 to May 31, 2026.
|
| Additional Information [Text Block] |
You can find the fund’s prospectus, financial information on Form N‑CSR (which includes required tax information for dividends), holdings, proxy voting information, and other information atwww.troweprice.com/prospectus. You can also request this information without charge by contacting T. Rowe Price at 1‑800‑638‑5660 or info@troweprice.com or contacting your intermediary.
|
| Material Fund Change Notice [Text Block] |
|
| Additional Information Phone Number |
1‑800‑638‑5660
|
| Additional Information Email |
<span style="box-sizing: border-box; color: rgb(0, 0, 0); display: inline; flex-wrap: nowrap; font-size: 13.3333px; font-weight: 400; grid-area: auto; line-height: 17.3333px; margin: 0px; overflow: visible; text-align: justify; text-align-last: left; white-space-collapse: preserve-breaks;">info@troweprice.com</span>
|
| Additional Information Website |
www.troweprice.com/prospectus
|
| Expenses [Text Block] |
What were the fund costs for the last year? (based on a hypothetical $10,000 investment)
Table Summary
|
Costs of a $10,000 investment |
Costs paid as a percentage of a $10,000 investment |
Total Return Fund - Advisor Class |
$77 |
0.75% | |
| Expenses Paid, Amount |
$ 77
|
| Expense Ratio, Percent |
0.75%
|
| Factors Affecting Performance [Text Block] |
What drove fund performance during the past 12 months?The U.S. investment-grade bond market delivered positive returns over the 12-month period, driven primarily by attractive coupon income as yields began near multiyear highs. A resilient economy, solid issuer fundamentals, and strong demand for high-quality fixed income securities also supported performance, although rising Treasury yields later in the period created some headwinds. Out-of-benchmark allocations to high yield corporate bonds and non-agency residential mortgage-backed securities combined with an underweight to U.S. Treasuries contributed to performance relative to the Bloomberg U.S. Aggregate Bond Index. Security selection in emerging markets sovereign debt, along with an overweight to the sector, also added value, as did selection within investment-grade corporates. Tactical adjustments to the fund’s duration position as well as the portfolio’s use of Treasury futures to manage interest rate exposure detracted from relative performance versus the benchmark. An underweight to investment-grade corporate cash bonds also hurt performance. The fund invests in a diversified portfolio of bonds and other debt instruments and is designed to respond to a wide variety of market conditions. At period-end, portfolio positioning reflected a favorable view on credit risk, and the fund held notable overweights to securitized credit sectors along with out-of-benchmark positions in high yield bonds and bank loans. Overall, the fund held material exposure to derivatives, including interest rate and credit derivatives that help the investment team more efficiently manage duration and sector positioning. The fund’s positions in interest rate derivatives weighed on absolute performance.
|
| Performance Past Does Not Indicate Future [Text] |
The fund’s past performance is not a good predictor of the fund’s future performance.
|
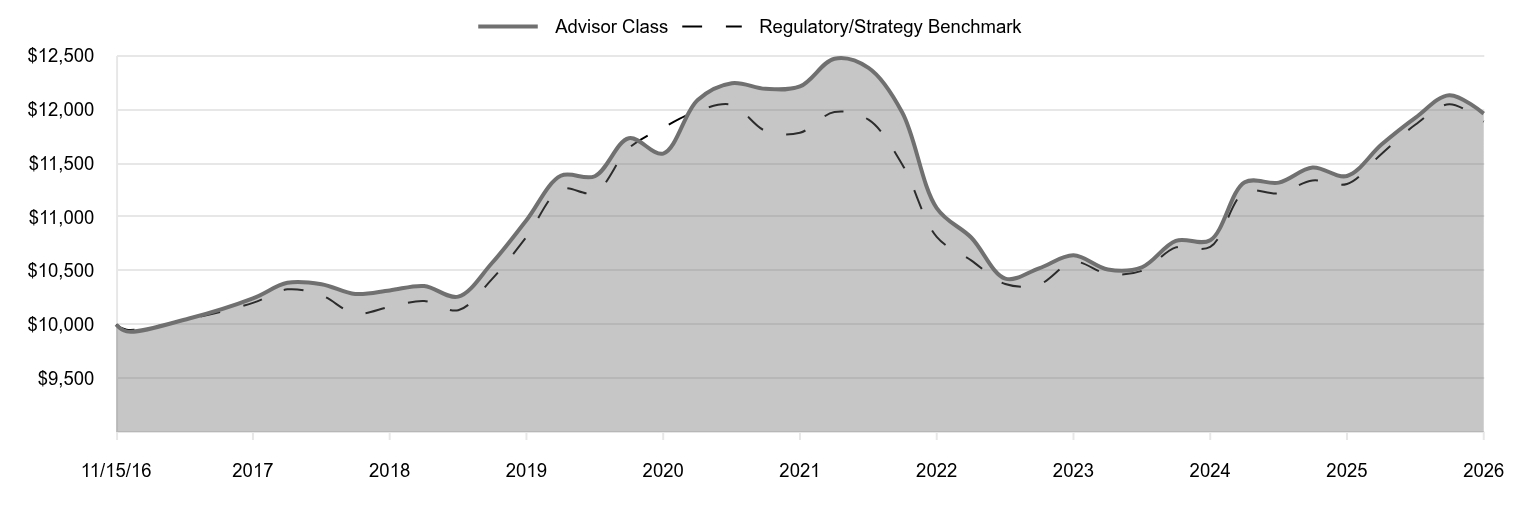
| Line Graph [Table Text Block] |
Table Summary
|
Advisor Class |
Regulatory/Strategy Benchmark |
11/15/16 |
10,000 |
10,000 |
11/30/16 |
9,936 |
9,951 |
2/28/17 |
10,056 |
10,051 |
5/31/17 |
10,243 |
10,201 |
8/31/17 |
10,388 |
10,327 |
11/30/17 |
10,375 |
10,270 |
2/28/18 |
10,284 |
10,102 |
5/31/18 |
10,317 |
10,163 |
8/31/18 |
10,358 |
10,218 |
11/30/18 |
10,259 |
10,133 |
2/28/19 |
10,572 |
10,422 |
5/31/19 |
10,970 |
10,814 |
8/31/19 |
11,383 |
11,258 |
11/30/19 |
11,379 |
11,226 |
2/29/20 |
11,733 |
11,640 |
5/31/20 |
11,590 |
11,832 |
8/31/20 |
12,089 |
11,987 |
11/30/20 |
12,245 |
12,044 |
2/28/21 |
12,192 |
11,801 |
5/31/21 |
12,214 |
11,784 |
8/31/21 |
12,472 |
11,977 |
11/30/21 |
12,387 |
11,905 |
2/28/22 |
11,972 |
11,489 |
5/31/22 |
11,083 |
10,815 |
8/31/22 |
10,809 |
10,597 |
11/30/22 |
10,427 |
10,376 |
2/28/23 |
10,523 |
10,372 |
5/31/23 |
10,643 |
10,583 |
8/31/23 |
10,511 |
10,471 |
11/30/23 |
10,532 |
10,499 |
2/29/24 |
10,778 |
10,717 |
5/31/24 |
10,784 |
10,722 |
8/31/24 |
11,323 |
11,235 |
11/30/24 |
11,320 |
11,220 |
2/28/25 |
11,460 |
11,340 |
5/31/25 |
11,381 |
11,307 |
8/31/25 |
11,674 |
11,587 |
11/30/25 |
11,925 |
11,860 |
2/28/26 |
12,133 |
12,049 |
5/31/26 |
11,962 |
11,887 |
|
| Average Annual Return [Table Text Block] |
Table Summary
|
1 Year |
5 Years |
Since Inception 11/15/16 |
Total Return Fund (Advisor Class) |
5.10% |
-0.42% |
1.90% |
Bloomberg U.S. Aggregate Bond Index (Regulatory/Strategy Benchmark) |
5.13 |
0.17 |
1.83 | |
| Performance Inception Date |
Nov. 15, 2016
|
| No Deduction of Taxes [Text Block] |
Neither the fund’s returns nor the index returns reflect the deduction of taxes that a shareholder would pay on fund distributions or redemptions of fund shares.
|
| Updated Performance Information Location [Text Block] |
Updated performance information can be found at www.troweprice.com.
|
| Distribution of Capital [Text Block] |
The fund's total return figures reflect the reinvestment of dividends and capital gains, if any.
|
| AssetsNet |
$ 610,571,000
|
| Holdings Count | Holding |
1,573
|
| Advisory Fees Paid, Amount |
$ 1,533,000
|
| InvestmentCompanyPortfolioTurnover |
172.60%
|
| Additional Fund Statistics Significance or Limits [Text Block] |
What are some fund statistics? - Total Net Assets (000s)$610,571
- Number of Portfolio Holdings1,573
|
| Holdings [Text Block] |
Table Summary
U.S. Government & Agency Mortgage-Backed Securities |
25.4% |
U.S. Government Agency Obligations (Excluding Mortgage-Backed) |
22.6 |
Corporate Bonds |
21.3 |
Asset-Backed Securities |
13.8 |
Non-U.S. Government Mortgage-Backed Securities |
10.1 |
Bank Loans |
6.3 |
Foreign Government Obligations & Municipalities |
4.1 |
Municipal Securities |
0.6 |
Commercial Paper |
0.4 |
Short-Term and Other |
-4.6 | |
| Largest Holdings [Text Block] |
Table Summary
U.S. Treasury Bonds |
12.8% |
U.S. Treasury Notes |
9.8 |
Federal National Mortgage Assn. |
9.2 |
Federal Home Loan Mortgage |
5.8 |
Government National Mortgage Assn. |
5.4 |
UMBS |
5.2 |
Carvana Auto Receivables Trust |
1.1 |
EFMT |
0.8 |
Cross Mortgage Trust |
0.7 |
JPMorgan Mortgage Trust |
0.7 | |
| Material Fund Change [Text Block] |
|
| Updated Prospectus Web Address |
www.troweprice.com/paperless
|
| C000174966 |
|
| Shareholder Report [Line Items] |
|
| Fund Name |
Total Return Fund
|
| Class Name |
I Class
|
| Trading Symbol |
PTKIX
|
| Annual or Semi-Annual Statement [Text Block] |
This annual shareholder report contains important information about Total Return Fund (the "fund") for the period of June 1, 2025 to May 31, 2026.
|
| Additional Information [Text Block] |
You can find the fund’s prospectus, financial information on Form N‑CSR (which includes required tax information for dividends), holdings, proxy voting information, and other information atwww.troweprice.com/prospectus. You can also request this information without charge by contacting T. Rowe Price at 1‑800‑638‑5660 or info@troweprice.com or contacting your intermediary.
|
| Material Fund Change Notice [Text Block] |
|
| Additional Information Phone Number |
1‑800‑638‑5660
|
| Additional Information Email |
<span style="box-sizing: border-box; color: rgb(0, 0, 0); display: inline; flex-wrap: nowrap; font-size: 13.3333px; font-weight: 400; grid-area: auto; line-height: 17.3333px; margin: 0px; overflow: visible; text-align: justify; text-align-last: left; white-space-collapse: preserve-breaks;">info@troweprice.com</span>
|
| Additional Information Website |
www.troweprice.com/prospectus
|
| Expenses [Text Block] |
What were the fund costs for the last year? (based on a hypothetical $10,000 investment)
Table Summary
|
Costs of a $10,000 investment |
Costs paid as a percentage of a $10,000 investment |
Total Return Fund - I Class |
$33 |
0.32% | |
| Expenses Paid, Amount |
$ 33
|
| Expense Ratio, Percent |
0.32%
|
| Factors Affecting Performance [Text Block] |
What drove fund performance during the past 12 months?The U.S. investment-grade bond market delivered positive returns over the 12-month period, driven primarily by attractive coupon income as yields began near multiyear highs. A resilient economy, solid issuer fundamentals, and strong demand for high-quality fixed income securities also supported performance, although rising Treasury yields later in the period created some headwinds. Out-of-benchmark allocations to high yield corporate bonds and non-agency residential mortgage-backed securities combined with an underweight to U.S. Treasuries contributed to performance relative to the Bloomberg U.S. Aggregate Bond Index. Security selection in emerging markets sovereign debt, along with an overweight to the sector, also added value, as did selection within investment-grade corporates. Tactical adjustments to the fund’s duration position as well as the portfolio’s use of Treasury futures to manage interest rate exposure detracted from relative performance versus the benchmark. An underweight to investment-grade corporate cash bonds also hurt performance. The fund invests in a diversified portfolio of bonds and other debt instruments and is designed to respond to a wide variety of market conditions. At period-end, portfolio positioning reflected a favorable view on credit risk, and the fund held notable overweights to securitized credit sectors along with out-of-benchmark positions in high yield bonds and bank loans. Overall, the fund held material exposure to derivatives, including interest rate and credit derivatives that help the investment team more efficiently manage duration and sector positioning. The fund’s positions in interest rate derivatives weighed on absolute performance.
|
| Performance Past Does Not Indicate Future [Text] |
The fund’s past performance is not a good predictor of the fund’s future performance.
|
| Line Graph [Table Text Block] |
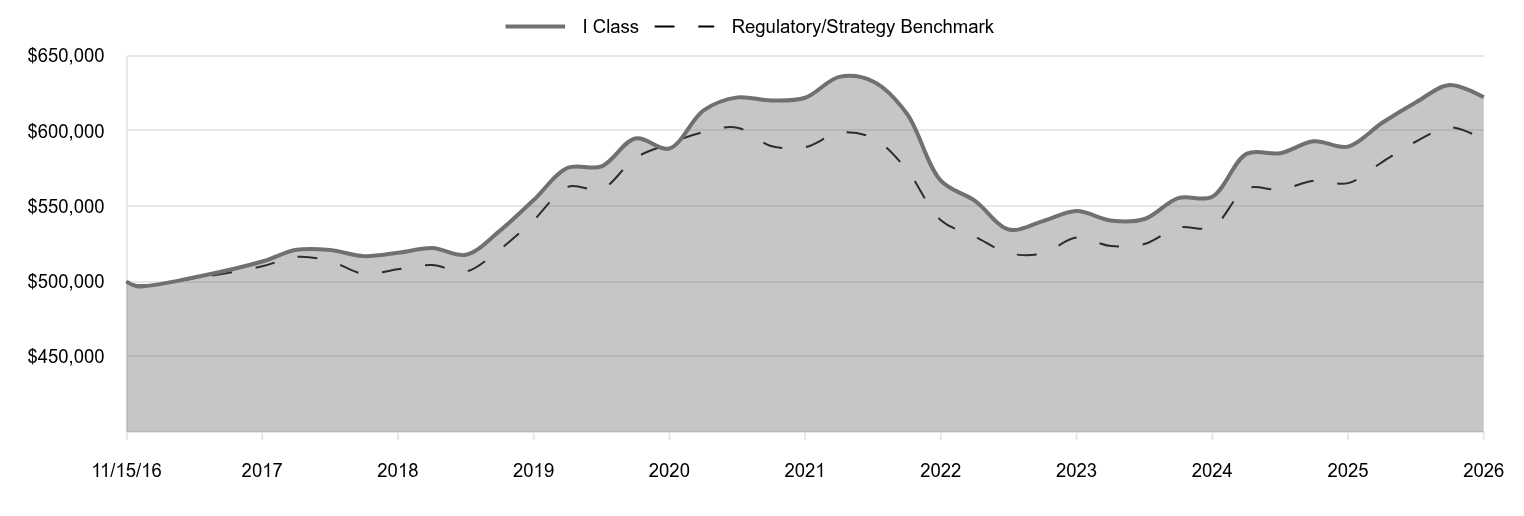
Table Summary
|
I Class |
Regulatory/Strategy Benchmark |
11/15/16 |
500,000 |
500,000 |
11/30/16 |
496,851 |
497,530 |
2/28/17 |
503,363 |
502,564 |
5/31/17 |
513,256 |
510,073 |
8/31/17 |
521,056 |
516,343 |
11/30/17 |
520,933 |
513,521 |
2/28/18 |
516,856 |
505,103 |
5/31/18 |
519,026 |
508,162 |
8/31/18 |
522,174 |
510,924 |
11/30/18 |
517,720 |
506,629 |
2/28/19 |
533,443 |
521,113 |
5/31/19 |
554,123 |
540,686 |
8/31/19 |
575,568 |
562,898 |
11/30/19 |
576,503 |
561,300 |
2/29/20 |
595,034 |
581,993 |
5/31/20 |
588,368 |
591,595 |
8/31/20 |
613,717 |
599,337 |
11/30/20 |
622,323 |
602,185 |
2/28/21 |
620,290 |
590,046 |
5/31/21 |
622,099 |
589,200 |
8/31/21 |
635,958 |
598,831 |
11/30/21 |
632,907 |
595,239 |
2/28/22 |
611,769 |
574,444 |
5/31/22 |
566,964 |
540,756 |
8/31/22 |
553,535 |
529,870 |
11/30/22 |
534,537 |
518,813 |
2/28/23 |
539,983 |
518,597 |
5/31/23 |
546,764 |
529,168 |
8/31/23 |
540,523 |
523,548 |
11/30/23 |
541,527 |
524,934 |
2/29/24 |
555,425 |
535,852 |
5/31/24 |
556,327 |
536,077 |
8/31/24 |
584,780 |
561,749 |
11/30/24 |
585,222 |
561,023 |
2/28/25 |
593,124 |
566,975 |
5/31/25 |
589,617 |
565,341 |
8/31/25 |
605,442 |
579,367 |
11/30/25 |
619,109 |
593,009 |
2/28/26 |
630,587 |
602,471 |
5/31/26 |
622,343 |
594,361 |
|
| Average Annual Return [Table Text Block] |
Table Summary
|
1 Year |
5 Years |
Since Inception 11/15/16 |
Total Return Fund (I Class) |
5.55% |
0.01% |
2.32% |
Bloomberg U.S. Aggregate Bond Index (Regulatory/Strategy Benchmark) |
5.13 |
0.17 |
1.83 | |
| Performance Inception Date |
Nov. 15, 2016
|
| No Deduction of Taxes [Text Block] |
Neither the fund’s returns nor the index returns reflect the deduction of taxes that a shareholder would pay on fund distributions or redemptions of fund shares.
|
| Updated Performance Information Location [Text Block] |
Updated performance information can be found at www.troweprice.com.
|
| Distribution of Capital [Text Block] |
The fund's total return figures reflect the reinvestment of dividends and capital gains, if any.
|
| AssetsNet |
$ 610,571,000
|
| Holdings Count | Holding |
1,573
|
| Advisory Fees Paid, Amount |
$ 1,533,000
|
| InvestmentCompanyPortfolioTurnover |
172.60%
|
| Additional Fund Statistics Significance or Limits [Text Block] |
What are some fund statistics? - Total Net Assets (000s)$610,571
- Number of Portfolio Holdings1,573
|
| Holdings [Text Block] |
Table Summary
U.S. Government & Agency Mortgage-Backed Securities |
25.4% |
U.S. Government Agency Obligations (Excluding Mortgage-Backed) |
22.6 |
Corporate Bonds |
21.3 |
Asset-Backed Securities |
13.8 |
Non-U.S. Government Mortgage-Backed Securities |
10.1 |
Bank Loans |
6.3 |
Foreign Government Obligations & Municipalities |
4.1 |
Municipal Securities |
0.6 |
Commercial Paper |
0.4 |
Short-Term and Other |
-4.6 | |
| Largest Holdings [Text Block] |
Table Summary
U.S. Treasury Bonds |
12.8% |
U.S. Treasury Notes |
9.8 |
Federal National Mortgage Assn. |
9.2 |
Federal Home Loan Mortgage |
5.8 |
Government National Mortgage Assn. |
5.4 |
UMBS |
5.2 |
Carvana Auto Receivables Trust |
1.1 |
EFMT |
0.8 |
Cross Mortgage Trust |
0.7 |
JPMorgan Mortgage Trust |
0.7 | |
| Material Fund Change [Text Block] |
|
| Updated Prospectus Web Address |
www.troweprice.com/paperless
|