
1 Second Quarter 2026 Earnings Conference Call July 21, 2026
1 Statements in this presentation which are not historical facts are “forward-looking statements” within the meaning of Section 27A of the Securities Act of 1933, as amended, Section 21E of the Securities Exchange Act of 1934, as amended, and the Private Securities Litigation Reform Act of 1995. These forward-looking statements may include discussions of the financial condition, results of operations, future performance and/or business of Peoples Bancorp Inc. (“Peoples”). The information contained in this presentation should be read in conjunction with Peoples’ Annual Report on Form 10-K for the fiscal year ended December 31, 2025 (the “2025 Form 10-K”), Peoples’ Quarterly Report on Form 10-Q for the quarter ended March 31, 2026 (the “March 31, 2026 Form 10-Q”), and Peoples’ earnings release for the quarter ended June 30, 2026 (the “Second Quarter Earnings Release”), included in Peoples’ Current Report on Form 8-K furnished to the Securities and Exchange Commission (“SEC”) on July 21, 2026, each of which is available on the SEC’s website (sec.gov) or at Peoples’ website (peoplesbancorp.com). Peoples expects to file its Quarterly Report on Form 10-Q for the quarter ended June 30, 2026 (the “Second Quarter Form 10-Q”) with the SEC on or about July 30, 2026. As required by U.S. generally accepted accounting principles, Peoples is required to evaluate the impact of subsequent events through the issuance date of its June 30, 2026, consolidated financial statements as part of its Second Quarter Form 10-Q. Accordingly, subsequent events could occur that may cause Peoples to update its critical accounting estimates and/or to revise its financial information from that which is contained in this presentation. Investors are cautioned that forward-looking statements, which are not historical fact, involve risks and uncertainties, including those detailed in the 2025 Form 10-K under the section “Risk Factors” in Part I, Item 1A, and in the March 31, 2026 Form 10-Q under the section “Risk Factors”, in Part II, Item 1A, as well as in the Second Quarter Earnings Release. As such, actual results could differ materially from those contemplated by forward-looking statements made in this presentation. Management believes that the expectations in these forward-looking statements are based upon reasonable assumptions within the bounds of management’s knowledge of Peoples’ business and operations. Peoples disclaims any responsibility to update these forward-looking statements to reflect events or circumstances after the date of this presentation or to reflect the occurrence of unanticipated events, except as required by applicable legal requirements. Safe Harbor Statement
2 This presentation does not constitute an offer to sell or the solicitation of an offer to buy securities of Peoples. Peoples filed a registration statement on Form S-4 (Registration No. 333-296361) and other documents regarding the proposed merger with Citizens National Corporation (“Citizens”) with the Securities and Exchange Commission (the “SEC”). The registration statement includes a proxy statement of Citizens that also constitutes a prospectus of Peoples, which has been sent to the shareholders of Citizens seeking their approval of the merger-related proposals. Investors and security holders are urged to read the proxy statement/prospectus and any other relevant documents filed with the SEC in connection with the proposed transaction because they contain or will contain important information about Peoples, Citizens and the proposed transaction. Investors and security holders may obtain a free copy of these documents through the website maintained by the SEC (sec.gov) or at Peoples’ website (peoplesbancorp.com). These documents may also be obtained, without charge, by directing a request to Peoples Bancorp Inc., 138 Putnam Street, P.O. Box 738, Marietta, Ohio 45750, Attn.: Investor Relations. Peoples and Citizens and certain of their directors and executive officers may be deemed to be participants in the solicitation of proxies from the shareholders of Citizens in connection with the proposed merger. Information about the directors and executive officers of Peoples is set forth in the proxy statement for Peoples’ 2026 annual meeting of shareholders, as filed with the SEC on Schedule 14A on March 6, 2026. Information about the directors and executive officers of Citizens and their ownership of Citizens common stock, as well as additional information regarding the participants in the proxy solicitation and a description of their direct and indirect interests, by securities holdings or otherwise, can be found in the proxy statement/prospectus and other relevant documents regarding the proposed transaction filed with the SEC. Free copies may be obtained as described in the preceding paragraph. Important Information for Investors and Shareholders
3 This presentation contains financial information and performance measures determined by methods other than those in accordance with accounting principles generally accepted in the United States of America (“US GAAP”). Management uses these “non-US GAAP” financial measures in its analysis of Peoples’ performance and the efficiency of its operations. Management believes that these non-US GAAP financial measures provide a greater understanding of ongoing operations and enhance comparability of results with prior periods and peers. These disclosures should not be viewed as substitutes for financial measures determined in accordance with US GAAP, nor are they necessarily comparable to non-US GAAP performance measures that may be presented by other companies. A reconciliation of these non-US GAAP financial measures to the most directly comparable US GAAP financial measures is included under the caption “Non-US GAAP Financial Measures (Unaudited)” at the end of the Second Quarter Earnings Release. Use of Non-US GAAP Financial Measures
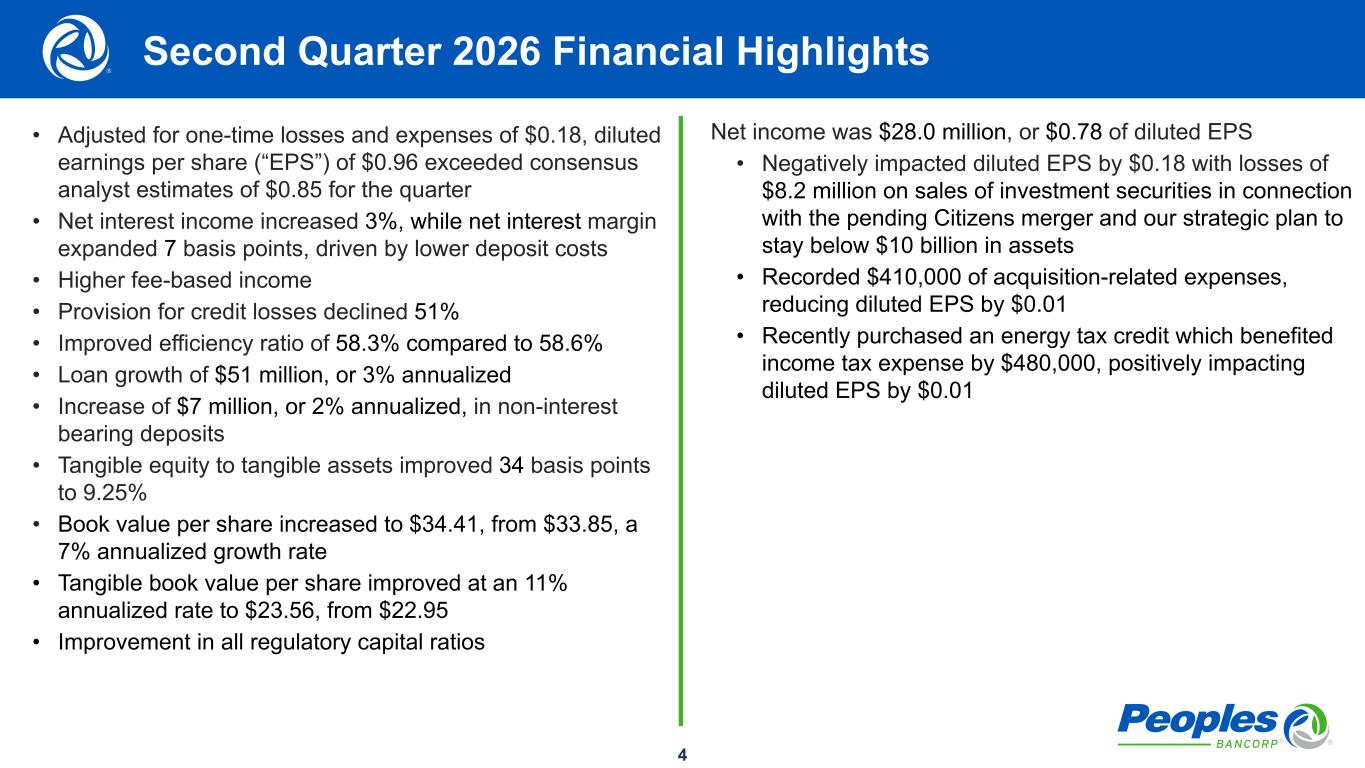
4 • Adjusted for one-time losses and expenses of $0.18, diluted earnings per share (“EPS”) of $0.96 exceeded consensus analyst estimates of $0.85 for the quarter • Net interest income increased 3%, while net interest margin expanded 7 basis points, driven by lower deposit costs • Higher fee-based income • Provision for credit losses declined 51% • Improved efficiency ratio of 58.3% compared to 58.6% • Loan growth of $51 million, or 3% annualized • Increase of $7 million, or 2% annualized, in non-interest bearing deposits • Tangible equity to tangible assets improved 34 basis points to 9.25% • Book value per share increased to $34.41, from $33.85, a 7% annualized growth rate • Tangible book value per share improved at an 11% annualized rate to $23.56, from $22.95 • Improvement in all regulatory capital ratios Net income was $28.0 million, or $0.78 of diluted EPS • Negatively impacted diluted EPS by $0.18 with losses of $8.2 million on sales of investment securities in connection with the pending Citizens merger and our strategic plan to stay below $10 billion in assets • Recorded $410,000 of acquisition-related expenses, reducing diluted EPS by $0.01 • Recently purchased an energy tax credit which benefited income tax expense by $480,000, positively impacting diluted EPS by $0.01 Second Quarter 2026 Financial Highlights
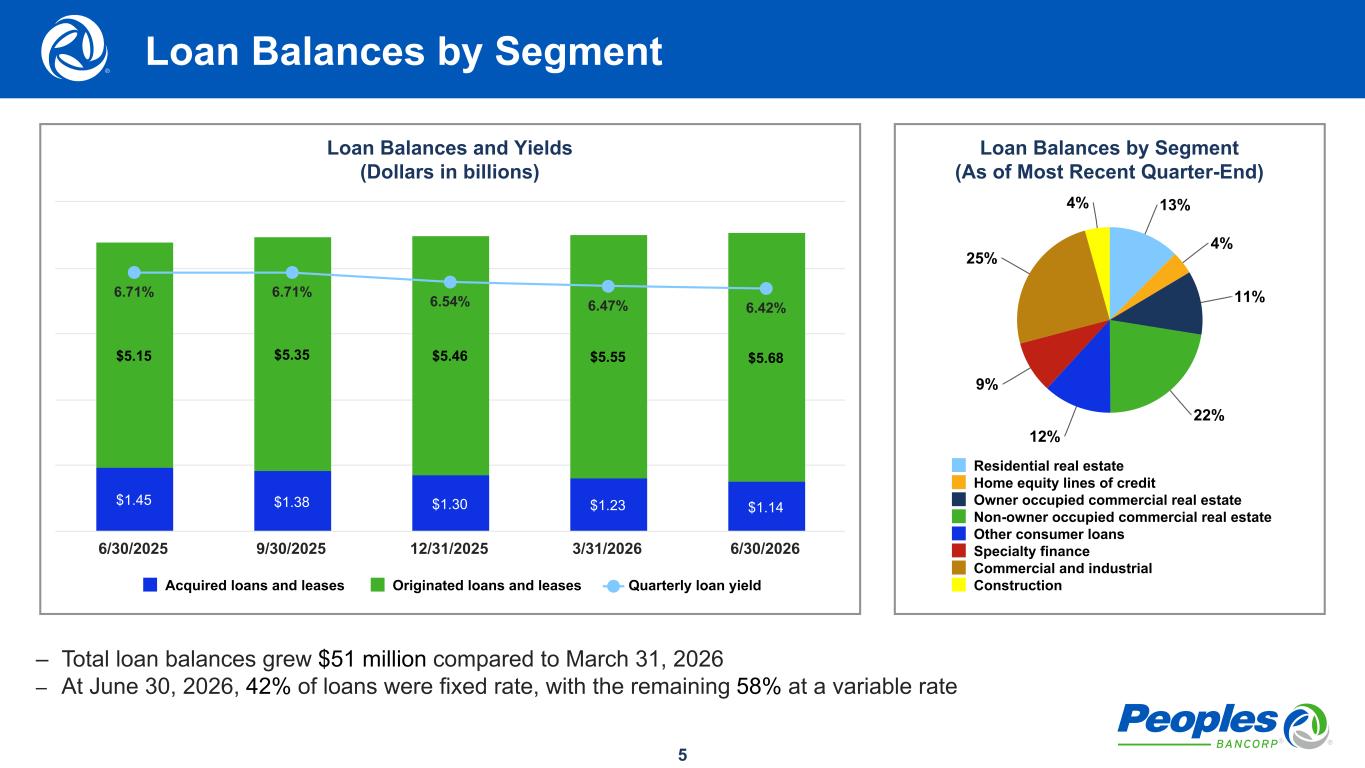
5 Loan Balances by Segment (As of Most Recent Quarter-End) 13% 4% 11% 22% 12% 9% 25% 4% Residential real estate Home equity lines of credit Owner occupied commercial real estate Non-owner occupied commercial real estate Other consumer loans Specialty finance Commercial and industrial Construction Loan Balances and Yields (Dollars in billions) $1.45 $1.38 $1.30 $1.23 $1.14 $5.15 $5.35 $5.46 $5.55 $5.68 6.71% 6.71% 6.54% 6.47% 6.42% Acquired loans and leases Originated loans and leases Quarterly loan yield 6/30/2025 9/30/2025 12/31/2025 3/31/2026 6/30/2026 – Total loan balances grew $51 million compared to March 31, 2026 – At June 30, 2026, 42% of loans were fixed rate, with the remaining 58% at a variable rate Loan Balances by Segment
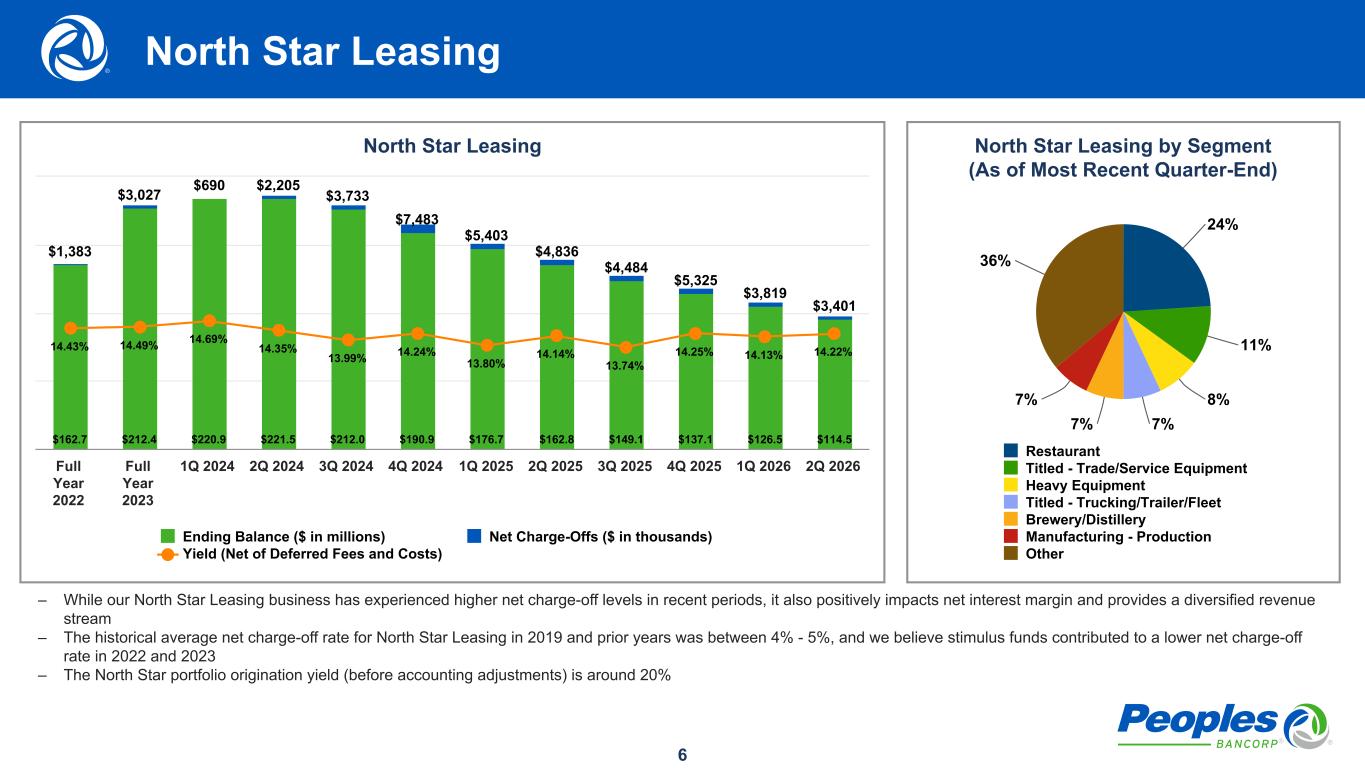
6 North Star Leasing by Segment (As of Most Recent Quarter-End) 24% 11% 8% 7%7% 7% 36% Restaurant Titled - Trade/Service Equipment Heavy Equipment Titled - Trucking/Trailer/Fleet Brewery/Distillery Manufacturing - Production Other – While our North Star Leasing business has experienced higher net charge-off levels in recent periods, it also positively impacts net interest margin and provides a diversified revenue stream – The historical average net charge-off rate for North Star Leasing in 2019 and prior years was between 4% - 5%, and we believe stimulus funds contributed to a lower net charge-off rate in 2022 and 2023 – The North Star portfolio origination yield (before accounting adjustments) is around 20% North Star Leasing North Star Leasing $162.7 $212.4 $220.9 $221.5 $212.0 $190.9 $176.7 $162.8 $149.1 $137.1 $126.5 $114.5 $1,383 $3,027 $690 $2,205 $3,733 $7,483 $5,403 $4,836 $4,484 $5,325 $3,819 $3,401 14.43% 14.49% 14.69% 14.35% 13.99% 14.24% 13.80% 14.14% 13.74% 14.25% 14.13% 14.22% Ending Balance ($ in millions) Net Charge-Offs ($ in thousands) Yield (Net of Deferred Fees and Costs) Full Year 2022 Full Year 2023 1Q 2024 2Q 2024 3Q 2024 4Q 2024 1Q 2025 2Q 2025 3Q 2025 4Q 2025 1Q 2026 2Q 2026
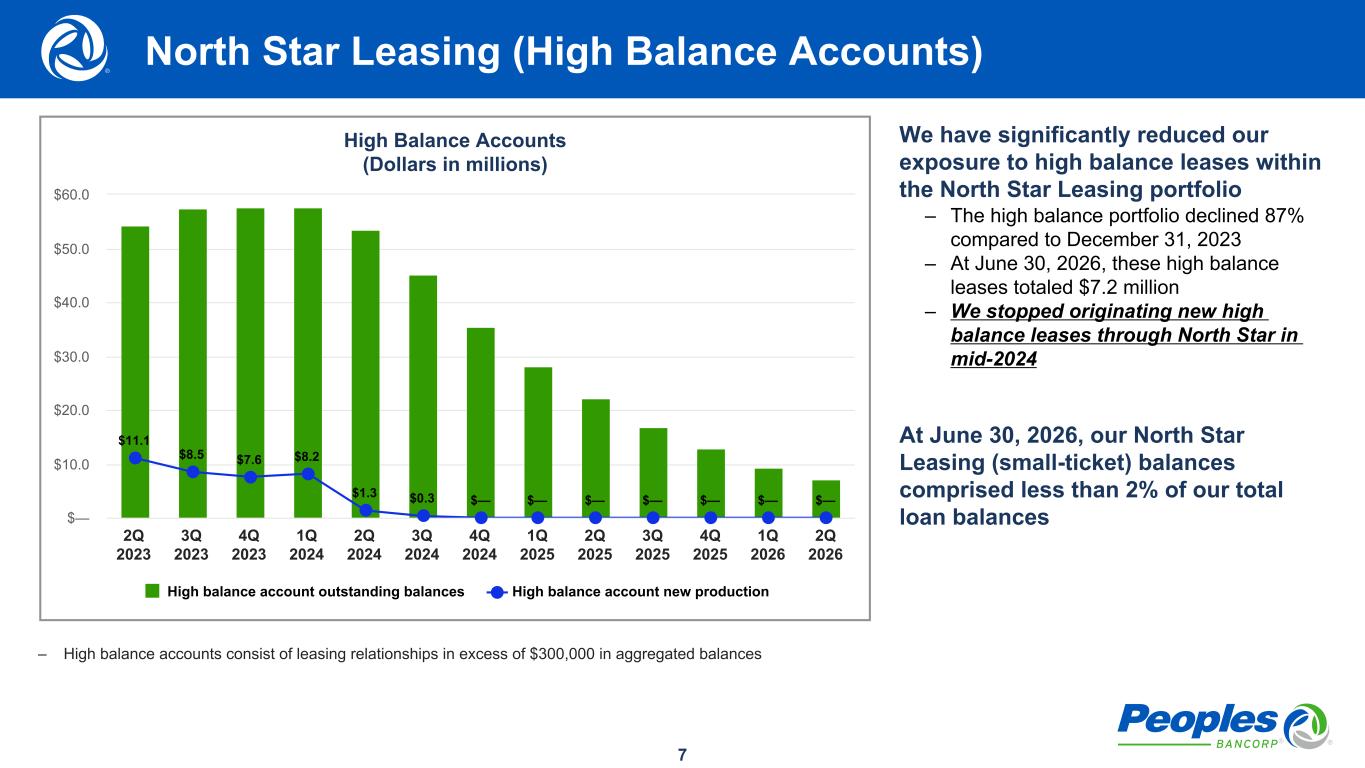
7 High Balance Accounts (Dollars in millions) $11.1 $8.5 $7.6 $8.2 $1.3 $0.3 $— $— $— $— $— $— $— High balance account outstanding balances High balance account new production 2Q 2023 3Q 2023 4Q 2023 1Q 2024 2Q 2024 3Q 2024 4Q 2024 1Q 2025 2Q 2025 3Q 2025 4Q 2025 1Q 2026 2Q 2026 $— $10.0 $20.0 $30.0 $40.0 $50.0 $60.0 – High balance accounts consist of leasing relationships in excess of $300,000 in aggregated balances North Star Leasing (High Balance Accounts) We have significantly reduced our exposure to high balance leases within the North Star Leasing portfolio – The high balance portfolio declined 87% compared to December 31, 2023 – At June 30, 2026, these high balance leases totaled $7.2 million – We stopped originating new high balance leases through North Star in mid-2024 At June 30, 2026, our North Star Leasing (small-ticket) balances comprised less than 2% of our total loan balances
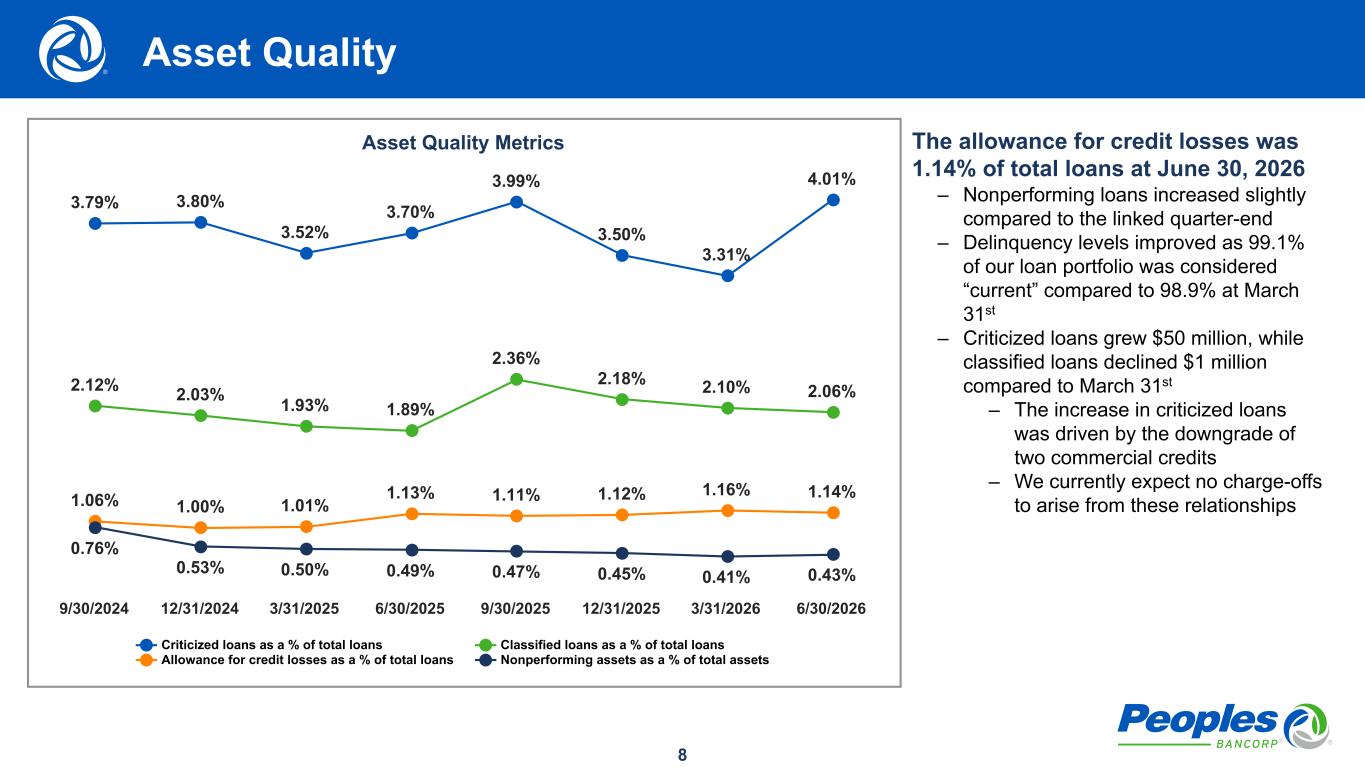
8 Asset Quality Metrics 3.79% 3.80% 3.52% 3.70% 3.99% 3.50% 3.31% 4.01% 2.12% 2.03% 1.93% 1.89% 2.36% 2.18% 2.10% 2.06% 1.06% 1.00% 1.01% 1.13% 1.11% 1.12% 1.16% 1.14% 0.76% 0.53% 0.50% 0.49% 0.47% 0.45% 0.41% 0.43% Criticized loans as a % of total loans Classified loans as a % of total loans Allowance for credit losses as a % of total loans Nonperforming assets as a % of total assets 9/30/2024 12/31/2024 3/31/2025 6/30/2025 9/30/2025 12/31/2025 3/31/2026 6/30/2026 The allowance for credit losses was 1.14% of total loans at June 30, 2026 – Nonperforming loans increased slightly compared to the linked quarter-end – Delinquency levels improved as 99.1% of our loan portfolio was considered “current” compared to 98.9% at March 31st – Criticized loans grew $50 million, while classified loans declined $1 million compared to March 31st – The increase in criticized loans was driven by the downgrade of two commercial credits – We currently expect no charge-offs to arise from these relationships Asset Quality
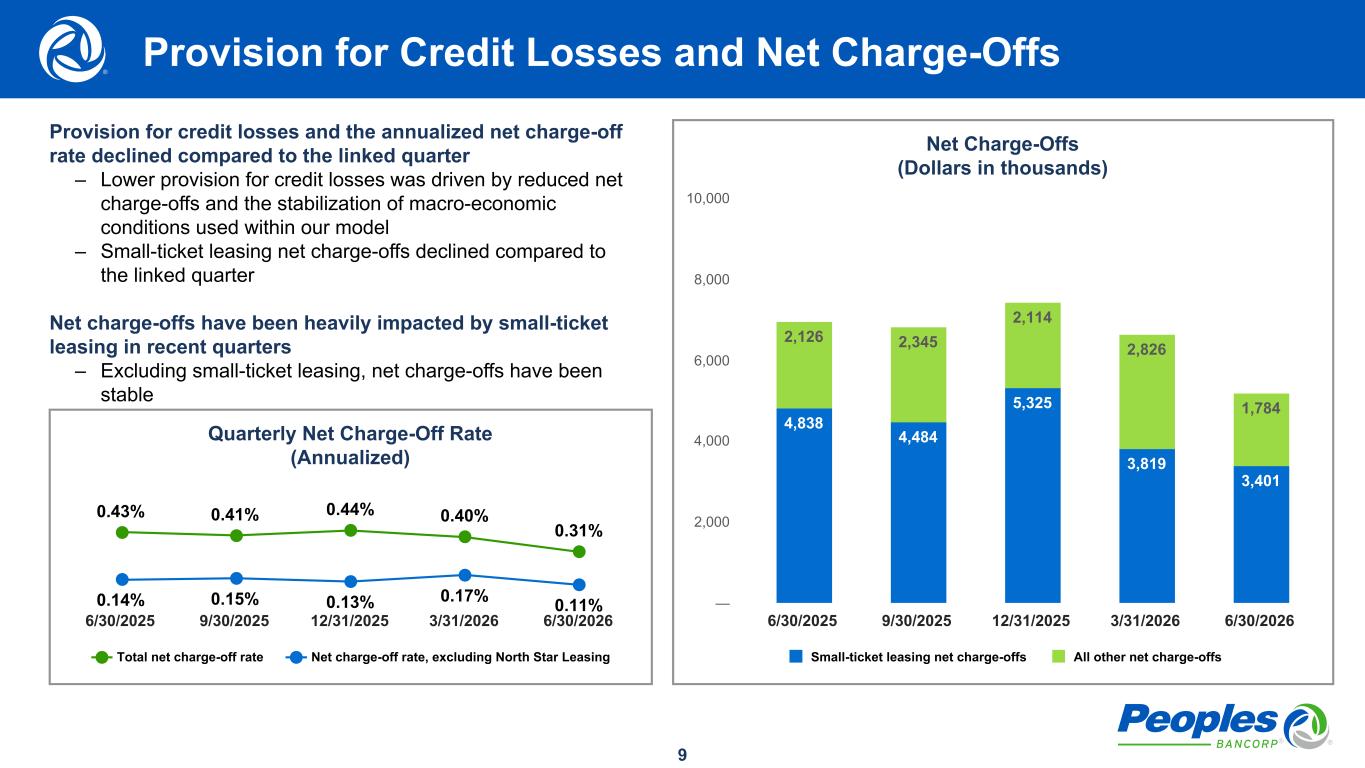
9 Net Charge-Offs (Dollars in thousands) 4,838 4,484 5,325 3,819 3,401 2,126 2,345 2,114 2,826 1,784 Small-ticket leasing net charge-offs All other net charge-offs 6/30/2025 9/30/2025 12/31/2025 3/31/2026 6/30/2026 — 2,000 4,000 6,000 8,000 10,000 Provision for Credit Losses and Net Charge-Offs Provision for credit losses and the annualized net charge-off rate declined compared to the linked quarter – Lower provision for credit losses was driven by reduced net charge-offs and the stabilization of macro-economic conditions used within our model – Small-ticket leasing net charge-offs declined compared to the linked quarter Net charge-offs have been heavily impacted by small-ticket leasing in recent quarters – Excluding small-ticket leasing, net charge-offs have been stable Quarterly Net Charge-Off Rate (Annualized) 0.43% 0.41% 0.44% 0.40% 0.31% 0.14% 0.15% 0.13% 0.17% 0.11% Total net charge-off rate Net charge-off rate, excluding North Star Leasing 6/30/2025 9/30/2025 12/31/2025 3/31/2026 6/30/2026
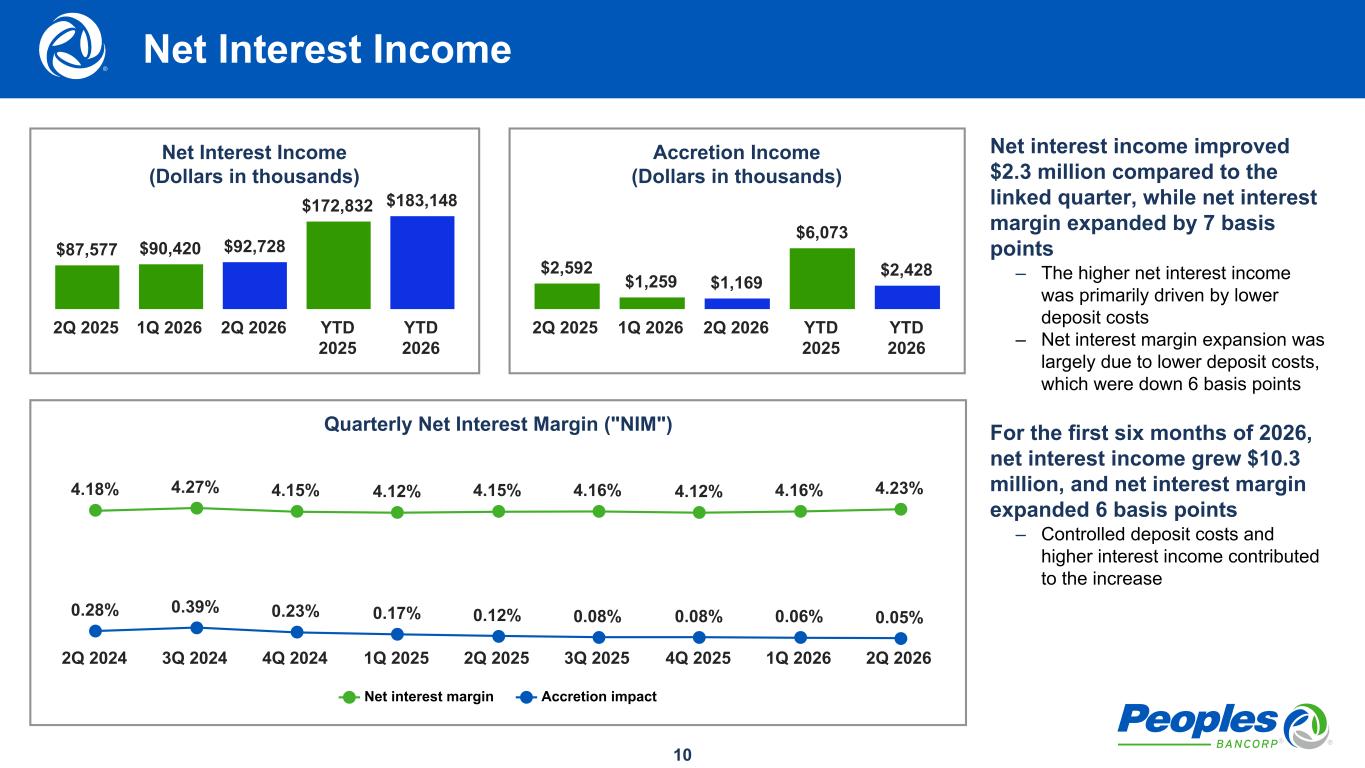
10 Net interest income improved $2.3 million compared to the linked quarter, while net interest margin expanded by 7 basis points – The higher net interest income was primarily driven by lower deposit costs – Net interest margin expansion was largely due to lower deposit costs, which were down 6 basis points For the first six months of 2026, net interest income grew $10.3 million, and net interest margin expanded 6 basis points – Controlled deposit costs and higher interest income contributed to the increase Net Interest Income (Dollars in thousands) $87,577 $90,420 $92,728 $172,832 $183,148 2Q 2025 1Q 2026 2Q 2026 YTD 2025 YTD 2026 Quarterly Net Interest Margin ("NIM") 4.18% 4.27% 4.15% 4.12% 4.15% 4.16% 4.12% 4.16% 4.23% 0.28% 0.39% 0.23% 0.17% 0.12% 0.08% 0.08% 0.06% 0.05% Net interest margin Accretion impact 2Q 2024 3Q 2024 4Q 2024 1Q 2025 2Q 2025 3Q 2025 4Q 2025 1Q 2026 2Q 2026 Accretion Income (Dollars in thousands) $2,592 $1,259 $1,169 $6,073 $2,428 2Q 2025 1Q 2026 2Q 2026 YTD 2025 YTD 2026 Net Interest Income
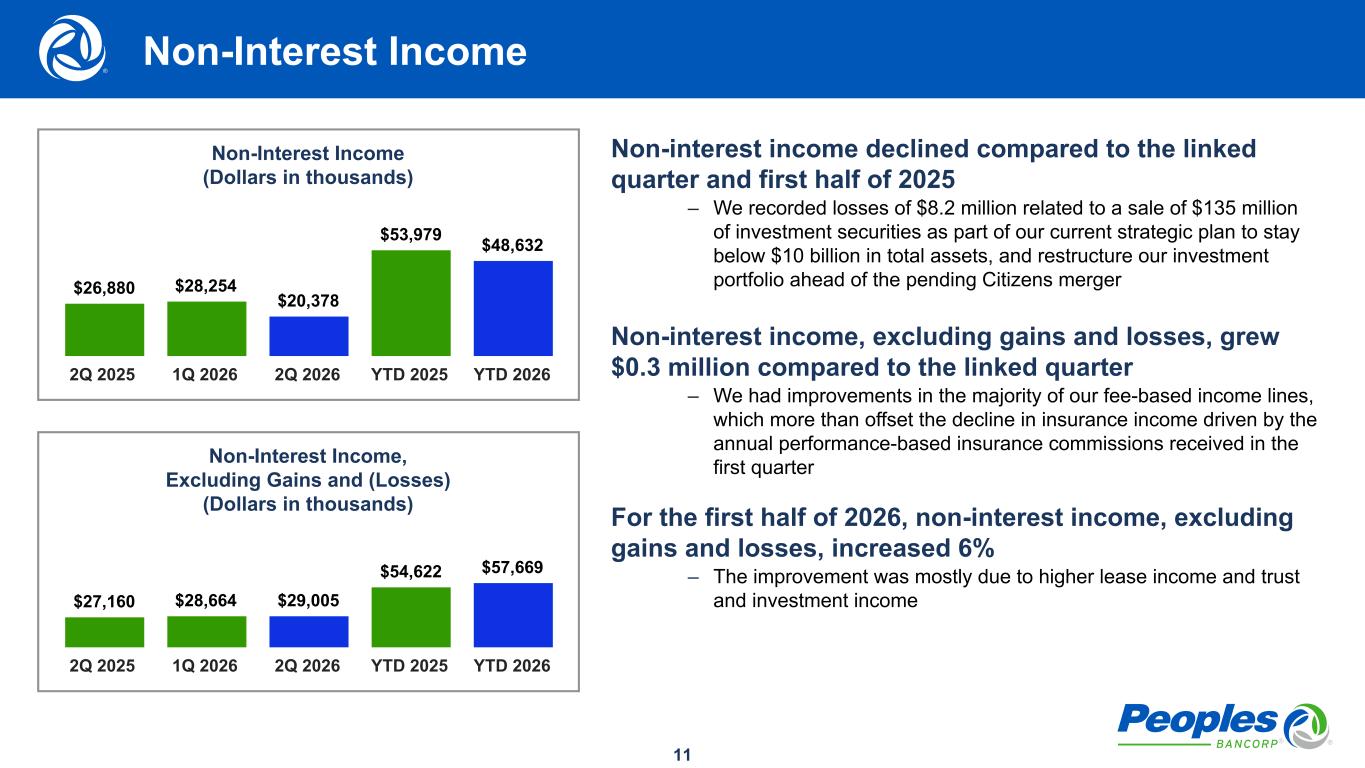
11 Non-interest income declined compared to the linked quarter and first half of 2025 – We recorded losses of $8.2 million related to a sale of $135 million of investment securities as part of our current strategic plan to stay below $10 billion in total assets, and restructure our investment portfolio ahead of the pending Citizens merger Non-interest income, excluding gains and losses, grew $0.3 million compared to the linked quarter – We had improvements in the majority of our fee-based income lines, which more than offset the decline in insurance income driven by the annual performance-based insurance commissions received in the first quarter For the first half of 2026, non-interest income, excluding gains and losses, increased 6% – The improvement was mostly due to higher lease income and trust and investment income Non-Interest Income (Dollars in thousands) $26,880 $28,254 $20,378 $53,979 $48,632 2Q 2025 1Q 2026 2Q 2026 YTD 2025 YTD 2026 Non-Interest Income Non-Interest Income, Excluding Gains and (Losses) (Dollars in thousands) $27,160 $28,664 $29,005 $54,622 $57,669 2Q 2025 1Q 2026 2Q 2026 YTD 2025 YTD 2026
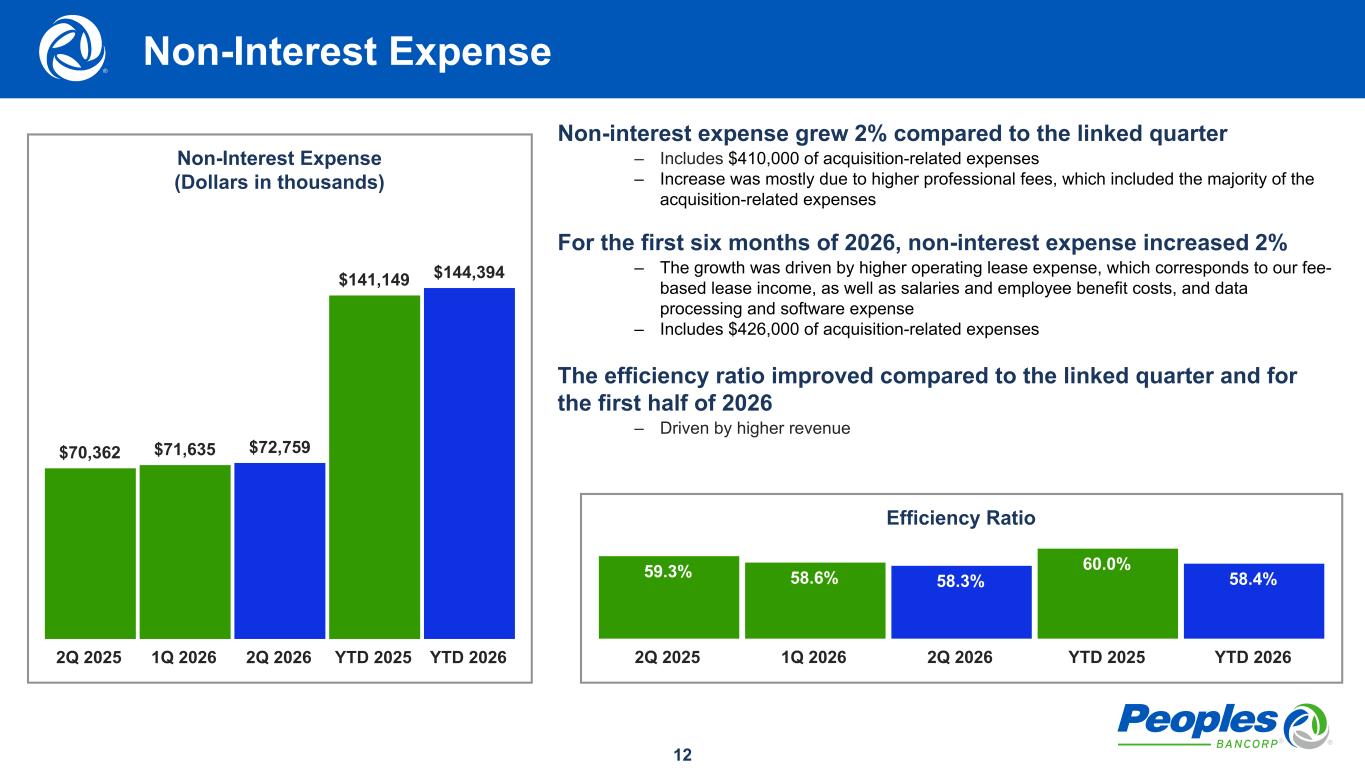
12 Non-interest expense grew 2% compared to the linked quarter – Includes $410,000 of acquisition-related expenses – Increase was mostly due to higher professional fees, which included the majority of the acquisition-related expenses For the first six months of 2026, non-interest expense increased 2% – The growth was driven by higher operating lease expense, which corresponds to our fee- based lease income, as well as salaries and employee benefit costs, and data processing and software expense – Includes $426,000 of acquisition-related expenses The efficiency ratio improved compared to the linked quarter and for the first half of 2026 – Driven by higher revenue Non-Interest Expense (Dollars in thousands) $70,362 $71,635 $72,759 $141,149 $144,394 2Q 2025 1Q 2026 2Q 2026 YTD 2025 YTD 2026 Efficiency Ratio 59.3% 58.6% 58.3% 60.0% 58.4% 2Q 2025 1Q 2026 2Q 2026 YTD 2025 YTD 2026 Non-Interest Expense
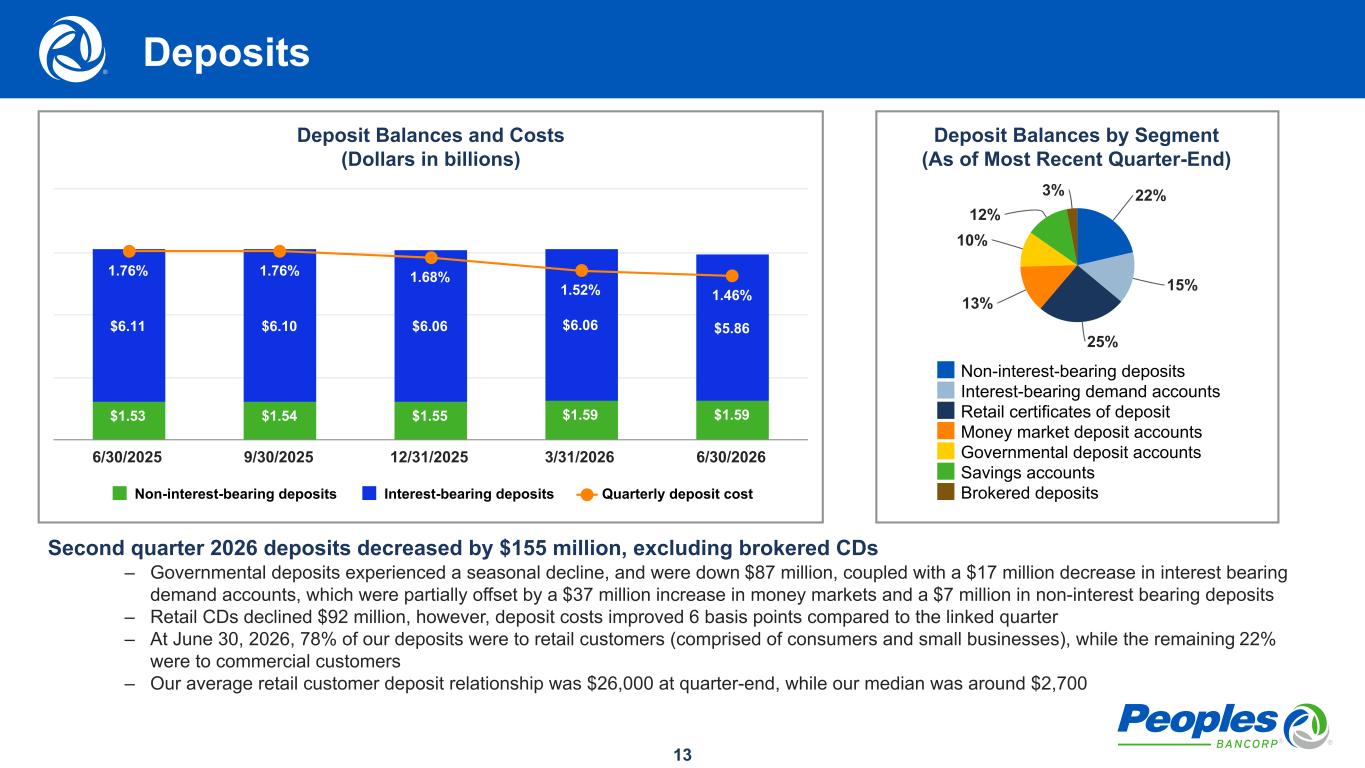
13 Deposit Balances by Segment (As of Most Recent Quarter-End) 22% 15% 25% 13% 10% 12% 3% Non-interest-bearing deposits Interest-bearing demand accounts Retail certificates of deposit Money market deposit accounts Governmental deposit accounts Savings accounts Brokered deposits Deposit Balances and Costs (Dollars in billions) $1.53 $1.54 $1.55 $1.59 $1.59 $6.11 $6.10 $6.06 $6.06 $5.86 1.76% 1.76% 1.68% 1.52% 1.46% Non-interest-bearing deposits Interest-bearing deposits Quarterly deposit cost 6/30/2025 9/30/2025 12/31/2025 3/31/2026 6/30/2026 Second quarter 2026 deposits decreased by $155 million, excluding brokered CDs – Governmental deposits experienced a seasonal decline, and were down $87 million, coupled with a $17 million decrease in interest bearing demand accounts, which were partially offset by a $37 million increase in money markets and a $7 million in non-interest bearing deposits – Retail CDs declined $92 million, however, deposit costs improved 6 basis points compared to the linked quarter – At June 30, 2026, 78% of our deposits were to retail customers (comprised of consumers and small businesses), while the remaining 22% were to commercial customers – Our average retail customer deposit relationship was $26,000 at quarter-end, while our median was around $2,700 Deposits
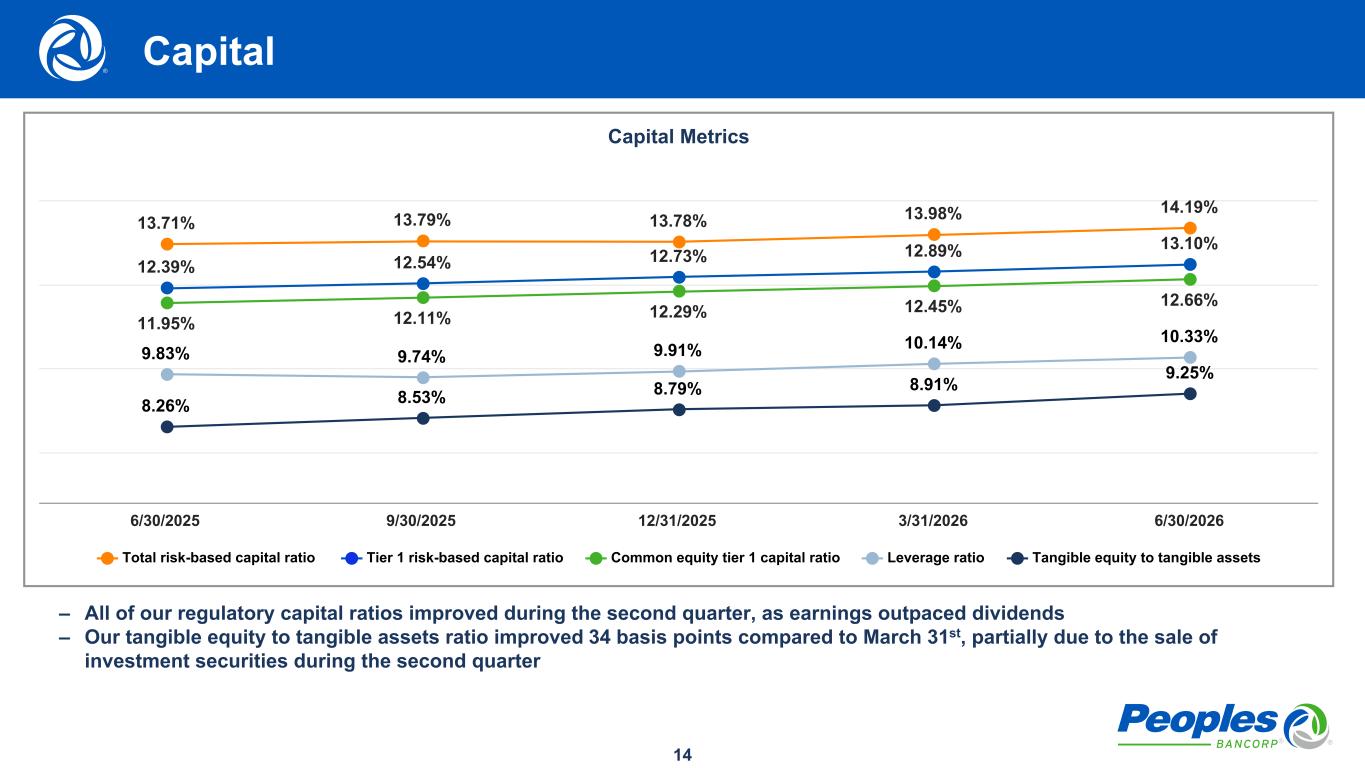
14 Capital Metrics 13.71% 13.79% 13.78% 13.98% 14.19% 12.39% 12.54% 12.73% 12.89% 13.10% 11.95% 12.11% 12.29% 12.45% 12.66% 9.83% 9.74% 9.91% 10.14% 10.33% 8.26% 8.53% 8.79% 8.91% 9.25% Total risk-based capital ratio Tier 1 risk-based capital ratio Common equity tier 1 capital ratio Leverage ratio Tangible equity to tangible assets 6/30/2025 9/30/2025 12/31/2025 3/31/2026 6/30/2026 – All of our regulatory capital ratios improved during the second quarter, as earnings outpaced dividends – Our tangible equity to tangible assets ratio improved 34 basis points compared to March 31st, partially due to the sale of investment securities during the second quarter Capital
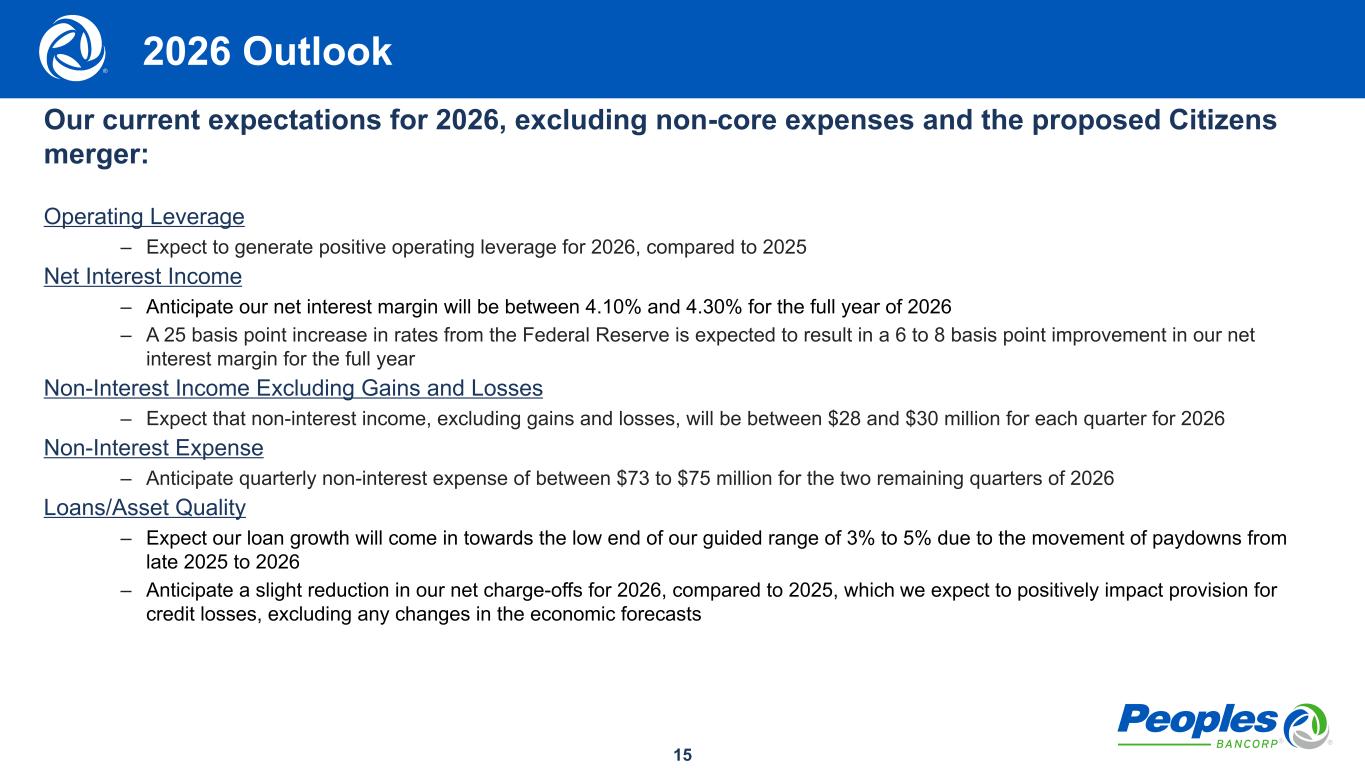
15 Our current expectations for 2026, excluding non-core expenses and the proposed Citizens merger: Operating Leverage – Expect to generate positive operating leverage for 2026, compared to 2025 Net Interest Income – Anticipate our net interest margin will be between 4.10% and 4.30% for the full year of 2026 – A 25 basis point increase in rates from the Federal Reserve is expected to result in a 6 to 8 basis point improvement in our net interest margin for the full year Non-Interest Income Excluding Gains and Losses – Expect that non-interest income, excluding gains and losses, will be between $28 and $30 million for each quarter for 2026 Non-Interest Expense – Anticipate quarterly non-interest expense of between $73 to $75 million for the two remaining quarters of 2026 Loans/Asset Quality – Expect our loan growth will come in towards the low end of our guided range of 3% to 5% due to the movement of paydowns from late 2025 to 2026 – Anticipate a slight reduction in our net charge-offs for 2026, compared to 2025, which we expect to positively impact provision for credit losses, excluding any changes in the economic forecasts 2026 Outlook
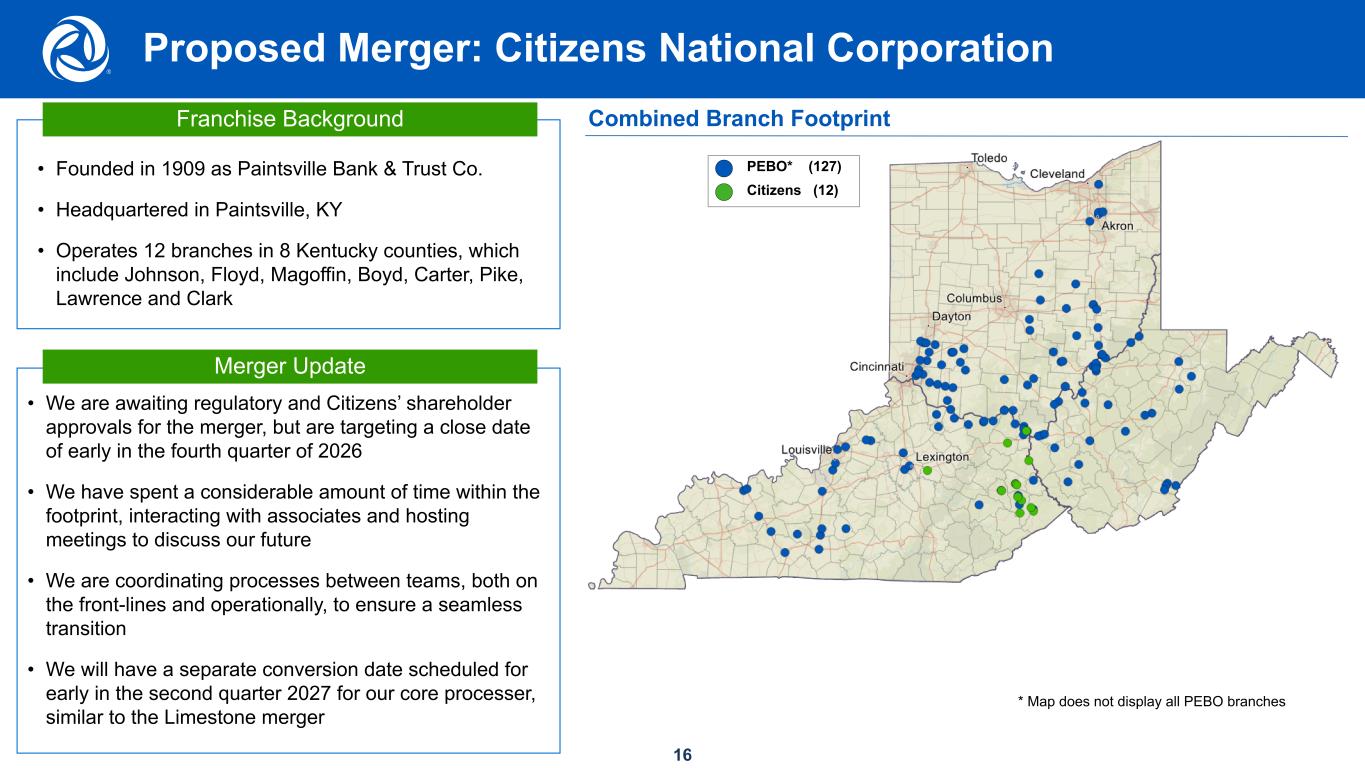
16 Proposed Merger: Citizens National Corporation Transaction Structure & Consideration Franchise Background Combined Branch Footprint PEBO* (127) Citizens (12) • Founded in 1909 as Paintsville Bank & Trust Co. • Headquartered in Paintsville, KY • Operates 12 branches in 8 Kentucky counties, which include Johnson, Floyd, Magoffin, Boyd, Carter, Pike, Lawrence and Clark * Map does not display all PEBO branches • We are awaiting regulatory and Citizens’ shareholder approvals for the merger, but are targeting a close date of early in the fourth quarter of 2026 • We have spent a considerable amount of time within the footprint, interacting with associates and hosting meetings to discuss our future • We are coordinating processes between teams, both on the front-lines and operationally, to ensure a seamless transition • We will have a separate conversion date scheduled for early in the second quarter 2027 for our core processer, similar to the Limestone merger Merger Update