Pay vs Performance Disclosure - USD ($)
Mar. 31, 2026
Mar. 31, 2025
Mar. 31, 2024
Mar. 31, 2023
Mar. 31, 2022
Pay versus Performance Table
As required by Section 953(a) of the Dodd-Frank Wall Street Reform and Consumer Protection Act, and Item 402(v) of Regulation
S-K,
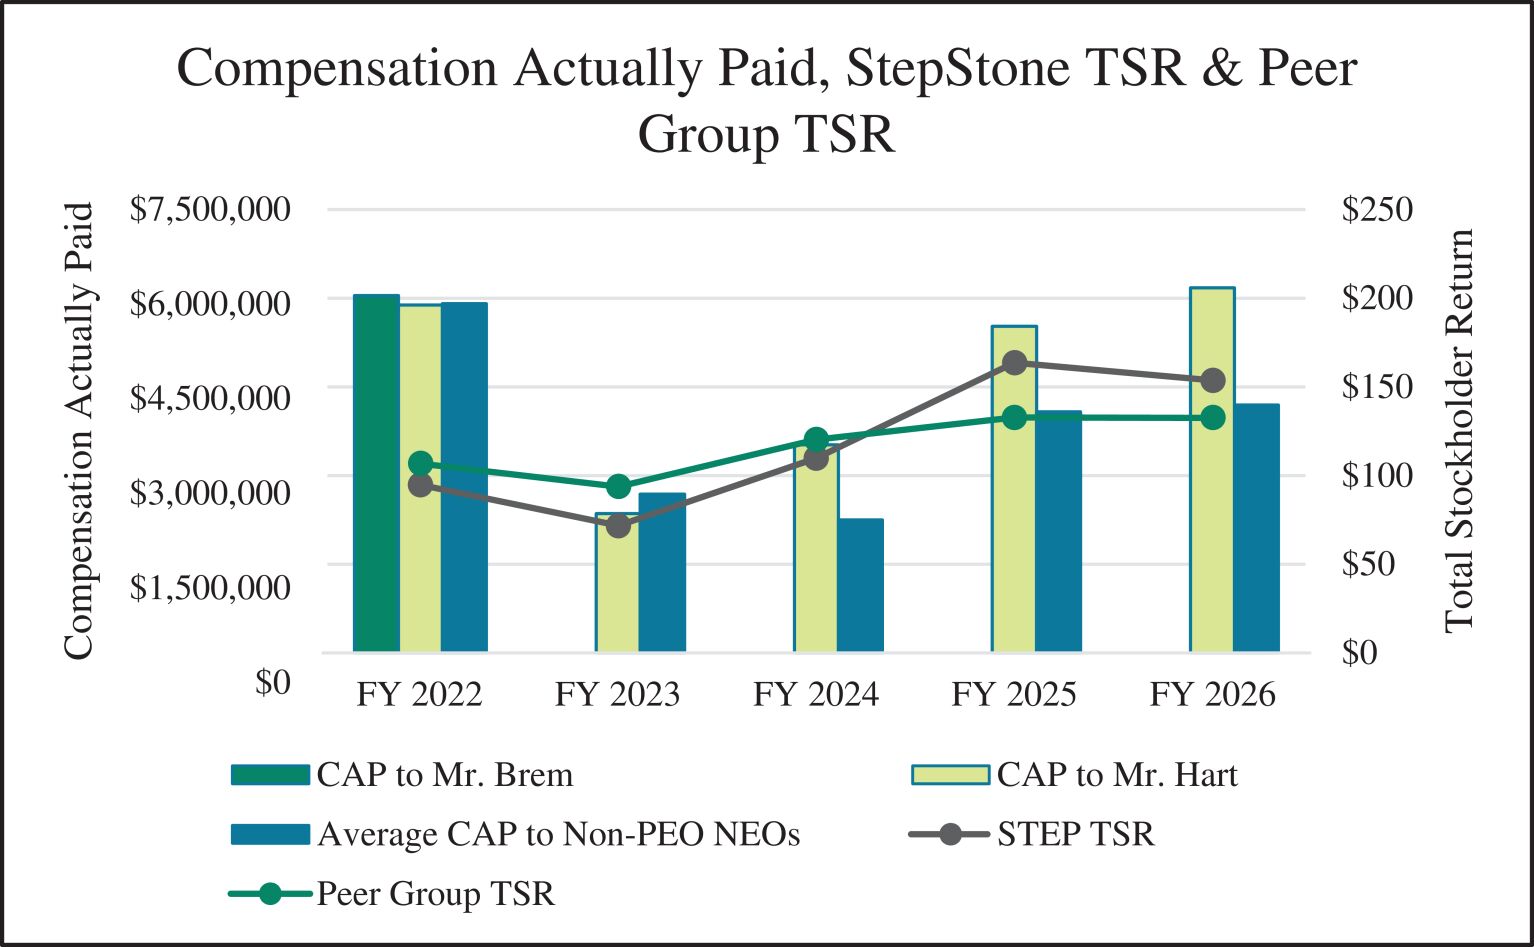
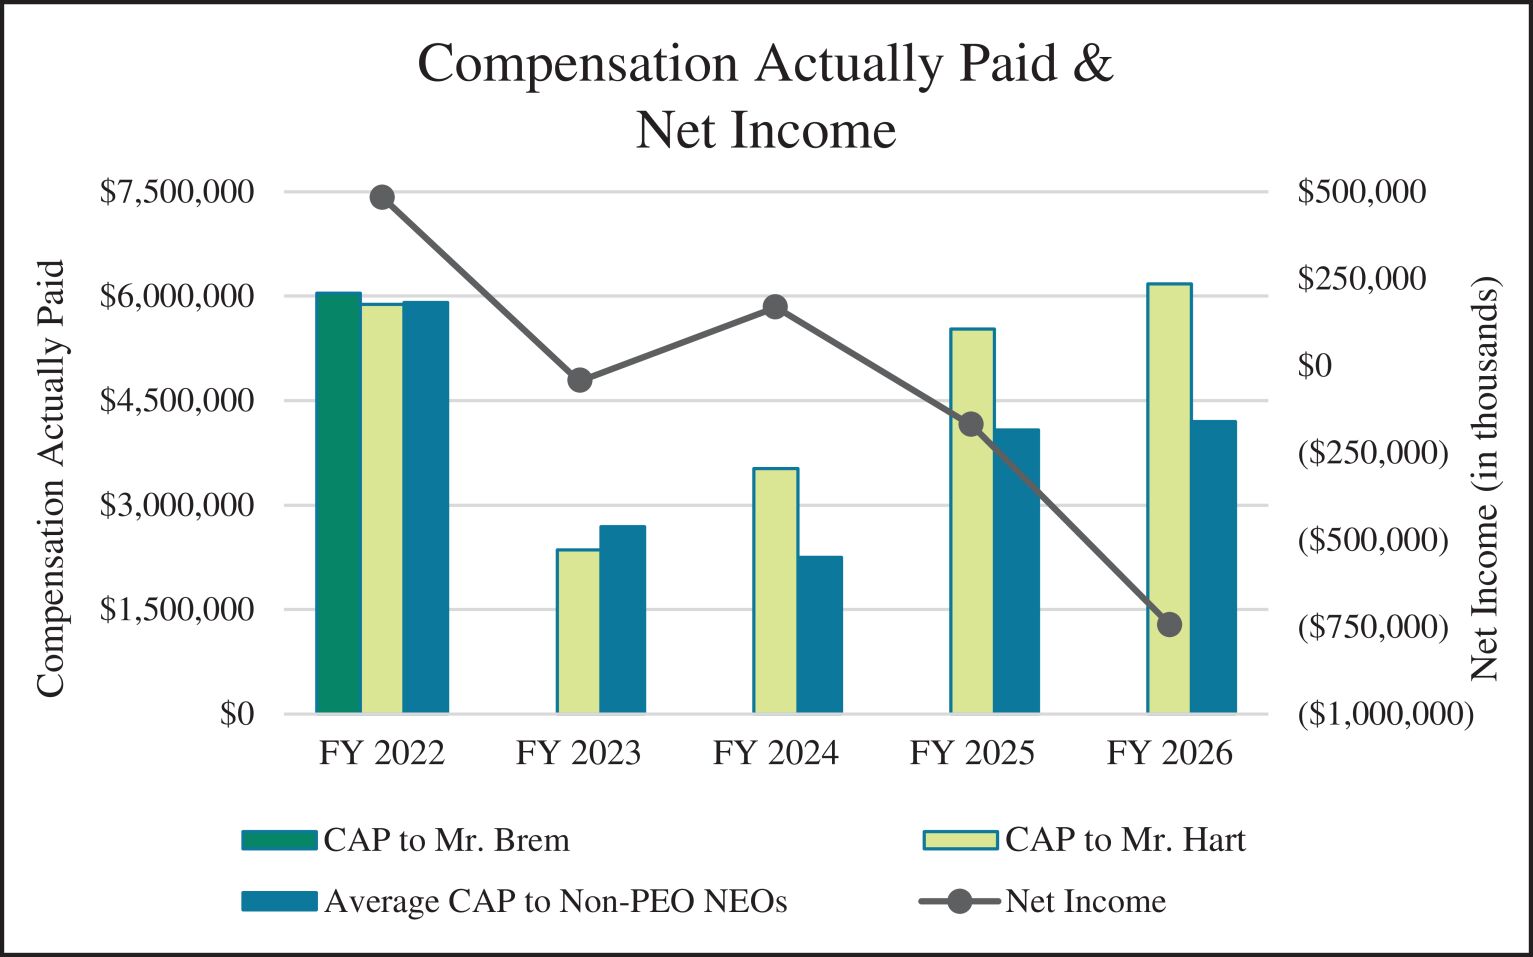
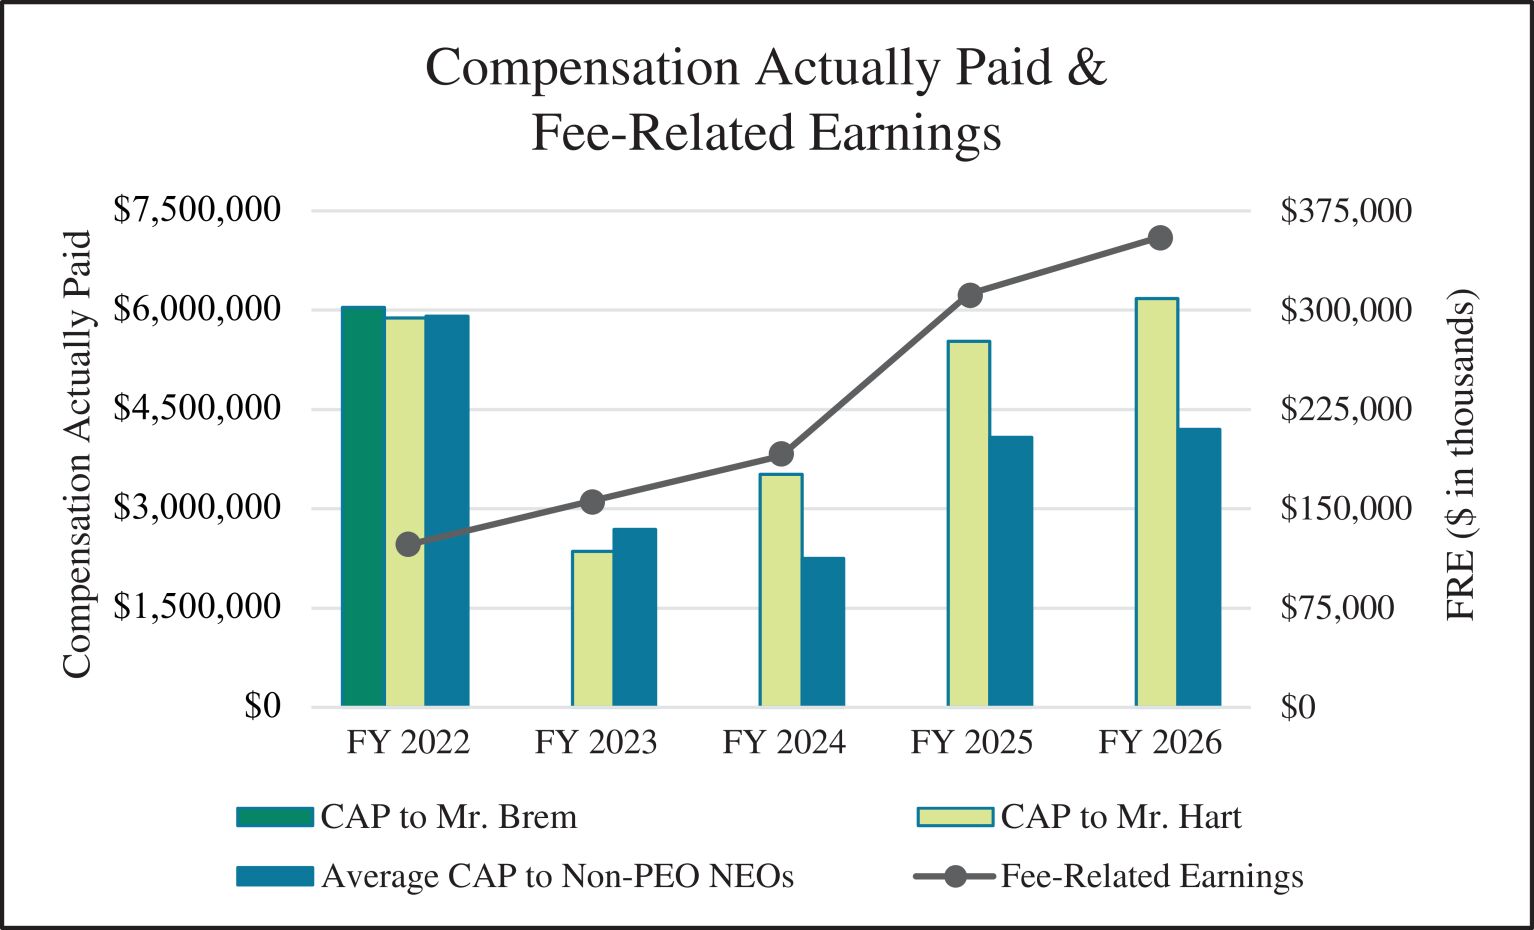
we are providing the following information about the relationship between executive “compensation actually paid” and certain financial performance of the Company. For further information concerning the Company’s pay for performance philosophy and how the Company aligns executive compensation with the Company’s performance, see the “Compensation Discussion and Analysis” above. Year |
Summary Compensation Table Total for Mr. Hart ($) (1) |
Summary Compensation Table Total for Mr. Brem ($) (1) |
Compensation Actually Paid to Mr. Hart ($) (2) |
Compensation Actually Paid to Mr. Brem ($) |
Average Summary Compensation Table Total for Non-PEO NEOs ($) (3) |
Average Compensation Actually Paid to Non-PEO NEOs ($) (4) |
Value of Initial Fixed $100 Investment Based On: |
Net Income ($ in thousands) (7) |
Fee- Related Earnings ($ in thousands) (8) |
|||||||||||||||||||||||||||||||
TSR ($) (5) |
Peer Group TSR ($) (6) |
|||||||||||||||||||||||||||||||||||||||
2026 |
$ | 6,091,776 | $ | N/A | $ | 6,178,639 | $ | N/A | $ | 4,152,729 | $ | 4,197,389 | $ | 153.63 | $ | 132.61 | $ | (743,276 | ) | $ | 354,449 | |||||||||||||||||||
2025 |
$ | 4,705,412 | N/A | $ | 5,528,770 | N/A | $ | 3,581,133 | $ | 4,079,119 | $ | 163.64 | $ | 132.90 | $ | (172,827 | ) | $ | 312,204 | |||||||||||||||||||||
2024 |
$ | 2,720,523 | N/A | $ | 3,523,650 | N/A | $ | 1,967,272 | $ | 2,247,099 | $ | 109.71 | $ | 120.24 | $ | 167,820 | $ | 189,793 | ||||||||||||||||||||||
2023 |
$ | 3,595,256 | N/A | $ | 2,353,504 | N/A | $ | 3,202,157 | $ | 2,688,046 | $ | 71.63 | $ | 93.61 | $ | (45,275 | ) | $ | 156,158 | |||||||||||||||||||||
2022 |
$ | 6,210,738 | $ | 6,044,087 | $ | 5,884,459 | $ | 6,044,087 | $ | 5,994,832 | $ | 5,911,642 | $ | 94.80 | $ | 106.70 | $ | 484,281 | $ | 122,242 | ||||||||||||||||||||
| (1) | Messrs. Hart and Brem served as Co-Chief Executive Officers during fiscal 2022 until January 1, 2022, at which point Mr. Brem transitioned to Executive Chairman and Mr. Hart became the sole Chief Executive Officer. The dollar amounts reported in these columns represent the amounts reported for Messrs. Hart and Brem as total compensation in our Summary Compensation Table for each of the corresponding fiscal years. See “Executive Compensation Tables—Summary Compensation Table” above. |
| (2) | The dollar amounts reported in this column represent the “compensation actually paid” to Mr. Hart , as computed in accordance with Item 402(v) of Regulation S-K and do not reflect the total compensation actually realized or received by Mr. Hart. In accordance with these rules, these amounts reflect total compensation as reported in the Summary Compensation Table for each fiscal year, adjusted as shown below for fiscal 2026. Equity values are calculated in accordance with FASB ASC Topic 718, and the valuation assumptions used to calculate fair values did not materially differ from those disclosed at the time of grant. |
2026 |
||||
Summary Compensation Table Total |
$ | 6,091,776 | ||
Less, value of “Stock Awards” reported in Summary Compensation Table |
$ | (1,249,985 | ) | |
Plus, year-end fair value of outstanding and unvested equity awards granted in the year |
$ | 1,322,894 | ||
Plus (less), year over year change in fair value of outstanding and unvested equity awards granted in prior years |
$ | (80,834 | ) | |
Plus (less), change in fair value from prior year-end to vesting date of equity awards granted in prior years that vested in the year |
$ | 94,788 | ||
Compensation Actually Paid to Mr. Hart |
$ | 6,178,639 | ||
| (3) | The dollar amounts reported in this column represent the average of the amounts reported for the Company’s named executive officers (NEOs) as a group (excluding Messrs. Hart and Brem) as total compensation in our Summary Compensation Table for each of the corresponding fiscal years. The names of each of the NEOs included for these purposes is as follows: (i) for fiscal 2025 and fiscal 2026, Messrs. Park, Ment, Fernandez, and McCabe; (ii) for fiscal 2024, Messrs. Park, Ment, Fernandez, McCabe and Johnny Randel (our former Chief Financial Officer); and (iii) for fiscal 2023 and fiscal 2022, Messrs. Randel, Ment, Fernandez and McCabe. |
| (4) | The dollar amounts reported in this column represent the “compensation actually paid” to the NEOs as a group (excluding Messrs. Hart and Brem), as computed in accordance with Item 402(v) of Regulation S-K. In accordance with these rules, these amounts reflect total compensation as reported in the Summary |
| Compensation Table for each fiscal year, adjusted as shown below for fiscal 2026. Equity values are calculated in accordance with FASB ASC Topic 718, and the valuation assumptions used to calculate fair values did not materially differ from those disclosed at the time of grant. |
2026 |
||||
Average Summary Compensation Table Total |
$ | 4,152,729 | ||
Less, average value of “Stock Awards” reported in Summary Compensation Table |
$ | (696,877 | ) | |
Plus, average year-end fair value of outstanding and unvested equity awards granted in the year |
$ | 737,525 | ||
Plus (less), average year over year change in fair value of outstanding and unvested equity awards granted in prior years |
$ | (41,988 | ) | |
Plus (less), average change in fair value from prior year-end to vesting date of equity awards granted in prior years that vested in the year |
$ | 46,000 | ||
Average Compensation Actually Paid to Non-PEO NEOs |
$ | 4,197,389 | ||
| (5) | Total Shareholder Return (TSR) is calculated by dividing (a) the sum of (i) the cumulative amount of dividends for the measurement period, assuming dividend reinvestment, and (ii) the difference between the Company’s share price at the end of each fiscal year shown and the beginning of the measurement period, by (b) the Company’s share price at the beginning of the measurement period. The beginning of the measurement period for each year in the table is March 31, 2021, the last day of the Company’s fiscal year prior to fiscal year 2022. |
| (6) | The peer group used for this purpose is the following published industry index: Dow Jones US Asset Managers Index. |
| (7) | The dollar amounts reported represent the amount of net income reflected in the Company’s audited financial statements for the applicable year. |
| (8) | The dollar amounts reported represent the amount of FRE for the applicable year. FRE is a non-GAAP performance measure and is composed of fee revenues, less adjusted expenses which are operating expenses other than (a) performance fee-related compensation, (b) equity-based compensation for awards granted prior to and in connection with our initial public offering (“IPO”), profits interests issued by our non-wholly owned subsidiaries, and unrealized mark-to-market |
| (2) | The dollar amounts reported in this column represent the “compensation actually paid” to Mr. Hart , as computed in accordance with Item 402(v) of Regulation S-K and do not reflect the total compensation actually realized or received by Mr. Hart. In accordance with these rules, these amounts reflect total compensation as reported in the Summary Compensation Table for each fiscal year, adjusted as shown below for fiscal 2026. Equity values are calculated in accordance with FASB ASC Topic 718, and the valuation assumptions used to calculate fair values did not materially differ from those disclosed at the time of grant. |
2026 |
||||
Summary Compensation Table Total |
$ | 6,091,776 | ||
Less, value of “Stock Awards” reported in Summary Compensation Table |
$ | (1,249,985 | ) | |
Plus, year-end fair value of outstanding and unvested equity awards granted in the year |
$ | 1,322,894 | ||
Plus (less), year over year change in fair value of outstanding and unvested equity awards granted in prior years |
$ | (80,834 | ) | |
Plus (less), change in fair value from prior year-end to vesting date of equity awards granted in prior years that vested in the year |
$ | 94,788 | ||
Compensation Actually Paid to Mr. Hart |
$ | 6,178,639 | ||
| (4) | The dollar amounts reported in this column represent the “compensation actually paid” to the NEOs as a group (excluding Messrs. Hart and Brem), as computed in accordance with Item 402(v) of Regulation S-K. In accordance with these rules, these amounts reflect total compensation as reported in the Summary |
| Compensation Table for each fiscal year, adjusted as shown below for fiscal 2026. Equity values are calculated in accordance with FASB ASC Topic 718, and the valuation assumptions used to calculate fair values did not materially differ from those disclosed at the time of grant. |
2026 |
||||
Average Summary Compensation Table Total |
$ | 4,152,729 | ||
Less, average value of “Stock Awards” reported in Summary Compensation Table |
$ | (696,877 | ) | |
Plus, average year-end fair value of outstanding and unvested equity awards granted in the year |
$ | 737,525 | ||
Plus (less), average year over year change in fair value of outstanding and unvested equity awards granted in prior years |
$ | (41,988 | ) | |
Plus (less), average change in fair value from prior year-end to vesting date of equity awards granted in prior years that vested in the year |
$ | 46,000 | ||
Average Compensation Actually Paid to Non-PEO NEOs |
$ | 4,197,389 | ||
Financial Performance Measures
As described further under the “Compensation Discussion and Analysis” above, the Company’s executive compensation program reflects our performance-based compensation culture. Although a large portion of our executive compensation program relies heavily on equity ownership and carried interest awards to create a direct link between the compensation realized by our NEOs and the interests of our stockholders and our clients, our annual bonus program utilizes a number of financial and
non-financial
performance measures to link executive compensation actually paid for fiscal 2026 to the Company’s performance: | • | FRE; |
| • | FRE margin; |
| • | FEAUM; |
| • | adjusted net income per share; |
| • | client relationship management; and |
| • | team and culture management. |
non-GAAP
performance measure and is composed of fee revenues, less adjusted expenses which are operating expenses other than (a) performance fee-related
compensation, (b) equity-based compensation for awards granted prior to and in connection with our initial public offering (“IPO”), profits interests issued by our non-wholly
owned subsidiaries, and unrealized mark-to-market