Shareholder Report
May 31, 2026
USD ($)
Holding
What were the fund costs during the last year ?
(Based on a hypothetical $10,000 investment)
| Fund (Class) | Costs of a $10,000 investment | Costs paid as a percentage of a $10,000 investment |
| Income Fund (Class R6/JSNWX) |
$42 | 0.41% |
Management’s Discussion of Fund Performance
SUMMARY OF RESULTS
Income Fund (Class R6/JSNWX) returned 5.78% for the year ended May 31, 2026. The most significant factors affecting fund performance during the period included fluctuations in global bond yields, three short-term interest rate cuts by the U.S. Federal Reserve, and escalating conflict in the Middle East, which sparked concerns about higher energy prices and inflation.
TOP PERFORMANCE CONTRIBUTORS
Duration (interest-rate sensitivity) | Declining global bond yields during portions of the period contributed to higher bond prices.
Corporate debt | High-yield and investment-grade corporate bonds, which comprised more than a third of the portfolio on average, were the top performers in global bond markets during the period.
Non-U.S. bonds | The fund’s holdings of bonds from outside of the U.S. contributed notably to performance, led by bonds from New Zealand, the Eurozone and Indonesia.
TOP PERFORMANCE DETRACTORS
Foreign currency positioning | Long exposures to the Japanese yen, Indian rupee, and Philippine peso alongside a short exposure to the Mexican peso detracted from performance.
The views expressed in this report are those of the portfolio management team and are subject to change. They are not meant as investment advice.
Fund Performance
The following graph compares the initial and subsequent account values at the end of each of the most recently completed 10 fiscal years of the fund (or for the life of the fund, if shorter). It assumes a $1,000,000 initial investment in the fund and in an appropriate, broad-based securities market index for the same period.
GROWTH OF $1,000,000
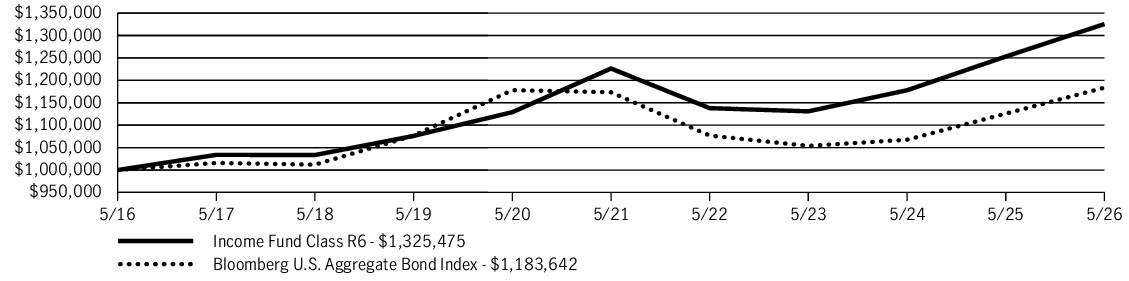
| AVERAGE ANNUAL TOTAL RETURN | 1 Year | 5 Years | 10 Years |
| Income Fund (Class R6/JSNWX) | 5.78% | 1.57% | 2.86% |
| Bloomberg U.S. Aggregate Bond Index | 5.13% | 0.17% | 1.70% |
Fund Statistics
| Fund net assets | $1,702,202,172 |
| Total number of portfolio holdings | 515 |
| Total advisory fees paid (net) | $5,992,533 |
| Portfolio turnover rate | 55% |
Graphical Representation of Holdings
The tables below show the investment makeup of the fund, representing a percentage of the total net assets of the fund.
Portfolio Composition
| Corporate bonds | 37.5% |
| Foreign government obligations | 24.8% |
| Term loans | 8.4% |
| U.S. Government | 8.0% |
| Collateralized mortgage obligations – Commercial and residential | 6.3% |
| U.S. Government Agency | 5.6% |
| Asset-backed securities | 2.4% |
| Preferred securities | 2.3% |
| Convertible bonds | 1.5% |
| Collateralized mortgage obligations – U.S. Government Agency | 0.6% |
| Short-term investments and other | 2.6% |
Quality Composition
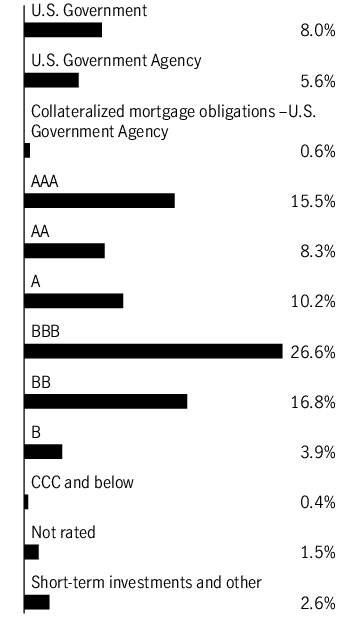
Ratings are from Moody’s Investors Service, Inc. If not available, we have used S&P Global Ratings. In the absence of ratings from these agencies, we have used Fitch Ratings, Inc. “Not rated” securities are those with no ratings available from these agencies. All ratings are as of 5-31-26 and do not reflect subsequent downgrades or upgrades, if any.
Holdings may not have been held by the fund for the entire period and are subject to change without notice. Portfolio composition is subject to review in accordance with the fund’s investment strategy and may vary in the future. Current and future portfolio holdings are subject to risk and may change at any time.
Ratings are from Moody’s Investors Service, Inc. If not available, we have used S&P Global Ratings. In the absence of ratings from these agencies, we have used Fitch Ratings, Inc. “Not rated” securities are those with no ratings available from these agencies. All ratings are as of 5-31-26 and do not reflect subsequent downgrades or upgrades, if any.
What were the fund costs during the last year ?
(Based on a hypothetical $10,000 investment)
| Fund (Class) | Costs of a $10,000 investment | Costs paid as a percentage of a $10,000 investment |
| Income Fund (Class R5/JSNVX) |
$47 | 0.46% |
Management’s Discussion of Fund Performance
SUMMARY OF RESULTS
Income Fund (Class R5/JSNVX) returned 5.91% for the year ended May 31, 2026. The most significant factors affecting fund performance during the period included fluctuations in global bond yields, three short-term interest rate cuts by the U.S. Federal Reserve, and escalating conflict in the Middle East, which sparked concerns about higher energy prices and inflation.
TOP PERFORMANCE CONTRIBUTORS
Duration (interest-rate sensitivity) | Declining global bond yields during portions of the period contributed to higher bond prices.
Corporate debt | High-yield and investment-grade corporate bonds, which comprised more than a third of the portfolio on average, were the top performers in global bond markets during the period.
Non-U.S. bonds | The fund’s holdings of bonds from outside of the U.S. contributed notably to performance, led by bonds from New Zealand, the Eurozone and Indonesia.
TOP PERFORMANCE DETRACTORS
Foreign currency positioning | Long exposures to the Japanese yen, Indian rupee, and Philippine peso alongside a short exposure to the Mexican peso detracted from performance.
The views expressed in this report are those of the portfolio management team and are subject to change. They are not meant as investment advice.
Fund Performance
The following graph compares the initial and subsequent account values at the end of each of the most recently completed 10 fiscal years of the fund (or for the life of the fund, if shorter). It assumes a $10,000 initial investment in the fund and in an appropriate, broad-based securities market index for the same period.
GROWTH OF $10,000
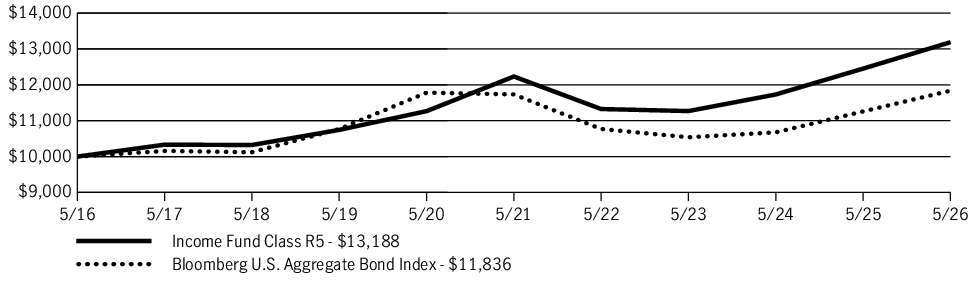
| AVERAGE ANNUAL TOTAL RETURN | 1 Year | 5 Years | 10 Years |
| Income Fund (Class R5/JSNVX) | 5.91% | 1.52% | 2.81% |
| Bloomberg U.S. Aggregate Bond Index | 5.13% | 0.17% | 1.70% |
Fund Statistics
| Fund net assets | $1,702,202,172 |
| Total number of portfolio holdings | 515 |
| Total advisory fees paid (net) | $5,992,533 |
| Portfolio turnover rate | 55% |
Graphical Representation of Holdings
The tables below show the investment makeup of the fund, representing a percentage of the total net assets of the fund.
Portfolio Composition
| Corporate bonds | 37.5% |
| Foreign government obligations | 24.8% |
| Term loans | 8.4% |
| U.S. Government | 8.0% |
| Collateralized mortgage obligations – Commercial and residential | 6.3% |
| U.S. Government Agency | 5.6% |
| Asset-backed securities | 2.4% |
| Preferred securities | 2.3% |
| Convertible bonds | 1.5% |
| Collateralized mortgage obligations – U.S. Government Agency | 0.6% |
| Short-term investments and other | 2.6% |
Quality Composition
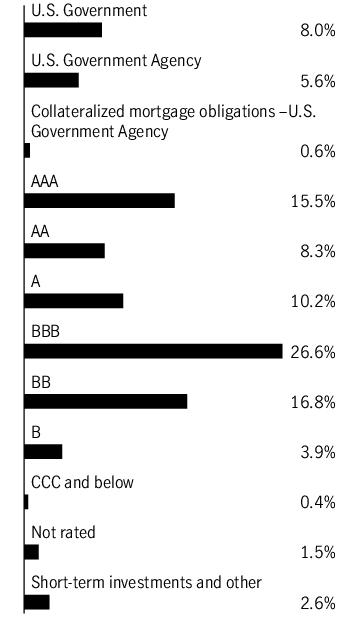
Ratings are from Moody’s Investors Service, Inc. If not available, we have used S&P Global Ratings. In the absence of ratings from these agencies, we have used Fitch Ratings, Inc. “Not rated” securities are those with no ratings available from these agencies. All ratings are as of 5-31-26 and do not reflect subsequent downgrades or upgrades, if any.
Holdings may not have been held by the fund for the entire period and are subject to change without notice. Portfolio composition is subject to review in accordance with the fund’s investment strategy and may vary in the future. Current and future portfolio holdings are subject to risk and may change at any time.
Ratings are from Moody’s Investors Service, Inc. If not available, we have used S&P Global Ratings. In the absence of ratings from these agencies, we have used Fitch Ratings, Inc. “Not rated” securities are those with no ratings available from these agencies. All ratings are as of 5-31-26 and do not reflect subsequent downgrades or upgrades, if any.
What were the fund costs during the last year ?
(Based on a hypothetical $10,000 investment)
| Fund (Class) | Costs of a $10,000 investment | Costs paid as a percentage of a $10,000 investment |
| Income Fund (Class R4/JSNFX) |
$68 | 0.66% |
Management’s Discussion of Fund Performance
SUMMARY OF RESULTS
Income Fund (Class R4/JSNFX) returned 5.69% for the year ended May 31, 2026. The most significant factors affecting fund performance during the period included fluctuations in global bond yields, three short-term interest rate cuts by the U.S. Federal Reserve, and escalating conflict in the Middle East, which sparked concerns about higher energy prices and inflation.
TOP PERFORMANCE CONTRIBUTORS
Duration (interest-rate sensitivity) | Declining global bond yields during portions of the period contributed to higher bond prices.
Corporate debt | High-yield and investment-grade corporate bonds, which comprised more than a third of the portfolio on average, were the top performers in global bond markets during the period.
Non-U.S. bonds | The fund’s holdings of bonds from outside of the U.S. contributed notably to performance, led by bonds from New Zealand, the Eurozone and Indonesia.
TOP PERFORMANCE DETRACTORS
Foreign currency positioning | Long exposures to the Japanese yen, Indian rupee, and Philippine peso alongside a short exposure to the Mexican peso detracted from performance.
The views expressed in this report are those of the portfolio management team and are subject to change. They are not meant as investment advice.
Fund Performance
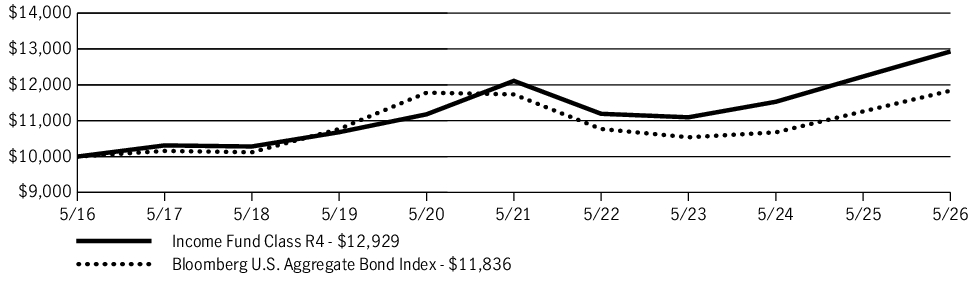
The following graph compares the initial and subsequent account values at the end of each of the most recently completed 10 fiscal years of the fund (or for the life of the fund, if shorter). It assumes a $10,000 initial investment in the fund and in an appropriate, broad-based securities market index for the same period.
GROWTH OF $10,000
| AVERAGE ANNUAL TOTAL RETURN | 1 Year | 5 Years | 10 Years |
| Income Fund (Class R4/JSNFX) | 5.69% | 1.32% | 2.60% |
| Bloomberg U.S. Aggregate Bond Index | 5.13% | 0.17% | 1.70% |
Fund Statistics
| Fund net assets | $1,702,202,172 |
| Total number of portfolio holdings | 515 |
| Total advisory fees paid (net) | $5,992,533 |
| Portfolio turnover rate | 55% |
Graphical Representation of Holdings
The tables below show the investment makeup of the fund, representing a percentage of the total net assets of the fund.
Portfolio Composition
| Corporate bonds | 37.5% |
| Foreign government obligations | 24.8% |
| Term loans | 8.4% |
| U.S. Government | 8.0% |
| Collateralized mortgage obligations – Commercial and residential | 6.3% |
| U.S. Government Agency | 5.6% |
| Asset-backed securities | 2.4% |
| Preferred securities | 2.3% |
| Convertible bonds | 1.5% |
| Collateralized mortgage obligations – U.S. Government Agency | 0.6% |
| Short-term investments and other | 2.6% |
Quality Composition
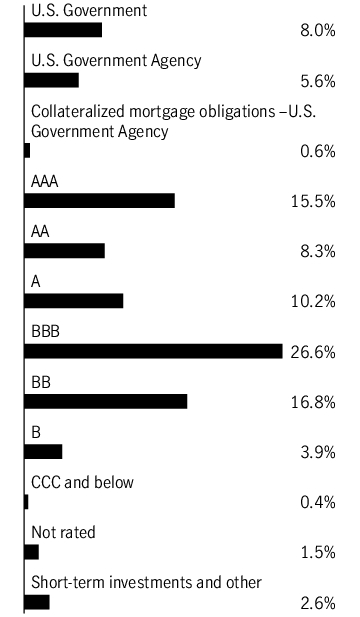
Ratings are from Moody’s Investors Service, Inc. If not available, we have used S&P Global Ratings. In the absence of ratings from these agencies, we have used Fitch Ratings, Inc. “Not rated” securities are those with no ratings available from these agencies. All ratings are as of 5-31-26 and do not reflect subsequent downgrades or upgrades, if any.
Holdings may not have been held by the fund for the entire period and are subject to change without notice. Portfolio composition is subject to review in accordance with the fund’s investment strategy and may vary in the future. Current and future portfolio holdings are subject to risk and may change at any time.
Ratings are from Moody’s Investors Service, Inc. If not available, we have used S&P Global Ratings. In the absence of ratings from these agencies, we have used Fitch Ratings, Inc. “Not rated” securities are those with no ratings available from these agencies. All ratings are as of 5-31-26 and do not reflect subsequent downgrades or upgrades, if any.
What were the fund costs during the last year ?
(Based on a hypothetical $10,000 investment)
| Fund (Class) | Costs of a $10,000 investment | Costs paid as a percentage of a $10,000 investment |
| Income Fund (Class R2/JSNSX) |
$93 | 0.91% |
Management’s Discussion of Fund Performance
SUMMARY OF RESULTS
Income Fund (Class R2/JSNSX) returned 5.43% for the year ended May 31, 2026. The most significant factors affecting fund performance during the period included fluctuations in global bond yields, three short-term interest rate cuts by the U.S. Federal Reserve, and escalating conflict in the Middle East, which sparked concerns about higher energy prices and inflation.
TOP PERFORMANCE CONTRIBUTORS
Duration (interest-rate sensitivity) | Declining global bond yields during portions of the period contributed to higher bond prices.
Corporate debt | High-yield and investment-grade corporate bonds, which comprised more than a third of the portfolio on average, were the top performers in global bond markets during the period.
Non-U.S. bonds | The fund’s holdings of bonds from outside of the U.S. contributed notably to performance, led by bonds from New Zealand, the Eurozone and Indonesia.
TOP PERFORMANCE DETRACTORS
Foreign currency positioning | Long exposures to the Japanese yen, Indian rupee, and Philippine peso alongside a short exposure to the Mexican peso detracted from performance.
The views expressed in this report are those of the portfolio management team and are subject to change. They are not meant as investment advice.
Fund Performance
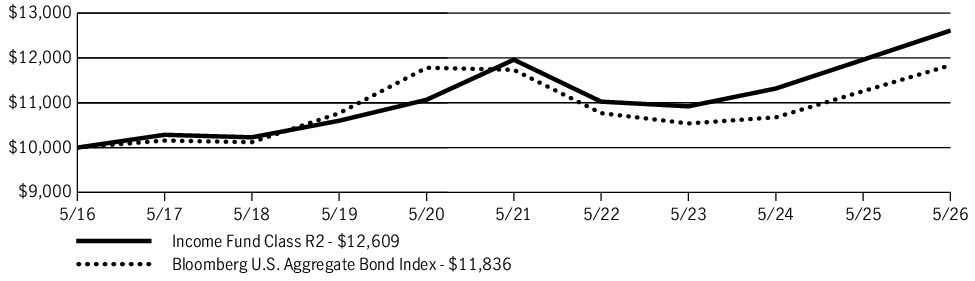
The following graph compares the initial and subsequent account values at the end of each of the most recently completed 10 fiscal years of the fund (or for the life of the fund, if shorter). It assumes a $10,000 initial investment in the fund and in an appropriate, broad-based securities market index for the same period.
GROWTH OF $10,000
| AVERAGE ANNUAL TOTAL RETURN | 1 Year | 5 Years | 10 Years |
| Income Fund (Class R2/JSNSX) | 5.43% | 1.06% | 2.35% |
| Bloomberg U.S. Aggregate Bond Index | 5.13% | 0.17% | 1.70% |
Fund Statistics
| Fund net assets | $1,702,202,172 |
| Total number of portfolio holdings | 515 |
| Total advisory fees paid (net) | $5,992,533 |
| Portfolio turnover rate | 55% |
Graphical Representation of Holdings
The tables below show the investment makeup of the fund, representing a percentage of the total net assets of the fund.
Portfolio Composition
| Corporate bonds | 37.5% |
| Foreign government obligations | 24.8% |
| Term loans | 8.4% |
| U.S. Government | 8.0% |
| Collateralized mortgage obligations – Commercial and residential | 6.3% |
| U.S. Government Agency | 5.6% |
| Asset-backed securities | 2.4% |
| Preferred securities | 2.3% |
| Convertible bonds | 1.5% |
| Collateralized mortgage obligations – U.S. Government Agency | 0.6% |
| Short-term investments and other | 2.6% |
Quality Composition
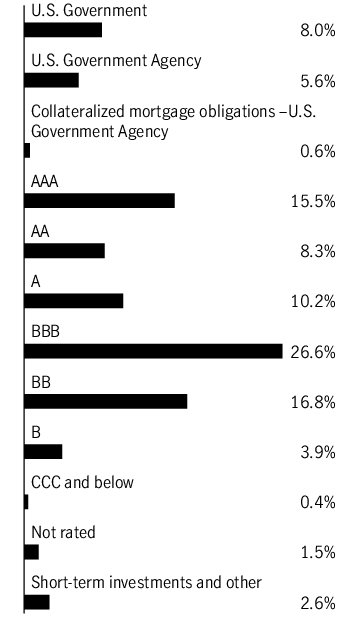
Ratings are from Moody’s Investors Service, Inc. If not available, we have used S&P Global Ratings. In the absence of ratings from these agencies, we have used Fitch Ratings, Inc. “Not rated” securities are those with no ratings available from these agencies. All ratings are as of 5-31-26 and do not reflect subsequent downgrades or upgrades, if any.
Holdings may not have been held by the fund for the entire period and are subject to change without notice. Portfolio composition is subject to review in accordance with the fund’s investment strategy and may vary in the future. Current and future portfolio holdings are subject to risk and may change at any time.
Ratings are from Moody’s Investors Service, Inc. If not available, we have used S&P Global Ratings. In the absence of ratings from these agencies, we have used Fitch Ratings, Inc. “Not rated” securities are those with no ratings available from these agencies. All ratings are as of 5-31-26 and do not reflect subsequent downgrades or upgrades, if any.
What were the fund costs during the last year ?
(Based on a hypothetical $10,000 investment)
| Fund (Class) | Costs of a $10,000 investment | Costs paid as a percentage of a $10,000 investment |
| Income Fund (Class I/JSTIX) |
$52 | 0.51% |
Management’s Discussion of Fund Performance
SUMMARY OF RESULTS
Income Fund (Class I/JSTIX) returned 5.85% for the year ended May 31, 2026. The most significant factors affecting fund performance during the period included fluctuations in global bond yields, three short-term interest rate cuts by the U.S. Federal Reserve, and escalating conflict in the Middle East, which sparked concerns about higher energy prices and inflation.
TOP PERFORMANCE CONTRIBUTORS
Duration (interest-rate sensitivity) | Declining global bond yields during portions of the period contributed to higher bond prices.
Corporate debt | High-yield and investment-grade corporate bonds, which comprised more than a third of the portfolio on average, were the top performers in global bond markets during the period.
Non-U.S. bonds | The fund’s holdings of bonds from outside of the U.S. contributed notably to performance, led by bonds from New Zealand, the Eurozone and Indonesia.
TOP PERFORMANCE DETRACTORS
Foreign currency positioning | Long exposures to the Japanese yen, Indian rupee, and Philippine peso alongside a short exposure to the Mexican peso detracted from performance.
The views expressed in this report are those of the portfolio management team and are subject to change. They are not meant as investment advice.
Fund Performance
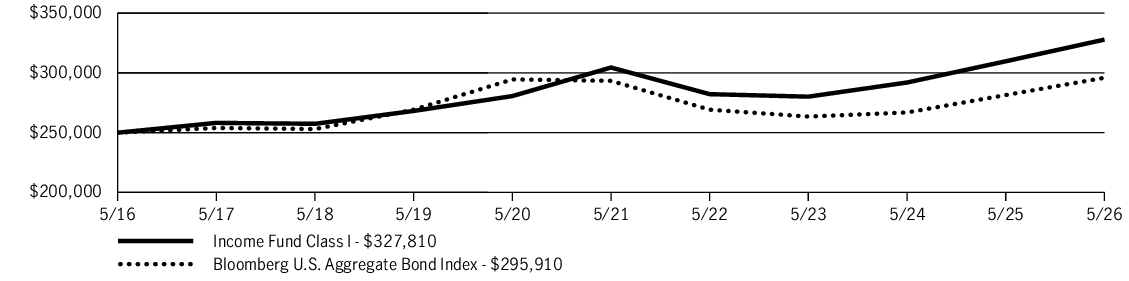
The following graph compares the initial and subsequent account values at the end of each of the most recently completed 10 fiscal years of the fund (or for the life of the fund, if shorter). It assumes a $250,000 initial investment in the fund and in an appropriate, broad-based securities market index for the same period.
GROWTH OF $250,000
| AVERAGE ANNUAL TOTAL RETURN | 1 Year | 5 Years | 10 Years |
| Income Fund (Class I/JSTIX) | 5.85% | 1.49% | 2.75% |
| Bloomberg U.S. Aggregate Bond Index | 5.13% | 0.17% | 1.70% |
Fund Statistics
| Fund net assets | $1,702,202,172 |
| Total number of portfolio holdings | 515 |
| Total advisory fees paid (net) | $5,992,533 |
| Portfolio turnover rate | 55% |
Graphical Representation of Holdings
The tables below show the investment makeup of the fund, representing a percentage of the total net assets of the fund.
Portfolio Composition
| Corporate bonds | 37.5% |
| Foreign government obligations | 24.8% |
| Term loans | 8.4% |
| U.S. Government | 8.0% |
| Collateralized mortgage obligations – Commercial and residential | 6.3% |
| U.S. Government Agency | 5.6% |
| Asset-backed securities | 2.4% |
| Preferred securities | 2.3% |
| Convertible bonds | 1.5% |
| Collateralized mortgage obligations – U.S. Government Agency | 0.6% |
| Short-term investments and other | 2.6% |
Quality Composition
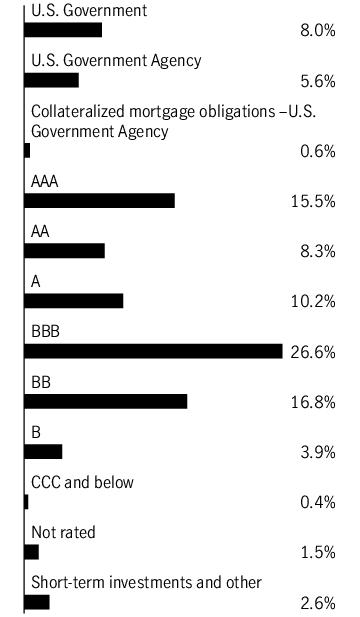
Ratings are from Moody’s Investors Service, Inc. If not available, we have used S&P Global Ratings. In the absence of ratings from these agencies, we have used Fitch Ratings, Inc. “Not rated” securities are those with no ratings available from these agencies. All ratings are as of 5-31-26 and do not reflect subsequent downgrades or upgrades, if any.
Holdings may not have been held by the fund for the entire period and are subject to change without notice. Portfolio composition is subject to review in accordance with the fund’s investment strategy and may vary in the future. Current and future portfolio holdings are subject to risk and may change at any time.
Ratings are from Moody’s Investors Service, Inc. If not available, we have used S&P Global Ratings. In the absence of ratings from these agencies, we have used Fitch Ratings, Inc. “Not rated” securities are those with no ratings available from these agencies. All ratings are as of 5-31-26 and do not reflect subsequent downgrades or upgrades, if any.
What were the fund costs during the last year ?
(Based on a hypothetical $10,000 investment)
| Fund (Class) | Costs of a $10,000 investment | Costs paid as a percentage of a $10,000 investment |
| Income Fund (Class C/JSTCX) |
$155 | 1.51% |
Management’s Discussion of Fund Performance
SUMMARY OF RESULTS
Income Fund (Class C/JSTCX) returned 4.80% (excluding sales charges) for the year ended May 31, 2026. The most significant factors affecting fund performance during the period included fluctuations in global bond yields, three short-term interest rate cuts by the U.S. Federal Reserve, and escalating conflict in the Middle East, which sparked concerns about higher energy prices and inflation.
TOP PERFORMANCE CONTRIBUTORS
Duration (interest-rate sensitivity) | Declining global bond yields during portions of the period contributed to higher bond prices.
Corporate debt | High-yield and investment-grade corporate bonds, which comprised more than a third of the portfolio on average, were the top performers in global bond markets during the period.
Non-U.S. bonds | The fund’s holdings of bonds from outside of the U.S. contributed notably to performance, led by bonds from New Zealand, the Eurozone and Indonesia.
TOP PERFORMANCE DETRACTORS
Foreign currency positioning | Long exposures to the Japanese yen, Indian rupee, and Philippine peso alongside a short exposure to the Mexican peso detracted from performance.
The views expressed in this report are those of the portfolio management team and are subject to change. They are not meant as investment advice.
Fund Performance
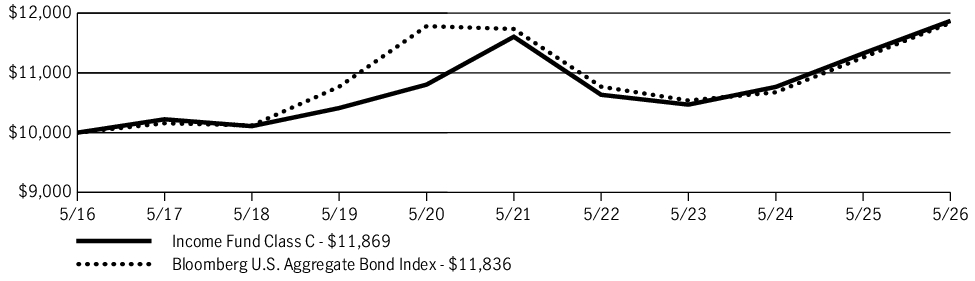
The following graph compares the initial and subsequent account values at the end of each of the most recently completed 10 fiscal years of the fund (or for the life of the fund, if shorter). It assumes a $10,000 initial investment in the fund and in an appropriate, broad-based securities market index for the same period.
GROWTH OF $10,000
| AVERAGE ANNUAL TOTAL RETURN | 1 Year | 5 Years | 10 Years |
| Income Fund (Class C/JSTCX) | 3.80% | 0.45% | 1.73% |
| Income Fund (Class C/JSTCX)—excluding sales charge | 4.80% | 0.45% | 1.73% |
| Bloomberg U.S. Aggregate Bond Index | 5.13% | 0.17% | 1.70% |
Fund Statistics
| Fund net assets | $1,702,202,172 |
| Total number of portfolio holdings | 515 |
| Total advisory fees paid (net) | $5,992,533 |
| Portfolio turnover rate | 55% |
Graphical Representation of Holdings
The tables below show the investment makeup of the fund, representing a percentage of the total net assets of the fund.
Portfolio Composition
| Corporate bonds | 37.5% |
| Foreign government obligations | 24.8% |
| Term loans | 8.4% |
| U.S. Government | 8.0% |
| Collateralized mortgage obligations – Commercial and residential | 6.3% |
| U.S. Government Agency | 5.6% |
| Asset-backed securities | 2.4% |
| Preferred securities | 2.3% |
| Convertible bonds | 1.5% |
| Collateralized mortgage obligations – U.S. Government Agency | 0.6% |
| Short-term investments and other | 2.6% |
Quality Composition
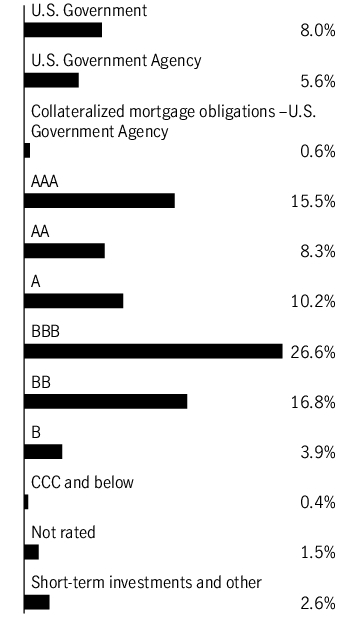
Ratings are from Moody’s Investors Service, Inc. If not available, we have used S&P Global Ratings. In the absence of ratings from these agencies, we have used Fitch Ratings, Inc. “Not rated” securities are those with no ratings available from these agencies. All ratings are as of 5-31-26 and do not reflect subsequent downgrades or upgrades, if any.
Holdings may not have been held by the fund for the entire period and are subject to change without notice. Portfolio composition is subject to review in accordance with the fund’s investment strategy and may vary in the future. Current and future portfolio holdings are subject to risk and may change at any time.
Ratings are from Moody’s Investors Service, Inc. If not available, we have used S&P Global Ratings. In the absence of ratings from these agencies, we have used Fitch Ratings, Inc. “Not rated” securities are those with no ratings available from these agencies. All ratings are as of 5-31-26 and do not reflect subsequent downgrades or upgrades, if any.
What were the fund costs during the last year ?
(Based on a hypothetical $10,000 investment)
| Fund (Class) | Costs of a $10,000 investment | Costs paid as a percentage of a $10,000 investment |
| Income Fund (Class A/JHFIX) |
$83 | 0.81% |
Management’s Discussion of Fund Performance
SUMMARY OF RESULTS
Income Fund (Class A/JHFIX) returned 5.53% (excluding sales charges) for the year ended May 31, 2026. The most significant factors affecting fund performance during the period included fluctuations in global bond yields, three short-term interest rate cuts by the U.S. Federal Reserve, and escalating conflict in the Middle East, which sparked concerns about higher energy prices and inflation.
TOP PERFORMANCE CONTRIBUTORS
Duration (interest-rate sensitivity) | Declining global bond yields during portions of the period contributed to higher bond prices.
Corporate debt | High-yield and investment-grade corporate bonds, which comprised more than a third of the portfolio on average, were the top performers in global bond markets during the period.
Non-U.S. bonds | The fund’s holdings of bonds from outside of the U.S. contributed notably to performance, led by bonds from New Zealand, the Eurozone and Indonesia.
TOP PERFORMANCE DETRACTORS
Foreign currency positioning | Long exposures to the Japanese yen, Indian rupee, and Philippine peso alongside a short exposure to the Mexican peso detracted from performance.
The views expressed in this report are those of the portfolio management team and are subject to change. They are not meant as investment advice.
Fund Performance
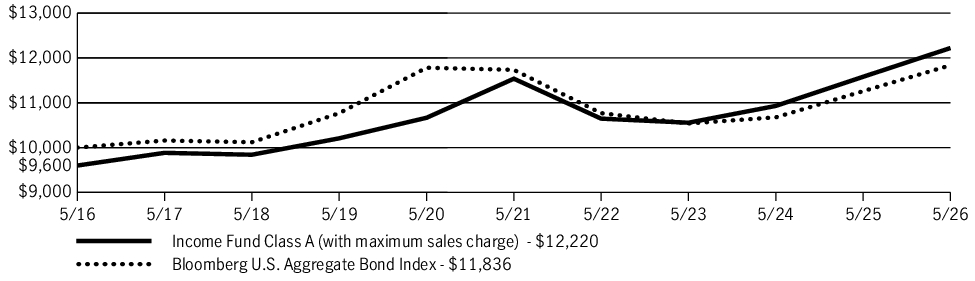
The following graph compares the initial and subsequent account values at the end of each of the most recently completed 10 fiscal years of the fund (or for the life of the fund, if shorter). It assumes a $10,000 initial investment in the fund and in an appropriate, broad-based securities market index for the same period.
GROWTH OF $10,000
| AVERAGE ANNUAL TOTAL RETURN | 1 Year | 5 Years | 10 Years |
| Income Fund (Class A/JHFIX) | 1.38% | 0.34% | 2.02% |
| Income Fund (Class A/JHFIX)—excluding sales charge | 5.53% | 1.16% | 2.44% |
| Bloomberg U.S. Aggregate Bond Index | 5.13% | 0.17% | 1.70% |
Fund Statistics
| Fund net assets | $1,702,202,172 |
| Total number of portfolio holdings | 515 |
| Total advisory fees paid (net) | $5,992,533 |
| Portfolio turnover rate | 55% |
Graphical Representation of Holdings
The tables below show the investment makeup of the fund, representing a percentage of the total net assets of the fund.
Portfolio Composition
| Corporate bonds | 37.5% |
| Foreign government obligations | 24.8% |
| Term loans | 8.4% |
| U.S. Government | 8.0% |
| Collateralized mortgage obligations – Commercial and residential | 6.3% |
| U.S. Government Agency | 5.6% |
| Asset-backed securities | 2.4% |
| Preferred securities | 2.3% |
| Convertible bonds | 1.5% |
| Collateralized mortgage obligations – U.S. Government Agency | 0.6% |
| Short-term investments and other | 2.6% |
Quality Composition
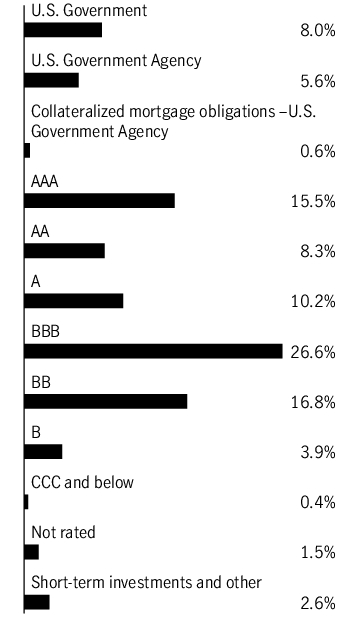
Ratings are from Moody’s Investors Service, Inc. If not available, we have used S&P Global Ratings. In the absence of ratings from these agencies, we have used Fitch Ratings, Inc. “Not rated” securities are those with no ratings available from these agencies. All ratings are as of 5-31-26 and do not reflect subsequent downgrades or upgrades, if any.
Holdings may not have been held by the fund for the entire period and are subject to change without notice. Portfolio composition is subject to review in accordance with the fund’s investment strategy and may vary in the future. Current and future portfolio holdings are subject to risk and may change at any time.
Ratings are from Moody’s Investors Service, Inc. If not available, we have used S&P Global Ratings. In the absence of ratings from these agencies, we have used Fitch Ratings, Inc. “Not rated” securities are those with no ratings available from these agencies. All ratings are as of 5-31-26 and do not reflect subsequent downgrades or upgrades, if any.
What were the fund costs during the last year ?
(Based on a hypothetical $10,000 investment)
| Fund | Costs of a $10,000 investment | Costs paid as a percentage of a $10,000 investment |
| Investment-Grade Corporate Bond Portfolio/JMABX | $0 | 0.00% |
Management’s Discussion of Fund Performance
SUMMARY OF RESULTS
Managed Account Shares Investment-Grade Corporate Bond Portfolio (Investment-Grade Corporate Bond Portfolio/JMABX) returned 7.04% for the year ended May 31, 2026. Corporate bonds delivered strong total returns in the 12-month period that ended on May 31, 2026. The gain was driven by the combination of income, positive returns for the U.S. Treasury market, and a decline in yield spreads that was fueled by robust corporate earnings and investors’ hearty appetite for risk. The war in Iran led to heightened volatility in the final three months of the period, however, as rising oil prices raised the prospect of reaccelerating inflation and less accommodative U.S. Federal Reserve policy.
TOP PERFORMANCE CONTRIBUTORS
Banking | Holdings in this industry group were some of the largest contributors to absolute performance, reflecting both their robust performance and large portfolio weightings. NatWest Group PLC and UBS Group AG were leading individual contributors.
Energy | The industry also performed well in the annual period, particularly after the start of the war in Iran early March. Occidental Petroleum Corp. was the largest contributor.
Electric utilities | Growing power demand from artificial intelligence (AI) provided a tailwind for the category, fueling gains for issuers such as Pacific Gas & Electric Company and American Electric Power Company, Inc.
TOP PERFORMANCE DETRACTORS
A small number of individual securities | Certain holdings lost ground and had negative impacts on performance. Oracle Corp., whose bonds were pressured by the company’s investments in AI, was a notable laggard. The data center operator QTS Fayetteville and the British bank Barclays PLC were also among the individual positions that finished with losses.
The views expressed in this report are those of the portfolio management team and are subject to change. They are not meant as investment advice.
Fund Performance
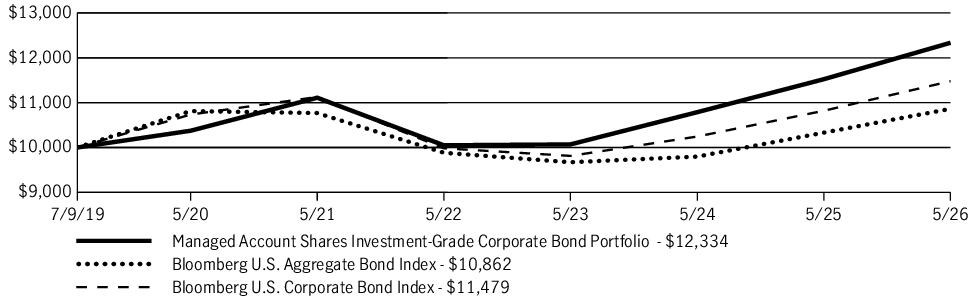
The following graph compares the initial and subsequent account values at the end of each of the most recently completed 10 fiscal years of the fund (or for the life of the fund, if shorter). It assumes a $10,000 initial investment in the fund and in an appropriate, broad-based securities market index for the same period.
GROWTH OF $10,000
| AVERAGE ANNUAL TOTAL RETURN | 1 Year | 5 Years | Since inception |
| Managed Account Shares Investment-Grade Corporate Bond Portfolio (Investment-Grade Corporate Bond Portfolio/JMABX) | 7.04% | 2.11% | 3.09% |
| Bloomberg U.S. Aggregate Bond Index | 5.13% | 0.17% | 1.21% |
| Bloomberg U.S. Corporate Bond Index | 6.09% | 0.63% | 2.02% |
Fund Statistics
| Fund net assets | $509,493,425 |
| Total number of portfolio holdings | 317 |
| Total advisory fees paid (net) | $0 |
| Portfolio turnover rate | 37% |
Graphical Representation of Holdings
The tables below show the investment makeup of the fund, representing a percentage of the total net assets of the fund.
Sector Composition
| Financials | 34.6% |
| Energy | 13.0% |
| Industrials | 10.3% |
| Utilities | 10.0% |
| Information technology | 8.3% |
| Health care | 6.6% |
| Real estate | 5.3% |
| Communication services | 5.3% |
| Consumer staples | 2.0% |
| Consumer discretionary | 1.8% |
| Materials | 1.2% |
| Municipal bonds | 0.1% |
| Short-term investments and other | 1.5% |
Quality Composition
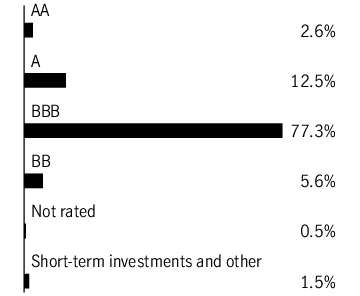
Ratings are from Moody’s Investors Service, Inc. If not available, we have used S&P Global Ratings. In the absence of ratings from these agencies, we have used Fitch Ratings, Inc. “Not rated” securities are those with no ratings available from these agencies. All ratings are as of 5-31-26 and do not reflect subsequent downgrades or upgrades, if any.
Holdings may not have been held by the fund for the entire period and are subject to change without notice. Portfolio composition is subject to review in accordance with the fund’s investment strategy and may vary in the future. Current and future portfolio holdings are subject to risk and may change at any time.
Ratings are from Moody’s Investors Service, Inc. If not available, we have used S&P Global Ratings. In the absence of ratings from these agencies, we have used Fitch Ratings, Inc. “Not rated” securities are those with no ratings available from these agencies. All ratings are as of 5-31-26 and do not reflect subsequent downgrades or upgrades, if any.
What were the fund costs during the last year ?
(Based on a hypothetical $10,000 investment)
| Fund | Costs of a $10,000 investment | Costs paid as a percentage of a $10,000 investment |
| Non-Investment-Grade Corporate Bond Portfolio/JMADX | $0 | 0.00% |
Management’s Discussion of Fund Performance
SUMMARY OF RESULTS
Managed Account Shares Non-Investment-Grade Corporate Bond Portfolio (Non-Investment-Grade Corporate Bond Portfolio/JMADX) returned 7.52% for the year ended May 31, 2026. High-yield bonds delivered strong total returns in the 12-month period that ended on May 31, 2026. The gain was driven by the combination of income, positive returns for the U.S. Treasury market, and a decline in yield spreads that was fueled by robust corporate earnings and investors’ hearty appetite for risk. The war in Iran led to heightened volatility in the final three months of the period, however, as rising oil prices raised the prospect of reaccelerating inflation and less accommodative U.S. Federal Reserve policy.
TOP PERFORMANCE CONTRIBUTORS
Consumer cyclicals | Holdings in this industry group made the largest contribution to absolute performance, primarily as a result of the strong showing for The Michaels Companies, Inc. The Canadian auto retailer Global Auto Holdings, Ltd. was a top contributor, as well.
Energy | The industry performed well in the annual period, as the surge in oil prices that accompanied the war in Iran helped boost the earnings prospects for energy companies.
Other sectors | Positions in the communications, electric utilities, and banking sectors further contributed to the fund’s absolute performance.
TOP PERFORMANCE DETRACTORS
A small number of individual securities | Certain holdings finished with losses and had negative impacts on performance. Ambipar Lux Sarl, Saks Global Enterprises LLC, and CSN Resources SA were among the individual positions that finished with losses.
The views expressed in this report are those of the portfolio management team and are subject to change. They are not meant as investment advice.
Fund Performance
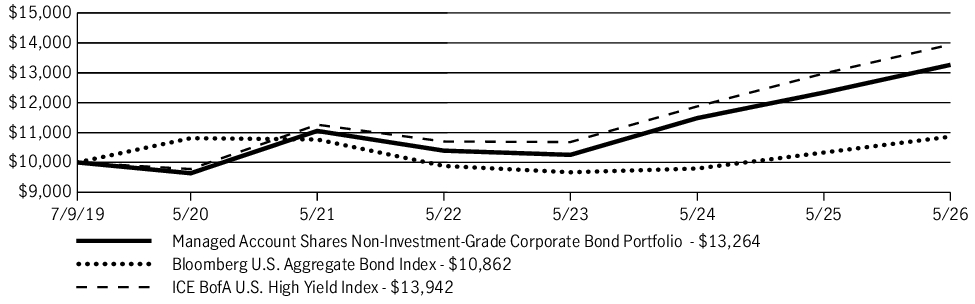
The following graph compares the initial and subsequent account values at the end of each of the most recently completed 10 fiscal years of the fund (or for the life of the fund, if shorter). It assumes a $10,000 initial investment in the fund and in an appropriate, broad-based securities market index for the same period.
GROWTH OF $10,000
| AVERAGE ANNUAL TOTAL RETURN | 1 Year | 5 Years | Since inception |
| Managed Account Shares Non-Investment-Grade Corporate Bond Portfolio (Non-Investment-Grade Corporate Bond Portfolio/JMADX) | 7.52% | 3.71% | 4.18% |
| Bloomberg U.S. Aggregate Bond Index | 5.13% | 0.17% | 1.21% |
| ICE BofA U.S. High Yield Index | 7.44% | 4.36% | 4.94% |
Fund Statistics
| Fund net assets | $188,719,463 |
| Total number of portfolio holdings | 201 |
| Total advisory fees paid (net) | $0 |
| Portfolio turnover rate | 61% |
Graphical Representation of Holdings
The tables below show the investment makeup of the fund, representing a percentage of the total net assets of the fund.
Sector Composition
| Consumer discretionary | 17.3% |
| Energy | 16.8% |
| Financials | 14.7% |
| Communication services | 11.6% |
| Utilities | 7.9% |
| Industrials | 7.3% |
| Health care | 6.1% |
| Consumer staples | 5.2% |
| Materials | 4.7% |
| Information technology | 3.7% |
| Real estate | 2.7% |
| Short-term investments and other | 2.0% |
Quality Composition
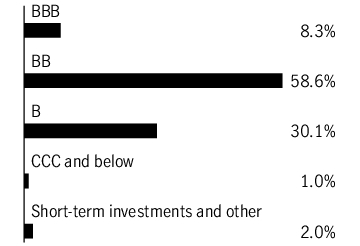
Ratings are from Moody’s Investors Service, Inc. If not available, we have used S&P Global Ratings. In the absence of ratings from these agencies, we have used Fitch Ratings, Inc. “Not rated” securities are those with no ratings available from these agencies. All ratings are as of 5-31-26 and do not reflect subsequent downgrades or upgrades, if any.
Holdings may not have been held by the fund for the entire period and are subject to change without notice. Portfolio composition is subject to review in accordance with the fund’s investment strategy and may vary in the future. Current and future portfolio holdings are subject to risk and may change at any time.
Ratings are from Moody’s Investors Service, Inc. If not available, we have used S&P Global Ratings. In the absence of ratings from these agencies, we have used Fitch Ratings, Inc. “Not rated” securities are those with no ratings available from these agencies. All ratings are as of 5-31-26 and do not reflect subsequent downgrades or upgrades, if any.
What were the fund costs during the last year ?
(Based on a hypothetical $10,000 investment)
| Fund | Costs of a $10,000 investment | Costs paid as a percentage of a $10,000 investment |
| Securitized Debt Portfolio/JMAEX | $0 | 0.00% |
Management’s Discussion of Fund Performance
SUMMARY OF RESULTS
Managed Account Shares Securitized Debt Portfolio (Securitized Debt Portfolio/JMAEX) returned 4.67% for the year ended May 31, 2026. Securitized assets produced strong total returns and outpaced the broader investment-grade market in the annual period. The category was helped by periods of declining U.S. Treasury yields, as well as demand for higher-yielding assets that was fueled by investors’ generally hearty appetite for risk.
TOP PERFORMANCE CONTRIBUTORS
Asset-backed securities (ABS) | The fund’s allocation to this area made the largest contribution to absolute performance due to the combination of its positive total returns and sizable portfolio weighting.
Commercial mortgage-backed securities and non-agency mortgage-backed securities | These categories also helped results. While both outpaced ABS, they made less of a contribution to the fund’s return due to their smaller allocations.
TOP PERFORMANCE DETRACTORS
A small number of individual securities | Certain holdings—including the asset-backed securities of CF Hippolyta Issuer LLC and New Economy Assets - Phase 1 Sponsor LLC—finished with losses and had negative impacts on performance.
The views expressed in this report are those of the portfolio management team and are subject to change. They are not meant as investment advice.
Fund Performance
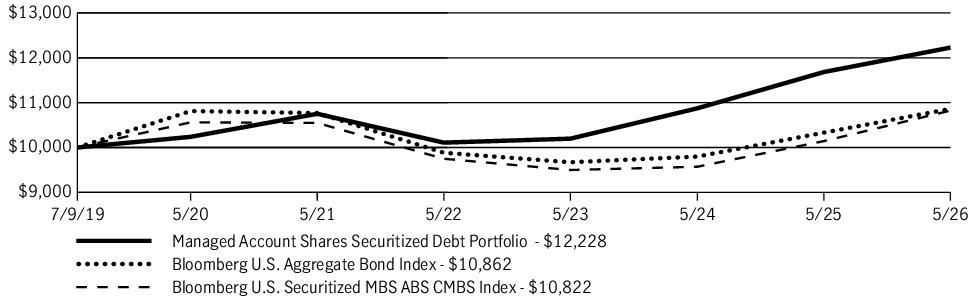
The following graph compares the initial and subsequent account values at the end of each of the most recently completed 10 fiscal years of the fund (or for the life of the fund, if shorter). It assumes a $10,000 initial investment in the fund and in an appropriate, broad-based securities market index for the same period.
GROWTH OF $10,000
| AVERAGE ANNUAL TOTAL RETURN | 1 Year | 5 Years | Since inception |
| Managed Account Shares Securitized Debt Portfolio (Securitized Debt Portfolio/JMAEX) | 4.67% | 2.61% | 2.96% |
| Bloomberg U.S. Aggregate Bond Index | 5.13% | 0.17% | 1.21% |
| Bloomberg U.S. Securitized MBS ABS CMBS Index | 6.71% | 0.52% | 1.15% |
Fund Statistics
| Fund net assets | $319,314,556 |
| Total number of portfolio holdings | 321 |
| Total advisory fees paid (net) | $0 |
| Portfolio turnover rate | 28% |
Graphical Representation of Holdings
The tables below show the investment makeup of the fund, representing a percentage of the total net assets of the fund.
Portfolio Composition
| Asset-backed securities | 51.0% |
| Collateralized mortgage obligations – Commercial and residential | 42.3% |
| Collateralized mortgage obligations – U.S. Government Agency | 5.2% |
| Short-term investments and other | 1.5% |
Quality Composition
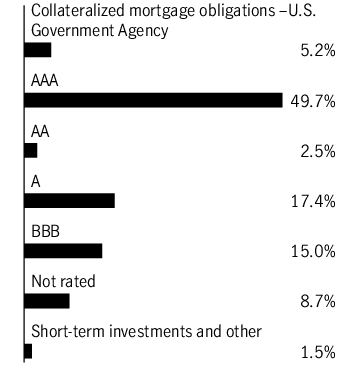
Ratings are from Moody’s Investors Service, Inc. If not available, we have used S&P Global Ratings. In the absence of ratings from these agencies, we have used Fitch Ratings, Inc. “Not rated” securities are those with no ratings available from these agencies. All ratings are as of 5-31-26 and do not reflect subsequent downgrades or upgrades, if any.
Holdings may not have been held by the fund for the entire period and are subject to change without notice. Portfolio composition is subject to review in accordance with the fund’s investment strategy and may vary in the future. Current and future portfolio holdings are subject to risk and may change at any time.
Ratings are from Moody’s Investors Service, Inc. If not available, we have used S&P Global Ratings. In the absence of ratings from these agencies, we have used Fitch Ratings, Inc. “Not rated” securities are those with no ratings available from these agencies. All ratings are as of 5-31-26 and do not reflect subsequent downgrades or upgrades, if any.
What were the fund costs during the last year ?
(Based on a hypothetical $10,000 investment)
| Fund | Costs of a $10,000 investment | Costs paid as a percentage of a $10,000 investment |
| Non-Investment-Grade Municipal Bond Portfolio/JHFMX | $0 | 0.00% |
Management’s Discussion of Fund Performance
SUMMARY OF RESULTS
Managed Account Shares Non-Investment-Grade Municipal Bond Portfolio (Non-Investment-Grade Municipal Bond Portfolio/JHFMX) returned 7.29% for the year ended May 31, 2026. The broader U.S. bond market delivered positive total returns in the annual period. Much of the gain occurred before the start of the war in Iran in early March, reflecting confidence that moderate inflation would allow the U.S. Federal Reserve (Fed) to continue cutting interest rates. The conflict caused the market to give back some of its prior gains in the final three months of the period, however, as higher oil prices raised the prospect of reaccelerating inflation and less accommodative Fed policy. Municipal bonds outperformed the taxable investment-grade market, reflecting positive supply-and-demand conditions, attractive yields relative to U.S. Treasuries, and stable credit trends. High-yield municipal issues slightly underperformed the broader tax-exempt category.
TOP PERFORMANCE CONTRIBUTORS
Continuing care retirement and charter schools | The fund’s holdings in these areas made the largest contribution to absolute performance due to the combination of positive total returns and their sizable portfolio weightings.
Other notable sectors | Positions in the tax increment/financing, toll roads/bridges/tunnels, and hospitals sectors also helped results.
Strong performing individual securities | Beaver County Industrial Development Authority was a top contributor, as were bonds issued by the City of Henderson, Kentucky.
TOP PERFORMANCE DETRACTORS
Economic and industrial revenue bonds | Although a number of individual issues performed well, the fund’s holdings in this category posted losses in the aggregate. Bonds issued by Polk County, Florida and Brazoria County, Texas detracted from results, as did the Nevada Department of Business & Industry.
The views expressed in this report are those of the portfolio management team and are subject to change. They are not meant as investment advice.
Fund Performance
The following graph compares the initial and subsequent account values at the end of each of the most recently completed 10 fiscal years of the fund (or for the life of the fund, if shorter). It assumes a $10,000 initial investment in the fund and in an appropriate, broad-based securities market index for the same period.
GROWTH OF $10,000
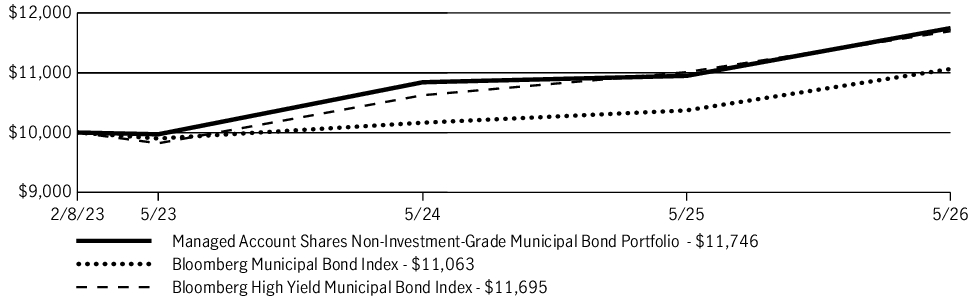
| AVERAGE ANNUAL TOTAL RETURN | 1 Year | Since inception |
| Managed Account Shares Non-Investment-Grade Municipal Bond Portfolio (Non-Investment-Grade Municipal Bond Portfolio/JHFMX) | 7.29% | 4.98% |
| Bloomberg Municipal Bond Index | 6.67% | 3.10% |
| Bloomberg High Yield Municipal Bond Index | 6.21% | 4.84% |
Fund Statistics
| Fund net assets | $20,057,257 |
| Total number of portfolio holdings | 106 |
| Total advisory fees paid (net) | $0 |
| Portfolio turnover rate | 16% |
Graphical Representation of Holdings
The tables below show the investment makeup of the fund, representing a percentage of the total net assets of the fund.
Portfolio Composition
| General obligation bonds | 6.4% |
| Revenue bonds | 89.4% |
| Education | 19.4% |
| Development | 19.2% |
| Other revenue | 17.7% |
| Health care | 16.1% |
| Transportation | 4.6% |
| Airport | 4.1% |
| Tobacco | 4.0% |
| Housing | 3.0% |
| Water and sewer | 1.2% |
| Pollution | 0.1% |
| Short-term investments and other | 4.2% |
Quality Composition
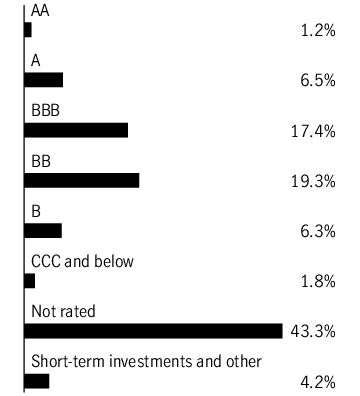
Ratings are from Moody’s Investors Service, Inc. If not available, we have used S&P Global Ratings. In the absence of ratings from these agencies, we have used Fitch Ratings, Inc. “Not rated” securities are those with no ratings available from these agencies. All ratings are as of 5-31-26 and do not reflect subsequent downgrades or upgrades, if any.
Holdings may not have been held by the fund for the entire period and are subject to change without notice. Portfolio composition is subject to review in accordance with the fund’s investment strategy and may vary in the future. Current and future portfolio holdings are subject to risk and may change at any time.
Ratings are from Moody’s Investors Service, Inc. If not available, we have used S&P Global Ratings. In the absence of ratings from these agencies, we have used Fitch Ratings, Inc. “Not rated” securities are those with no ratings available from these agencies. All ratings are as of 5-31-26 and do not reflect subsequent downgrades or upgrades, if any.
What were the fund costs during the last year ?
(Based on a hypothetical $10,000 investment)
| Fund | Costs of a $10,000 investment | Costs paid as a percentage of a $10,000 investment |
| Bond Completion Portfolio/JHBMX | $0 | 0.00% |
Management’s Discussion of Fund Performance
SUMMARY OF RESULTS
Managed Account Shares Bond Completion Portfolio (Bond Completion Portfolio/JHBMX) returned 5.97% for the year ended May 31, 2026. The U.S. bond market delivered positive total returns during the 12-month period. Much of the gain occurred before the start of the war in Iran in early March, reflecting confidence that moderate inflation would allow the U.S. Federal Reserve (Fed) to continue cutting interest rates. The conflict caused the market to give back some of its prior gains in the final three months of the period, however, as higher oil prices raised the prospect of reaccelerating inflation and less accommodative Fed policy. Credit-oriented market segments generally outperformed on the strength of their higher yields and investors’ hearty appetite for risk.
TOP PERFORMANCE CONTRIBUTORS
Agency mortgage-backed securities | The fund’s allocation to this area made the largest contribution to absolute performance due to the combination of its positive total returns and a sizable portfolio weighting.
U.S. Treasuries | Positions in U.S. government bonds also contributed to absolute performance of the fund.
Investment-grade corporates | This segment of the fund made a meaningful contribution, albeit less than other categories due to its smaller weighting. Amgen, Inc. and T-Mobile USA, Inc. were notable contributors at the individual security level.
TOP PERFORMANCE DETRACTORS
Certain securities detracted | Oracle Corp., whose bonds were pressured by the extent of the company’s investments in artificial intelligence, was a notable laggard. A small number of individual U.S. Treasury and Fannie Mae holdings detracted, as well.
The views expressed in this report are those of the portfolio management team and are subject to change. They are not meant as investment advice.
Fund Performance
The following graph compares the initial and subsequent account values at the end of each of the most recently completed 10 fiscal years of the fund (or for the life of the fund, if shorter). It assumes a $10,000 initial investment in the fund and in an appropriate, broad-based securities market index for the same period.
GROWTH OF $10,000
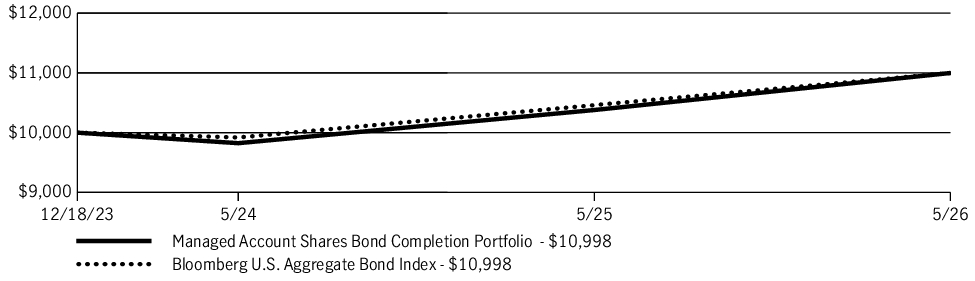
| AVERAGE ANNUAL TOTAL RETURN | 1 Year | Since inception |
| Managed Account Shares Bond Completion Portfolio (Bond Completion Portfolio/JHBMX) | 5.97% | 3.96% |
| Bloomberg U.S. Aggregate Bond Index | 5.13% | 3.96% |
Fund Statistics
| Fund net assets | $1,080,440 |
| Total number of portfolio holdings | 25 |
| Total advisory fees paid (net) | $0 |
| Portfolio turnover rate | 33% |
Graphical Representation of Holdings
The tables below show the investment makeup of the fund, representing a percentage of the total net assets of the fund.
Sector Composition
| U.S. Government Agency | 56.2% |
| U.S. Government | 26.3% |
| Financials | 7.0% |
| Communication services | 3.1% |
| Health care | 2.5% |
| Information technology | 1.6% |
| Utilities | 1.6% |
| Short-term investments and other | 1.7% |
Quality Composition
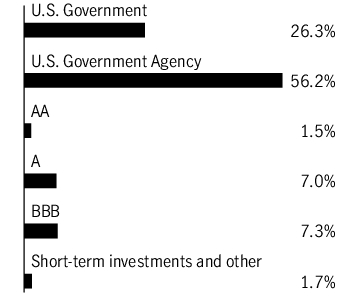
Ratings are from Moody’s Investors Service, Inc. If not available, we have used S&P Global Ratings. In the absence of ratings from these agencies, we have used Fitch Ratings, Inc. “Not rated” securities are those with no ratings available from these agencies. All ratings are as of 5-31-26 and do not reflect subsequent downgrades or upgrades, if any.
Holdings may not have been held by the fund for the entire period and are subject to change without notice. Portfolio composition is subject to review in accordance with the fund’s investment strategy and may vary in the future. Current and future portfolio holdings are subject to risk and may change at any time.
Ratings are from Moody’s Investors Service, Inc. If not available, we have used S&P Global Ratings. In the absence of ratings from these agencies, we have used Fitch Ratings, Inc. “Not rated” securities are those with no ratings available from these agencies. All ratings are as of 5-31-26 and do not reflect subsequent downgrades or upgrades, if any.