
EARNINGS CALL 2nd Quarter 2026 July 22, 2026
2 This presentation contains forward-looking statements that relate to expectations, beliefs, projections, future plans and strategies, anticipated events or trends and similar expressions concerning matters that are not historical facts. Examples of forward-looking statements include, among others, statements we make regarding our expectations with regard to our business, financial and operating results, including our deposits and deposit optimization strategy, liquidity and funding, changes in economic conditions and related impacts on the Company's business, future economic performance and dividends, including our statements on the slide entitled "Management Outlook." The forward-looking statements contained herein reflect our current views about future events and financial performance and are subject to risks, uncertainties, assumptions and changes in circumstances that may cause our actual results to differ significantly from historical results and those expressed in any forward-looking statement. Some factors that could cause actual results to differ materially from historical or expected results include, among others: the risk factors discussed in the Company’s Annual Report on Form 10-K for the year ended December 31, 2025 and the Company's subsequent Quarterly Reports on Form 10-Q, each as filed with the Securities and Exchange Commission; adverse developments in the financial services industry generally and any related impact on depositor behavior; risks related to the sufficiency of liquidity; changes in international trade policies, tariffs and treaties affecting imports and exports, trade disputes, barriers to trade or the emergence of other trade restrictions, and their related impacts on macroeconomic conditions and customer behavior; the potential adverse effects of unusual and infrequently occurring events and any governmental or societal responses thereto; changes in general economic conditions, either nationally or locally in the areas in which we conduct or will conduct our business; the impact on financial markets from geopolitical conflicts; inflation, interest rate, market and monetary fluctuations; increases in competitive pressures among financial institutions and businesses offering similar products and services; higher defaults on our loan portfolio than we expect; increased foreclosures and ownership of real property; changes in management’s estimate of the adequacy of the allowance for credit losses; technological risks and developments and cyber threats, attacks or events; emerging external focus among regulators and other officials related to risks in connection with the development and use of artificial intelligence; legislative or regulatory changes or changes in accounting principles, policies or guidelines; supervisory actions by regulatory agencies which may limit our ability to pursue certain growth opportunities, including expansion through acquisitions; additional regulatory requirements resulting from our continued growth; management’s estimates and projections of interest rates and interest rate policy; the execution of our business plan; the outcome of legal proceedings, the amount of funds and/or collateral that may be available for the repayment of such loans, and any adverse economic or other events impacting the collateral, borrower or guarantors with respect to such loans; and other factors affecting the financial services industry generally or the banking industry in particular. Any forward-looking statement made by us in this presentation is based only on information currently available to us and speaks only as of the date on which it is made. We do not intend and disclaim any duty or obligation to update or revise any industry information or forward-looking statements, whether written or oral, that may be made from time to time, set forth in this presentation to reflect new information, future events or otherwise, except to the extent required by applicable law. In light of these risks, uncertainties and assumptions, the forward- looking events discussed in this presentation might not occur, and you should not put undue reliance on any forward-looking statements. Non-GAAP Financial Measures This presentation contains both financial measures based on GAAP and non-GAAP based financial measures, which are used where management believes them to be helpful in understanding the Company’s results of operations or financial position. Where non-GAAP financial measures are used, the comparable GAAP financial measure, as well as the reconciliation to the comparable GAAP financial measure, can be found in the Company’s press release as of and for the quarter ended June 30, 2026. These disclosures should not be viewed as a substitute for operating results determined in accordance with GAAP, nor are they necessarily comparable to non-GAAP performance measures that may be presented by other companies. Forward-Looking Statements
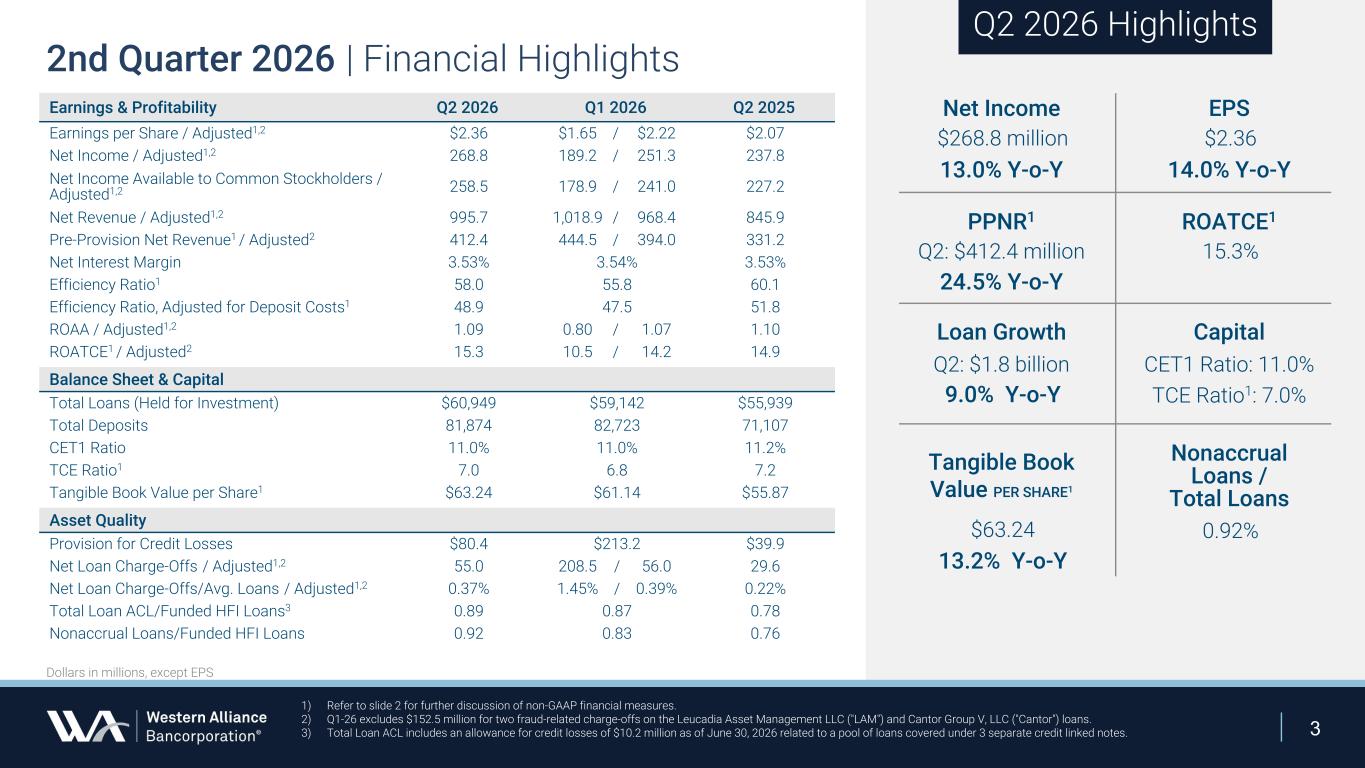
3 2nd Quarter 2026 | Financial Highlights Earnings & Profitability Q2 2026 Q1 2026 Q2 2025 Earnings per Share / Adjusted1,2 $2.36 $1.65 / $2.22 $2.07 Net Income / Adjusted1,2 268.8 189.2 / 251.3 237.8 Net Income Available to Common Stockholders / Adjusted1,2 258.5 178.9 / 241.0 227.2 Net Revenue / Adjusted1,2 995.7 1,018.9 / 968.4 845.9 Pre-Provision Net Revenue1 / Adjusted2 412.4 444.5 / 394.0 331.2 Net Interest Margin 3.53% 3.54% 3.53% Efficiency Ratio1 58.0 55.8 60.1 Efficiency Ratio, Adjusted for Deposit Costs1 48.9 47.5 51.8 ROAA / Adjusted1,2 1.09 0.80 / 1.07 1.10 ROATCE1 / Adjusted2 15.3 10.5 / 14.2 14.9 Balance Sheet & Capital Total Loans (Held for Investment) $60,949 $59,142 $55,939 Total Deposits 81,874 82,723 71,107 CET1 Ratio 11.0% 11.0% 11.2% TCE Ratio1 7.0 6.8 7.2 Tangible Book Value per Share1 $63.24 $61.14 $55.87 Asset Quality Provision for Credit Losses $80.4 $213.2 $39.9 Net Loan Charge-Offs / Adjusted1,2 55.0 208.5 / 56.0 29.6 Net Loan Charge-Offs/Avg. Loans / Adjusted1,2 0.37% 1.45% / 0.39% 0.22% Total Loan ACL/Funded HFI Loans3 0.89 0.87 0.78 Nonaccrual Loans/Funded HFI Loans 0.92 0.83 0.76 Dollars in millions, except EPS 1) Refer to slide 2 for further discussion of non-GAAP financial measures. 2) Q1-26 excludes $152.5 million for two fraud-related charge-offs on the Leucadia Asset Management LLC ("LAM") and Cantor Group V, LLC ("Cantor") loans. 3) Total Loan ACL includes an allowance for credit losses of $10.2 million as of June 30, 2026 related to a pool of loans covered under 3 separate credit linked notes. Q2 2026 Highlights Net Income EPS $268.8 million $2.36 13.0% Y-o-Y 14.0% Y-o-Y PPNR1 ROATCE1 Q2: $412.4 million 15.3% 24.5% Y-o-Y Loan Growth Capital Q2: $1.8 billion CET1 Ratio: 11.0% 9.0% Y-o-Y TCE Ratio1: 7.0% Tangible Book Value PER SHARE1 Nonaccrual Loans / Total Loans $63.24 0.92% 13.2% Y-o-Y
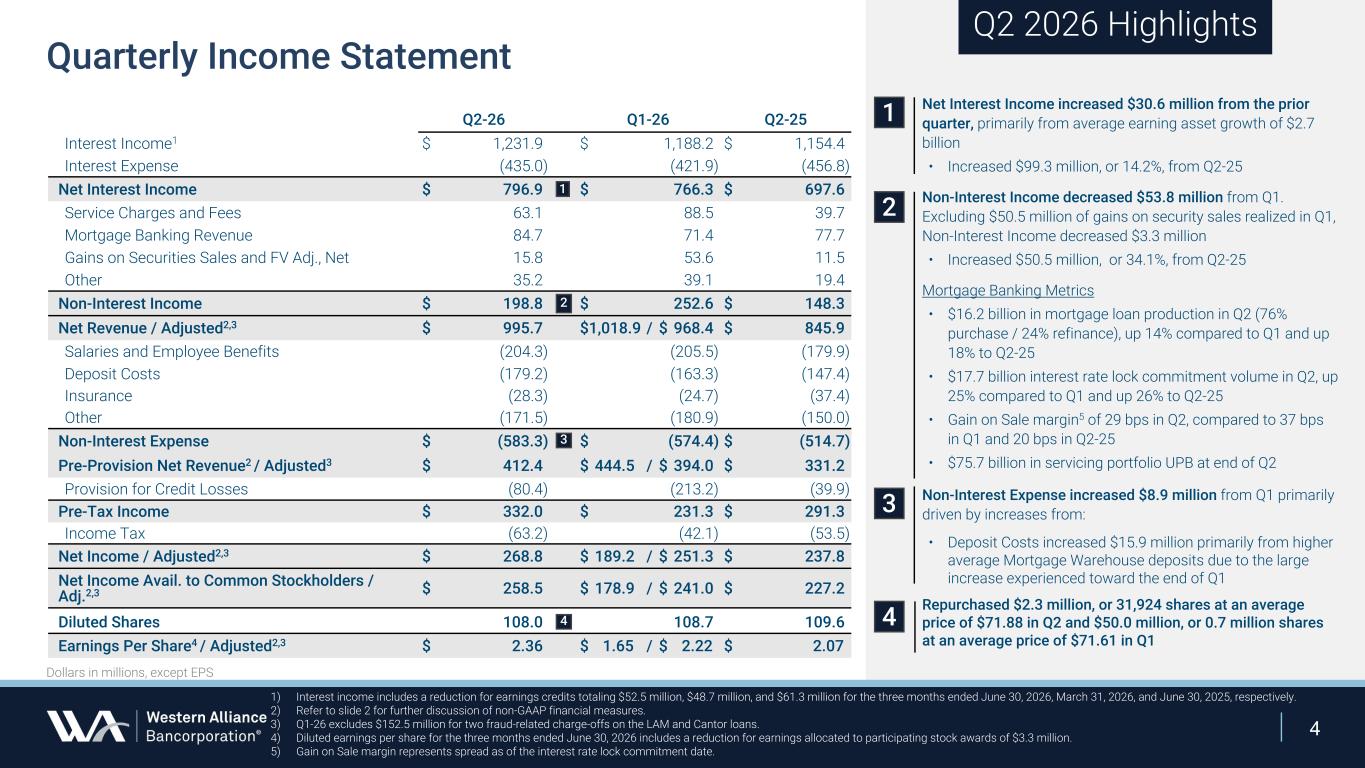
4 Q2-26 Q1-26 Q2-25 Interest Income1 $ 1,231.9 $ 1,188.2 $ 1,154.4 Interest Expense (435.0) (421.9) (456.8) Net Interest Income $ 796.9 $ 766.3 $ 697.6 Service Charges and Fees 63.1 88.5 39.7 Mortgage Banking Revenue 84.7 71.4 77.7 Gains on Securities Sales and FV Adj., Net 15.8 53.6 11.5 Other 35.2 39.1 19.4 Non-Interest Income $ 198.8 $ 252.6 $ 148.3 Net Revenue / Adjusted2,3 $ 995.7 $ 1,018.9 / $ 968.4 $ 845.9 Salaries and Employee Benefits (204.3) (205.5) (179.9) Deposit Costs (179.2) (163.3) (147.4) Insurance (28.3) (24.7) (37.4) Other (171.5) (180.9) (150.0) Non-Interest Expense $ (583.3) $ (574.4) $ (514.7) Pre-Provision Net Revenue2 / Adjusted3 $ 412.4 $ 444.5 / $ 394.0 $ 331.2 Provision for Credit Losses (80.4) (213.2) (39.9) Pre-Tax Income $ 332.0 $ 231.3 $ 291.3 Income Tax (63.2) (42.1) (53.5) Net Income / Adjusted2,3 $ 268.8 $ 189.2 / $ 251.3 $ 237.8 Net Income Avail. to Common Stockholders / Adj.2,3 $ 258.5 $ 178.9 / $ 241.0 $ 227.2 Diluted Shares 108.0 108.7 109.6 Earnings Per Share4 / Adjusted2,3 $ 2.36 $ 1.65 / $ 2.22 $ 2.07 Net Interest Income increased $30.6 million from the prior quarter, primarily from average earning asset growth of $2.7 billion • Increased $99.3 million, or 14.2%, from Q2-25 Non-Interest Income decreased $53.8 million from Q1. Excluding $50.5 million of gains on security sales realized in Q1, Non-Interest Income decreased $3.3 million • Increased $50.5 million, or 34.1%, from Q2-25 Mortgage Banking Metrics • $16.2 billion in mortgage loan production in Q2 (76% purchase / 24% refinance), up 14% compared to Q1 and up 18% to Q2-25 • $17.7 billion interest rate lock commitment volume in Q2, up 25% compared to Q1 and up 26% to Q2-25 • Gain on Sale margin5 of 29 bps in Q2, compared to 37 bps in Q1 and 20 bps in Q2-25 • $75.7 billion in servicing portfolio UPB at end of Q2 Non-Interest Expense increased $8.9 million from Q1 primarily driven by increases from: • Deposit Costs increased $15.9 million primarily from higher average Mortgage Warehouse deposits due to the large increase experienced toward the end of Q1 Repurchased $2.3 million, or 31,924 shares at an average price of $71.88 in Q2 and $50.0 million, or 0.7 million shares at an average price of $71.61 in Q1 1) Interest income includes a reduction for earnings credits totaling $52.5 million, $48.7 million, and $61.3 million for the three months ended June 30, 2026, March 31, 2026, and June 30, 2025, respectively. 2) Refer to slide 2 for further discussion of non-GAAP financial measures. 3) Q1-26 excludes $152.5 million for two fraud-related charge-offs on the LAM and Cantor loans. 4) Diluted earnings per share for the three months ended June 30, 2026 includes a reduction for earnings allocated to participating stock awards of $3.3 million. 5) Gain on Sale margin represents spread as of the interest rate lock commitment date. Quarterly Income Statement Q2 2026 Highlights 1 2 3 1 2 4 Dollars in millions, except EPS 3 4
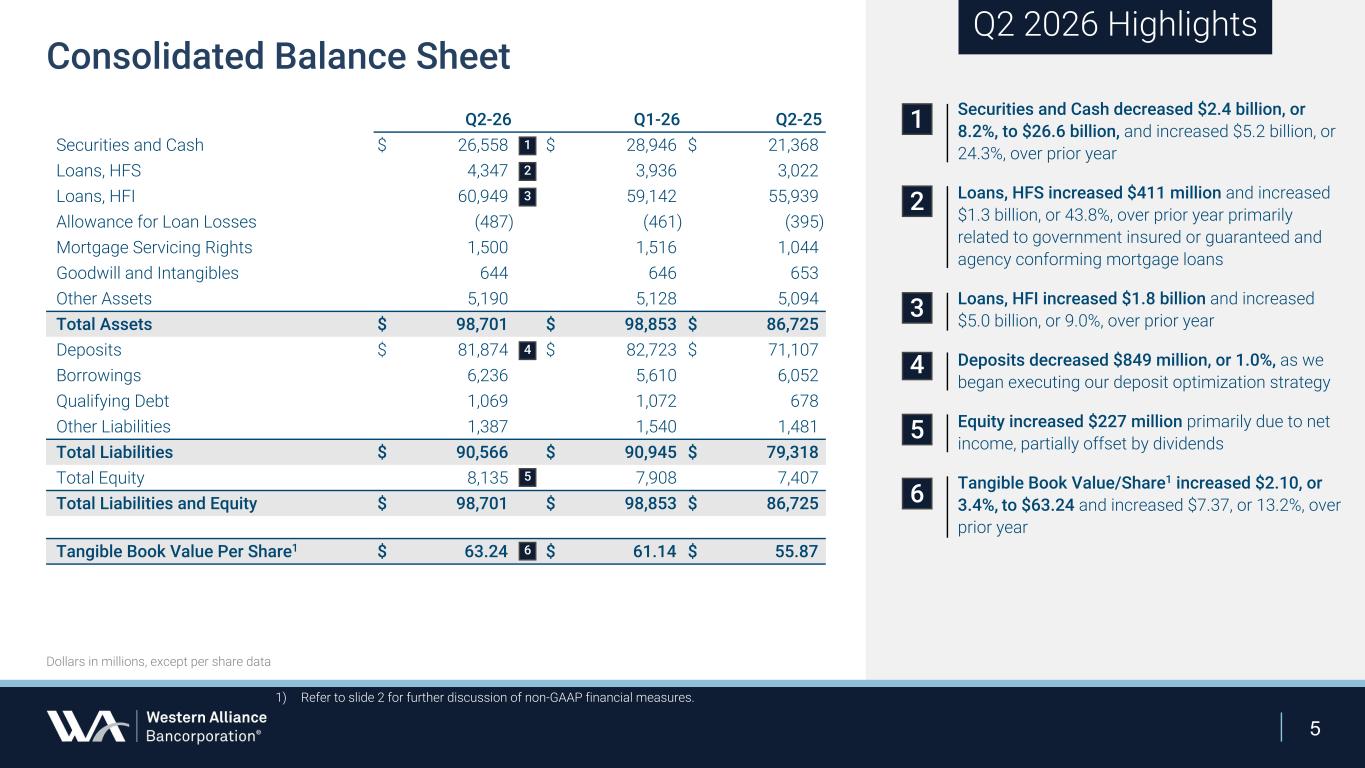
5 Dollars in millions, except per share data Consolidated Balance Sheet Q2 2026 Highlights 1 2 3 4 Securities and Cash decreased $2.4 billion, or 8.2%, to $26.6 billion, and increased $5.2 billion, or 24.3%, over prior year Loans, HFS increased $411 million and increased $1.3 billion, or 43.8%, over prior year primarily related to government insured or guaranteed and agency conforming mortgage loans Loans, HFI increased $1.8 billion and increased $5.0 billion, or 9.0%, over prior year Deposits decreased $849 million, or 1.0%, as we began executing our deposit optimization strategy Equity increased $227 million primarily due to net income, partially offset by dividends Tangible Book Value/Share1 increased $2.10, or 3.4%, to $63.24 and increased $7.37, or 13.2%, over prior year 1) Refer to slide 2 for further discussion of non-GAAP financial measures. 5 1 3 4 5 6 Q2-26 Q1-26 Q2-25 Securities and Cash $ 26,558 $ 28,946 $ 21,368 Loans, HFS 4,347 3,936 3,022 Loans, HFI 60,949 59,142 55,939 Allowance for Loan Losses (487) (461) (395) Mortgage Servicing Rights 1,500 1,516 1,044 Goodwill and Intangibles 644 646 653 Other Assets 5,190 5,128 5,094 Total Assets $ 98,701 $ 98,853 $ 86,725 Deposits $ 81,874 $ 82,723 $ 71,107 Borrowings 6,236 5,610 6,052 Qualifying Debt 1,069 1,072 678 Other Liabilities 1,387 1,540 1,481 Total Liabilities $ 90,566 $ 90,945 $ 79,318 Total Equity 8,135 7,908 7,407 Total Liabilities and Equity $ 98,701 $ 98,853 $ 86,725 Tangible Book Value Per Share1 $ 63.24 $ 61.14 $ 55.87 2 6
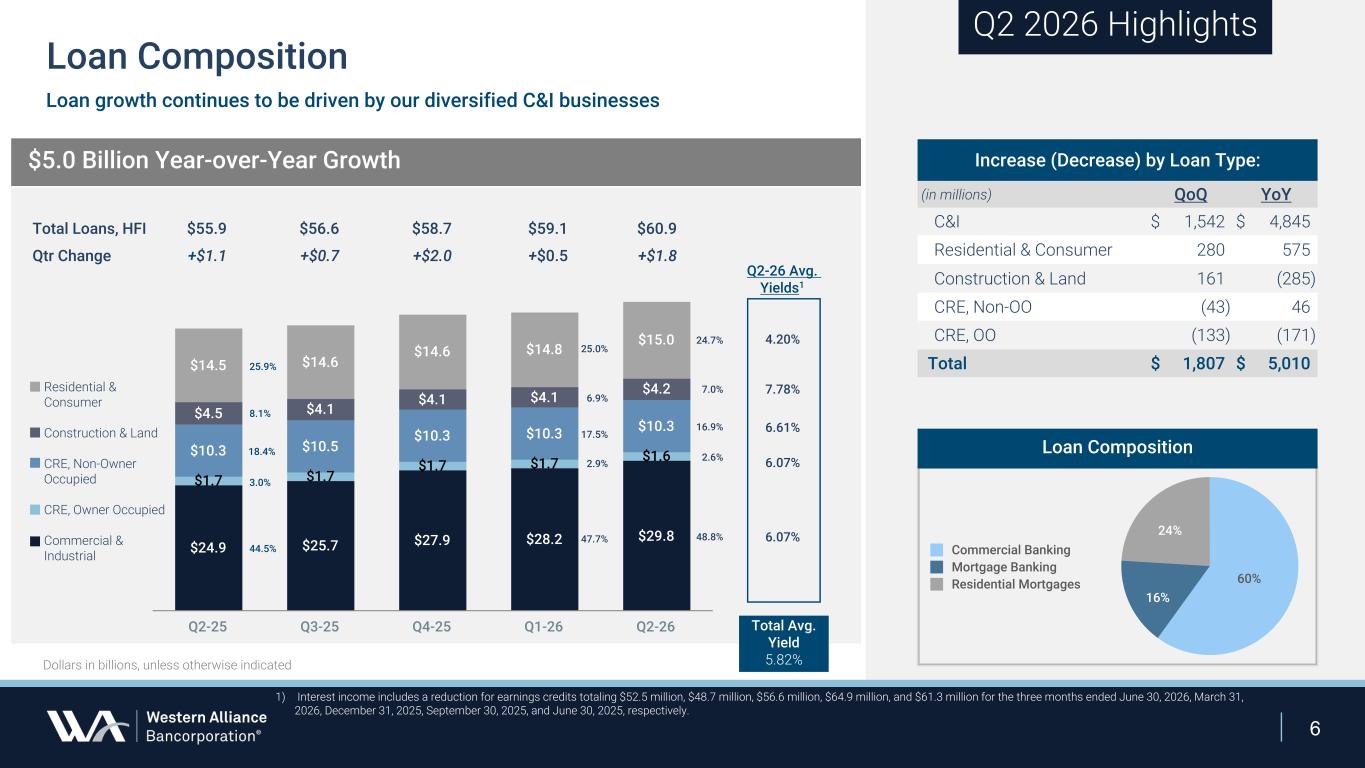
6 $5.0 Billion Year-over-Year Growth $24.9 $25.7 $27.9 $28.2 $29.8 $1.7 $1.7 $1.7 $1.7 $1.6$10.3 $10.5 $10.3 $10.3 $10.3 $4.5 $4.1 $4.1 $4.1 $4.2 $14.5 $14.6 $14.6 $14.8 $15.0 Q2-25 Q3-25 Q4-25 Q1-26 Q2-26 25.9% 3.0% 18.4% 44.5% 8.1% 24.7% 2.6% 16.9% 48.8% 7.0% Residential & Consumer Construction & Land CRE, Non-Owner Occupied CRE, Owner Occupied Commercial & Industrial $55.9 +$1.1 $56.6 +$0.7 $58.7 +$2.0 $59.1 +$0.5 $60.9 +$1.8 Dollars in billions, unless otherwise indicated Total Loans, HFI Qtr Change Loan Composition Q2 2026 Highlights Increase (Decrease) by Loan Type: (in millions) QoQ YoY C&I $ 1,542 $ 4,845 Residential & Consumer 280 575 Construction & Land 161 (285) CRE, Non-OO (43) 46 CRE, OO (133) (171) Total $ 1,807 $ 5,010 25.0% 2.9% 17.5% 47.7% 6.9% 4.20% 6.07% 6.61% 6.07% 7.78% Q2-26 Avg. Yields1 Total Avg. Yield 5.82% 1) Interest income includes a reduction for earnings credits totaling $52.5 million, $48.7 million, $56.6 million, $64.9 million, and $61.3 million for the three months ended June 30, 2026, March 31, 2026, December 31, 2025, September 30, 2025, and June 30, 2025, respectively. Loan growth continues to be driven by our diversified C&I businesses 60% 16% 24% Commercial Banking Mortgage Banking Residential Mortgages Loan Composition
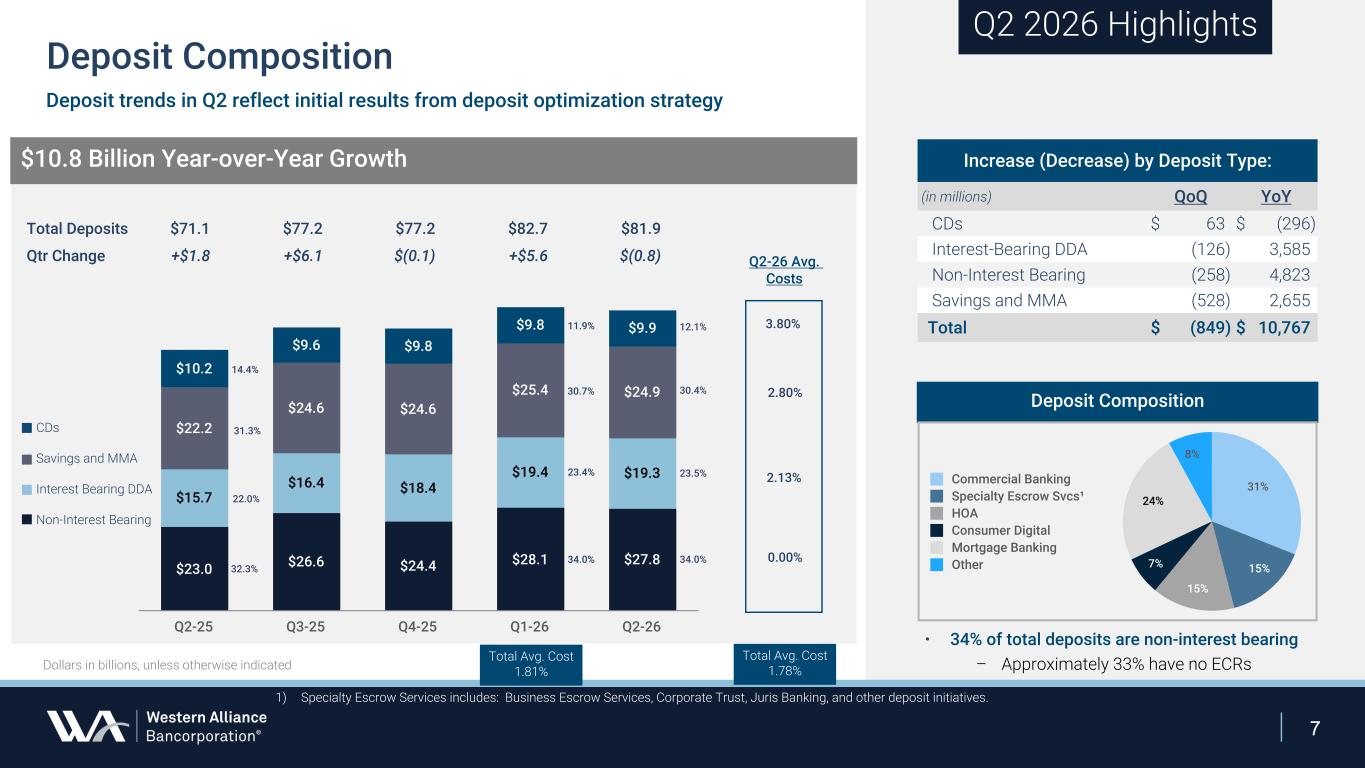
7 Deposit trends in Q2 reflect initial results from deposit optimization strategy Q2 2026 Highlights $23.0 $26.6 $24.4 $28.1 $27.8 $15.7 $16.4 $18.4 $19.4 $19.3 $22.2 $24.6 $24.6 $25.4 $24.9 $10.2 $9.6 $9.8 $9.8 $9.9 Q2-25 Q3-25 Q4-25 Q1-26 Q2-26 22.0% 14.4% 32.3% 31.3% 23.5% 12.1% 34.0% 30.4% $10.8 Billion Year-over-Year Growth CDs Savings and MMA Interest Bearing DDA Non-Interest Bearing $77.2 +$6.1 $71.1 +$1.8 $82.7 +$5.6 $81.9 $(0.8) Increase (Decrease) by Deposit Type: (in millions) QoQ YoY CDs $ 63 $ (296) Interest-Bearing DDA (126) 3,585 Non-Interest Bearing (258) 4,823 Savings and MMA (528) 2,655 Total $ (849) $ 10,767 $77.2 $(0.1) Total Deposits Qtr Change Deposit Composition Q2-26 Avg. Costs Total Avg. Cost 1.78%Dollars in billions, unless otherwise indicated 3.80% 2.13% 0.00% 2.80% 23.4% 11.9% 34.0% 30.7% Deposit Composition • 34% of total deposits are non-interest bearing – Approximately 33% have no ECRs 31% 15% 15% 7% 24% 8% Commercial Banking Specialty Escrow Svcs¹ HOA Consumer Digital Mortgage Banking Other 1) Specialty Escrow Services includes: Business Escrow Services, Corporate Trust, Juris Banking, and other deposit initiatives. Total Avg. Cost 1.81%
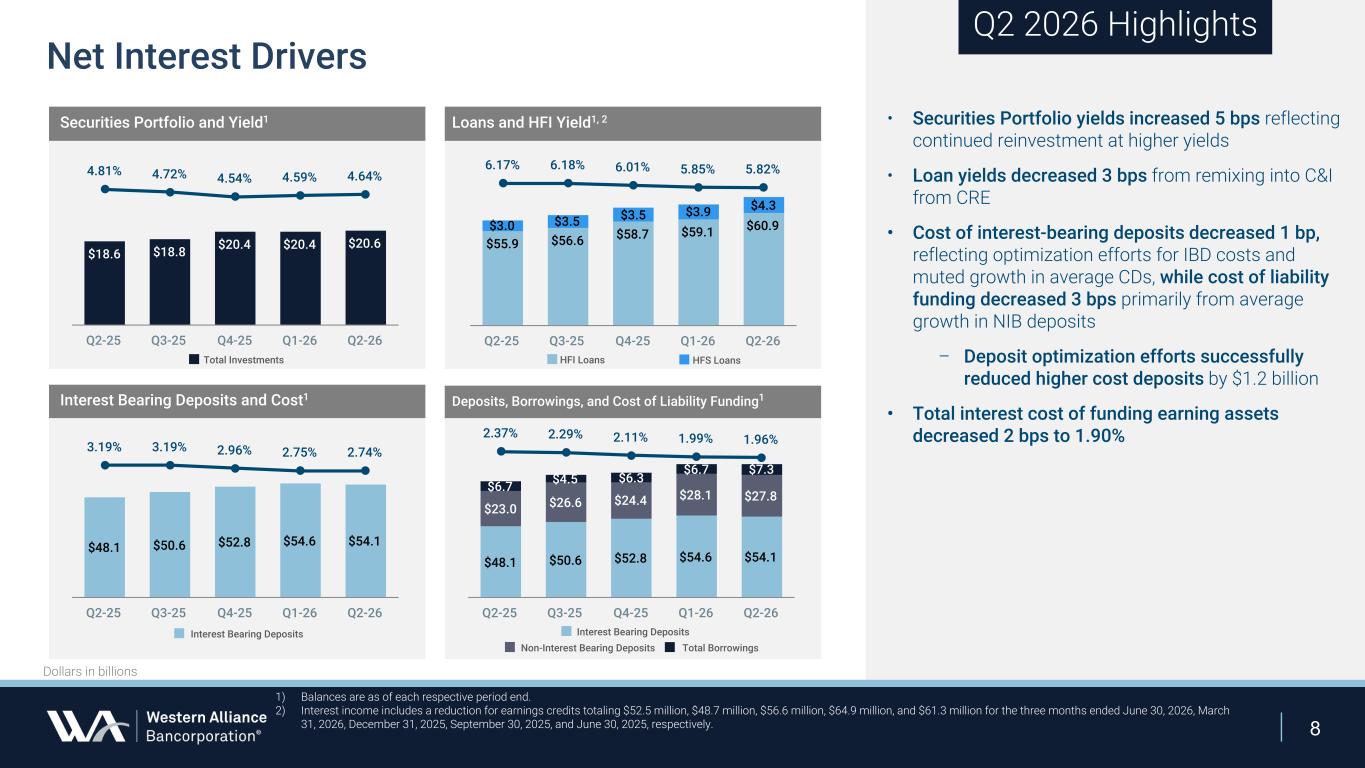
8 • Securities Portfolio yields increased 5 bps reflecting continued reinvestment at higher yields • Loan yields decreased 3 bps from remixing into C&I from CRE • Cost of interest-bearing deposits decreased 1 bp, reflecting optimization efforts for IBD costs and muted growth in average CDs, while cost of liability funding decreased 3 bps primarily from average growth in NIB deposits – Deposit optimization efforts successfully reduced higher cost deposits by $1.2 billion • Total interest cost of funding earning assets decreased 2 bps to 1.90% Interest Bearing Deposits and Cost1 Loans and HFI Yield1, 2 Deposits, Borrowings, and Cost of Liability Funding1 Securities Portfolio and Yield1 $18.6 $18.8 $20.4 $20.4 $20.6 4.81% 4.72% 4.54% 4.59% 4.64% Q2-25 Q3-25 Q4-25 Q1-26 Q2-26 $55.9 $56.6 $58.7 $59.1 $60.9$3.0 $3.5 $3.5 $3.9 $4.3 6.17% 6.18% 6.01% 5.85% 5.82% Q2-25 Q3-25 Q4-25 Q1-26 Q2-26 $48.1 $50.6 $52.8 $54.6 $54.1 3.19% 3.19% 2.96% 2.75% 2.74% Q2-25 Q3-25 Q4-25 Q1-26 Q2-26 $48.1 $50.6 $52.8 $54.6 $54.1 $23.0 $26.6 $24.4 $28.1 $27.8 $6.7 $4.5 $6.3 $6.7 $7.3 2.37% 2.29% 2.11% 1.99% 1.96% Q2-25 Q3-25 Q4-25 Q1-26 Q2-26 Non-Interest Bearing Deposits Total Borrowings Q2 2026 Highlights Net Interest Drivers Dollars in billions Interest Bearing DepositsInterest Bearing Deposits Total Investments HFI Loans HFS Loans 1) Balances are as of each respective period end. 2) Interest income includes a reduction for earnings credits totaling $52.5 million, $48.7 million, $56.6 million, $64.9 million, and $61.3 million for the three months ended June 30, 2026, March 31, 2026, December 31, 2025, September 30, 2025, and June 30, 2025, respectively.
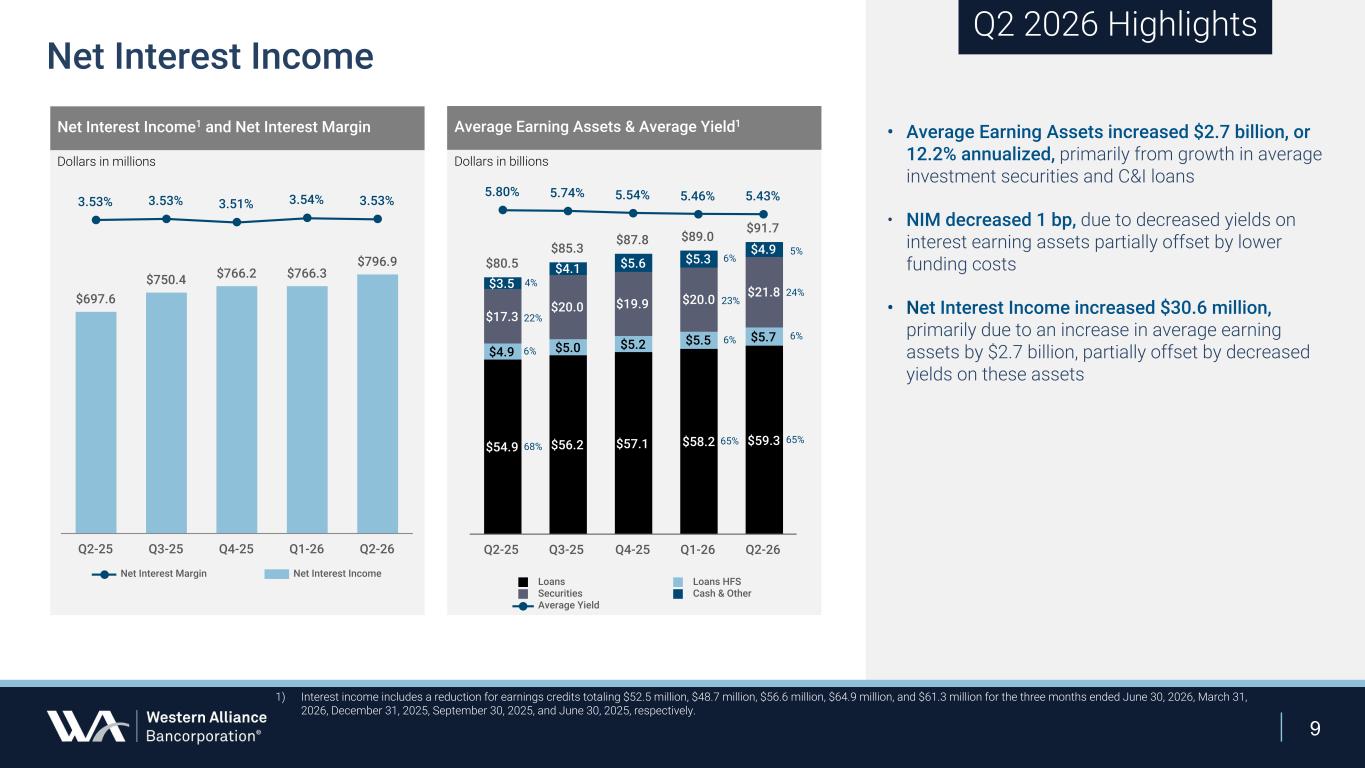
9 • Average Earning Assets increased $2.7 billion, or 12.2% annualized, primarily from growth in average investment securities and C&I loans • NIM decreased 1 bp, due to decreased yields on interest earning assets partially offset by lower funding costs • Net Interest Income increased $30.6 million, primarily due to an increase in average earning assets by $2.7 billion, partially offset by decreased yields on these assets Net Interest Income1 and Net Interest Margin $697.6 $750.4 $766.2 $766.3 $796.9 3.53% 3.53% 3.51% 3.54% 3.53% Net Interest Margin Net Interest Income Q2-25 Q3-25 Q4-25 Q1-26 Q2-26 $80.5 $85.3 $87.8 $89.0 $91.7 $54.9 $56.2 $57.1 $58.2 $59.3 $4.9 $5.0 $5.2 $5.5 $5.7 $17.3 $20.0 $19.9 $20.0 $21.8 $3.5 $4.1 $5.6 $5.3 $4.9 5.80% 5.74% 5.54% 5.46% 5.43% Loans Loans HFS Securities Cash & Other Average Yield Q2-25 Q3-25 Q4-25 Q1-26 Q2-26 Average Earning Assets & Average Yield1 Dollars in millions Dollars in billions Net Interest Income Q2 2026 Highlights 4% 22% 6% 6% 23% 6% 5% 24% 6% 68% 65% 65% 1) Interest income includes a reduction for earnings credits totaling $52.5 million, $48.7 million, $56.6 million, $64.9 million, and $61.3 million for the three months ended June 30, 2026, March 31, 2026, December 31, 2025, September 30, 2025, and June 30, 2025, respectively.
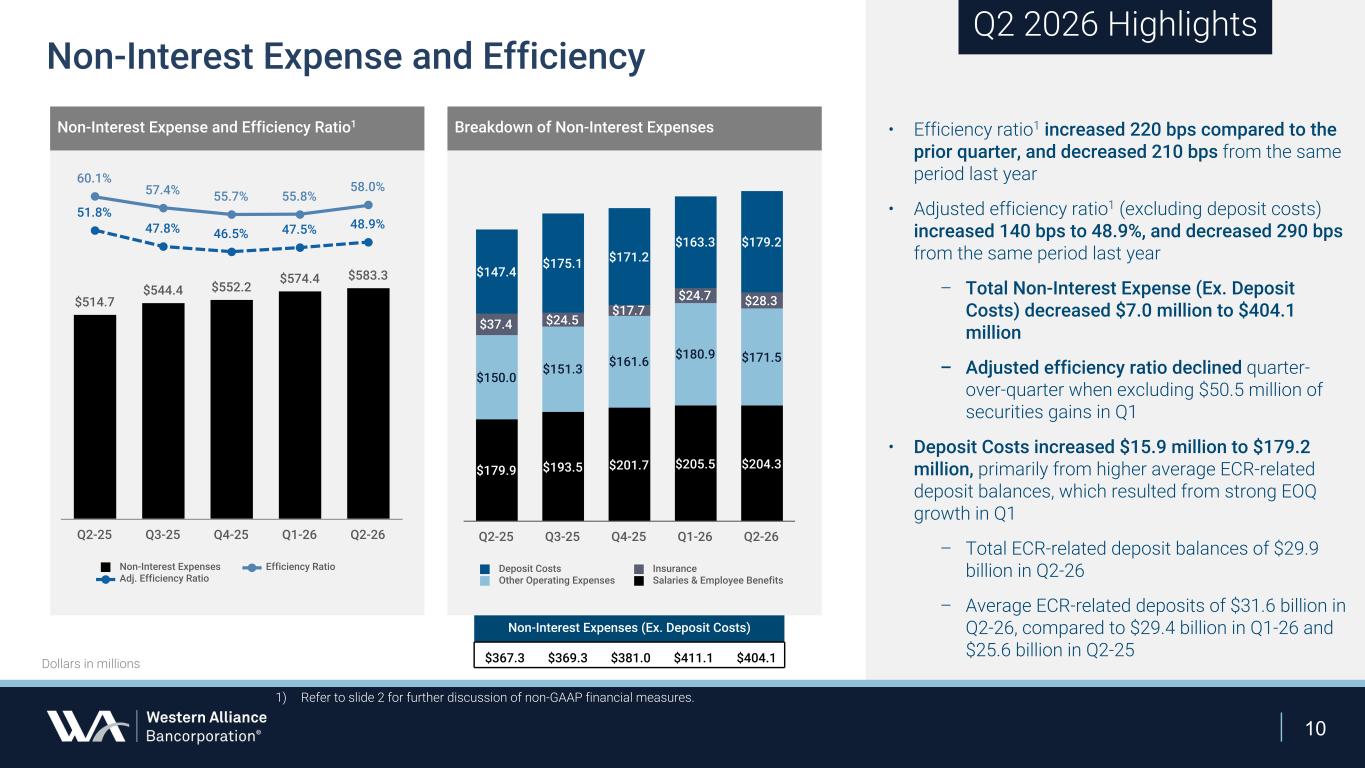
10 • Efficiency ratio1 increased 220 bps compared to the prior quarter, and decreased 210 bps from the same period last year • Adjusted efficiency ratio1 (excluding deposit costs) increased 140 bps to 48.9%, and decreased 290 bps from the same period last year – Total Non-Interest Expense (Ex. Deposit Costs) decreased $7.0 million to $404.1 million – Adjusted efficiency ratio declined quarter- over-quarter when excluding $50.5 million of securities gains in Q1 • Deposit Costs increased $15.9 million to $179.2 million, primarily from higher average ECR-related deposit balances, which resulted from strong EOQ growth in Q1 – Total ECR-related deposit balances of $29.9 billion in Q2-26 – Average ECR-related deposits of $31.6 billion in Q2-26, compared to $29.4 billion in Q1-26 and $25.6 billion in Q2-25 $514.7 $544.4 $552.2 $574.4 $583.3 60.1% 57.4% 55.7% 55.8% 58.0% 51.8% 47.8% 46.5% 47.5% 48.9% Non-Interest Expenses Efficiency Ratio Adj. Efficiency Ratio Q2-25 Q3-25 Q4-25 Q1-26 Q2-26 Dollars in millions Non-Interest Expense and Efficiency $179.9 $193.5 $201.7 $205.5 $204.3 $150.0 $151.3 $161.6 $180.9 $171.5 $37.4 $24.5 $17.7 $24.7 $28.3 $147.4 $175.1 $171.2 $163.3 $179.2 Deposit Costs Insurance Other Operating Expenses Salaries & Employee Benefits Q2-25 Q3-25 Q4-25 Q1-26 Q2-26 Q2 2026 Highlights Non-Interest Expense and Efficiency Ratio1 1) Refer to slide 2 for further discussion of non-GAAP financial measures. Breakdown of Non-Interest Expenses Non-Interest Expenses (Ex. Deposit Costs) $367.3 $369.3 $381.0 $411.1 $404.1
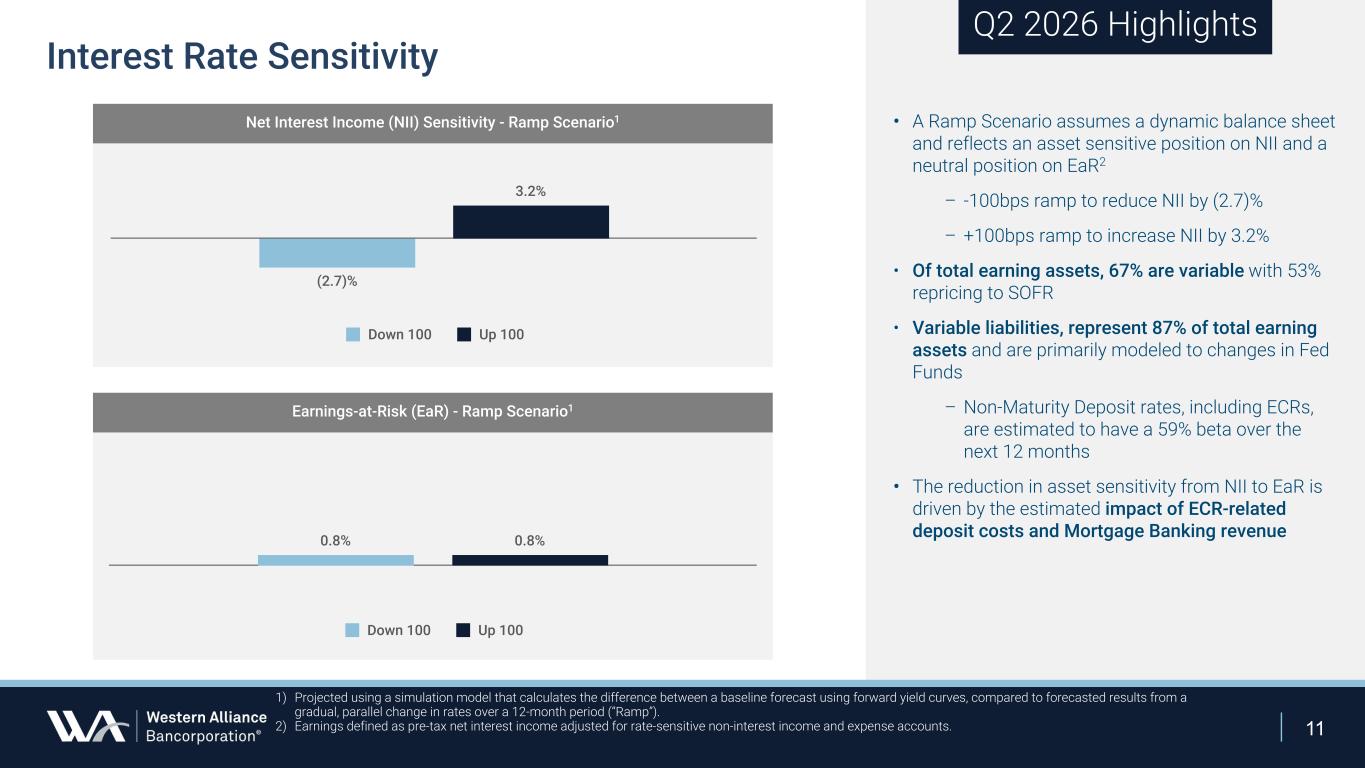
11 Interest Rate Sensitivity Q2 2026 Highlights • A Ramp Scenario assumes a dynamic balance sheet and reflects an asset sensitive position on NII and a neutral position on EaR2 – -100bps ramp to reduce NII by (2.7)% – +100bps ramp to increase NII by 3.2% • Of total earning assets, 67% are variable with 53% repricing to SOFR • Variable liabilities, represent 87% of total earning assets and are primarily modeled to changes in Fed Funds – Non-Maturity Deposit rates, including ECRs, are estimated to have a 59% beta over the next 12 months • The reduction in asset sensitivity from NII to EaR is driven by the estimated impact of ECR-related deposit costs and Mortgage Banking revenue (2.7)% 3.2% Down 100 Up 100 0.8% 0.8% Down 100 Up 100 1) Projected using a simulation model that calculates the difference between a baseline forecast using forward yield curves, compared to forecasted results from a gradual, parallel change in rates over a 12-month period (“Ramp”). 2) Earnings defined as pre-tax net interest income adjusted for rate-sensitive non-interest income and expense accounts. Net Interest Income (NII) Sensitivity - Ramp Scenario1 Earnings-at-Risk (EaR) - Ramp Scenario1
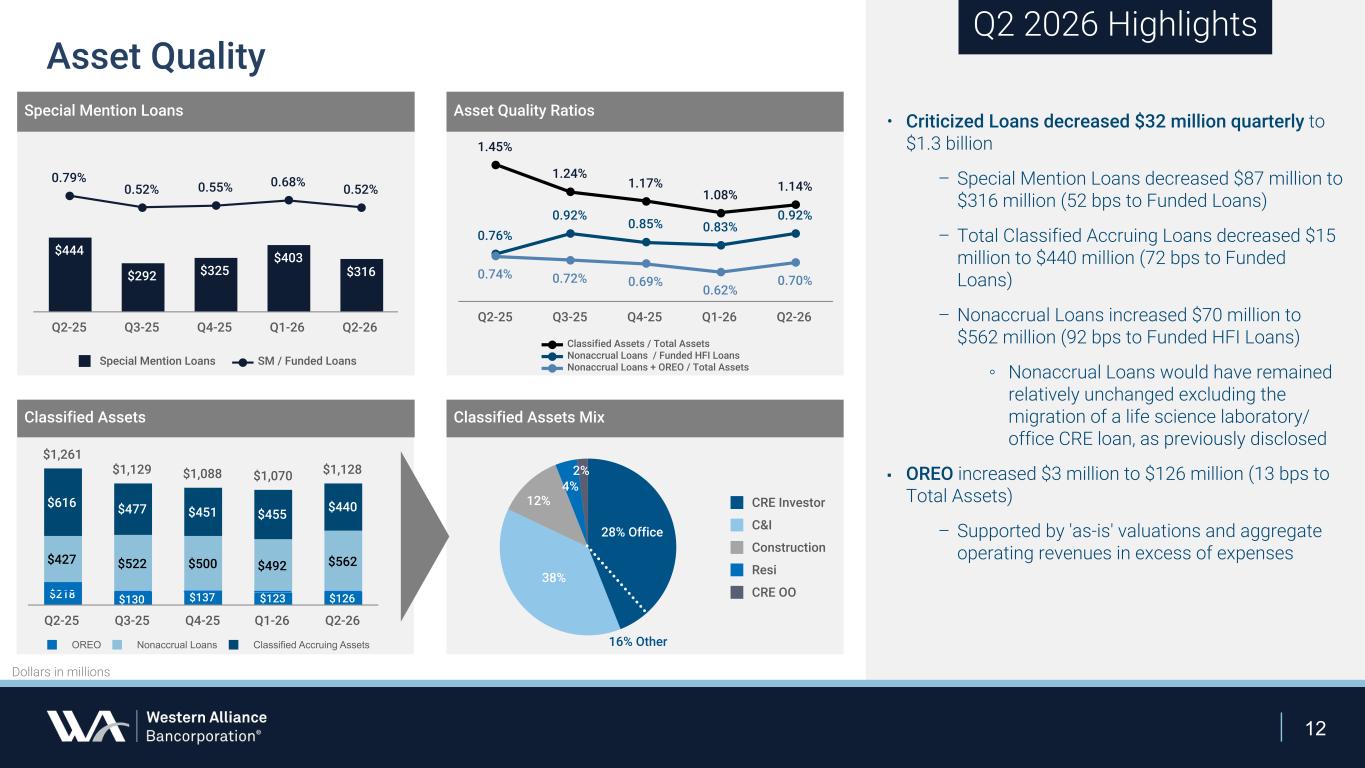
12 1.45% 1.24% 1.17% 1.08% 1.14% 0.76% 0.92% 0.85% 0.83% 0.92% 0.74% 0.72% 0.69% 0.62% 0.70% Classified Assets / Total Assets Nonaccrual Loans / Funded HFI Loans Nonaccrual Loans + OREO / Total Assets Q2-25 Q3-25 Q4-25 Q1-26 Q2-26 $1,261 $1,129 $1,088 $1,070 $1,128 $218 $130 $137 $123 $126 $427 $522 $500 $492 $562 $616 $477 $451 $455 $440 OREO Nonaccrual Loans Classified Accruing Assets Q2-25 Q3-25 Q4-25 Q1-26 Q2-26 Dollars in millions Asset Quality RatiosSpecial Mention Loans • Criticized Loans decreased $32 million quarterly to $1.3 billion – Special Mention Loans decreased $87 million to $316 million (52 bps to Funded Loans) – Total Classified Accruing Loans decreased $15 million to $440 million (72 bps to Funded Loans) – Nonaccrual Loans increased $70 million to $562 million (92 bps to Funded HFI Loans) ◦ Nonaccrual Loans would have remained relatively unchanged excluding the migration of a life science laboratory/ office CRE loan, as previously disclosed ▪ OREO increased $3 million to $126 million (13 bps to Total Assets) – Supported by 'as-is' valuations and aggregate operating revenues in excess of expenses Classified Assets $444 $292 $325 $403 $316 0.79% 0.52% 0.55% 0.68% 0.52% Special Mention Loans SM / Funded Loans Q2-25 Q3-25 Q4-25 Q1-26 Q2-26 Q2 2026 Highlights Classified Assets Mix 38% 12% 4% 2% CRE Investor C&I Construction Resi CRE OO 16% Other 28% Office Asset Quality
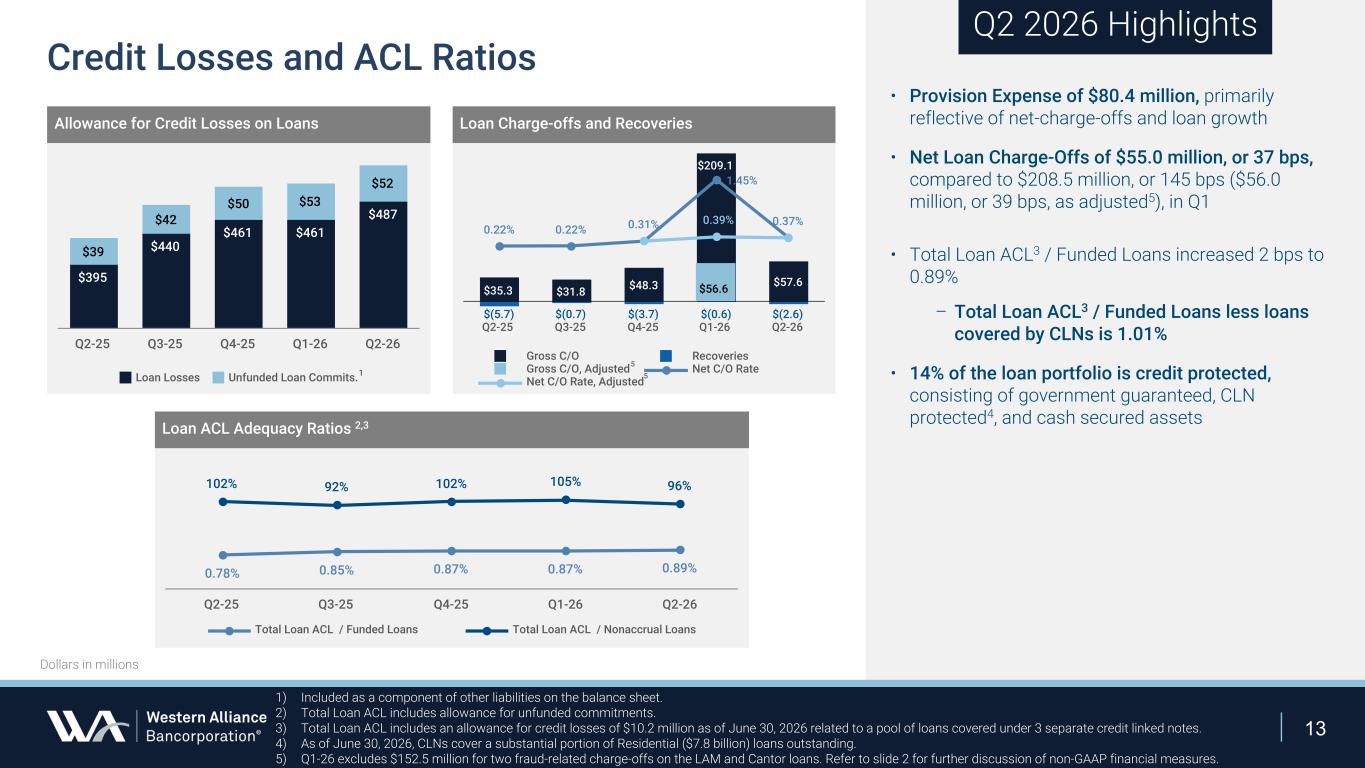
13 $35.3 $31.8 $48.3 $209.1 $57.6 $(5.7) $(0.7) $(3.7) $(0.6) $(2.6) 0.22% 0.22% 0.31% 1.45% 0.37% Gross C/O Recoveries Gross C/O, Adjusted Net C/O Rate Net C/O Rate, Adjusted Q2-25 Q3-25 Q4-25 Q1-26 Q2-26 $395 $440 $461 $461 $487 $39 $42 $50 $53 $52 Loan Losses Unfunded Loan Commits. Q2-25 Q3-25 Q4-25 Q1-26 Q2-26 0.78% 0.85% 0.87% 0.87% 0.89% 102% 92% 102% 105% 96% Total Loan ACL / Funded Loans Total Loan ACL / Nonaccrual Loans Q2-25 Q3-25 Q4-25 Q1-26 Q2-26 Dollars in millions • Provision Expense of $80.4 million, primarily reflective of net-charge-offs and loan growth • Net Loan Charge-Offs of $55.0 million, or 37 bps, compared to $208.5 million, or 145 bps ($56.0 million, or 39 bps, as adjusted5), in Q1 • Total Loan ACL3 / Funded Loans increased 2 bps to 0.89% – Total Loan ACL3 / Funded Loans less loans covered by CLNs is 1.01% • 14% of the loan portfolio is credit protected, consisting of government guaranteed, CLN protected4, and cash secured assets Credit Losses and ACL Ratios Q2 2026 Highlights Loan Charge-offs and RecoveriesAllowance for Credit Losses on Loans Loan ACL Adequacy Ratios 2,3 1) Included as a component of other liabilities on the balance sheet. 2) Total Loan ACL includes allowance for unfunded commitments. 3) Total Loan ACL includes an allowance for credit losses of $10.2 million as of June 30, 2026 related to a pool of loans covered under 3 separate credit linked notes. 4) As of June 30, 2026, CLNs cover a substantial portion of Residential ($7.8 billion) loans outstanding. 5) Q1-26 excludes $152.5 million for two fraud-related charge-offs on the LAM and Cantor loans. Refer to slide 2 for further discussion of non-GAAP financial measures. 1 $56.6 0.39% 5 5
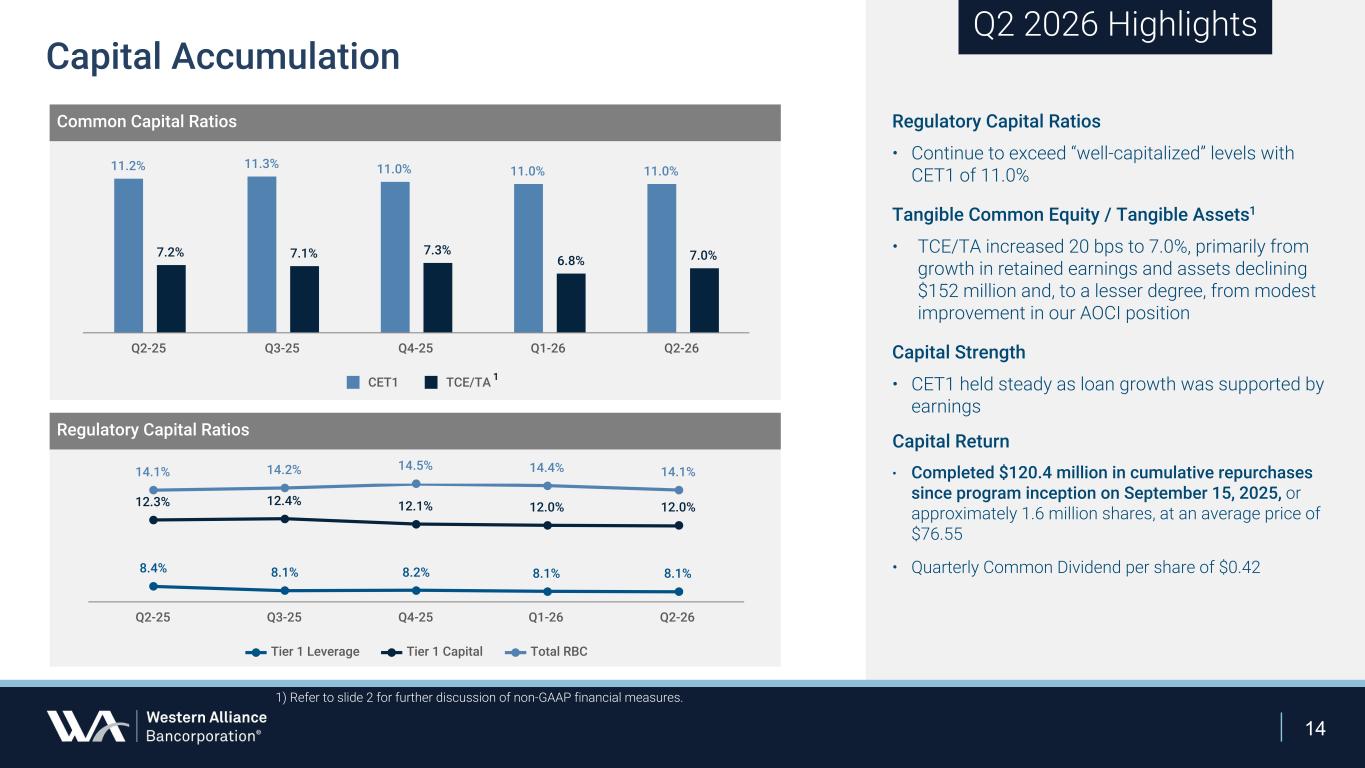
14 Regulatory Capital Ratios • Continue to exceed “well-capitalized” levels with CET1 of 11.0% Tangible Common Equity / Tangible Assets1 • TCE/TA increased 20 bps to 7.0%, primarily from growth in retained earnings and assets declining $152 million and, to a lesser degree, from modest improvement in our AOCI position Capital Strength • CET1 held steady as loan growth was supported by earnings Capital Return • Completed $120.4 million in cumulative repurchases since program inception on September 15, 2025, or approximately 1.6 million shares, at an average price of $76.55 • Quarterly Common Dividend per share of $0.42 11.2% 11.3% 11.0% 11.0% 11.0% 7.2% 7.1% 7.3% 6.8% 7.0% CET1 TCE/TA Q2-25 Q3-25 Q4-25 Q1-26 Q2-26 1) Refer to slide 2 for further discussion of non-GAAP financial measures. 14.1% 14.2% 14.5% 14.4% 14.1% 12.3% 12.4% 12.1% 12.0% 12.0% 8.4% 8.1% 8.2% 8.1% 8.1% Tier 1 Leverage Tier 1 Capital Total RBC Q2-25 Q3-25 Q4-25 Q1-26 Q2-26 Q2 2026 Highlights Common Capital Ratios Capital Accumulation Regulatory Capital Ratios 1
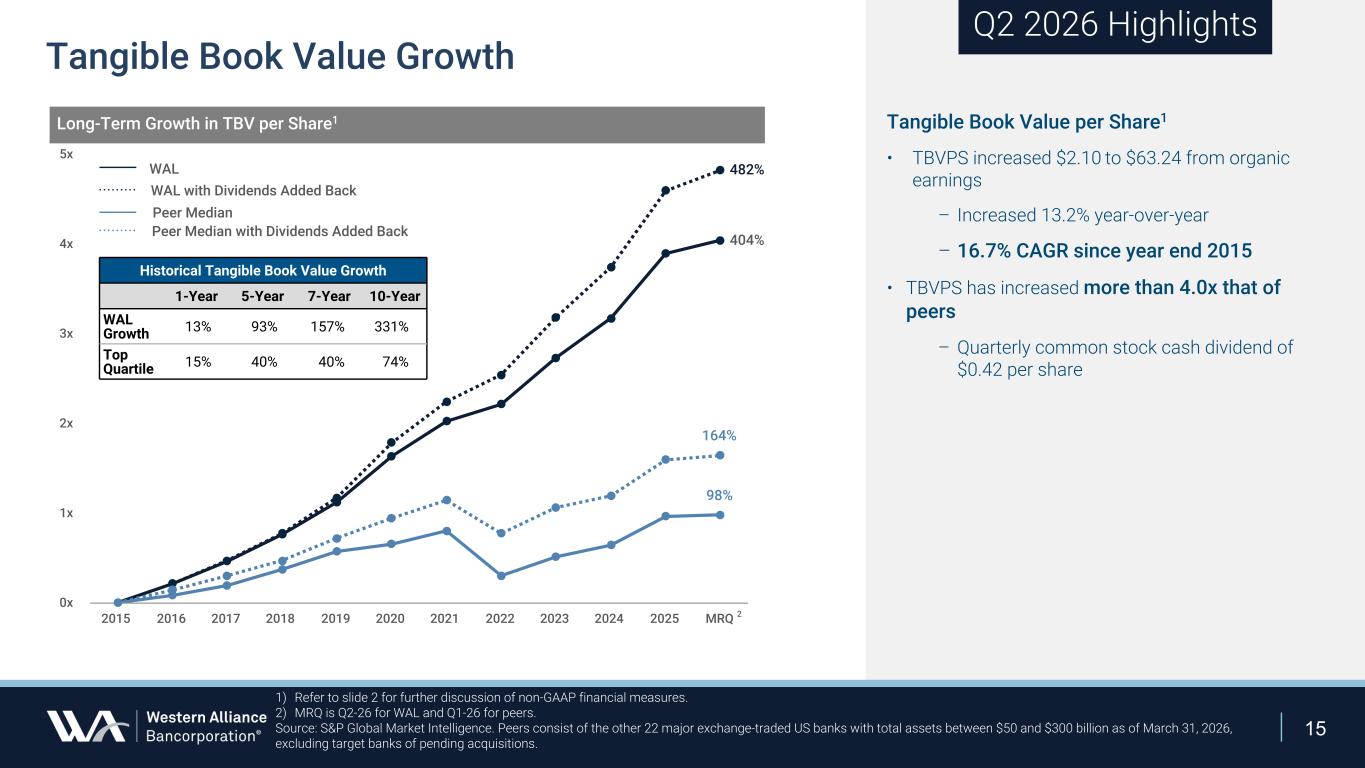
15 404% 482% 98% 164% 2015 2016 2017 2018 2019 2020 2021 2022 2023 2024 2025 MRQ 0x 1x 2x 3x 4x 5x Tangible Book Value per Share1 • TBVPS increased $2.10 to $63.24 from organic earnings – Increased 13.2% year-over-year – 16.7% CAGR since year end 2015 • TBVPS has increased more than 4.0x that of peers – Quarterly common stock cash dividend of $0.42 per share 1) Refer to slide 2 for further discussion of non-GAAP financial measures. 2) MRQ is Q2-26 for WAL and Q1-26 for peers. Source: S&P Global Market Intelligence. Peers consist of the other 22 major exchange-traded US banks with total assets between $50 and $300 billion as of March 31, 2026, excluding target banks of pending acquisitions. Q2 2026 Highlights Tangible Book Value Growth Long-Term Growth in TBV per Share1 2 WAL Peer Median with Dividends Added Back Peer Median WAL with Dividends Added Back Historical Tangible Book Value Growth 1-Year 5-Year 7-Year 10-Year WAL Growth 13 % 93 % 157 % 331 % Top Quartile 15 % 40 % 40 % 74 %
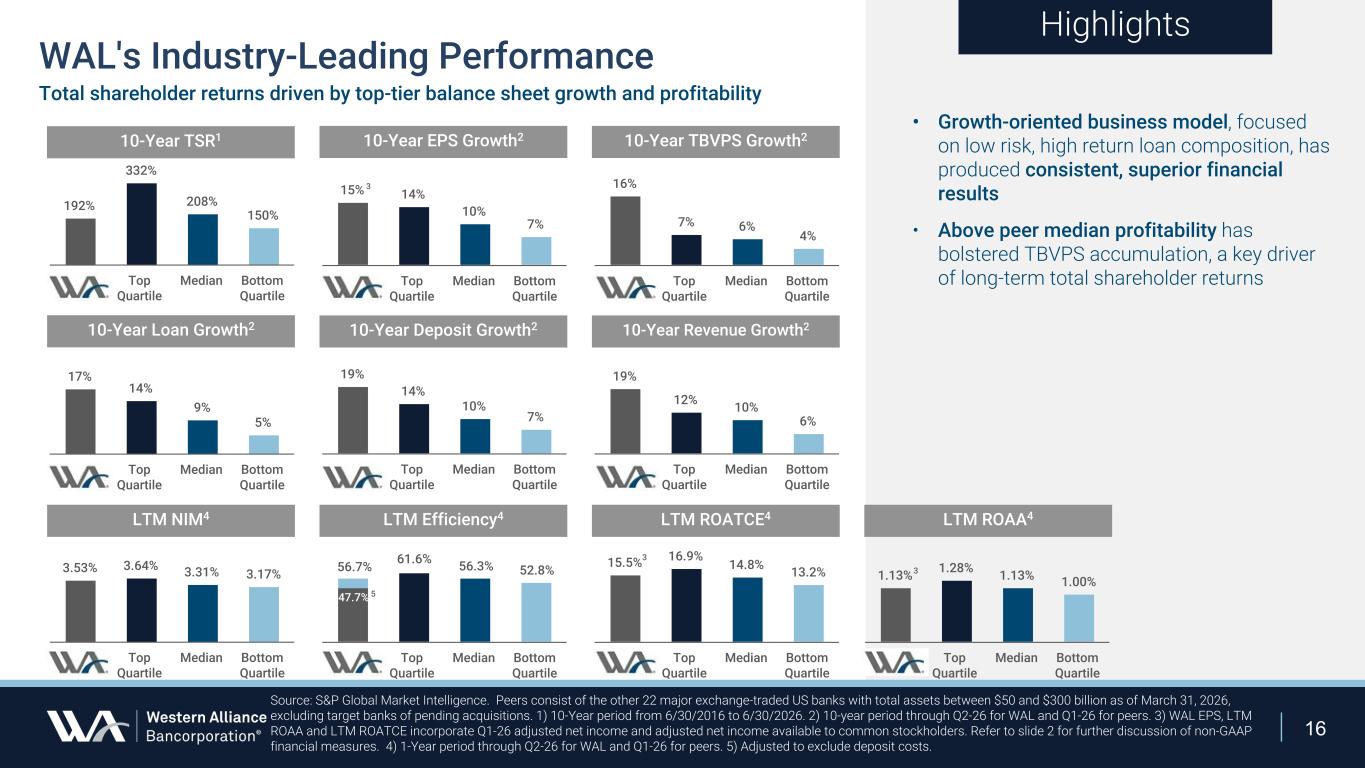
16 • Growth-oriented business model, focused on low risk, high return loan composition, has produced consistent, superior financial results • Above peer median profitability has bolstered TBVPS accumulation, a key driver of long-term total shareholder returns Highlights Source: S&P Global Market Intelligence. Peers consist of the other 22 major exchange-traded US banks with total assets between $50 and $300 billion as of March 31, 2026, excluding target banks of pending acquisitions. 1) 10-Year period from 6/30/2016 to 6/30/2026. 2) 10-year period through Q2-26 for WAL and Q1-26 for peers. 3) WAL EPS, LTM ROAA and LTM ROATCE incorporate Q1-26 adjusted net income and adjusted net income available to common stockholders. Refer to slide 2 for further discussion of non-GAAP financial measures. 4) 1-Year period through Q2-26 for WAL and Q1-26 for peers. 5) Adjusted to exclude deposit costs. WAL's Industry-Leading Performance Total shareholder returns driven by top-tier balance sheet growth and profitability 192% 332% 208% 150% WAL Top Quartile Median Bottom Quartile 15% 14% 10% 7% WAL Top Quartile Median Bottom Quartile 16% 7% 6% 4% WAL Top Quartile Median Bottom Quartile 17% 14% 9% 5% WAL Top Quartile Median Bottom Quartile 19% 14% 10% 7% WAL Top Quartile Median Bottom Quartile 19% 12% 10% 6% WAL Top Quartile Median Bottom Quartile 15.5% 16.9% 14.8% 13.2% WAL Top Quartile Median Bottom Quartile WAL Top Quartile Median Bottom Quartile 3.53% 3.64% 3.31% 3.17% WAL Top Quartile Median Bottom Quartile 10-Year Loan Growth2 10-Year Deposit Growth2 10-Year Revenue Growth2 LTM NIM4 LTM Efficiency4 LTM ROATCE4 1.13% 1.28% 1.13% 1.00% WAL Top Quartile Median Bottom Quartile 61.6% 56.3% 52.8%56.7% 47.7% 5 3 3 3 10-Year TSR1 10-Year EPS Growth2 10-Year TBVPS Growth2 LTM ROAA4
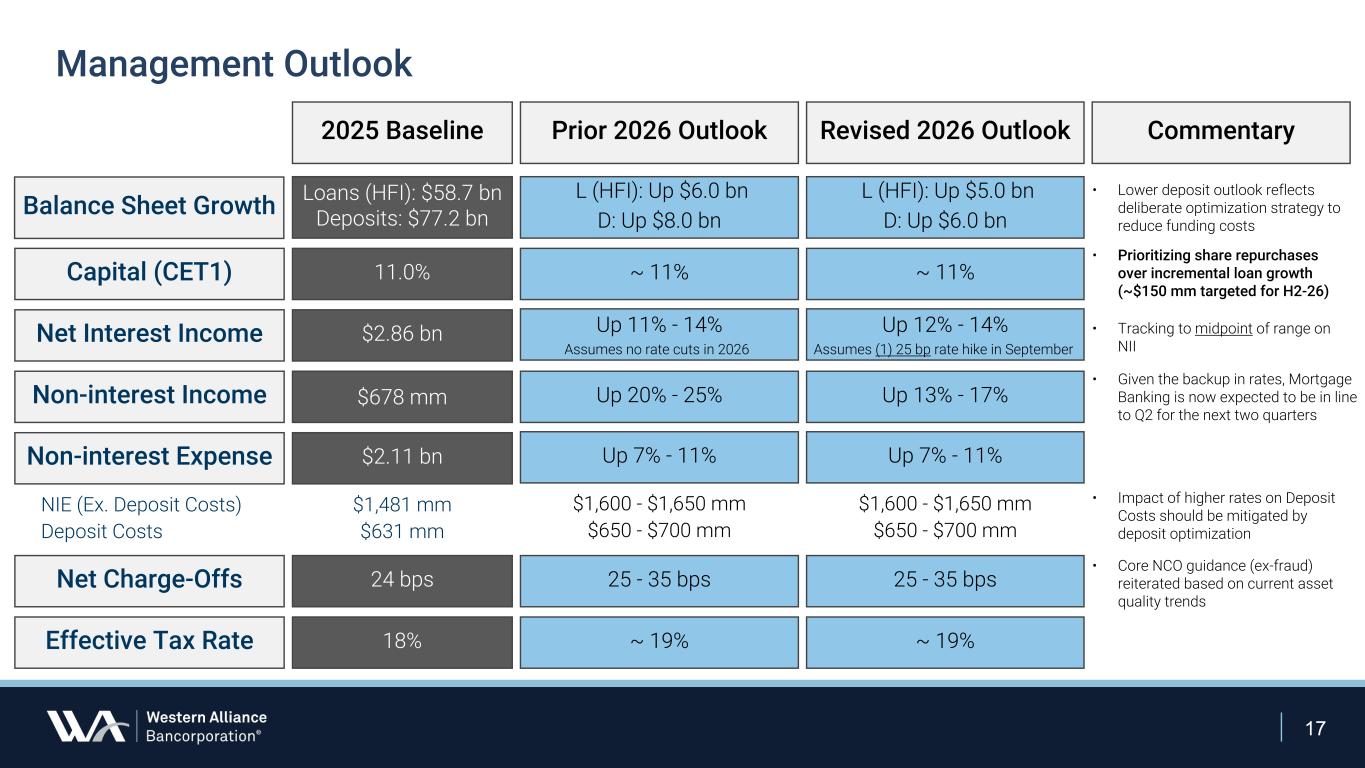
17 • Given the backup in rates, Mortgage Banking is now expected to be in line to Q2 for the next two quarters • Core NCO guidance (ex-fraud) reiterated based on current asset quality trends Balance Sheet Growth Capital (CET1) Net Interest Income Non-interest Income Non-interest Expense Net Charge-Offs Effective Tax Rate 2025 Baseline Prior 2026 Outlook Loans (HFI): $58.7 bn Deposits: $77.2 bn L (HFI): Up $6.0 bn D: Up $8.0 bn 11.0% ~ 11% $2.86 bn Up 11% - 14% $678 mm Up 20% - 25% $2.11 bn 24 bps Up 7% - 11% 25 - 35 bps 18% ~ 19% NIE (Ex. Deposit Costs) Deposit Costs $1,600 - $1,650 mm $650 - $700 mm $1,481 mm $631 mm Management Outlook Commentary • Prioritizing share repurchases over incremental loan growth (~$150 mm targeted for H2-26) Assumes no rate cuts in 2026 • Impact of higher rates on Deposit Costs should be mitigated by deposit optimization • Tracking to midpoint of range on NII Revised 2026 Outlook L (HFI): Up $5.0 bn D: Up $6.0 bn ~ 11% Up 12% - 14% Up 13% - 17% Up 7% - 11% 25 - 35 bps ~ 19% $1,600 - $1,650 mm $650 - $700 mm Assumes (1) 25 bp rate hike in September • Lower deposit outlook reflects deliberate optimization strategy to reduce funding costs

Questions & Answers
Appendix
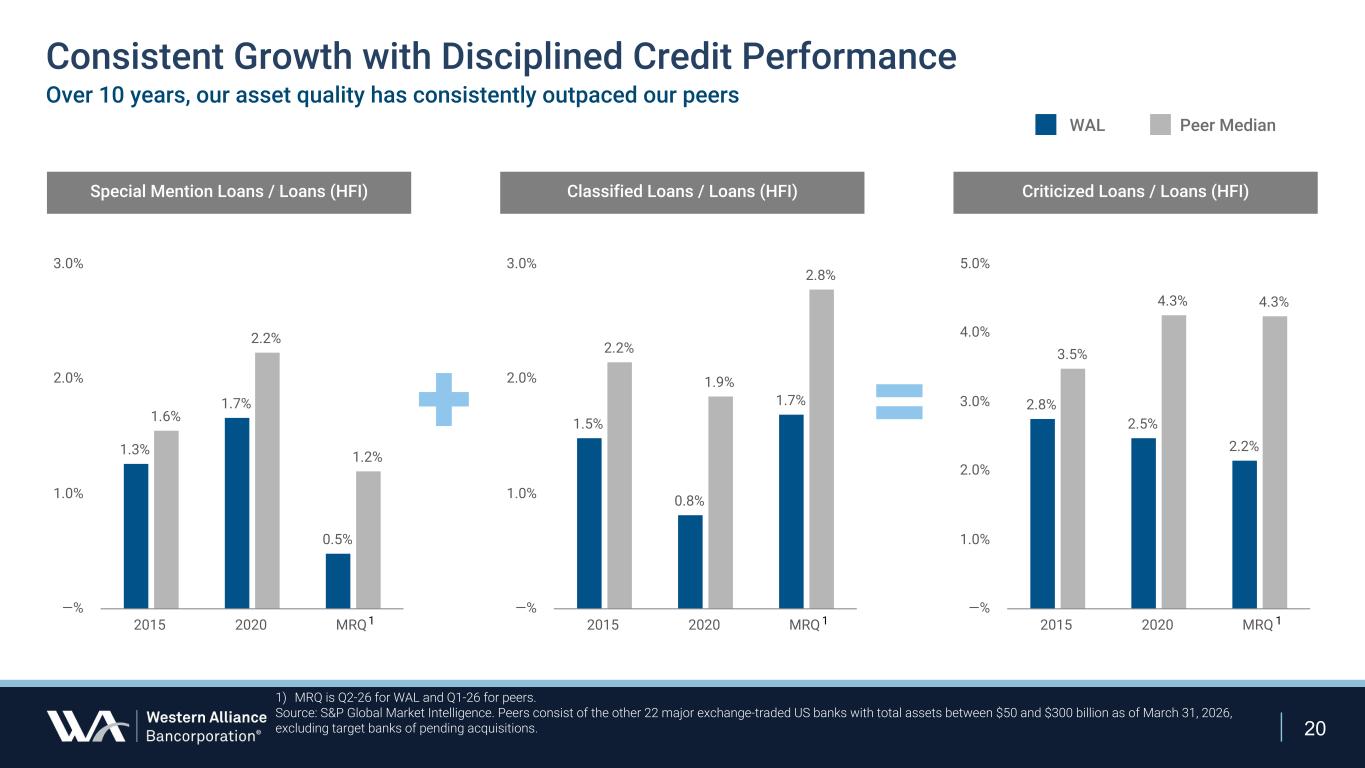
20 Consistent Growth with Disciplined Credit Performance Over 10 years, our asset quality has consistently outpaced our peers 1.3% 1.7% 0.5% 1.6% 2.2% 1.2% 2015 2020 MRQ —% 1.0% 2.0% 3.0% 1.5% 0.8% 1.7% 2.2% 1.9% 2.8% 2015 2020 MRQ —% 1.0% 2.0% 3.0% 2.8% 2.5% 2.2% 3.5% 4.3% 4.3% 2015 2020 MRQ —% 1.0% 2.0% 3.0% 4.0% 5.0% + = Special Mention Loans / Loans (HFI) Classified Loans / Loans (HFI) Criticized Loans / Loans (HFI) 1) MRQ is Q2-26 for WAL and Q1-26 for peers. Source: S&P Global Market Intelligence. Peers consist of the other 22 major exchange-traded US banks with total assets between $50 and $300 billion as of March 31, 2026, excluding target banks of pending acquisitions. 1 1 1 WAL Peer Median
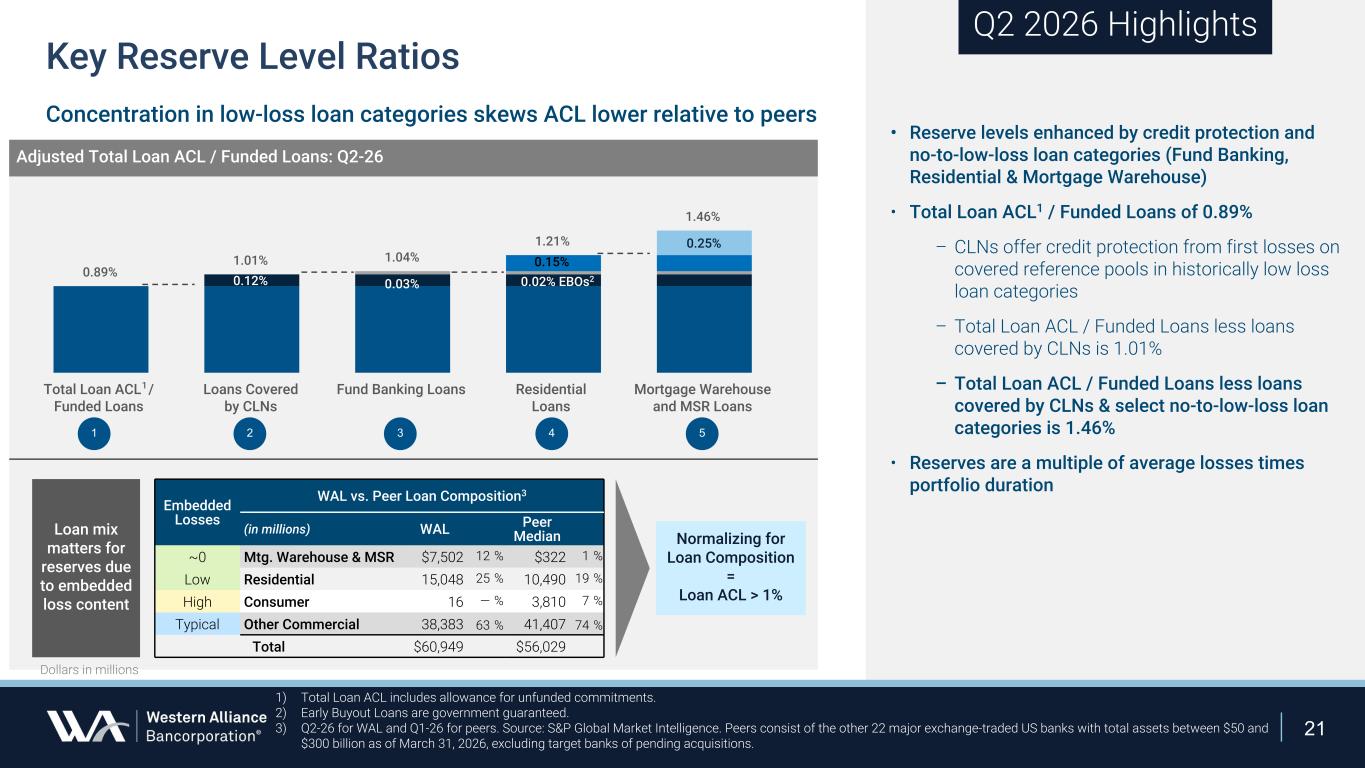
21 • Reserve levels enhanced by credit protection and no-to-low-loss loan categories (Fund Banking, Residential & Mortgage Warehouse) • Total Loan ACL1 / Funded Loans of 0.89% – CLNs offer credit protection from first losses on covered reference pools in historically low loss loan categories – Total Loan ACL / Funded Loans less loans covered by CLNs is 1.01% – Total Loan ACL / Funded Loans less loans covered by CLNs & select no-to-low-loss loan categories is 1.46% • Reserves are a multiple of average losses times portfolio duration Q2 2026 Highlights Adjusted Total Loan ACL / Funded Loans: Q2-26 1) Total Loan ACL includes allowance for unfunded commitments. 2) Early Buyout Loans are government guaranteed. 3) Q2-26 for WAL and Q1-26 for peers. Source: S&P Global Market Intelligence. Peers consist of the other 22 major exchange-traded US banks with total assets between $50 and $300 billion as of March 31, 2026, excluding target banks of pending acquisitions. Key Reserve Level Ratios Concentration in low-loss loan categories skews ACL lower relative to peers 0.89% 1.01% 1.04% 1.21% 1.46% 0.12% 0.03% 0.25% Total Loan ACL / Funded Loans Loans Covered by CLNs Fund Banking Loans Residential Loans Mortgage Warehouse and MSR Loans 1 2 3 4 5 0.15% 1 Embedded Losses WAL vs. Peer Loan Composition3 (in millions) WAL Peer Median ~0 Mtg. Warehouse & MSR $7,502 12 % $322 1 % Low Residential 15,048 25 % 10,490 19 % High Consumer 16 — % 3,810 7 % Typical Other Commercial 38,383 63 % 41,407 74 % Total $60,949 $56,029 Loan mix matters for reserves due to embedded loss content Normalizing for Loan Composition = Loan ACL > 1% Dollars in millions 0.02% EBOs2
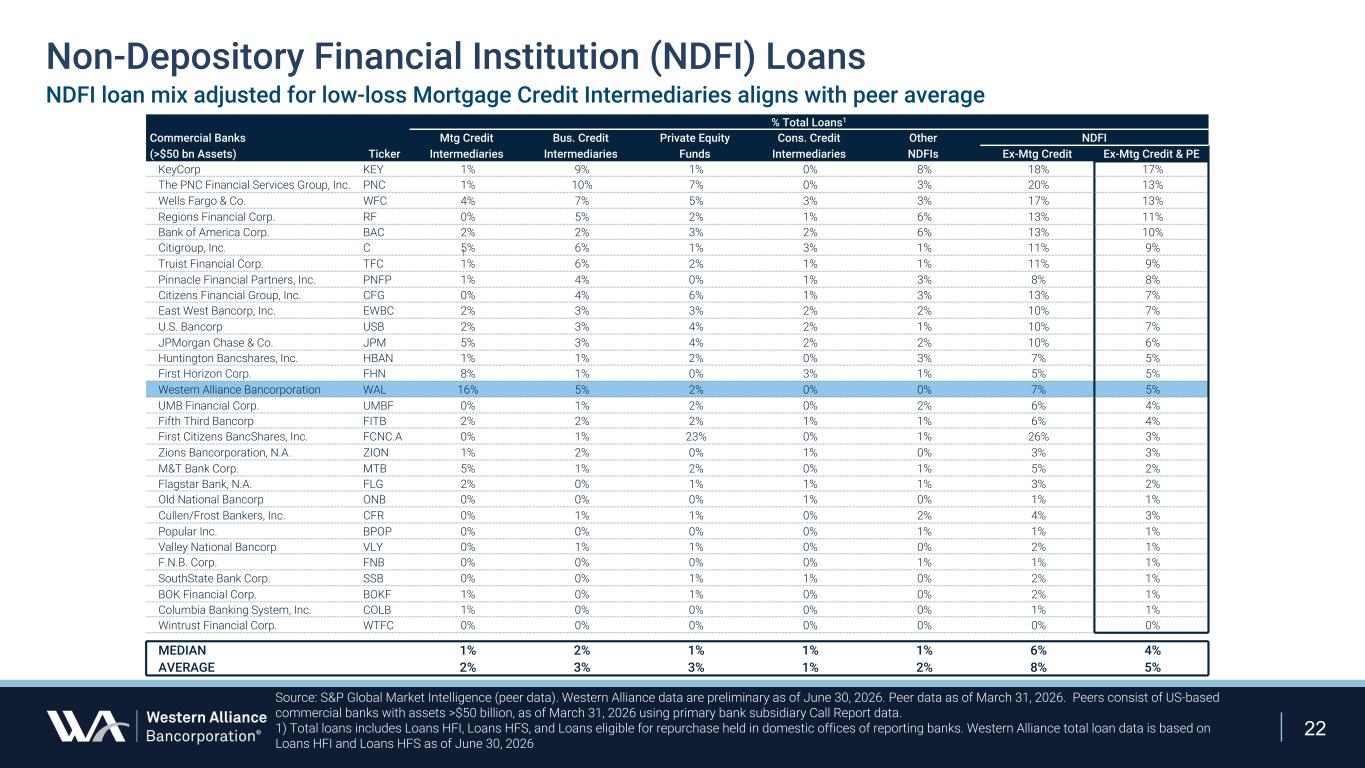
22 Source: S&P Global Market Intelligence (peer data). Western Alliance data are preliminary as of June 30, 2026. Peer data as of March 31, 2026. Peers consist of US-based commercial banks with assets >$50 billion, as of March 31, 2026 using primary bank subsidiary Call Report data. 1) Total loans includes Loans HFI, Loans HFS, and Loans eligible for repurchase held in domestic offices of reporting banks. Western Alliance total loan data is based on Loans HFI and Loans HFS as of June 30, 2026 Non-Depository Financial Institution (NDFI) Loans NDFI loan mix adjusted for low-loss Mortgage Credit Intermediaries aligns with peer average 1 % Total Loans1 Commercial Banks Mtg Credit Bus. Credit Private Equity Cons. Credit Other NDFI (>$50 bn Assets) Ticker Intermediaries Intermediaries Funds Intermediaries NDFIs Ex-Mtg Credit Ex-Mtg Credit & PE KeyCorp KEY 1% 9% 1% 0% 8% 18% 17% The PNC Financial Services Group, Inc. PNC 1% 10% 7% 0% 3% 20% 13% Wells Fargo & Co. WFC 4% 7% 5% 3% 3% 17% 13% Regions Financial Corp. RF 0% 5% 2% 1% 6% 13% 11% Bank of America Corp. BAC 2% 2% 3% 2% 6% 13% 10% Citigroup, Inc. C 5% 6% 1% 3% 1% 11% 9% Truist Financial Corp. TFC 1% 6% 2% 1% 1% 11% 9% Pinnacle Financial Partners, Inc. PNFP 1% 4% 0% 1% 3% 8% 8% Citizens Financial Group, Inc. CFG 0% 4% 6% 1% 3% 13% 7% East West Bancorp, Inc. EWBC 2% 3% 3% 2% 2% 10% 7% U.S. Bancorp USB 2% 3% 4% 2% 1% 10% 7% JPMorgan Chase & Co. JPM 5% 3% 4% 2% 2% 10% 6% Huntington Bancshares, Inc. HBAN 1% 1% 2% 0% 3% 7% 5% First Horizon Corp. FHN 8% 1% 0% 3% 1% 5% 5% Western Alliance Bancorporation WAL 16% 5% 2% 0% 0% 7% 5% UMB Financial Corp. UMBF 0% 1% 2% 0% 2% 6% 4% Fifth Third Bancorp FITB 2% 2% 2% 1% 1% 6% 4% First Citizens BancShares, Inc. FCNC.A 0% 1% 23% 0% 1% 26% 3% Zions Bancorporation, N.A. ZION 1% 2% 0% 1% 0% 3% 3% M&T Bank Corp. MTB 5% 1% 2% 0% 1% 5% 2% Flagstar Bank, N.A. FLG 2% 0% 1% 1% 1% 3% 2% Old National Bancorp ONB 0% 0% 0% 1% 0% 1% 1% Cullen/Frost Bankers, Inc. CFR 0% 1% 1% 0% 2% 4% 3% Popular Inc. BPOP 0% 0% 0% 0% 1% 1% 1% Valley National Bancorp VLY 0% 1% 1% 0% 0% 2% 1% F.N.B. Corp. FNB 0% 0% 0% 0% 1% 1% 1% SouthState Bank Corp. SSB 0% 0% 1% 1% 0% 2% 1% BOK Financial Corp. BOKF 1% 0% 1% 0% 0% 2% 1% Columbia Banking System, Inc. COLB 1% 0% 0% 0% 0% 1% 1% Wintrust Financial Corp. WTFC 0% 0% 0% 0% 0% 0% 0% MEDIAN 1% 2% 1% 1% 1% 6% 4% AVERAGE 2% 3% 3% 1% 2% 8% 5%
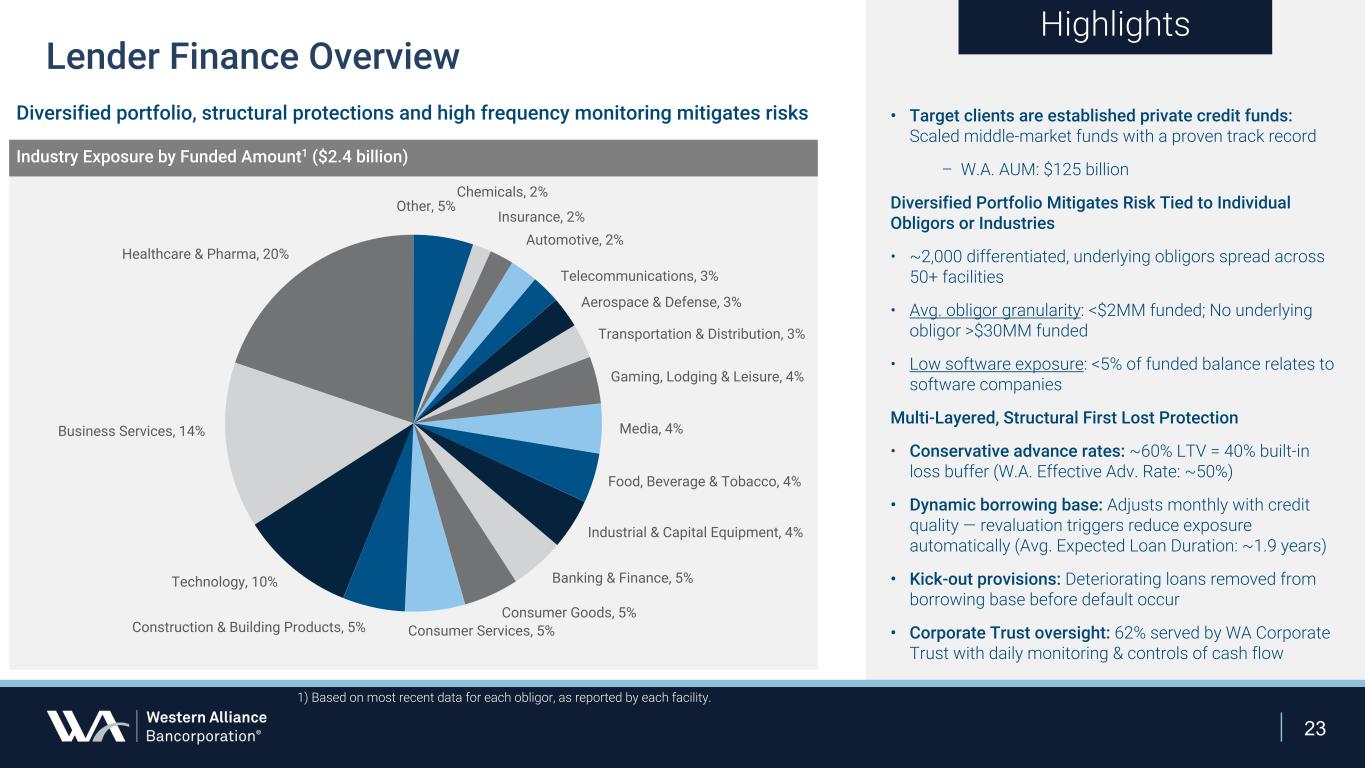
23 • Target clients are established private credit funds: Scaled middle-market funds with a proven track record – W.A. AUM: $125 billion Diversified Portfolio Mitigates Risk Tied to Individual Obligors or Industries • ~2,000 differentiated, underlying obligors spread across 50+ facilities • Avg. obligor granularity: <$2MM funded; No underlying obligor >$30MM funded • Low software exposure: <5% of funded balance relates to software companies Multi-Layered, Structural First Lost Protection • Conservative advance rates: ~60% LTV = 40% built-in loss buffer (W.A. Effective Adv. Rate: ~50%) • Dynamic borrowing base: Adjusts monthly with credit quality — revaluation triggers reduce exposure automatically (Avg. Expected Loan Duration: ~1.9 years) • Kick-out provisions: Deteriorating loans removed from borrowing base before default occur • Corporate Trust oversight: 62% served by WA Corporate Trust with daily monitoring & controls of cash flow Highlights Industry Exposure by Funded Amount1 ($2.4 billion) 1) Based on most recent data for each obligor, as reported by each facility. Lender Finance Overview Diversified portfolio, structural protections and high frequency monitoring mitigates risks Other, 5% Chemicals, 2% Insurance, 2% Automotive, 2% Telecommunications, 3% Aerospace & Defense, 3% Transportation & Distribution, 3% Gaming, Lodging & Leisure, 4% Media, 4% Food, Beverage & Tobacco, 4% Industrial & Capital Equipment, 4% Banking & Finance, 5% Consumer Goods, 5% Consumer Services, 5%Construction & Building Products, 5% Technology, 10% Business Services, 14% Healthcare & Pharma, 20%
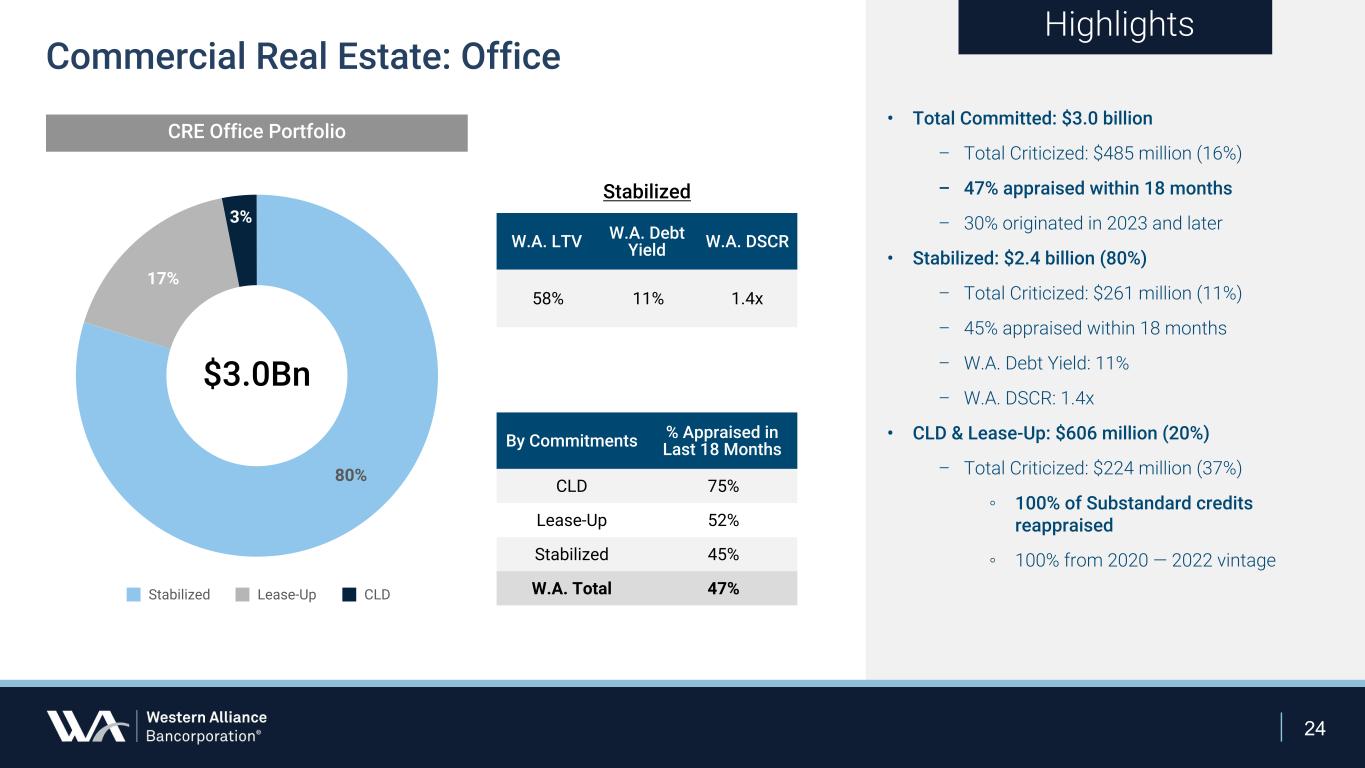
24 Commercial Real Estate: Office 80% 17% 3% Stabilized Lease-Up CLD Stabilized W.A. LTV W.A. Debt Yield W.A. DSCR 58% 11% 1.4x By Commitments % Appraised in Last 18 Months CLD 75% Lease-Up 52% Stabilized 45% W.A. Total 47% Highlights • Total Committed: $3.0 billion – Total Criticized: $485 million (16%) – 47% appraised within 18 months – 30% originated in 2023 and later • Stabilized: $2.4 billion (80%) – Total Criticized: $261 million (11%) – 45% appraised within 18 months – W.A. Debt Yield: 11% – W.A. DSCR: 1.4x • CLD & Lease-Up: $606 million (20%) – Total Criticized: $224 million (37%) ◦ 100% of Substandard credits reappraised ◦ 100% from 2020 — 2022 vintage CRE Office Portfolio $3.0Bn