
Q2 2026 Update

Overview Financial Summary Technology Capacity Distribution Underwriting Performance Financial Statements Additional Information
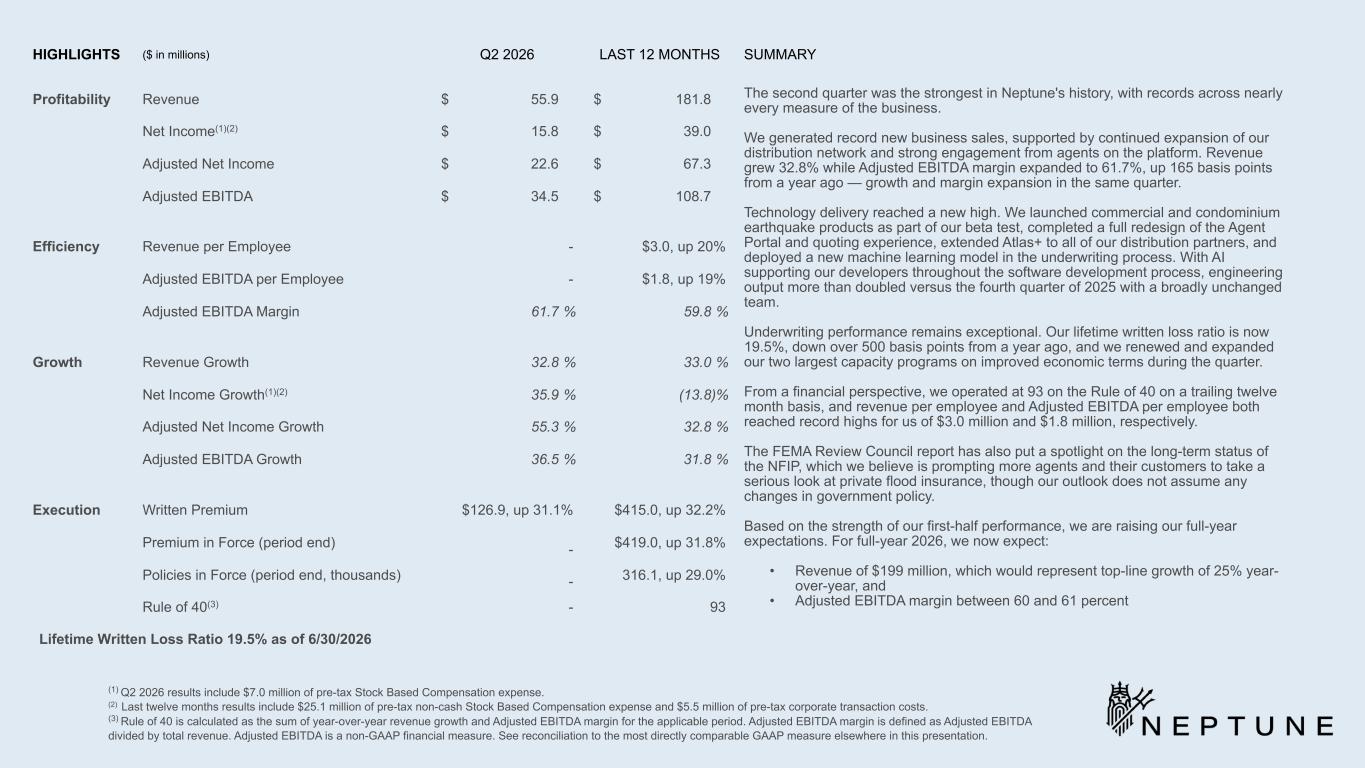
HIGHLIGHTS ($ in millions) Q2 2026 LAST 12 MONTHS SUMMARY Profitability Revenue $ 55.9 $ 181.8 The second quarter was the strongest in Neptune's history, with records across nearly every measure of the business. We generated record new business sales, supported by continued expansion of our distribution network and strong engagement from agents on the platform. Revenue grew 32.8% while Adjusted EBITDA margin expanded to 61.7%, up 165 basis points from a year ago — growth and margin expansion in the same quarter. Technology delivery reached a new high. We launched commercial and condominium earthquake products as part of our beta test, completed a full redesign of the Agent Portal and quoting experience, extended Atlas+ to all of our distribution partners, and deployed a new machine learning model in the underwriting process. With AI supporting our developers throughout the software development process, engineering output more than doubled versus the fourth quarter of 2025 with a broadly unchanged team. Underwriting performance remains exceptional. Our lifetime written loss ratio is now 19.5%, down over 500 basis points from a year ago, and we renewed and expanded our two largest capacity programs on improved economic terms during the quarter. From a financial perspective, we operated at 93 on the Rule of 40 on a trailing twelve month basis, and revenue per employee and Adjusted EBITDA per employee both reached record highs for us of $3.0 million and $1.8 million, respectively. The FEMA Review Council report has also put a spotlight on the long-term status of the NFIP, which we believe is prompting more agents and their customers to take a serious look at private flood insurance, though our outlook does not assume any changes in government policy. Based on the strength of our first-half performance, we are raising our full-year expectations. For full-year 2026, we now expect: • Revenue of $199 million, which would represent top-line growth of 25% year- over-year, and • Adjusted EBITDA margin between 60 and 61 percent Net Income(1)(2) $ 15.8 $ 39.0 Adjusted Net Income $ 22.6 $ 67.3 Adjusted EBITDA $ 34.5 $ 108.7 Efficiency Revenue per Employee - $3.0, up 20% Adjusted EBITDA per Employee - $1.8, up 19% Adjusted EBITDA Margin 61.7 % 59.8 % Growth Revenue Growth 32.8 % 33.0 % Net Income Growth(1)(2) 35.9 % (13.8) % Adjusted Net Income Growth 55.3 % 32.8 % Adjusted EBITDA Growth 36.5 % 31.8 % Execution Written Premium $126.9, up 31.1% $415.0, up 32.2% Premium in Force (period end) - $419.0, up 31.8% Policies in Force (period end, thousands) - 316.1, up 29.0% Rule of 40(3) - 93 (1) Q2 2026 results include $7.0 million of pre-tax Stock Based Compensation expense. (2) Last twelve months results include $25.1 million of pre-tax non-cash Stock Based Compensation expense and $5.5 million of pre-tax corporate transaction costs. (3) Rule of 40 is calculated as the sum of year-over-year revenue growth and Adjusted EBITDA margin for the applicable period. Adjusted EBITDA margin is defined as Adjusted EBITDA divided by total revenue. Adjusted EBITDA is a non-GAAP financial measure. See reconciliation to the most directly comparable GAAP measure elsewhere in this presentation. Lifetime Written Loss Ratio 19.5% as of 6/30/2026
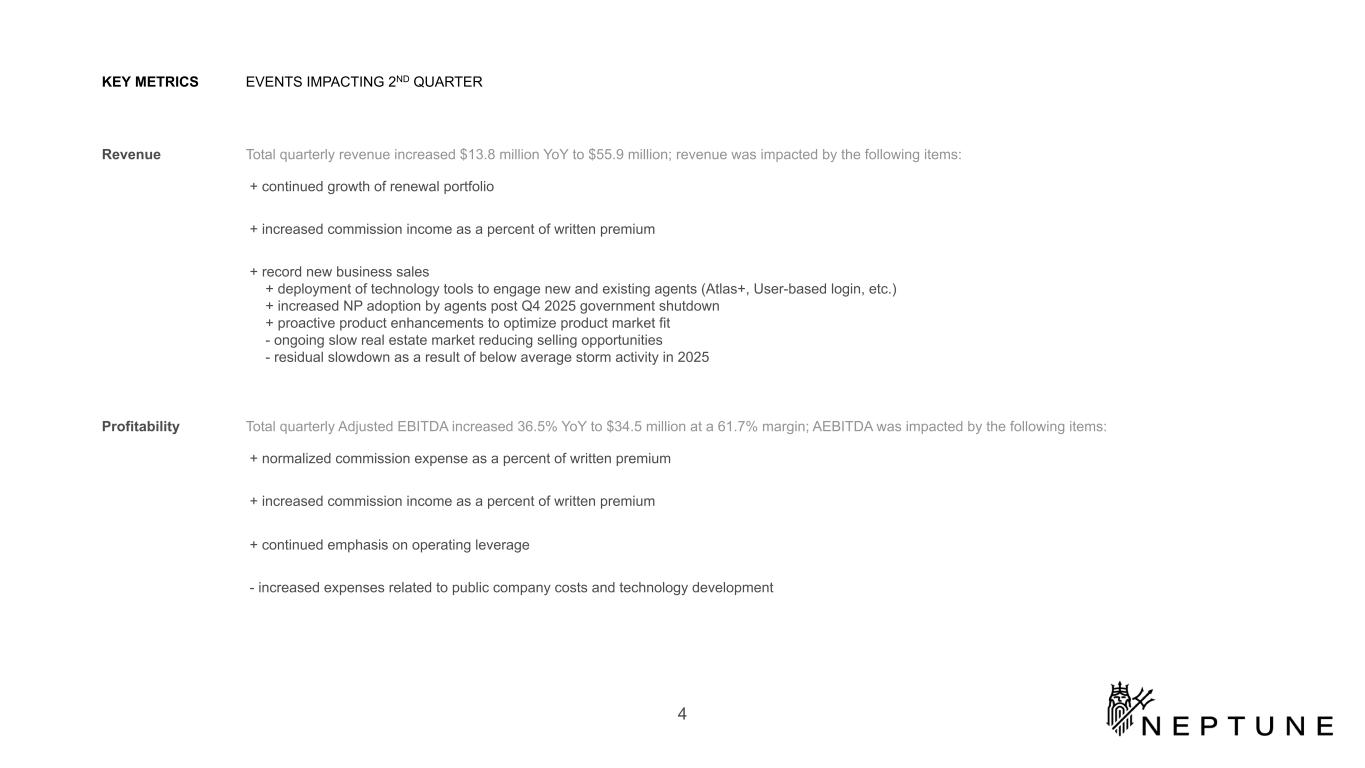
KEY METRICS EVENTS IMPACTING 2ND QUARTER Revenue Total quarterly revenue increased $13.8 million YoY to $55.9 million; revenue was impacted by the following items: + continued growth of renewal portfolio + increased commission income as a percent of written premium + record new business sales + deployment of technology tools to engage new and existing agents (Atlas+, User-based login, etc.) + increased NP adoption by agents post Q4 2025 government shutdown + proactive product enhancements to optimize product market fit - ongoing slow real estate market reducing selling opportunities - residual slowdown as a result of below average storm activity in 2025 Profitability Total quarterly Adjusted EBITDA increased 36.5% YoY to $34.5 million at a 61.7% margin; AEBITDA was impacted by the following items: + normalized commission expense as a percent of written premium + increased commission income as a percent of written premium + continued emphasis on operating leverage - increased expenses related to public company costs and technology development 4
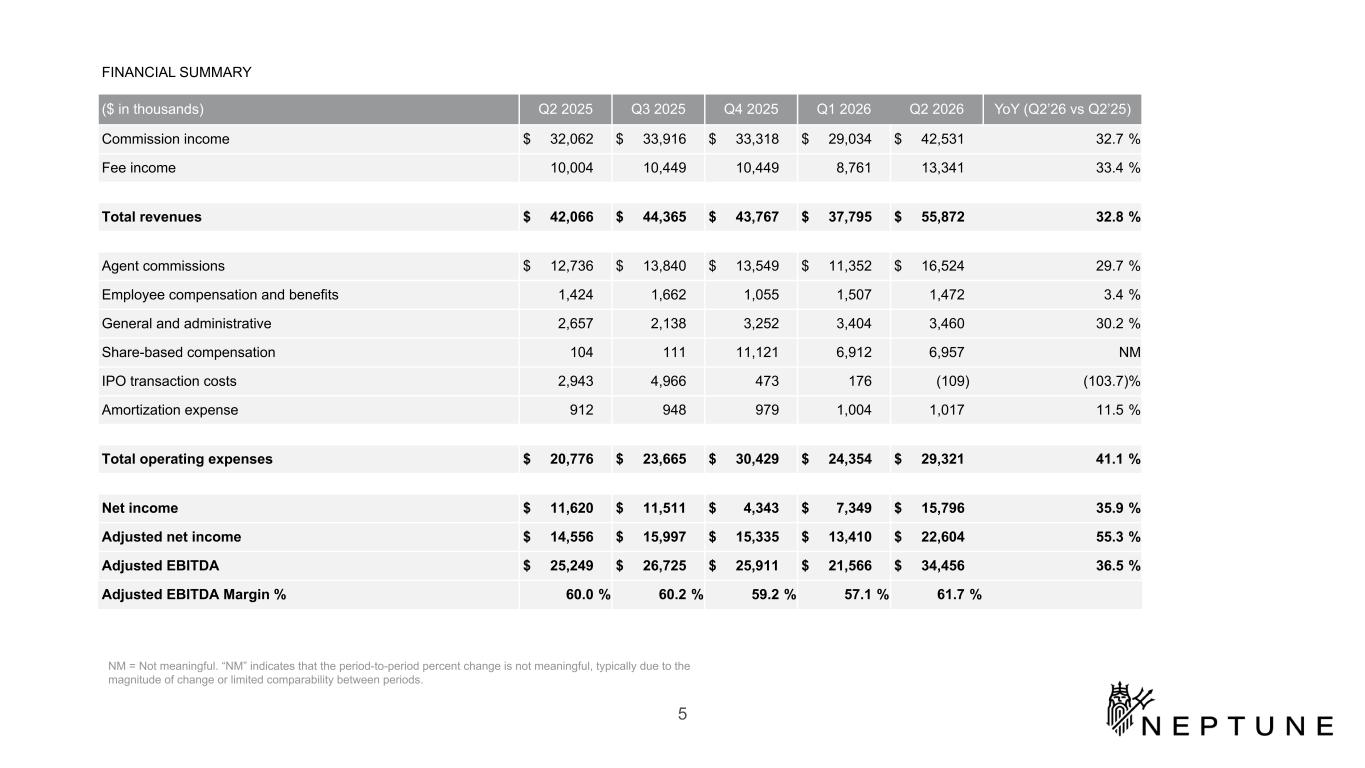
FINANCIAL SUMMARY ($ in thousands) Q2 2025 Q3 2025 Q4 2025 Q1 2026 Q2 2026 YoY (Q2’26 vs Q2’25) Commission income $ 32,062 $ 33,916 $ 33,318 $ 29,034 $ 42,531 32.7 % Fee income 10,004 10,449 10,449 8,761 13,341 33.4 % Total revenues $ 42,066 $ 44,365 $ 43,767 $ 37,795 $ 55,872 32.8 % Agent commissions $ 12,736 $ 13,840 $ 13,549 $ 11,352 $ 16,524 29.7 % Employee compensation and benefits 1,424 1,662 1,055 1,507 1,472 3.4 % General and administrative 2,657 2,138 3,252 3,404 3,460 30.2 % Share-based compensation 104 111 11,121 6,912 6,957 NM IPO transaction costs 2,943 4,966 473 176 (109) (103.7) % Amortization expense 912 948 979 1,004 1,017 11.5 % Total operating expenses $ 20,776 $ 23,665 $ 30,429 $ 24,354 $ 29,321 41.1 % Net income $ 11,620 $ 11,511 $ 4,343 $ 7,349 $ 15,796 35.9 % Adjusted net income $ 14,556 $ 15,997 $ 15,335 $ 13,410 $ 22,604 55.3 % Adjusted EBITDA $ 25,249 $ 26,725 $ 25,911 $ 21,566 $ 34,456 36.5 % Adjusted EBITDA Margin % 60.0 % 60.2 % 59.2 % 57.1 % 61.7 % 5 NM = Not meaningful. “NM” indicates that the period-to-period percent change is not meaningful, typically due to the magnitude of change or limited comparability between periods.
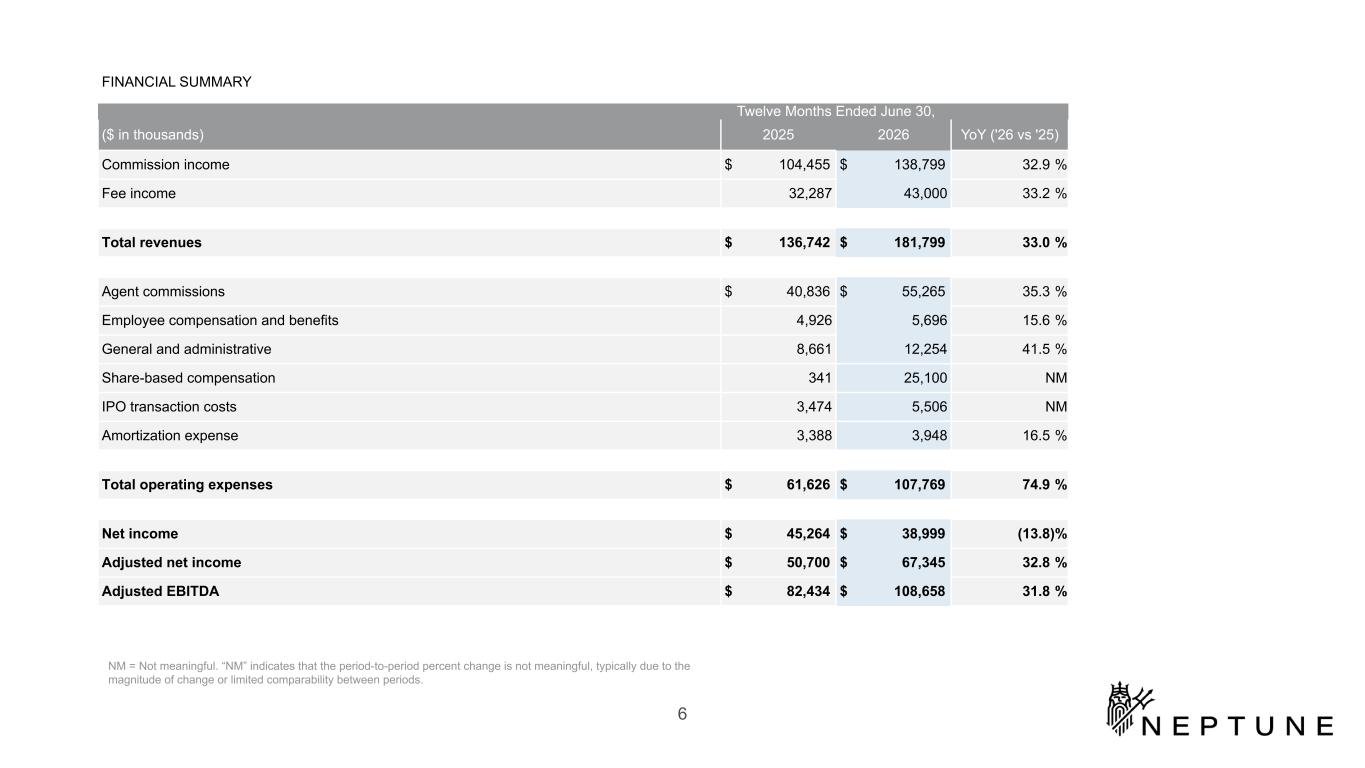
FINANCIAL SUMMARY Twelve Months Ended June 30, ($ in thousands) 2025 2026 YoY ('26 vs '25) Commission income $ 104,455 $ 138,799 32.9 % Fee income 32,287 43,000 33.2 % Total revenues $ 136,742 $ 181,799 33.0 % Agent commissions $ 40,836 $ 55,265 35.3 % Employee compensation and benefits 4,926 5,696 15.6 % General and administrative 8,661 12,254 41.5 % Share-based compensation 341 25,100 NM IPO transaction costs 3,474 5,506 NM Amortization expense 3,388 3,948 16.5 % Total operating expenses $ 61,626 $ 107,769 74.9 % Net income $ 45,264 $ 38,999 (13.8) % Adjusted net income $ 50,700 $ 67,345 32.8 % Adjusted EBITDA $ 82,434 $ 108,658 31.8 % 6 NM = Not meaningful. “NM” indicates that the period-to-period percent change is not meaningful, typically due to the magnitude of change or limited comparability between periods.
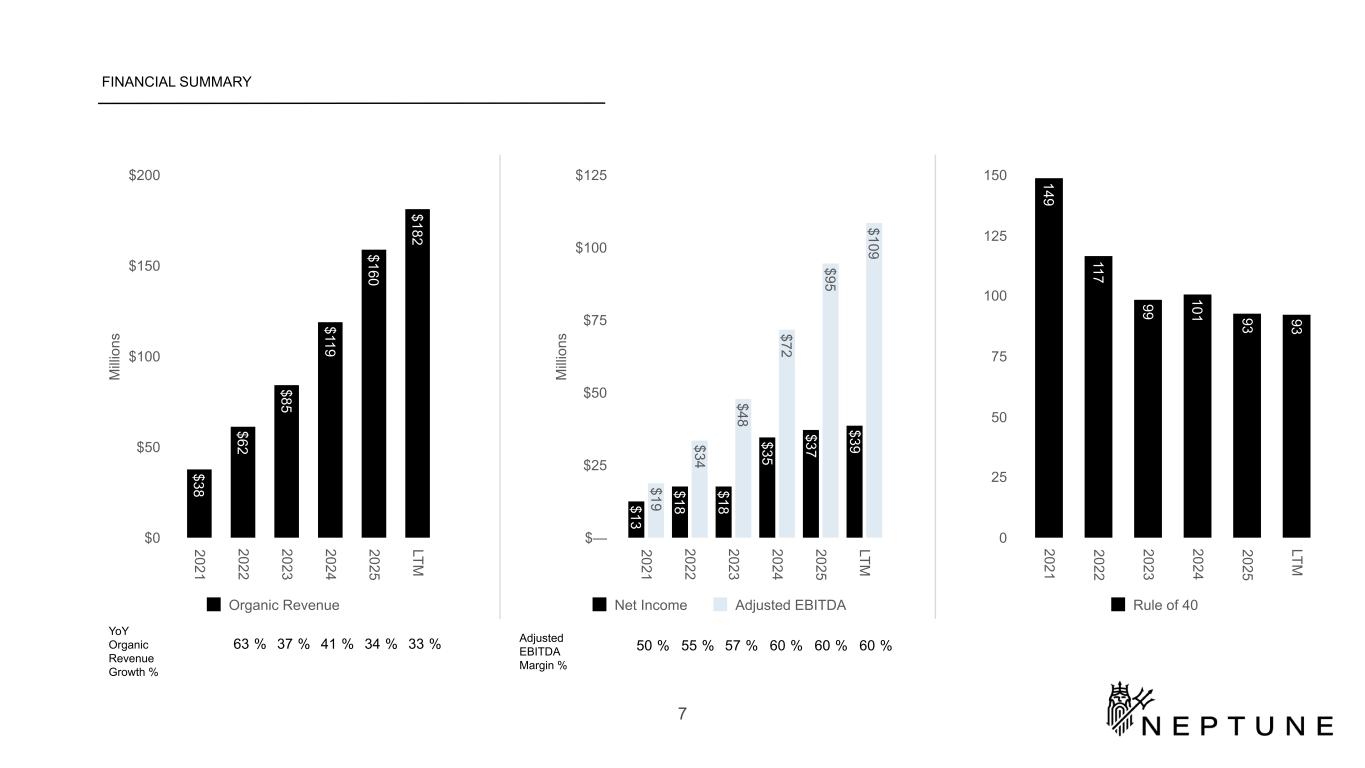
FINANCIAL SUMMARY M illi on s $13 $18 $18 $35 $37 $39 $19 $34 $48 $72 $95 $109 Net Income Adjusted EBITDA 2021 2022 2023 2024 2025 LTM $— $25 $50 $75 $100 $125 149 117 99 101 93 93 Rule of 40 2021 2022 2023 2024 2025 LTM 0 25 50 75 100 125 150 50 % 55 % 57 % 60 % 60 % 60 %Adjusted EBITDA Margin % YoY Organic Revenue Growth % 7 63 % 37 % 41 % 34 % 33 % M illi on s $38 $62 $85 $119 $160 $182 Organic Revenue 2021 2022 2023 2024 2025 LTM $0 $50 $100 $150 $200
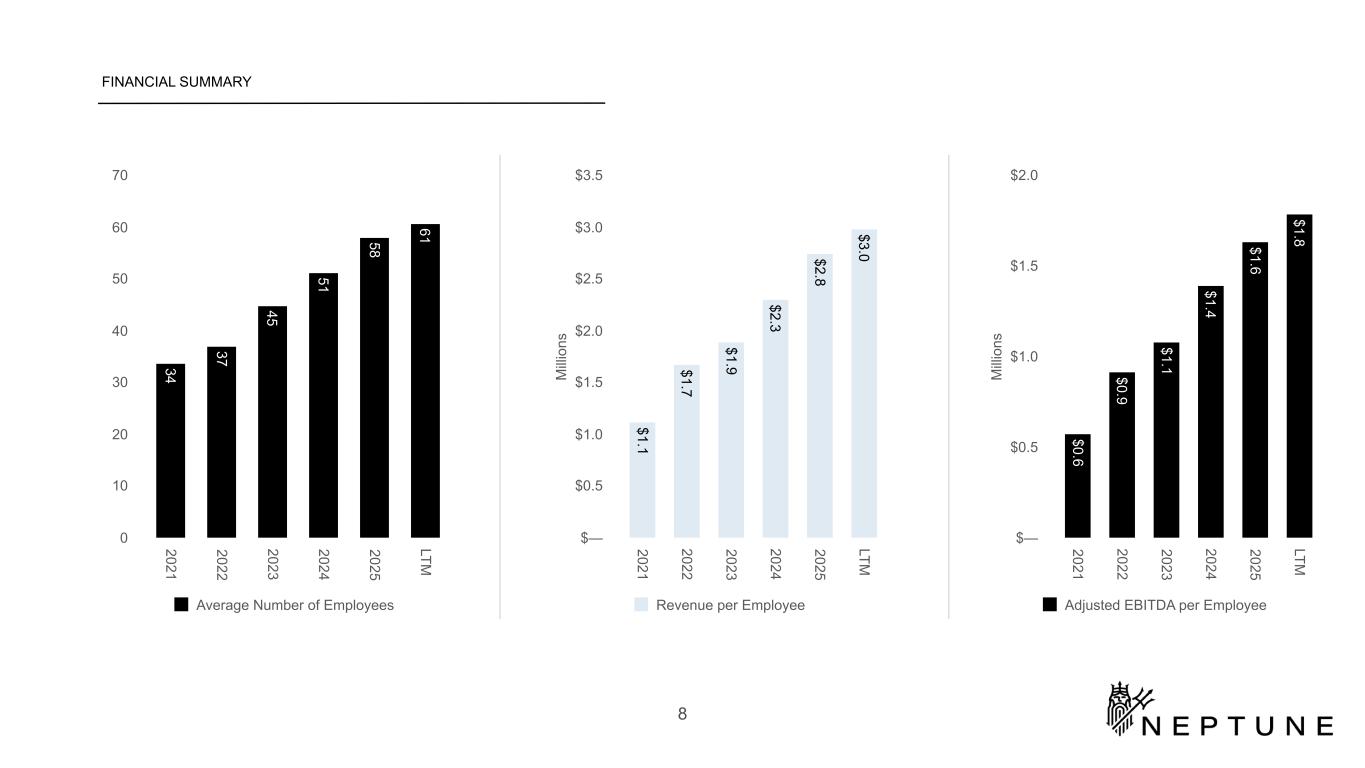
FINANCIAL SUMMARY 34 37 45 51 58 61 Average Number of Employees 2021 2022 2023 2024 2025 LTM 0 10 20 30 40 50 60 70 M illi on s $1.1 $1.7 $1.9 $2.3 $2.8 $3.0 Revenue per Employee 2021 2022 2023 2024 2025 LTM $— $0.5 $1.0 $1.5 $2.0 $2.5 $3.0 $3.5 M illi on s $0.6 $0.9 $1.1 $1.4 $1.6 $1.8 Adjusted EBITDA per Employee 2021 2022 2023 2024 2025 LTM $— $0.5 $1.0 $1.5 $2.0 8
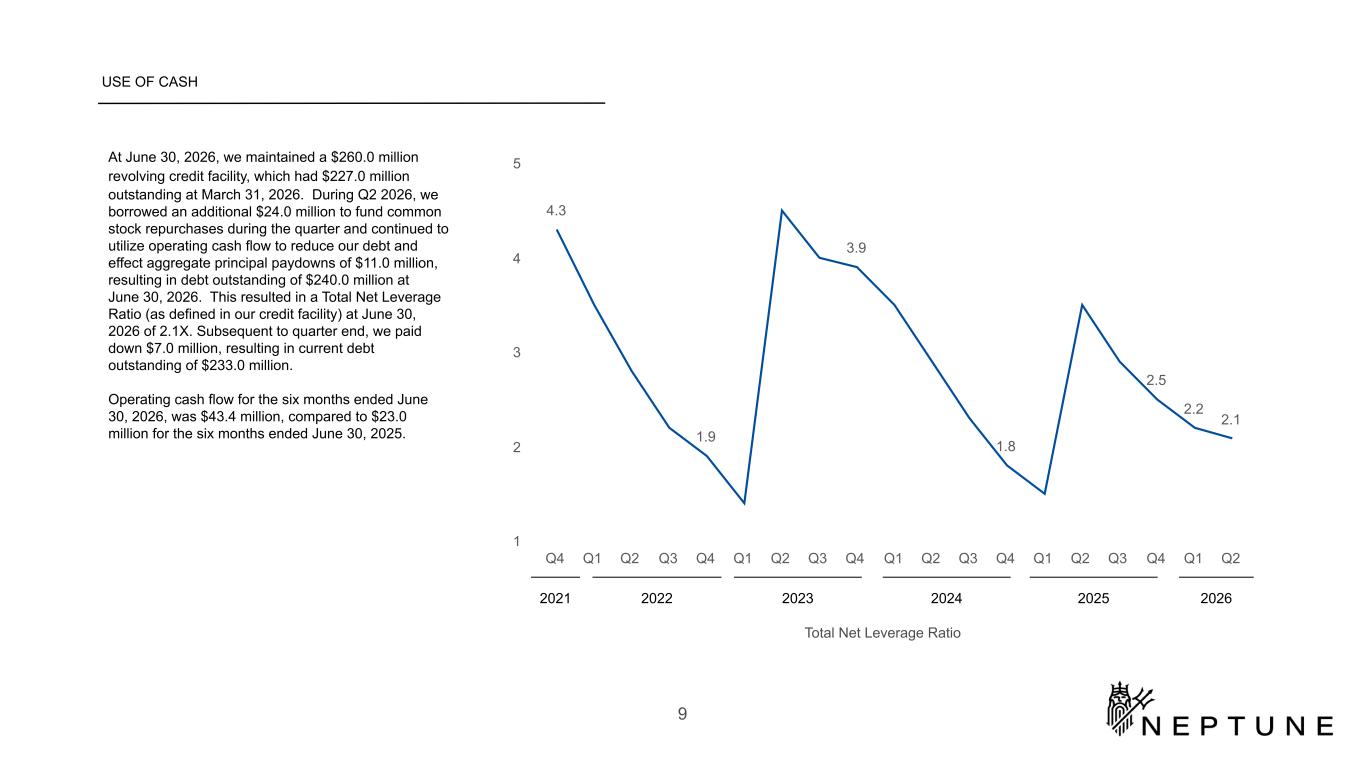
USE OF CASH At June 30, 2026, we maintained a $260.0 million revolving credit facility, which had $227.0 million outstanding at March 31, 2026. During Q2 2026, we borrowed an additional $24.0 million to fund common stock repurchases during the quarter and continued to utilize operating cash flow to reduce our debt and effect aggregate principal paydowns of $11.0 million, resulting in debt outstanding of $240.0 million at June 30, 2026. This resulted in a Total Net Leverage Ratio (as defined in our credit facility) at June 30, 2026 of 2.1X. Subsequent to quarter end, we paid down $7.0 million, resulting in current debt outstanding of $233.0 million. Operating cash flow for the six months ended June 30, 2026, was $43.4 million, compared to $23.0 million for the six months ended June 30, 2025. 4.3 1.9 3.9 1.8 2.5 2.2 2.1 Q4 Q1 Q2 Q3 Q4 Q1 Q2 Q3 Q4 Q1 Q2 Q3 Q4 Q1 Q2 Q3 Q4 Q1 Q2 1 2 3 4 5 2021 2022 2023 2024 2025 Total Net Leverage Ratio 9 2026

Operations
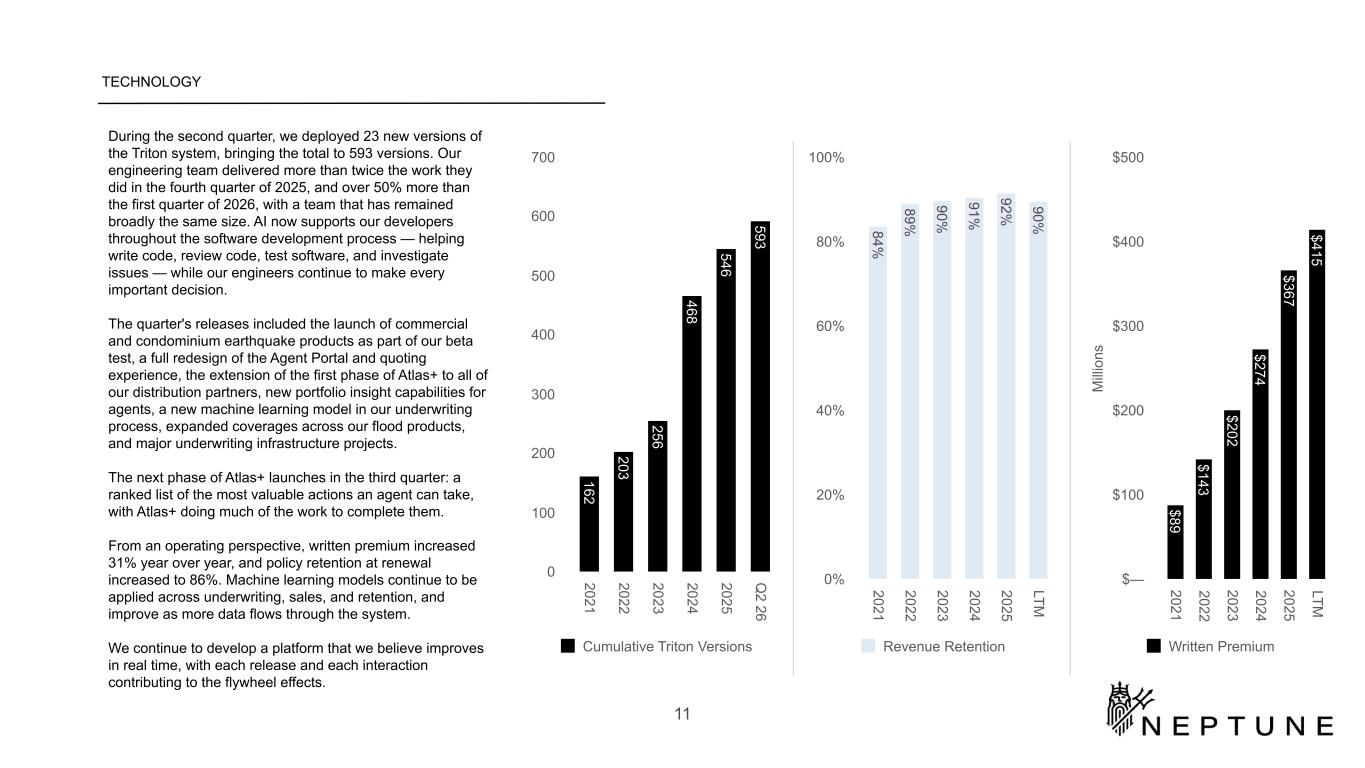
TECHNOLOGY During the second quarter, we deployed 23 new versions of the Triton system, bringing the total to 593 versions. Our engineering team delivered more than twice the work they did in the fourth quarter of 2025, and over 50% more than the first quarter of 2026, with a team that has remained broadly the same size. AI now supports our developers throughout the software development process — helping write code, review code, test software, and investigate issues — while our engineers continue to make every important decision. The quarter's releases included the launch of commercial and condominium earthquake products as part of our beta test, a full redesign of the Agent Portal and quoting experience, the extension of the first phase of Atlas+ to all of our distribution partners, new portfolio insight capabilities for agents, a new machine learning model in our underwriting process, expanded coverages across our flood products, and major underwriting infrastructure projects. The next phase of Atlas+ launches in the third quarter: a ranked list of the most valuable actions an agent can take, with Atlas+ doing much of the work to complete them. From an operating perspective, written premium increased 31% year over year, and policy retention at renewal increased to 86%. Machine learning models continue to be applied across underwriting, sales, and retention, and improve as more data flows through the system. We continue to develop a platform that we believe improves in real time, with each release and each interaction contributing to the flywheel effects. 162 203 256 468 546 593 Cumulative Triton Versions 2021 2022 2023 2024 2025 Q 2 26 0 100 200 300 400 500 600 700 84% 89% 90% 91% 92% 90% Revenue Retention 2021 2022 2023 2024 2025 LTM 0% 20% 40% 60% 80% 100% M ill io ns $89 $143 $202 $274 $367 $415 Written Premium 2021 2022 2023 2024 2025 LTM $— $100 $200 $300 $400 $500 11
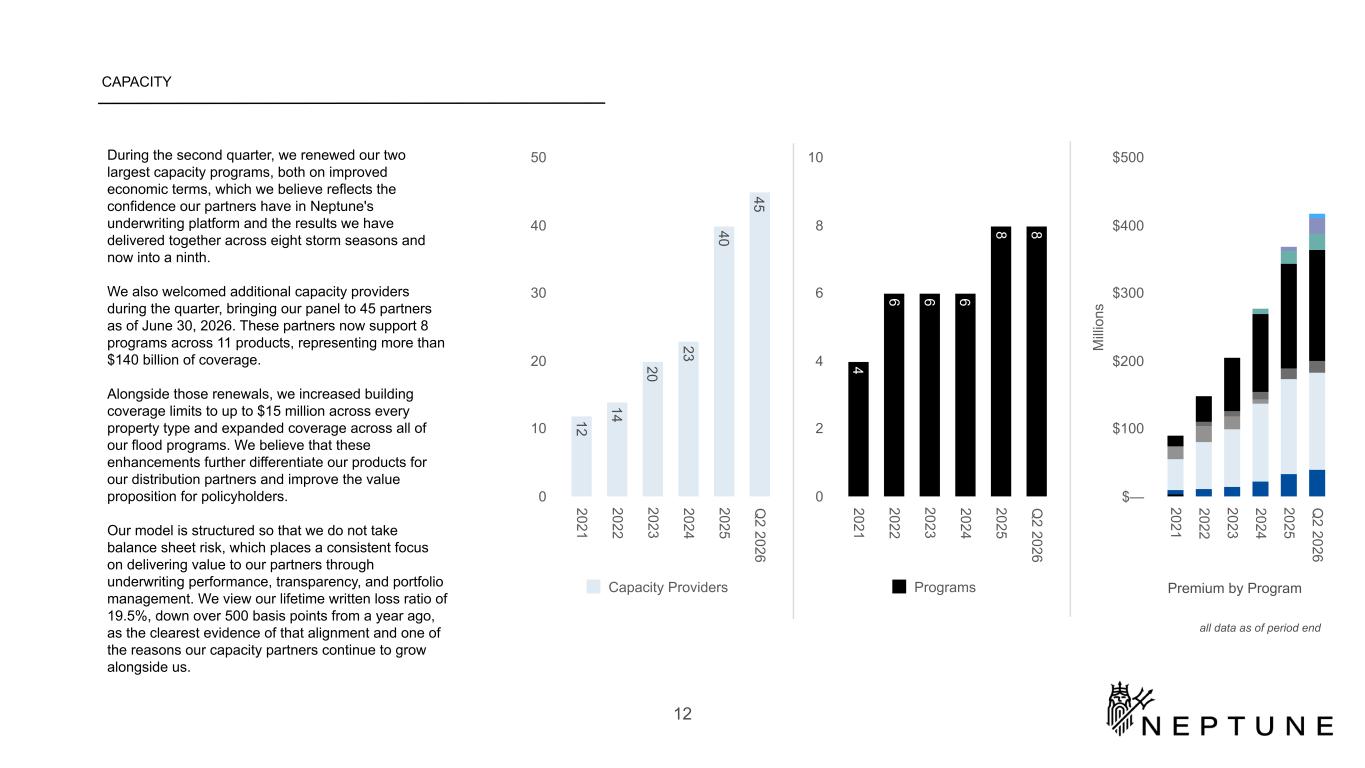
CAPACITY During the second quarter, we renewed our two largest capacity programs, both on improved economic terms, which we believe reflects the confidence our partners have in Neptune's underwriting platform and the results we have delivered together across eight storm seasons and now into a ninth. We also welcomed additional capacity providers during the quarter, bringing our panel to 45 partners as of June 30, 2026. These partners now support 8 programs across 11 products, representing more than $140 billion of coverage. Alongside those renewals, we increased building coverage limits to up to $15 million across every property type and expanded coverage across all of our flood programs. We believe that these enhancements further differentiate our products for our distribution partners and improve the value proposition for policyholders. Our model is structured so that we do not take balance sheet risk, which places a consistent focus on delivering value to our partners through underwriting performance, transparency, and portfolio management. We view our lifetime written loss ratio of 19.5%, down over 500 basis points from a year ago, as the clearest evidence of that alignment and one of the reasons our capacity partners continue to grow alongside us. Premium by Program 12 14 20 23 40 45 Capacity Providers 2021 2022 2023 2024 2025 Q 2 2026 0 10 20 30 40 50 4 6 6 6 8 8 Programs 2021 2022 2023 2024 2025 Q 2 2026 0 2 4 6 8 10 M illi on s $4 $— $—2021 2022 2023 2024 2025 Q 2 2026 $— $100 $200 $300 $400 $500 12 all data as of period end
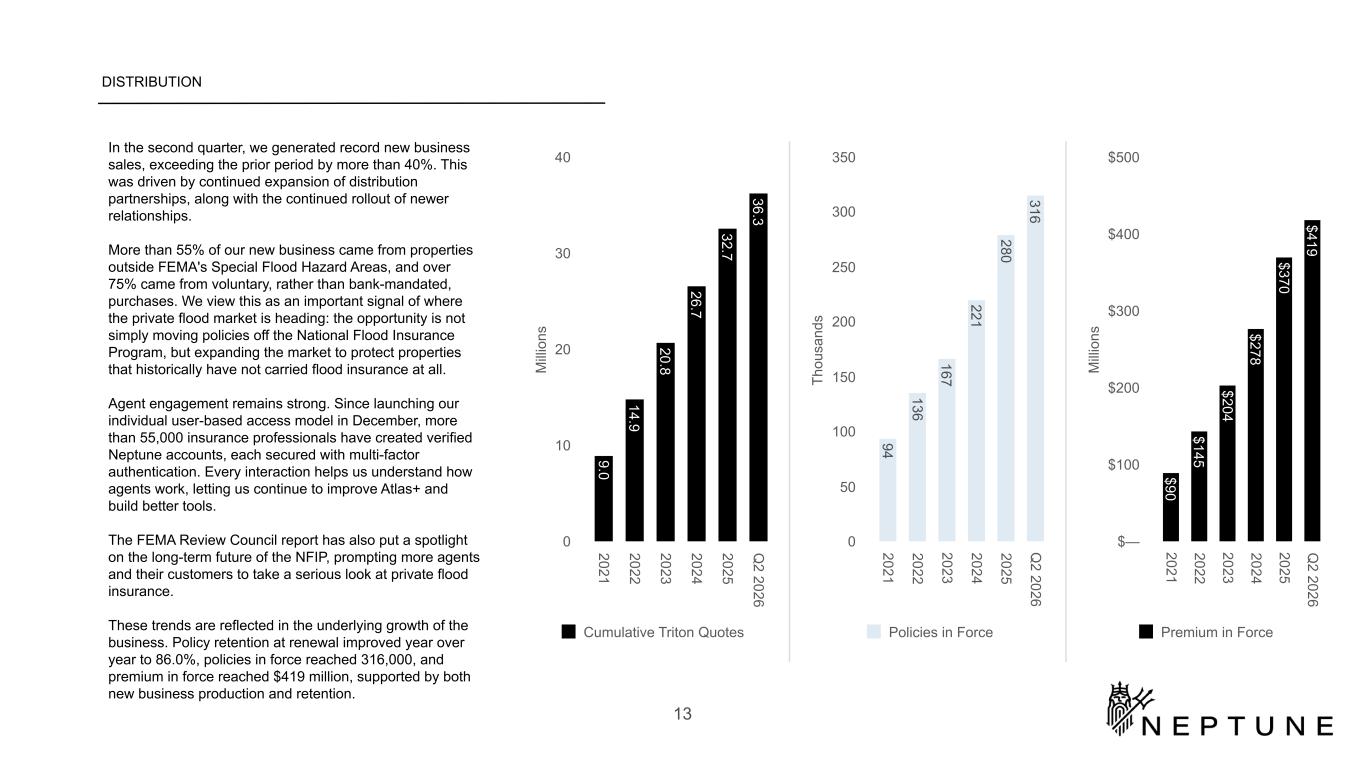
DISTRIBUTION In the second quarter, we generated record new business sales, exceeding the prior period by more than 40%. This was driven by continued expansion of distribution partnerships, along with the continued rollout of newer relationships. More than 55% of our new business came from properties outside FEMA's Special Flood Hazard Areas, and over 75% came from voluntary, rather than bank-mandated, purchases. We view this as an important signal of where the private flood market is heading: the opportunity is not simply moving policies off the National Flood Insurance Program, but expanding the market to protect properties that historically have not carried flood insurance at all. Agent engagement remains strong. Since launching our individual user-based access model in December, more than 55,000 insurance professionals have created verified Neptune accounts, each secured with multi-factor authentication. Every interaction helps us understand how agents work, letting us continue to improve Atlas+ and build better tools. The FEMA Review Council report has also put a spotlight on the long-term future of the NFIP, prompting more agents and their customers to take a serious look at private flood insurance. These trends are reflected in the underlying growth of the business. Policy retention at renewal improved year over year to 86.0%, policies in force reached 316,000, and premium in force reached $419 million, supported by both new business production and retention. M ill io ns $90 $145 $204 $278 $370 $419 Premium in Force 2021 2022 2023 2024 2025 Q 2 2026 $— $100 $200 $300 $400 $500 Th ou sa nd s 94 136 167 221 280 316 Policies in Force 2021 2022 2023 2024 2025 Q 2 2026 0 50 100 150 200 250 300 350 M ill io ns 9.0 14.9 20.8 26.7 32.7 36.3 Cumulative Triton Quotes 2021 2022 2023 2024 2025 Q 2 2026 0 10 20 30 40 13
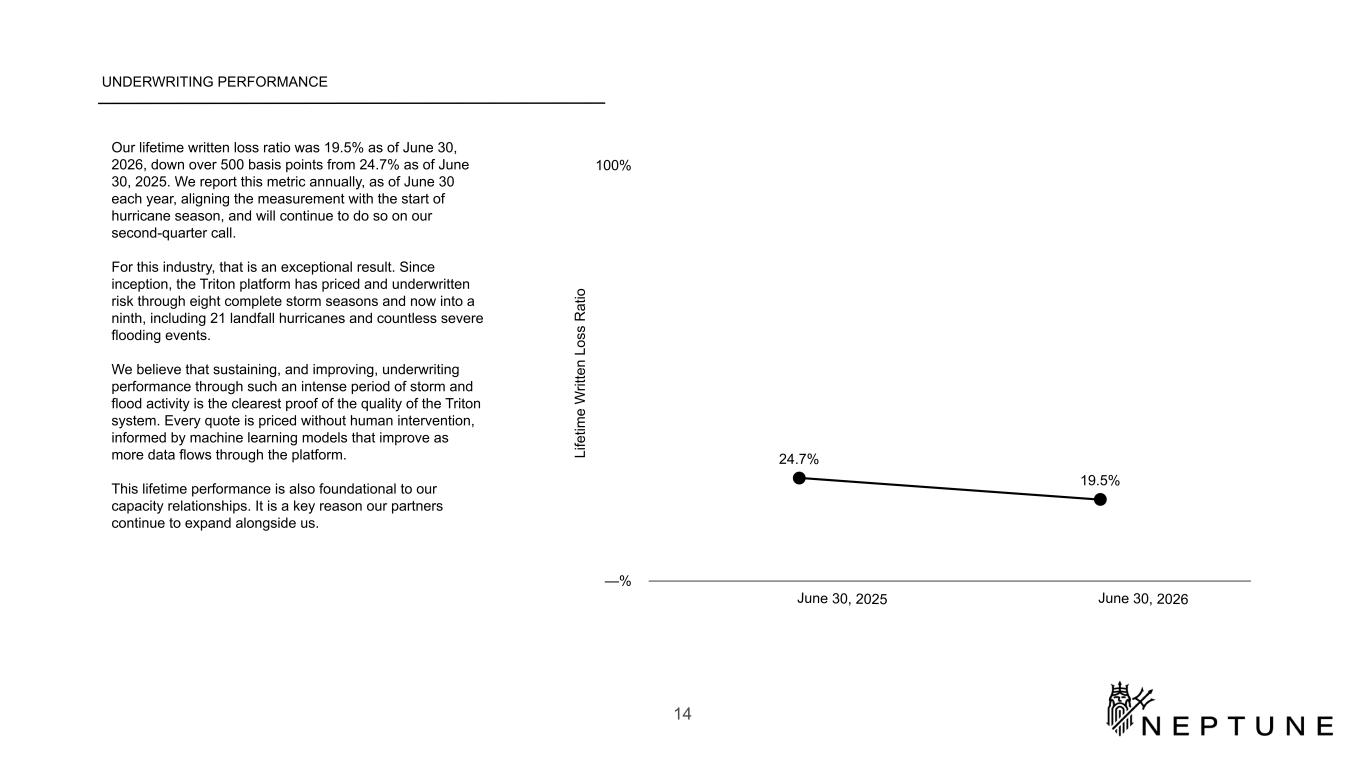
UNDERWRITING PERFORMANCE Our lifetime written loss ratio was 19.5% as of June 30, 2026, down over 500 basis points from 24.7% as of June 30, 2025. We report this metric annually, as of June 30 each year, aligning the measurement with the start of hurricane season, and will continue to do so on our second-quarter call. For this industry, that is an exceptional result. Since inception, the Triton platform has priced and underwritten risk through eight complete storm seasons and now into a ninth, including 21 landfall hurricanes and countless severe flooding events. We believe that sustaining, and improving, underwriting performance through such an intense period of storm and flood activity is the clearest proof of the quality of the Triton system. Every quote is priced without human intervention, informed by machine learning models that improve as more data flows through the platform. This lifetime performance is also foundational to our capacity relationships. It is a key reason our partners continue to expand alongside us. Li fe tim e W rit te n Lo ss R at io 24.7% 19.5% June 30, 2025 June 30, 2026 —% 100% 14
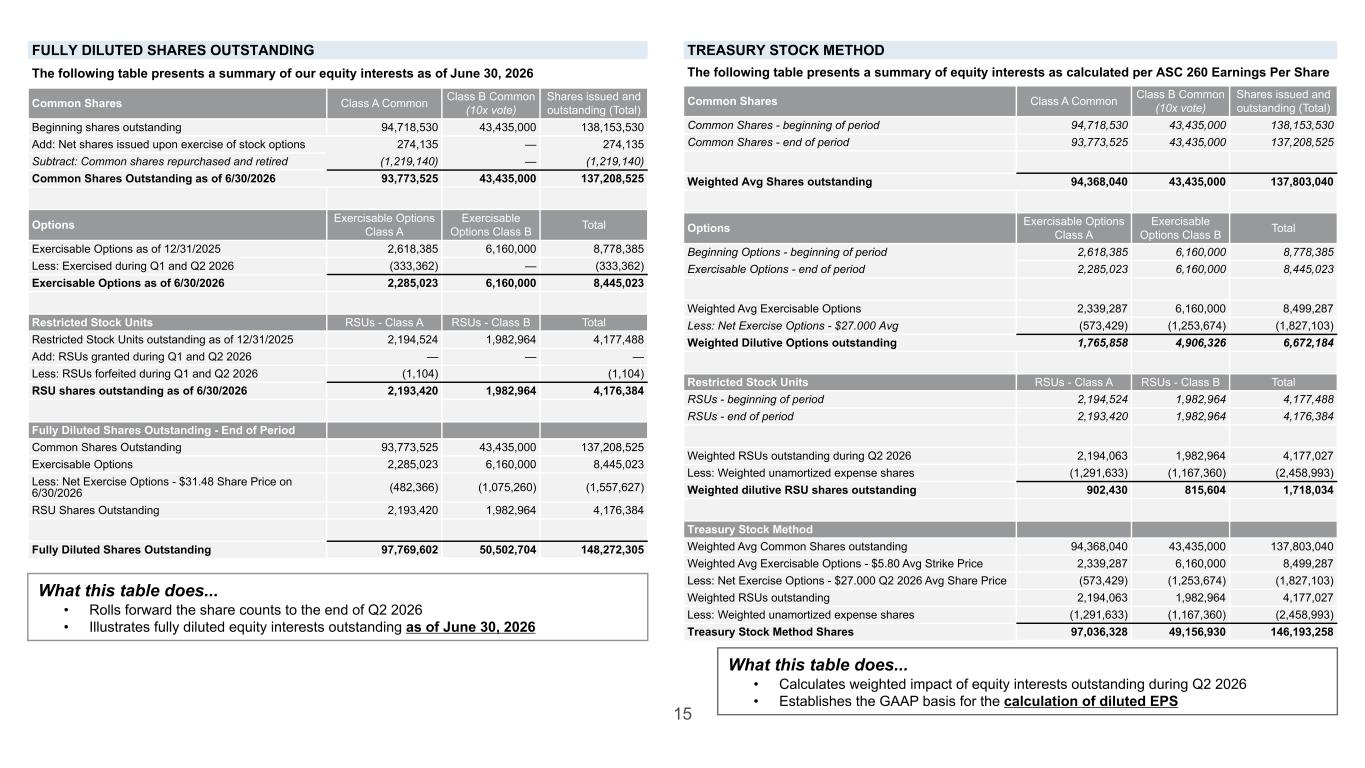
FULLY DILUTED SHARES OUTSTANDING The following table presents a summary of our equity interests as of June 30, 2026 Common Shares Class A Common Class B Common (10x vote) Shares issued and outstanding (Total) Beginning shares outstanding 94,718,530 43,435,000 138,153,530 Add: Net shares issued upon exercise of stock options 274,135 — 274,135 Subtract: Common shares repurchased and retired (1,219,140) — (1,219,140) Common Shares Outstanding as of 6/30/2026 93,773,525 43,435,000 137,208,525 Options Exercisable Options Class A Exercisable Options Class B Total Exercisable Options as of 12/31/2025 2,618,385 6,160,000 8,778,385 Less: Exercised during Q1 and Q2 2026 (333,362) — (333,362) Exercisable Options as of 6/30/2026 2,285,023 6,160,000 8,445,023 Restricted Stock Units RSUs - Class A RSUs - Class B Total Restricted Stock Units outstanding as of 12/31/2025 2,194,524 1,982,964 4,177,488 Add: RSUs granted during Q1 and Q2 2026 — — — Less: RSUs forfeited during Q1 and Q2 2026 (1,104) (1,104) RSU shares outstanding as of 6/30/2026 2,193,420 1,982,964 4,176,384 Fully Diluted Shares Outstanding - End of Period Common Shares Outstanding 93,773,525 43,435,000 137,208,525 Exercisable Options 2,285,023 6,160,000 8,445,023 Less: Net Exercise Options - $31.48 Share Price on 6/30/2026 (482,366) (1,075,260) (1,557,627) RSU Shares Outstanding 2,193,420 1,982,964 4,176,384 Fully Diluted Shares Outstanding 97,769,602 50,502,704 148,272,305 15 What this table does... • Rolls forward the share counts to the end of Q2 2026 • Illustrates fully diluted equity interests outstanding as of June 30, 2026 What this table does... • Calculates weighted impact of equity interests outstanding during Q2 2026 • Establishes the GAAP basis for the calculation of diluted EPS TREASURY STOCK METHOD The following table presents a summary of equity interests as calculated per ASC 260 Earnings Per Share Common Shares Class A Common Class B Common (10x vote) Shares issued and outstanding (Total) Common Shares - beginning of period 94,718,530 43,435,000 138,153,530 Common Shares - end of period 93,773,525 43,435,000 137,208,525 Weighted Avg Shares outstanding 94,368,040 43,435,000 137,803,040 Options Exercisable Options Class A Exercisable Options Class B Total Beginning Options - beginning of period 2,618,385 6,160,000 8,778,385 Exercisable Options - end of period 2,285,023 6,160,000 8,445,023 Weighted Avg Exercisable Options 2,339,287 6,160,000 8,499,287 Less: Net Exercise Options - $27.000 Avg (573,429) (1,253,674) (1,827,103) Weighted Dilutive Options outstanding 1,765,858 4,906,326 6,672,184 Restricted Stock Units RSUs - Class A RSUs - Class B Total RSUs - beginning of period 2,194,524 1,982,964 4,177,488 RSUs - end of period 2,193,420 1,982,964 4,176,384 Weighted RSUs outstanding during Q2 2026 2,194,063 1,982,964 4,177,027 Less: Weighted unamortized expense shares (1,291,633) (1,167,360) (2,458,993) Weighted dilutive RSU shares outstanding 902,430 815,604 1,718,034 Treasury Stock Method Weighted Avg Common Shares outstanding 94,368,040 43,435,000 137,803,040 Weighted Avg Exercisable Options - $5.80 Avg Strike Price 2,339,287 6,160,000 8,499,287 Less: Net Exercise Options - $27.000 Q2 2026 Avg Share Price (573,429) (1,253,674) (1,827,103) Weighted RSUs outstanding 2,194,063 1,982,964 4,177,027 Less: Weighted unamortized expense shares (1,291,633) (1,167,360) (2,458,993) Treasury Stock Method Shares 97,036,328 49,156,930 146,193,258

Financial Statements
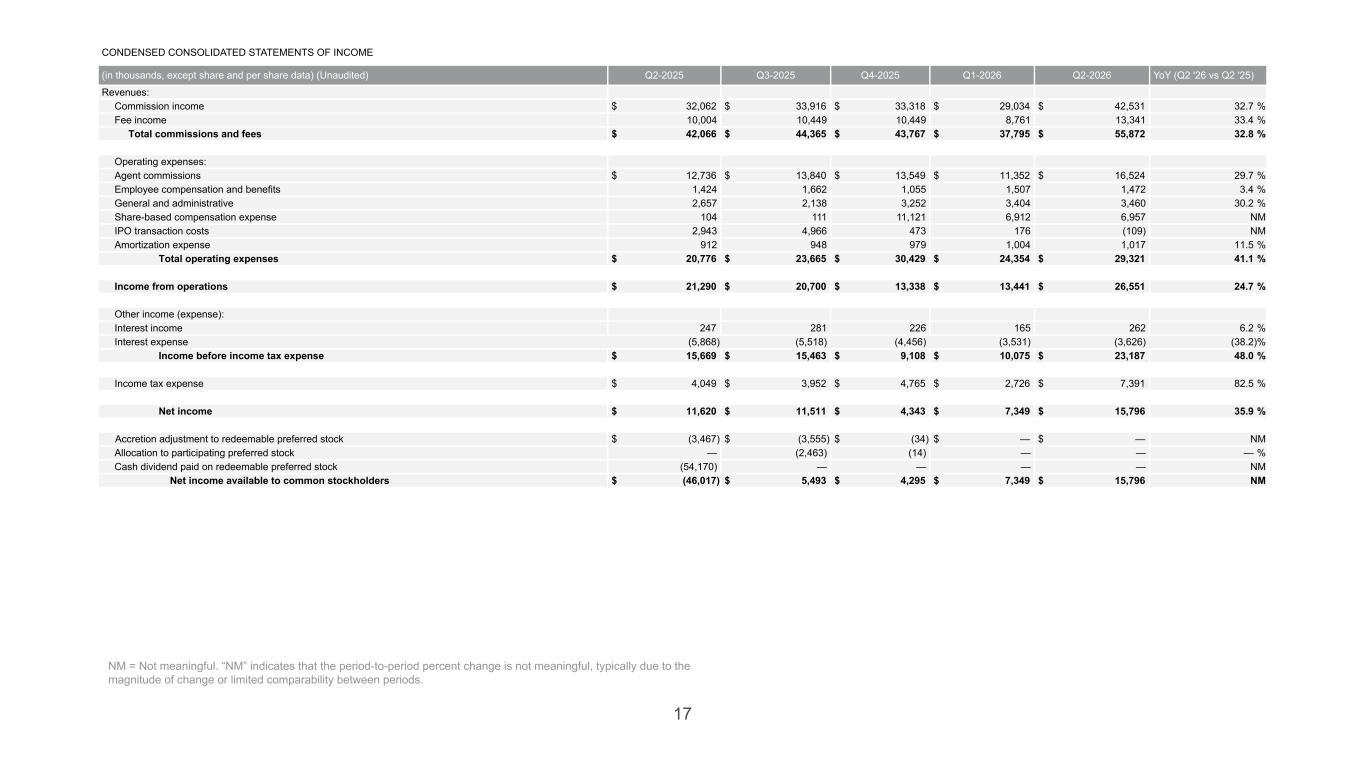
CONDENSED CONSOLIDATED STATEMENTS OF INCOME (in thousands, except share and per share data) (Unaudited) Q2-2025 Q3-2025 Q4-2025 Q1-2026 Q2-2026 YoY (Q2 '26 vs Q2 '25) Revenues: Commission income $ 32,062 $ 33,916 $ 33,318 $ 29,034 $ 42,531 32.7 % Fee income 10,004 10,449 10,449 8,761 13,341 33.4 % Total commissions and fees $ 42,066 $ 44,365 $ 43,767 $ 37,795 $ 55,872 32.8 % Operating expenses: Agent commissions $ 12,736 $ 13,840 $ 13,549 $ 11,352 $ 16,524 29.7 % Employee compensation and benefits 1,424 1,662 1,055 1,507 1,472 3.4 % General and administrative 2,657 2,138 3,252 3,404 3,460 30.2 % Share-based compensation expense 104 111 11,121 6,912 6,957 NM IPO transaction costs 2,943 4,966 473 176 (109) NM Amortization expense 912 948 979 1,004 1,017 11.5 % Total operating expenses $ 20,776 $ 23,665 $ 30,429 $ 24,354 $ 29,321 41.1 % Income from operations $ 21,290 $ 20,700 $ 13,338 $ 13,441 $ 26,551 24.7 % Other income (expense): Interest income 247 281 226 165 262 6.2 % Interest expense (5,868) (5,518) (4,456) (3,531) (3,626) (38.2) % Income before income tax expense $ 15,669 $ 15,463 $ 9,108 $ 10,075 $ 23,187 48.0 % Income tax expense $ 4,049 $ 3,952 $ 4,765 $ 2,726 $ 7,391 82.5 % Net income $ 11,620 $ 11,511 $ 4,343 $ 7,349 $ 15,796 35.9 % Accretion adjustment to redeemable preferred stock $ (3,467) $ (3,555) $ (34) $ — $ — NM Allocation to participating preferred stock — (2,463) (14) — — — % Cash dividend paid on redeemable preferred stock (54,170) — — — — NM Net income available to common stockholders $ (46,017) $ 5,493 $ 4,295 $ 7,349 $ 15,796 NM 17 NM = Not meaningful. “NM” indicates that the period-to-period percent change is not meaningful, typically due to the magnitude of change or limited comparability between periods.
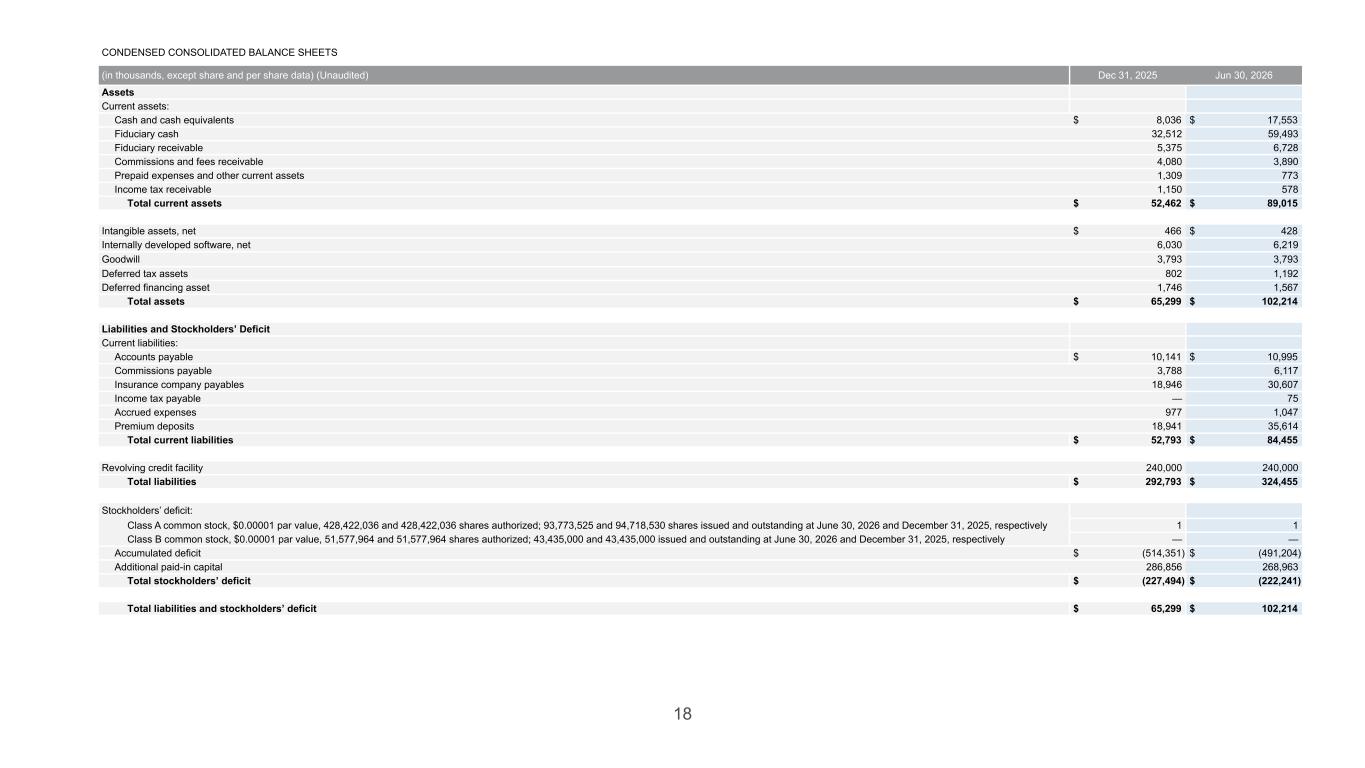
CONDENSED CONSOLIDATED BALANCE SHEETS (in thousands, except share and per share data) (Unaudited) Dec 31, 2025 Jun 30, 2026 Assets Current assets: Cash and cash equivalents $ 8,036 $ 17,553 Fiduciary cash 32,512 59,493 Fiduciary receivable 5,375 6,728 Commissions and fees receivable 4,080 3,890 Prepaid expenses and other current assets 1,309 773 Income tax receivable 1,150 578 Total current assets $ 52,462 $ 89,015 Intangible assets, net $ 466 $ 428 Internally developed software, net 6,030 6,219 Goodwill 3,793 3,793 Deferred tax assets 802 1,192 Deferred financing asset 1,746 1,567 Total assets $ 65,299 $ 102,214 Liabilities and Stockholders’ Deficit Current liabilities: Accounts payable $ 10,141 $ 10,995 Commissions payable 3,788 6,117 Insurance company payables 18,946 30,607 Income tax payable — 75 Accrued expenses 977 1,047 Premium deposits 18,941 35,614 Total current liabilities $ 52,793 $ 84,455 Revolving credit facility 240,000 240,000 Total liabilities $ 292,793 $ 324,455 Stockholders’ deficit: Class A common stock, $0.00001 par value, 428,422,036 and 428,422,036 shares authorized; 93,773,525 and 94,718,530 shares issued and outstanding at June 30, 2026 and December 31, 2025, respectively 1 1 Class B common stock, $0.00001 par value, 51,577,964 and 51,577,964 shares authorized; 43,435,000 and 43,435,000 issued and outstanding at June 30, 2026 and December 31, 2025, respectively — — Accumulated deficit $ (514,351) $ (491,204) Additional paid-in capital 286,856 268,963 Total stockholders’ deficit $ (227,494) $ (222,241) Total liabilities and stockholders’ deficit $ 65,299 $ 102,214 18
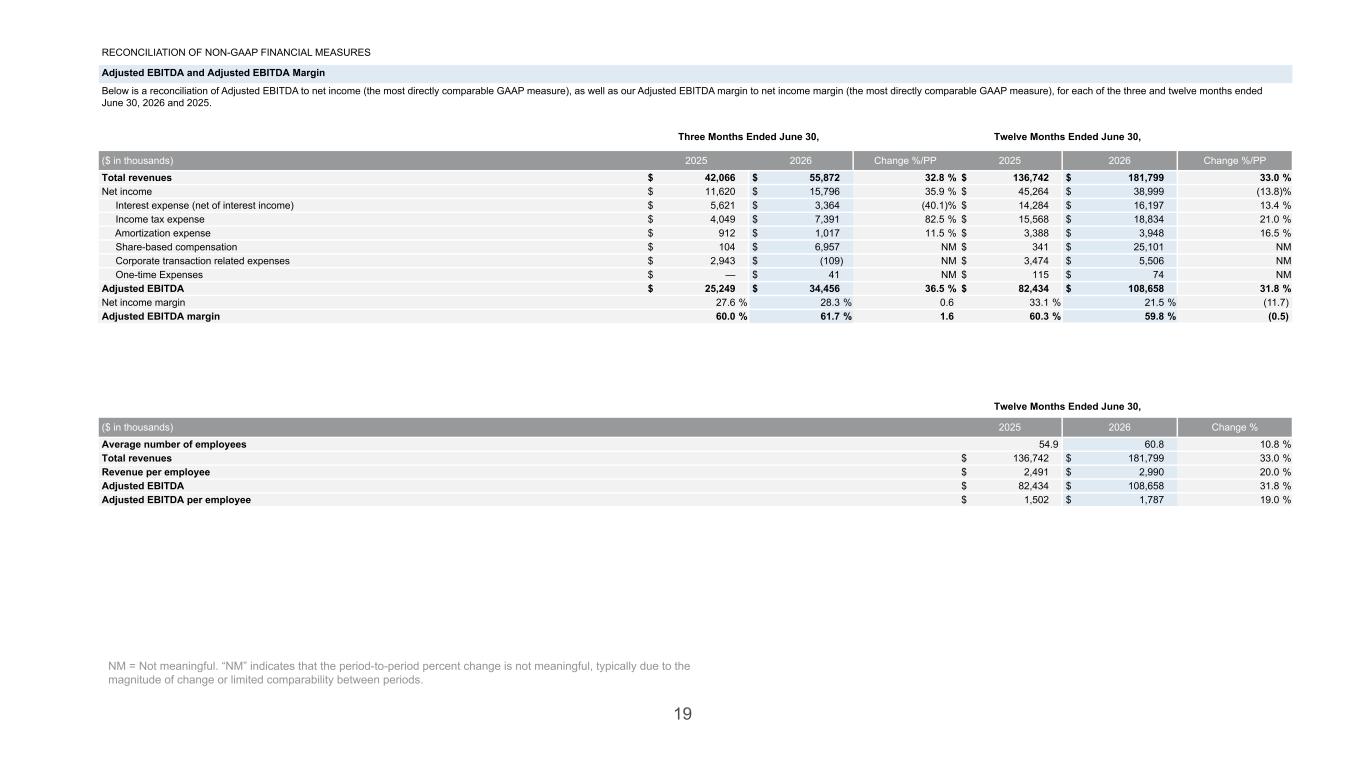
RECONCILIATION OF NON-GAAP FINANCIAL MEASURES Adjusted EBITDA and Adjusted EBITDA Margin Below is a reconciliation of Adjusted EBITDA to net income (the most directly comparable GAAP measure), as well as our Adjusted EBITDA margin to net income margin (the most directly comparable GAAP measure), for each of the three and twelve months ended June 30, 2026 and 2025. Three Months Ended June 30, Twelve Months Ended June 30, ($ in thousands) 2025 2026 Change %/PP 2025 2026 Change %/PP Total revenues $ 42,066 $ 55,872 32.8 % $ 136,742 $ 181,799 33.0 % Net income $ 11,620 $ 15,796 35.9 % $ 45,264 $ 38,999 (13.8) % Interest expense (net of interest income) $ 5,621 $ 3,364 (40.1) % $ 14,284 $ 16,197 13.4 % Income tax expense $ 4,049 $ 7,391 82.5 % $ 15,568 $ 18,834 21.0 % Amortization expense $ 912 $ 1,017 11.5 % $ 3,388 $ 3,948 16.5 % Share-based compensation $ 104 $ 6,957 NM $ 341 $ 25,101 NM Corporate transaction related expenses $ 2,943 $ (109) NM $ 3,474 $ 5,506 NM One-time Expenses $ — $ 41 NM $ 115 $ 74 NM Adjusted EBITDA $ 25,249 $ 34,456 36.5 % $ 82,434 $ 108,658 31.8 % Net income margin 27.6 % 28.3 % 0.6 33.1 % 21.5 % (11.7) Adjusted EBITDA margin 60.0 % 61.7 % 1.6 60.3 % 59.8 % (0.5) Twelve Months Ended June 30, ($ in thousands) 2025 2026 Change % Average number of employees 54.9 60.8 10.8 % Total revenues $ 136,742 $ 181,799 33.0 % Revenue per employee $ 2,491 $ 2,990 20.0 % Adjusted EBITDA $ 82,434 $ 108,658 31.8 % Adjusted EBITDA per employee $ 1,502 $ 1,787 19.0 % 19 NM = Not meaningful. “NM” indicates that the period-to-period percent change is not meaningful, typically due to the magnitude of change or limited comparability between periods.
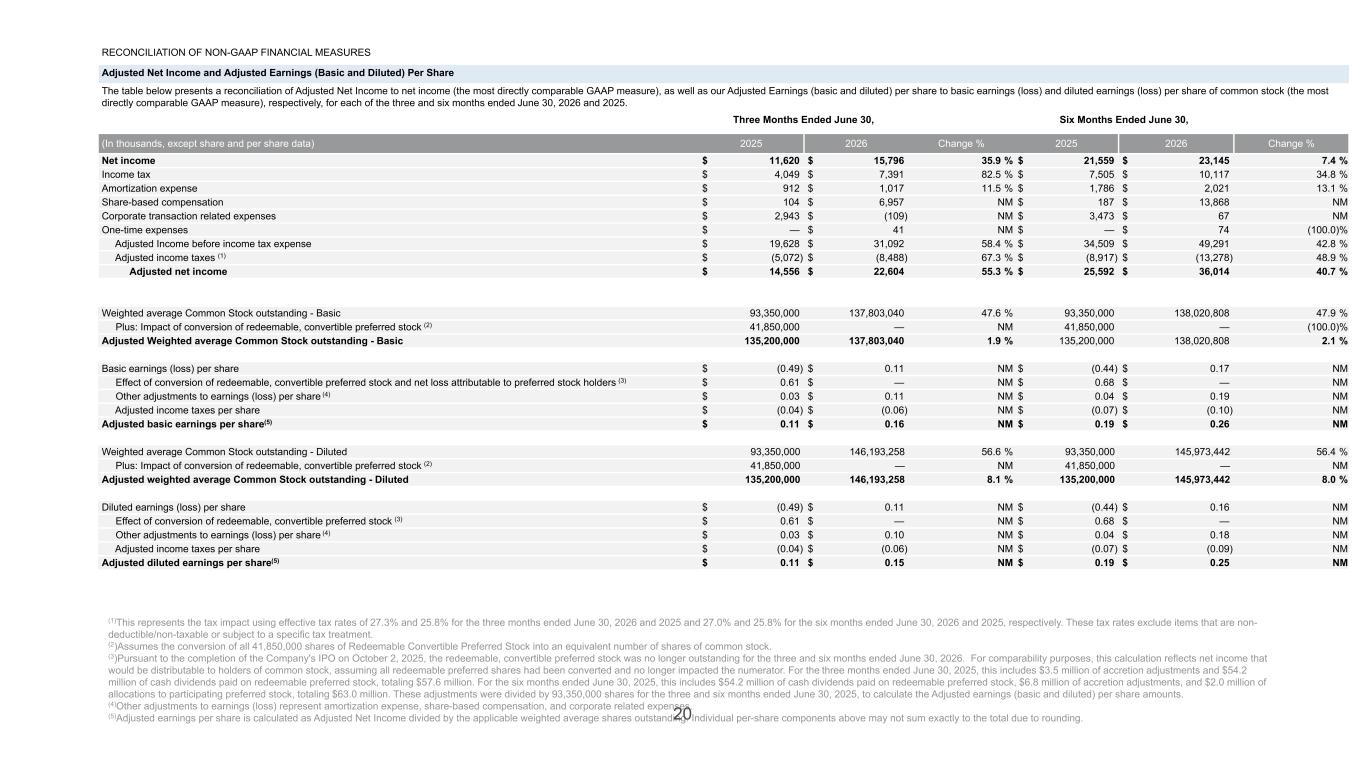
RECONCILIATION OF NON-GAAP FINANCIAL MEASURES Adjusted Net Income and Adjusted Earnings (Basic and Diluted) Per Share The table below presents a reconciliation of Adjusted Net Income to net income (the most directly comparable GAAP measure), as well as our Adjusted Earnings (basic and diluted) per share to basic earnings (loss) and diluted earnings (loss) per share of common stock (the most directly comparable GAAP measure), respectively, for each of the three and six months ended June 30, 2026 and 2025. Three Months Ended June 30, Six Months Ended June 30, (In thousands, except share and per share data) 2025 2026 Change % 2025 2026 Change % Net income $ 11,620 $ 15,796 35.9 % $ 21,559 $ 23,145 7.4 % Income tax $ 4,049 $ 7,391 82.5 % $ 7,505 $ 10,117 34.8 % Amortization expense $ 912 $ 1,017 11.5 % $ 1,786 $ 2,021 13.1 % Share-based compensation $ 104 $ 6,957 NM $ 187 $ 13,868 NM Corporate transaction related expenses $ 2,943 $ (109) NM $ 3,473 $ 67 NM One-time expenses $ — $ 41 NM $ — $ 74 (100.0) % Adjusted Income before income tax expense $ 19,628 $ 31,092 58.4 % $ 34,509 $ 49,291 42.8 % Adjusted income taxes (1) $ (5,072) $ (8,488) 67.3 % $ (8,917) $ (13,278) 48.9 % Adjusted net income $ 14,556 $ 22,604 55.3 % $ 25,592 $ 36,014 40.7 % Weighted average Common Stock outstanding - Basic 93,350,000 137,803,040 47.6 % 93,350,000 138,020,808 47.9 % Plus: Impact of conversion of redeemable, convertible preferred stock (2) 41,850,000 — NM 41,850,000 — (100.0) % Adjusted Weighted average Common Stock outstanding - Basic 135,200,000 137,803,040 1.9 % 135,200,000 138,020,808 2.1 % Basic earnings (loss) per share $ (0.49) $ 0.11 NM $ (0.44) $ 0.17 NM Effect of conversion of redeemable, convertible preferred stock and net loss attributable to preferred stock holders (3) $ 0.61 $ — NM $ 0.68 $ — NM Other adjustments to earnings (loss) per share (4) $ 0.03 $ 0.11 NM $ 0.04 $ 0.19 NM Adjusted income taxes per share $ (0.04) $ (0.06) NM $ (0.07) $ (0.10) NM Adjusted basic earnings per share(5) $ 0.11 $ 0.16 NM $ 0.19 $ 0.26 NM Weighted average Common Stock outstanding - Diluted 93,350,000 146,193,258 56.6 % 93,350,000 145,973,442 56.4 % Plus: Impact of conversion of redeemable, convertible preferred stock (2) 41,850,000 — NM 41,850,000 — NM Adjusted weighted average Common Stock outstanding - Diluted 135,200,000 146,193,258 8.1 % 135,200,000 145,973,442 8.0 % Diluted earnings (loss) per share $ (0.49) $ 0.11 NM $ (0.44) $ 0.16 NM Effect of conversion of redeemable, convertible preferred stock (3) $ 0.61 $ — NM $ 0.68 $ — NM Other adjustments to earnings (loss) per share (4) $ 0.03 $ 0.10 NM $ 0.04 $ 0.18 NM Adjusted income taxes per share $ (0.04) $ (0.06) NM $ (0.07) $ (0.09) NM Adjusted diluted earnings per share(5) $ 0.11 $ 0.15 NM $ 0.19 $ 0.25 NM (1)This represents the tax impact using effective tax rates of 27.3% and 25.8% for the three months ended June 30, 2026 and 2025 and 27.0% and 25.8% for the six months ended June 30, 2026 and 2025, respectively. These tax rates exclude items that are non- deductible/non-taxable or subject to a specific tax treatment. (2)Assumes the conversion of all 41,850,000 shares of Redeemable Convertible Preferred Stock into an equivalent number of shares of common stock. (3)Pursuant to the completion of the Company's IPO on October 2, 2025, the redeemable, convertible preferred stock was no longer outstanding for the three and six months ended June 30, 2026. For comparability purposes, this calculation reflects net income that would be distributable to holders of common stock, assuming all redeemable preferred shares had been converted and no longer impacted the numerator. For the three months ended June 30, 2025, this includes $3.5 million of accretion adjustments and $54.2 million of cash dividends paid on redeemable preferred stock, totaling $57.6 million. For the six months ended June 30, 2025, this includes $54.2 million of cash dividends paid on redeemable preferred stock, $6.8 million of accretion adjustments, and $2.0 million of allocations to participating preferred stock, totaling $63.0 million. These adjustments were divided by 93,350,000 shares for the three and six months ended June 30, 2025, to calculate the Adjusted earnings (basic and diluted) per share amounts. (4)Other adjustments to earnings (loss) represent amortization expense, share-based compensation, and corporate related expenses. (5)Adjusted earnings per share is calculated as Adjusted Net Income divided by the applicable weighted average shares outstanding. Individual per-share components above may not sum exactly to the total due to rounding.20
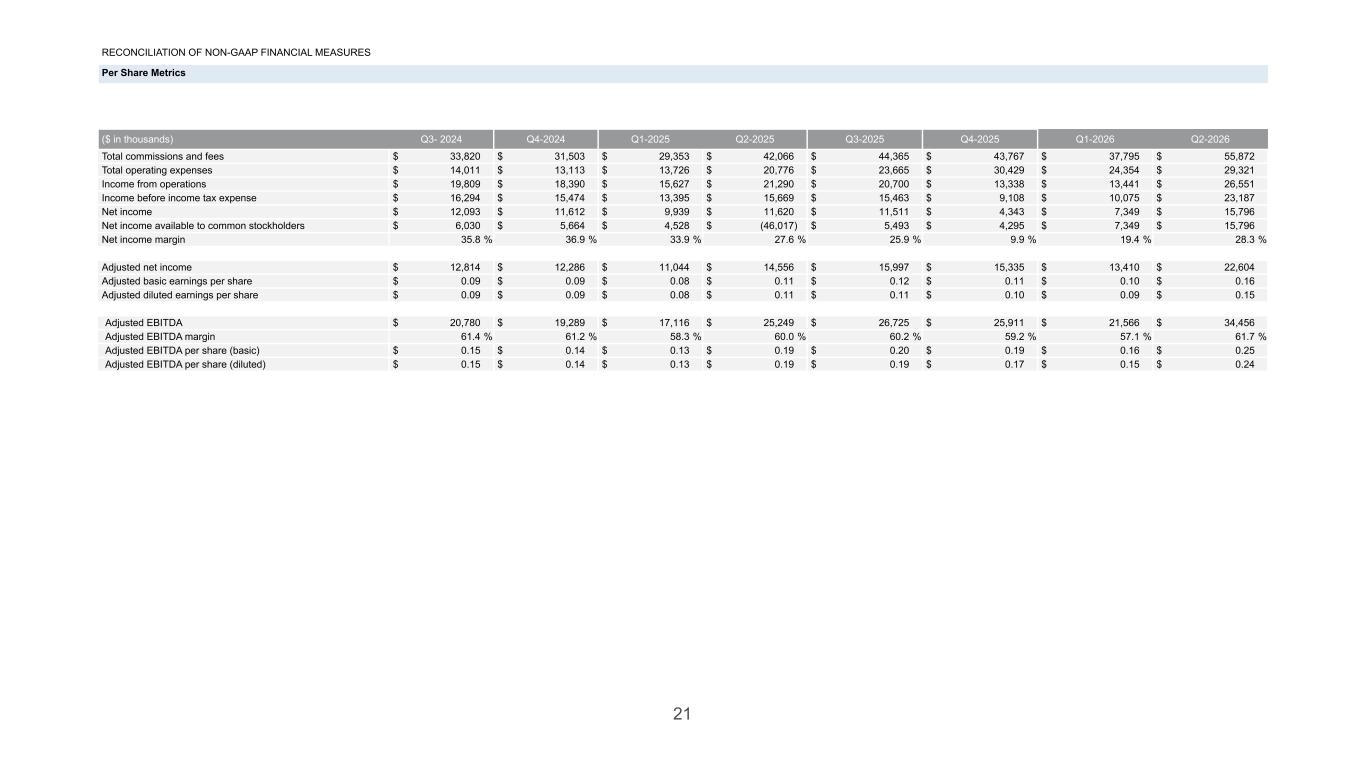
RECONCILIATION OF NON-GAAP FINANCIAL MEASURES Per Share Metrics ($ in thousands) Q3- 2024 Q4-2024 Q1-2025 Q2-2025 Q3-2025 Q4-2025 Q1-2026 Q2-2026 Total commissions and fees $ 33,820 $ 31,503 $ 29,353 $ 42,066 $ 44,365 $ 43,767 $ 37,795 $ 55,872 Total operating expenses $ 14,011 $ 13,113 $ 13,726 $ 20,776 $ 23,665 $ 30,429 $ 24,354 $ 29,321 Income from operations $ 19,809 $ 18,390 $ 15,627 $ 21,290 $ 20,700 $ 13,338 $ 13,441 $ 26,551 Income before income tax expense $ 16,294 $ 15,474 $ 13,395 $ 15,669 $ 15,463 $ 9,108 $ 10,075 $ 23,187 Net income $ 12,093 $ 11,612 $ 9,939 $ 11,620 $ 11,511 $ 4,343 $ 7,349 $ 15,796 Net income available to common stockholders $ 6,030 $ 5,664 $ 4,528 $ (46,017) $ 5,493 $ 4,295 $ 7,349 $ 15,796 Net income margin 35.8 % 36.9 % 33.9 % 27.6 % 25.9 % 9.9 % 19.4 % 28.3 % Adjusted net income $ 12,814 $ 12,286 $ 11,044 $ 14,556 $ 15,997 $ 15,335 $ 13,410 $ 22,604 Adjusted basic earnings per share $ 0.09 $ 0.09 $ 0.08 $ 0.11 $ 0.12 $ 0.11 $ 0.10 $ 0.16 Adjusted diluted earnings per share $ 0.09 $ 0.09 $ 0.08 $ 0.11 $ 0.11 $ 0.10 $ 0.09 $ 0.15 Adjusted EBITDA $ 20,780 $ 19,289 $ 17,116 $ 25,249 $ 26,725 $ 25,911 $ 21,566 $ 34,456 Adjusted EBITDA margin 61.4 % 61.2 % 58.3 % 60.0 % 60.2 % 59.2 % 57.1 % 61.7 % Adjusted EBITDA per share (basic) $ 0.15 $ 0.14 $ 0.13 $ 0.19 $ 0.20 $ 0.19 $ 0.16 $ 0.25 Adjusted EBITDA per share (diluted) $ 0.15 $ 0.14 $ 0.13 $ 0.19 $ 0.19 $ 0.17 $ 0.15 $ 0.24 21

Additional Information
ADDITIONAL INFORMATION Webcast The Company will host a conference call and webcast to discuss its financial results at 8:30 AM ET on Wednesday, July 22, 2026. The dial-in number for the conference call is (800) 715-9871 or (646) 307-1963 (international). Please dial the number 10 minutes prior to the scheduled start time. A live webcast of the conference call will also be available here as well as on Neptune's investor relations website at investors.neptuneflood.com. A replay of the webcast will be available shortly after the event at the same website. Effectiveness of Information The information included in this earnings presentation and the statements made during the earnings conference call, each of which is available on Neptune's investor relations website at investors.neptuneflood.com (collectively, the “Earnings Materials”), represent Neptune’s expectations and beliefs as of July 21, 2026. Although these Earnings Materials will remain available on Neptune’s website through the date of the earnings call for the second quarter of fiscal 2027, their continued availability does not mean that Neptune is reaffirming or confirming their continued validity. Neptune undertakes no obligation to update any forward-looking statements, whether as a result of new information or future events, or to otherwise update the targets given in this earnings presentation, except as required by law. Non-GAAP Financial Measures and Key Performance Indicators To supplement our condensed consolidated financial statements, which are prepared and presented in accordance with generally accepted accounting principles in the United States (GAAP), we use the following non-GAAP financial measures: Adjusted EBITDA, Adjusted EBITDA margin, Adjusted net income, and Adjusted basic and diluted earnings per share. The presentation of these financial measures is not intended to be considered in isolation or as a substitute for, or superior to, financial information prepared and presented in accordance with GAAP. Investors are cautioned that there are material limitations associated with the use of non-GAAP financial measures as an analytical tool. In addition, these measures may be different from non-GAAP financial measures used by other companies, limiting their usefulness for comparison purposes. We compensate for these limitations by providing specific information regarding the GAAP amounts excluded from these non-GAAP financial measures. We believe these non-GAAP financial measures provide investors with useful supplemental information about the financial performance of our business, enable comparison of financial results between periods where certain items may vary independent of business performance, and allow for greater transparency with respect to key metrics used by management in operating our business. See “Reconciliation of Non-GAAP Financial Measures” for a reconciliation of non-GAAP measures to the most directly comparable GAAP measures. Adjusted EBITDA is a non-GAAP financial measure derived from net income (the most directly comparable GAAP measure) adjusted to exclude interest expense (net of interest income), loss on extinguishment of debt, income taxes, amortization expense, share- based compensation, corporate transaction related expenses, and other one-time expenses. By removing these expenses, we believe Adjusted EBITDA provides a clearer representation of operating performance. Adjusted EBITDA margin is a non-GAAP financial measure derived from Adjusted EBITDA divided by revenue. We believe that Adjusted EBITDA margin is a useful measurement of operating profitability for the same reasons we find Adjusted EBITDA useful and also because it provides a period-to-period comparison of our operating performance. Adjusted net income is a non-GAAP financial measure derived from net income (the most directly comparable GAAP measure), adjusted to exclude loss on extinguishment of debt, amortization expense, share-based compensation, corporate transaction related expenses, and other one-time expenses, and the related tax effect of those adjustments. By removing these expenses, we believe Adjusted net income provides a clearer representation of operating performance. Adjusted diluted earnings per share is Adjusted net income divided by diluted weighted average shares outstanding, assuming the conversion of all outstanding shares of redeemable convertible preferred stock into an equivalent number of shares of common stock, which occurred upon the consummation of our IPO. Similarly, Adjusted basic earnings per share is Adjusted net income divided by basic weighted average shares outstanding, also assuming the conversion of all outstanding redeemable convertible preferred stock into an equivalent number of shares of common stock, which occurred upon the consummation of our IPO. By implementing the conversion of the redeemable convertible preferred stock, we believe Adjusted earnings (basic and diluted) per share provides a clearer representation of operating performance. The most directly comparable GAAP measures are diluted earnings per share and basic earnings per share, respectively. Additionally, we discuss certain key performance indicators, described below, which provide useful information about the Company’s business and the operational factors underlying the Company’s financial performance. Written Premium is the total premium we placed with insurance programs during a reporting period, less “return premiums” refunded to policyholders due to cancellations, endorsement of policies, or otherwise. We believe written premium is an appropriate measure of operating performance because it is the primary driver of our commission revenue. Revenue per Employee is revenue for the trailing four quarters, determined in accordance with GAAP, divided by the average number of employees during the trailing four quarters. We monitor this as a metric of scaling growth and believe it to be a leading indicator of sustained profitability and efficiency. Adjusted EBITDA per employee is Adjusted EBITDA, a non-GAAP metric, for the trailing four quarters divided by the average number of employees during the trailing four quarters. We monitor this as a metric of scaling growth and believe it to be a leading indicator of sustained profitability and efficiency. For further discussion on our calculation of Adjusted EBITDA, see “Non-GAAP Financial Measures” above. Policy Retention Rate is the percentage of our policyholders who receive renewal offers and who accept the offered renewal term. We monitor the acceptance of renewal offers as an early indicator of price elasticity. Premium Retention Rate is the premium associated with those accepted renewal offers, as a percentage of the total premium from expiring policies for which renewal offers were made. Revenue Retention Rate is the percentage of revenue recognized on policies in a given period that is recognized under the renewal terms of those same policies in the subsequent period. We monitor this metric as a comprehensive indicator of renewal performance and the long-term stability of our revenue base, as it reflects the combined effect of policy retention, premium changes, and policy fee income. Organic revenue and organic revenue growth: We define organic revenue as total revenue determined in accordance with GAAP, adjusted to remove the impact of any acquisitions or divestitures. We define organic revenue growth as the year-over-year growth in our organic revenue. However, as of the date of this Quarterly Report and for the relevant periods presented herein, we have not completed any relevant acquisitions or divestitures, therefore our organic revenue and organic revenue growth reflect our total revenue and total revenue growth, respectively, as determined in accordance with GAAP. Organic revenue and organic revenue growth are also non-GAAP financial measures which are commonly reported by others in the insurance industry. We use “organic revenue” and “organic revenue growth” in this Quarterly Report to facilitate investors’ understanding of our operating performance and comparison with our peers. 23
ADDITIONAL INFORMATION Safe Harbor Statement This earnings presentation, the press release, and the earnings conference call contain “forward-looking statements” within the meaning of the Private Securities Litigation Reform Act of 1995 that involve substantial risks and uncertainties. All statements, other than statements of historical fact included in this release, are forward-looking statements. Forward-looking statements give our current expectations relating to our financial condition, results of operations, plans, objectives, future performance, and business. You can identify forward-looking statements by the fact that they do not relate strictly to historical or current facts. In some cases, you can identify these statements by forward-looking words such as “may,” “might,” “will,” “should,” “expects,” “plans,” “anticipates,” “believes,” “estimates,” “outlook,” “predicts,” “potential,” or “continue,” the negative of these terms, and other comparable terminology. These forward-looking statements, which are subject to risks, uncertainties, and assumptions about us, include, among others, projections of our future financial performance, our anticipated growth and business strategies, anticipated trends in our business, capital allocation plans, technology initiatives, and other future events or development. These statements are only predictions based on our current expectations and projections about future events. There are important factors that could cause our actual results, level of activity, performance, or achievements to differ materially from the results, level of activity, performance, or achievements expressed or implied by the forward-looking statements, including those factors discussed under the captions entitled “Risk Factors” and “Management’s Discussion and Analysis of Financial Condition and Results of Operations” in the Company’s Annual Report on Form 10-K for the year ended December 31, 2025, the Company's Quarterly Report on Form 10-Q for the quarter ended June 30, 2026, once filed, and the other documents that the Company files with the U.S. Securities and Exchange Commission, which are available free of charge on the SEC's website at: www.sec.gov and on Neptune’s investor relations website at investors.neptuneflood.com. Although we believe the expectations reflected in the forward-looking statements are reasonable, we cannot guarantee future results, level of activity, performance, or achievements. Moreover, neither we nor any other person assumes responsibility for the accuracy and completeness of any of these forward-looking statements. We undertake no obligation to publicly update or revise any forward-looking statement, whether as a result of new information, future developments, or otherwise, except as may be required by law. 24