ALASKA AIR GROUP Q2 2026 Earnings | July 21, 2026 1
2 Safe Harbor This presentation may contain forward-looking statements subject to the safe harbor protection provided by Section 27A of the Securities Act of 1933, Section 21E of the Securities Exchange Act of 1934, and the Private Securities Litigation Reform Act of 1995. These statements relate to future events and involve known and unknown risks and uncertainties that may cause actual outcomes to be materially different from those indicated by our forward-looking statements, assumptions or beliefs. For a discussion of risks and uncertainties that may cause our forward-looking statements to differ materially, see Item 1A of the Company’s Annual Report on Form 10-K for the year ended December 31, 2025. Some of these risks include competition, labor costs, relations and availability, general economic conditions, increases in operating costs including fuel, uncertainties regarding the ability to successfully integrate the operations following the acquisition of Hawaiian Holdings, Inc. and the ability to realize anticipated cost savings, synergies, or growth from the acquisition, inability to meet cost reduction and other strategic goals, seasonal fluctuations in demand and financial results, supply chain risks, events that negatively impact aviation safety and security, cybersecurity risks, and changes in laws and regulations that impact our business. All of the forward-looking statements are qualified in their entirety by reference to the risk factors discussed in our most recent Form 10-K. We operate in a continually changing business environment, and new risk factors emerge from time to time. Management cannot predict such new risk factors, nor can it assess the impact, if any, of such new risk factors on our business or events described in any forward-looking statements. We expressly disclaim any obligation to publicly update or revise any forward-looking statements made today to conform them to actual results. Over time, our actual results, performance or achievements may differ from the anticipated results, performance or achievements that are expressed or implied by our forward-looking statements, assumptions or beliefs and such differences might be significant and materially adverse. Non-GAAP Financial Information The Company has made reference in this presentation to financial metrics which are not in accordance with GAAP. Pursuant to Regulation G, we have provided reconciliations of non-GAAP financial measures to their most directly comparable financial measures reported on a GAAP basis within the Second Quarter 2026 Earnings Release filed concurrently with this presentation. Prior year non-GAAP financial metrics have been reconciled in previous SEC filings, and can be referenced therein.
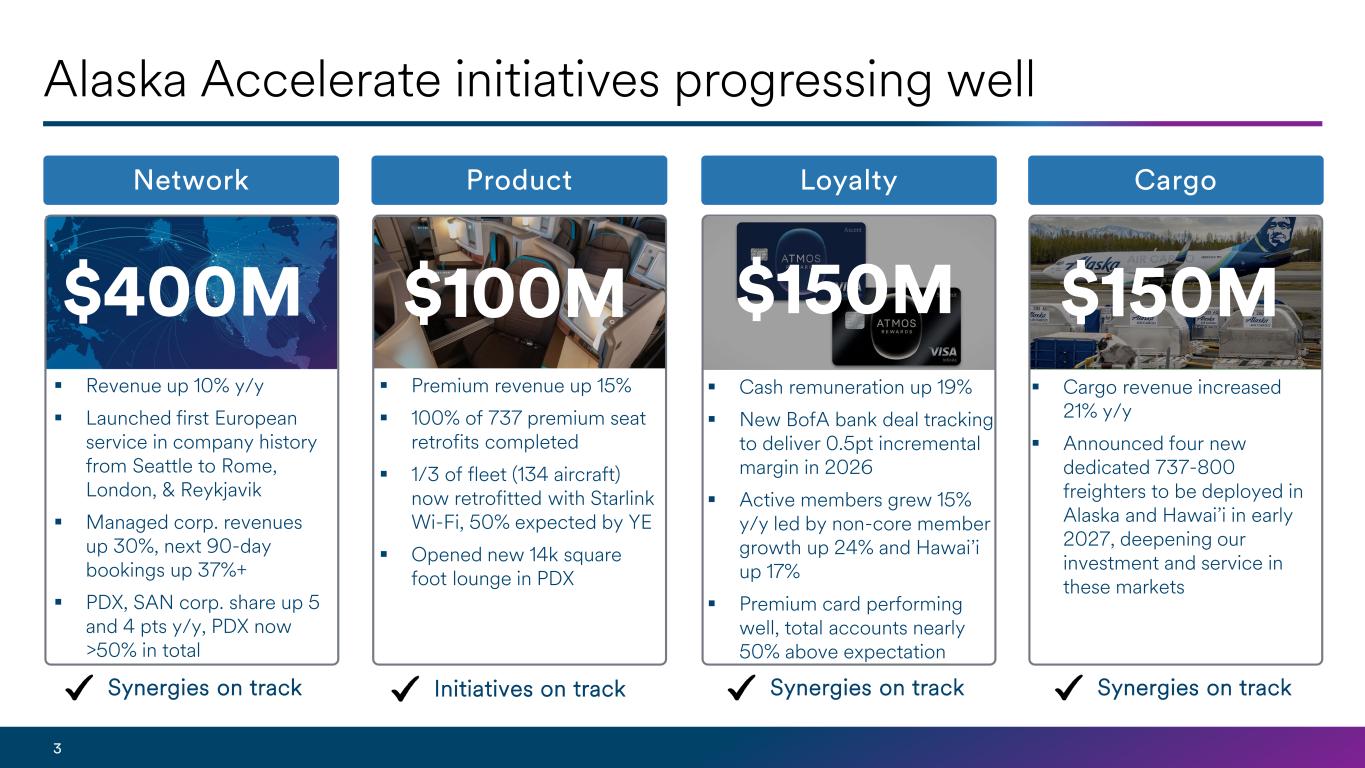
3 Alaska Accelerate initiatives progressing well $100M $150M $150M Network Product Loyalty Cargo Revenue up 10% y/y Launched first European service in company history from Seattle to Rome, London, & Reykjavik Managed corp. revenues up 30%, next 90-day bookings up 37%+ PDX, SAN corp. share up 5 and 4 pts y/y, PDX now >50% in total Premium revenue up 15% 100% of 737 premium seat retrofits completed 1/3 of fleet (134 aircraft) now retrofitted with Starlink Wi-Fi, 50% expected by YE Opened new 14k square foot lounge in PDX Cash remuneration up 19% New BofA bank deal tracking to deliver 0.5pt incremental margin in 2026 Active members grew 15% y/y led by non-core member growth up 24% and Hawai’i up 17% Premium card performing well, total accounts nearly 50% above expectation Cargo revenue increased 21% y/y Announced four new dedicated 737-800 freighters to be deployed in Alaska and Hawai’i in early 2027, deepening our investment and service in these markets $400M Synergies on track Synergies on track Synergies on trackInitiatives on track
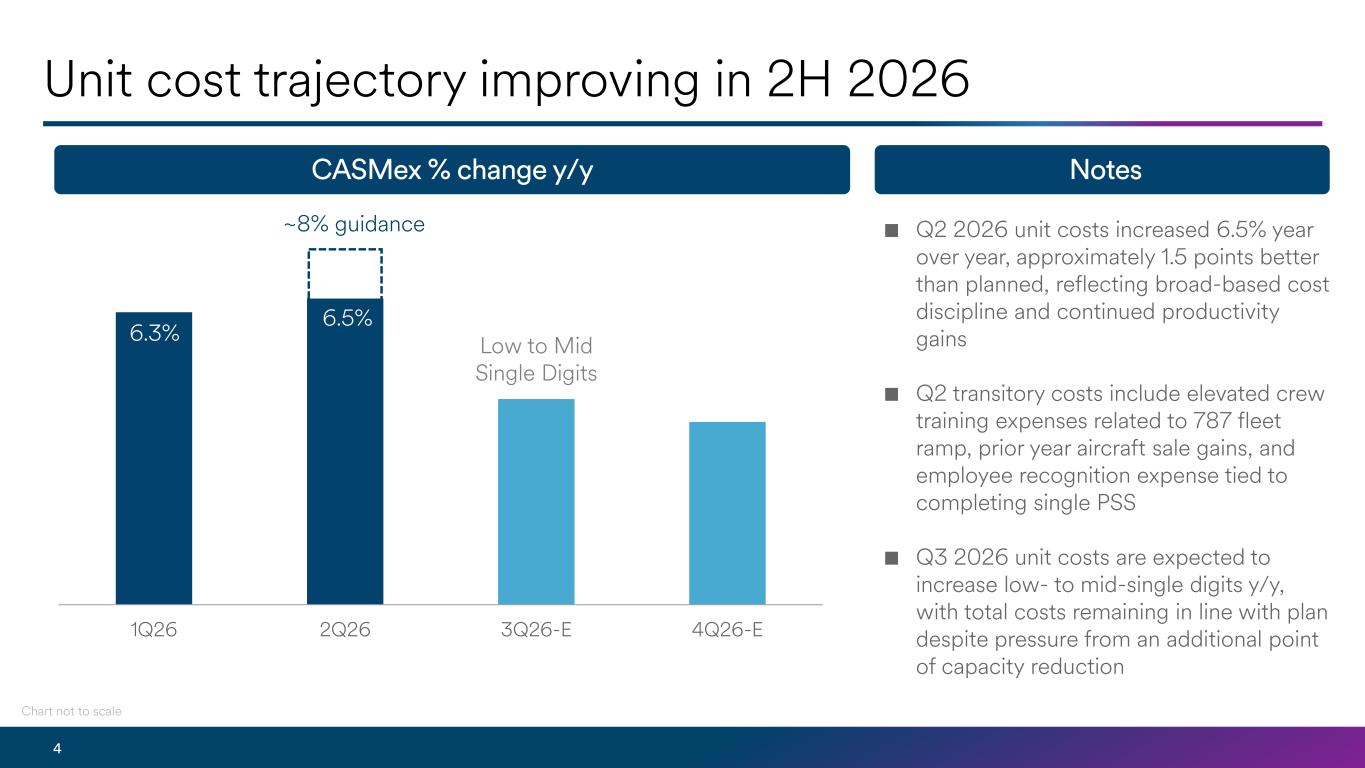
1Q26 2Q26 3Q26-E 4Q26-E 4 Unit cost trajectory improving in 2H 2026 CASMex % change y/y Chart not to scale Notes ■ Q2 2026 unit costs increased 6.5% year over year, approximately 1.5 points better than planned, reflecting broad-based cost discipline and continued productivity gains ■ Q2 transitory costs include elevated crew training expenses related to 787 fleet ramp, prior year aircraft sale gains, and employee recognition expense tied to completing single PSS ■ Q3 2026 unit costs are expected to increase low- to mid-single digits y/y, with total costs remaining in line with plan despite pressure from an additional point of capacity reduction 6.3% 6.5% ~8% guidance Low to Mid Single Digits
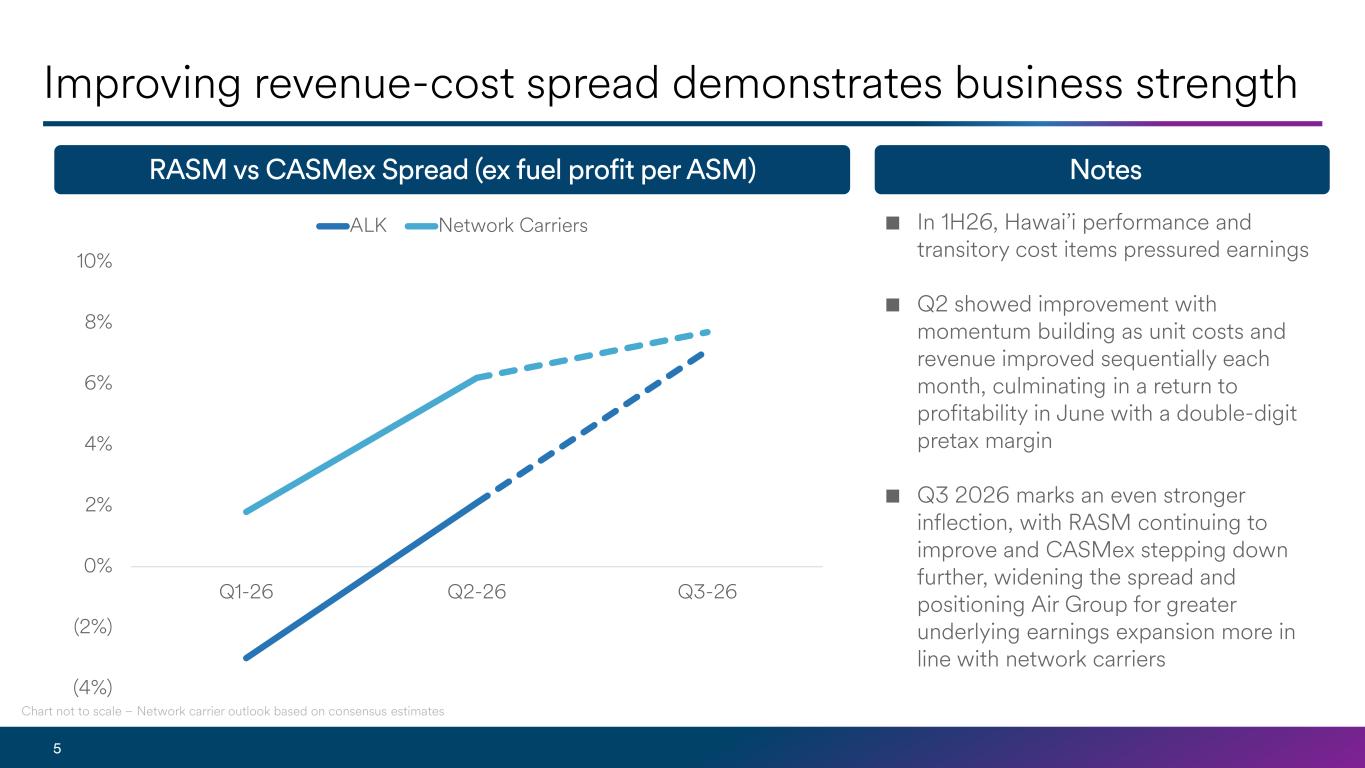
5 Improving revenue-cost spread demonstrates business strength RASM vs CASMex Spread (ex fuel profit per ASM) Chart not to scale – Network carrier outlook based on consensus estimates Notes ■ In 1H26, Hawai’i performance and transitory cost items pressured earnings ■ Q2 showed improvement with momentum building as unit costs and revenue improved sequentially each month, culminating in a return to profitability in June with a double-digit pretax margin ■ Q3 2026 marks an even stronger inflection, with RASM continuing to improve and CASMex stepping down further, widening the spread and positioning Air Group for greater underlying earnings expansion more in line with network carriers (4%) (2%) 0% 2% 4% 6% 8% 10% Q1-26 Q2-26 Q3-26 ALK Network Carriers
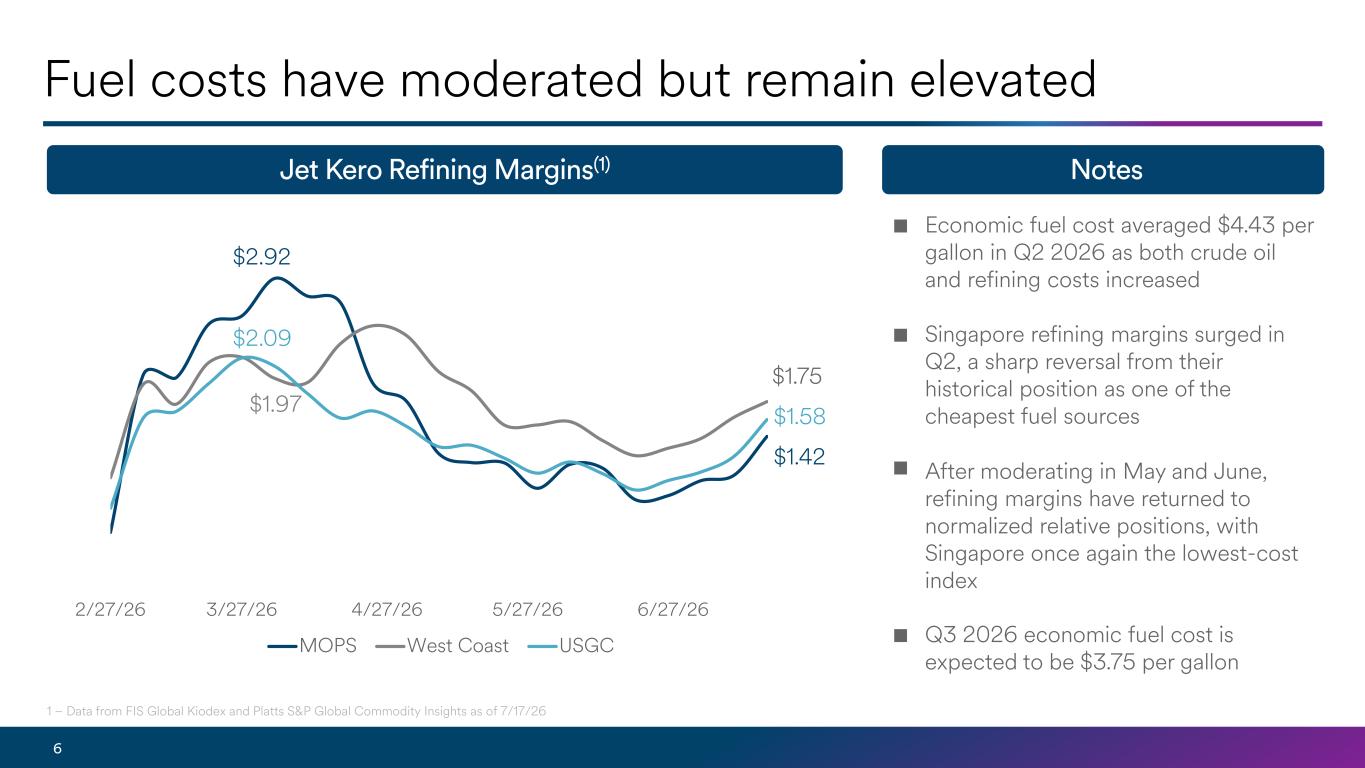
2/27/26 3/27/26 4/27/26 5/27/26 6/27/26 MOPS West Coast USGC 6 Fuel costs have moderated but remain elevated Jet Kero Refining Margins(1) Notes ■ Economic fuel cost averaged $4.43 per gallon in Q2 2026 as both crude oil and refining costs increased ■ Singapore refining margins surged in Q2, a sharp reversal from their historical position as one of the cheapest fuel sources ■ After moderating in May and June, refining margins have returned to normalized relative positions, with Singapore once again the lowest-cost index ■ Q3 2026 economic fuel cost is expected to be $3.75 per gallon 1 – Data from FIS Global Kiodex and Platts S&P Global Commodity Insights as of 7/17/26 $1.42 $1.75 $2.92 $1.58 $2.09 $1.97
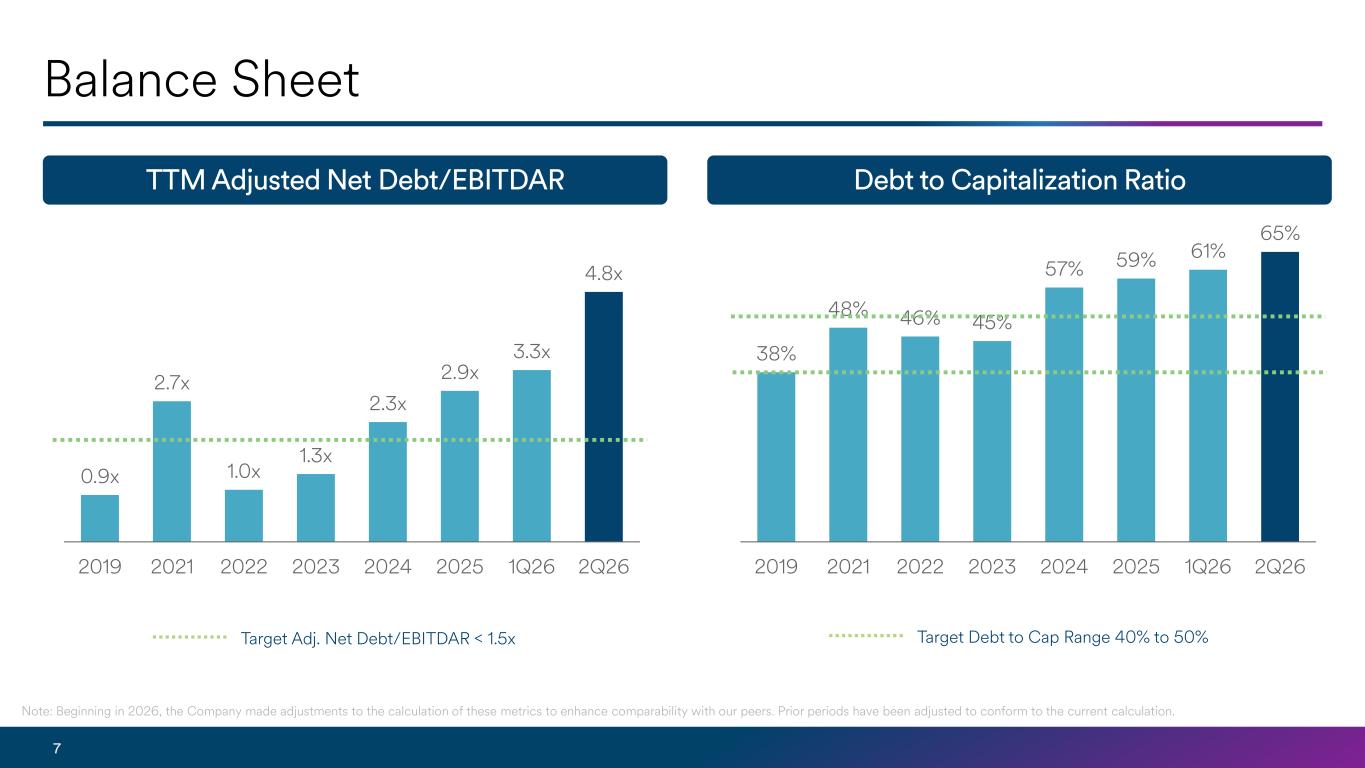
7 Balance Sheet Debt to Capitalization Ratio Target Adj. Net Debt/EBITDAR < 1.5x 0.9x 2.7x 1.0x 1.3x 2.3x 2.9x 3.3x 4.8x 2019 2021 2022 2023 2024 2025 1Q26 2Q26 TTM Adjusted Net Debt/EBITDAR 38% 48% 46% 45% 57% 59% 61% 65% 2019 2021 2022 2023 2024 2025 1Q26 2Q26 Target Debt to Cap Range 40% to 50% Note: Beginning in 2026, the Company made adjustments to the calculation of these metrics to enhance comparability with our peers. Prior periods have been adjusted to conform to the current calculation.
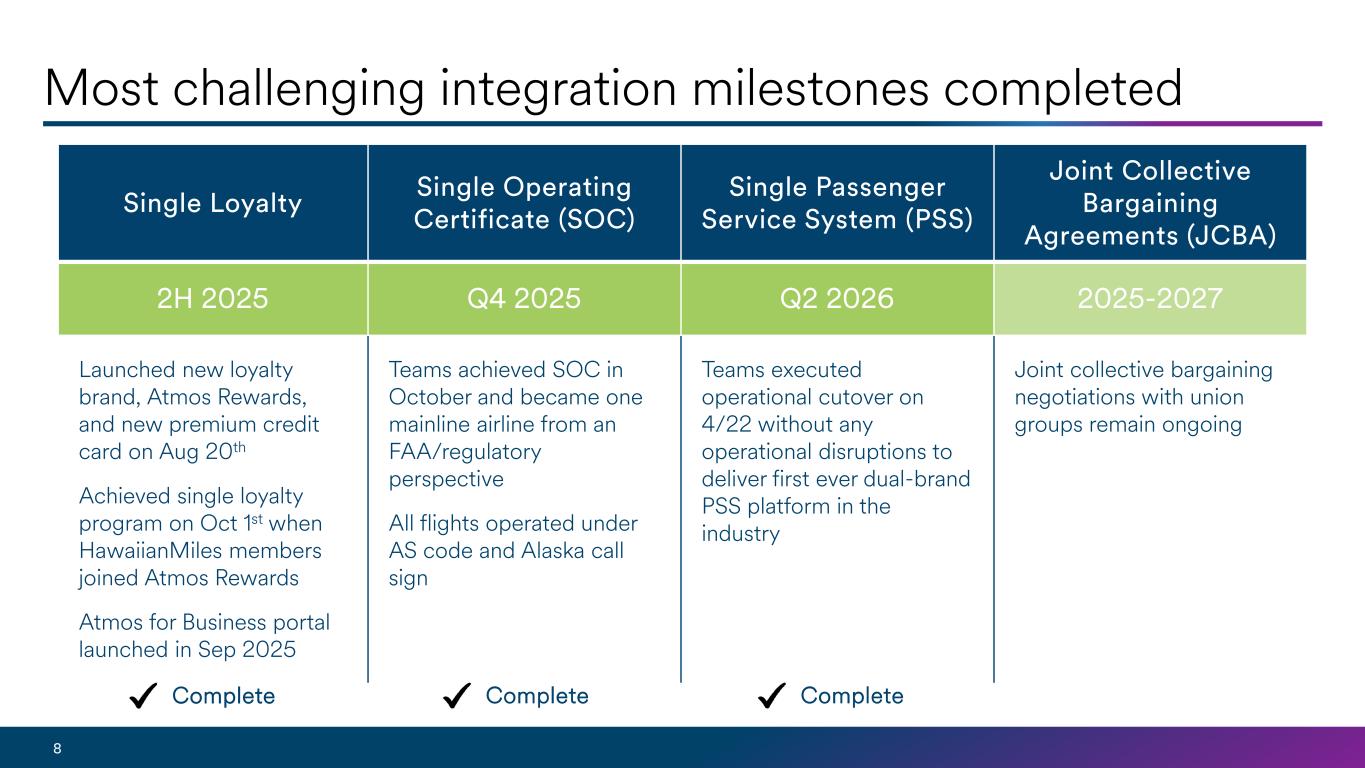
8 Most challenging integration milestones completed Single Loyalty Single Operating Certificate (SOC) Single Passenger Service System (PSS) Joint Collective Bargaining Agreements (JCBA) 2H 2025 Q4 2025 Q2 2026 2025-2027 Launched new loyalty brand, Atmos Rewards, and new premium credit card on Aug 20th Achieved single loyalty program on Oct 1st when HawaiianMiles members joined Atmos Rewards Atmos for Business portal launched in Sep 2025 Teams achieved SOC in October and became one mainline airline from an FAA/regulatory perspective All flights operated under AS code and Alaska call sign Teams executed operational cutover on 4/22 without any operational disruptions to deliver first ever dual-brand PSS platform in the industry Joint collective bargaining negotiations with union groups remain ongoing Complete Complete Complete