
July 21, 2026 Second Quarter 2026 Investor Presentation
231 230 230 120 167 248 89 84 84 132 151 176 3 31 72 8 59 146 62 145 248 175 171 171 71 87 104 139 203 255 Important Notices 2 This presentation is issued by Annaly Capital Management, Inc. ("Annaly" or the “Company”), an internally-managed, publicly traded company that has elected to be taxed as a real estate investment trust for federal income tax purposes, and is being furnished in connection with Annaly’s Second Quarter 2026 earnings release. This presentation is provided for investors in Annaly for informational purposes only and is not an offer to sell, or a solicitation of an offer to buy, any security or instrument. Forward-Looking Statements This presentation contains forward-looking statements within the meaning of the Private Securities Litigation Reform Act. These statements are based on management’s beliefs and expectations, speak only as of the date on which they were made, and are subject to significant risks and uncertainties. Actual results could differ materially from those set forth in forward-looking statements. Factors that could cause actual results to differ from those contained in the forward-looking statements can be found in our most recent Annual Report on Form 10-K and any subsequent Quarterly Reports on Form 10-Q. Annaly undertakes no obligation to update or revise any forward-looking statements. We use our website and LinkedIn account as additional channels for distributing material company information, along with our press releases, SEC filings and public conference calls and webcasts. Non-GAAP Financial Measures This presentation includes certain non-GAAP financial measures that provide supplemental information to help investors evaluate our operating performance and financial condition. These measures should not be considered in isolation or as a substitute for GAAP financial measures and may be calculated differently than our peers. Reconciliations to the most directly comparable GAAP measures are provided in the accompanying tables.
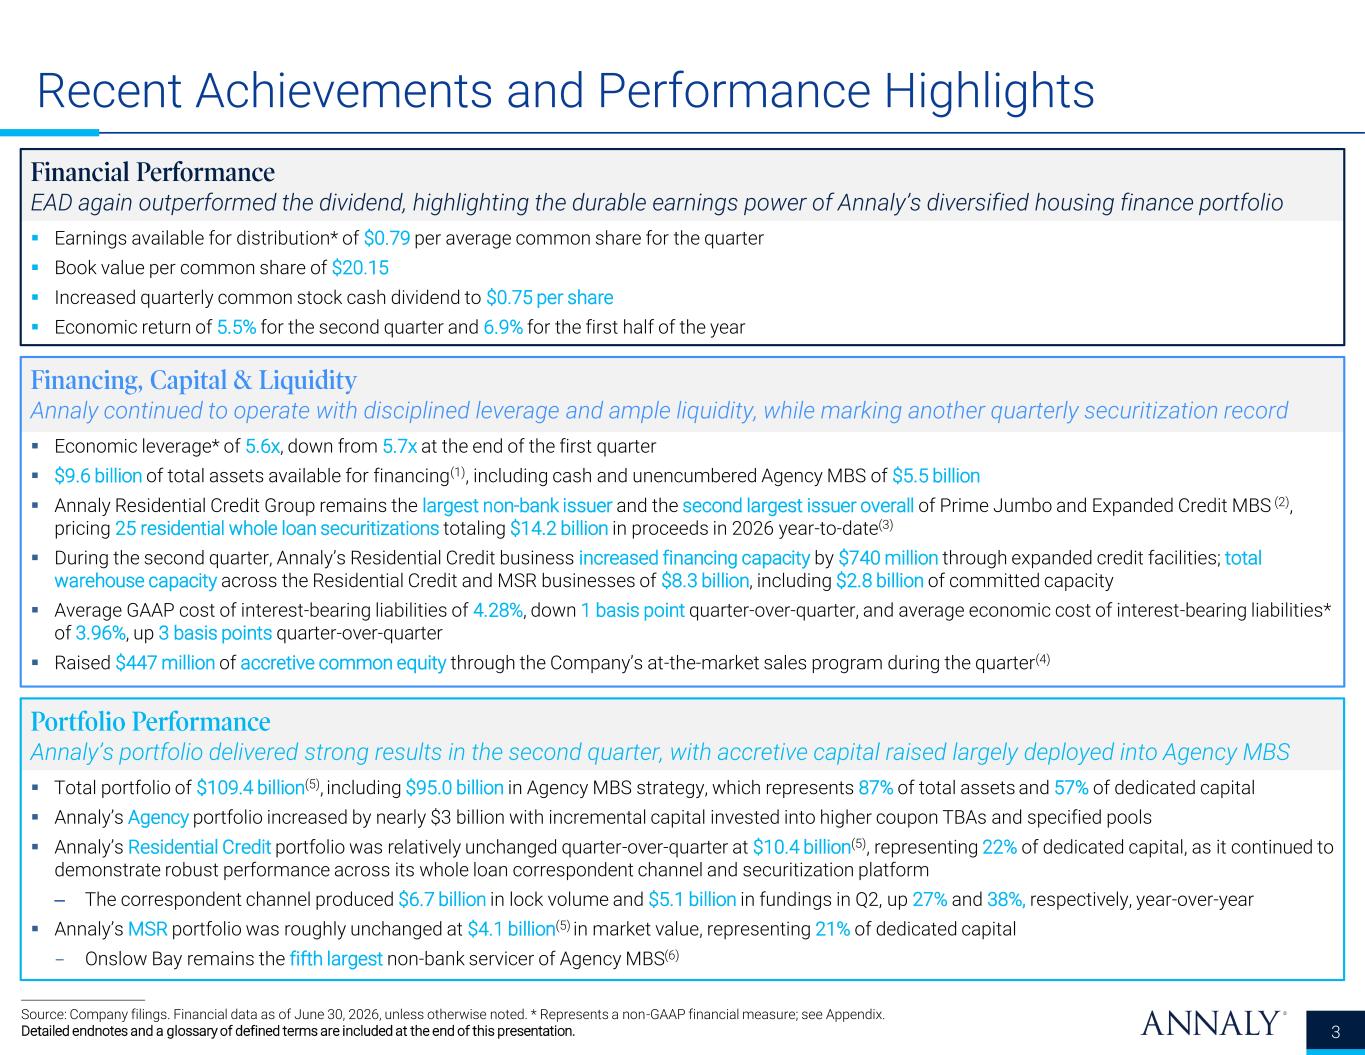
231 230 230 120 167 248 89 84 84 132 151 176 3 31 72 8 59 146 62 145 248 175 171 171 71 87 104 139 203 255 Recent Achievements and Performance Highlights Source: Company filings. Financial data as of June 30, 2026, unless otherwise noted. * Represents a non-GAAP financial measure; see Appendix. Detailed endnotes and a glossary of defined terms are included at the end of this presentation. Financial Performance EAD again outperformed the dividend, highlighting the durable earnings power of Annaly’s diversified housing finance portfolio ▪ Earnings available for distribution* of $0.79 per average common share for the quarter ▪ Book value per common share of $20.15 ▪ Increased quarterly common stock cash dividend to $0.75 per share ▪ Economic return of 5.5% for the second quarter and 6.9% for the first half of the year Financing, Capital & Liquidity Annaly continued to operate with disciplined leverage and ample liquidity, while marking another quarterly securitization record ▪ Economic leverage* of 5.6x, down from 5.7x at the end of the first quarter ▪ $9.6 billion of total assets available for financing(1), including cash and unencumbered Agency MBS of $5.5 billion ▪ Annaly Residential Credit Group remains the largest non-bank issuer and the second largest issuer overall of Prime Jumbo and Expanded Credit MBS (2), pricing 25 residential whole loan securitizations totaling $14.2 billion in proceeds in 2026 year-to-date(3) ▪ During the second quarter, Annaly’s Residential Credit business increased financing capacity by $740 million through expanded credit facilities; total warehouse capacity across the Residential Credit and MSR businesses of $8.3 billion, including $2.8 billion of committed capacity ▪ Average GAAP cost of interest-bearing liabilities of 4.28%, down 1 basis point quarter-over-quarter, and average economic cost of interest-bearing liabilities* of 3.96%, up 3 basis points quarter-over-quarter ▪ Raised $447 million of accretive common equity through the Company’s at-the-market sales program during the quarter(4) Portfolio Performance Annaly’s portfolio delivered strong results in the second quarter, with accretive capital raised largely deployed into Agency MBS ▪ Total portfolio of $109.4 billion(5), including $95.0 billion in Agency MBS strategy, which represents 87% of total assets and 57% of dedicated capital ▪ Annaly’s Agency portfolio increased by nearly $3 billion with incremental capital invested into higher coupon TBAs and specified pools ▪ Annaly’s Residential Credit portfolio was relatively unchanged quarter-over-quarter at $10.4 billion(5), representing 22% of dedicated capital, as it continued to demonstrate robust performance across its whole loan correspondent channel and securitization platform – The correspondent channel produced $6.7 billion in lock volume and $5.1 billion in fundings in Q2, up 27% and 38%, respectively, year-over-year ▪ Annaly’s MSR portfolio was roughly unchanged at $4.1 billion(5) in market value, representing 21% of dedicated capital - Onslow Bay remains the fifth largest non-bank servicer of Agency MBS(6) 3
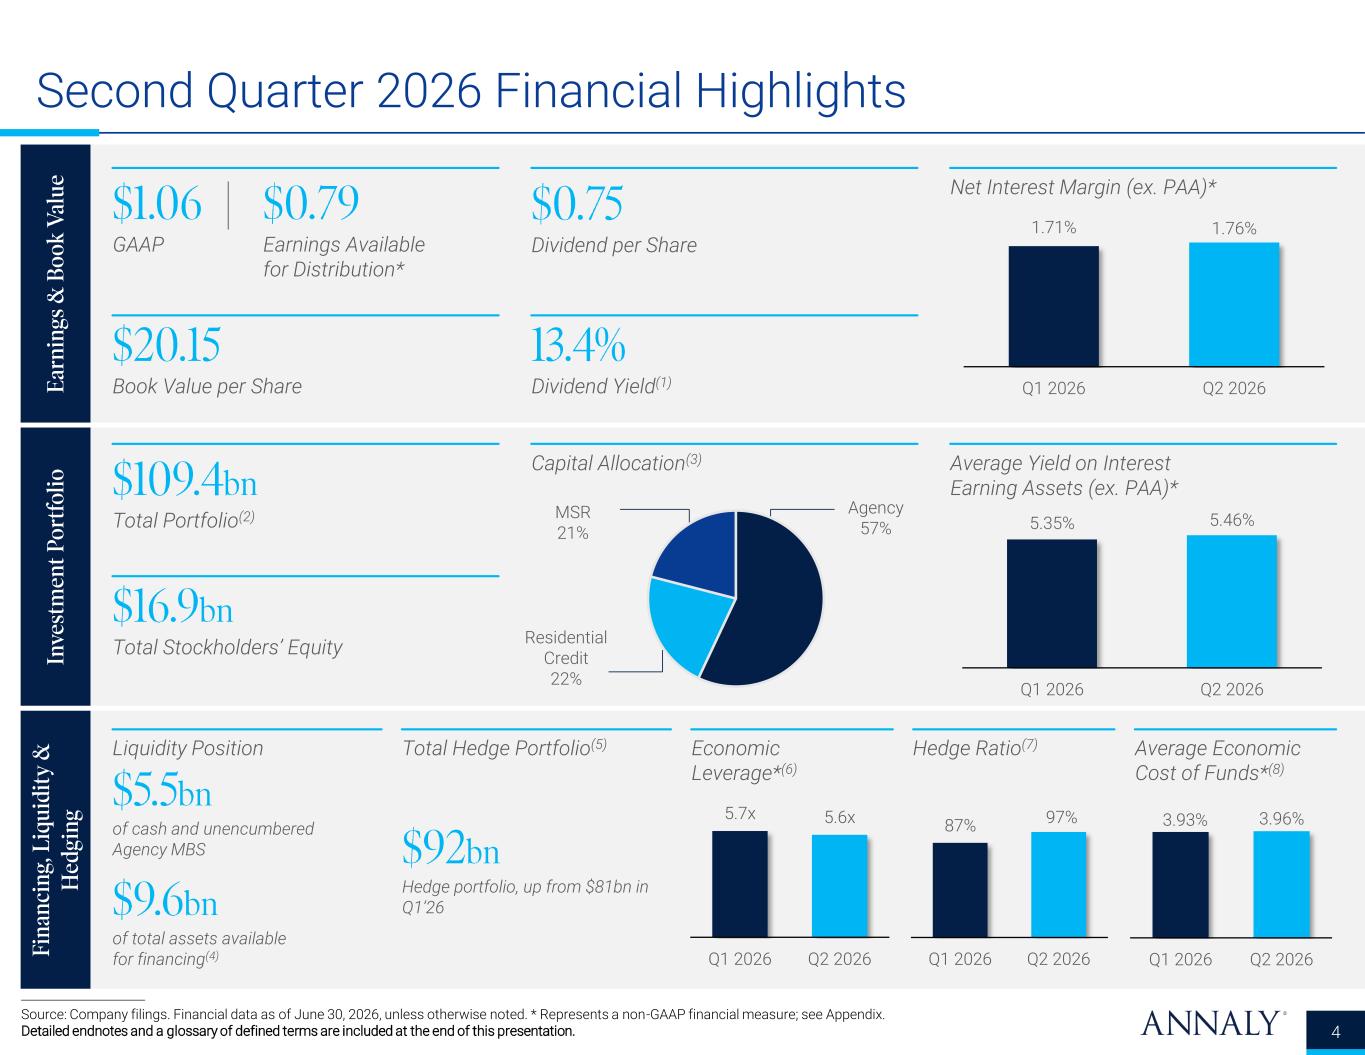
231 230 230 120 167 248 89 84 84 132 151 176 3 31 72 8 59 146 62 145 248 175 171 171 71 87 104 139 203 255 Second Quarter 2026 Financial Highlights Ea rn in gs & B o o k V al u e In ve st m en t P o rt fo lio Fi n an ci n g, L iq u id it y & H ed gi n g $1.06 | GAAP $0.79 Earnings Available for Distribution* $20.15 Book Value per Share 13.4% Dividend Yield(1) $0.75 Dividend per Share Net Interest Margin (ex. PAA)* $109.4bn Total Portfolio(2) $16.9bn Total Stockholders’ Equity Capital Allocation(3) Average Yield on Interest Earning Assets (ex. PAA)* Liquidity Position $5.5bn of cash and unencumbered Agency MBS $9.6bn of total assets available for financing(4) Total Hedge Portfolio(5) $92bn Hedge portfolio, up from $81bn in Q1’26 Economic Leverage*(6) Hedge Ratio(7) Average Economic Cost of Funds*(8) Source: Company filings. Financial data as of June 30, 2026, unless otherwise noted. * Represents a non-GAAP financial measure; see Appendix. Detailed endnotes and a glossary of defined terms are included at the end of this presentation. 4 87% 97% Q1 2026 Q2 2026 3.93% 3.96% Q1 2026 Q2 2026 1.71% 1.76% Q1 2026 Q2 2026 5.35% 5.46% Q1 2026 Q2 2026 Agency 57% Residential Credit 22% MSR 21% 5.7x 5.6x Q1 2026 Q2 2026
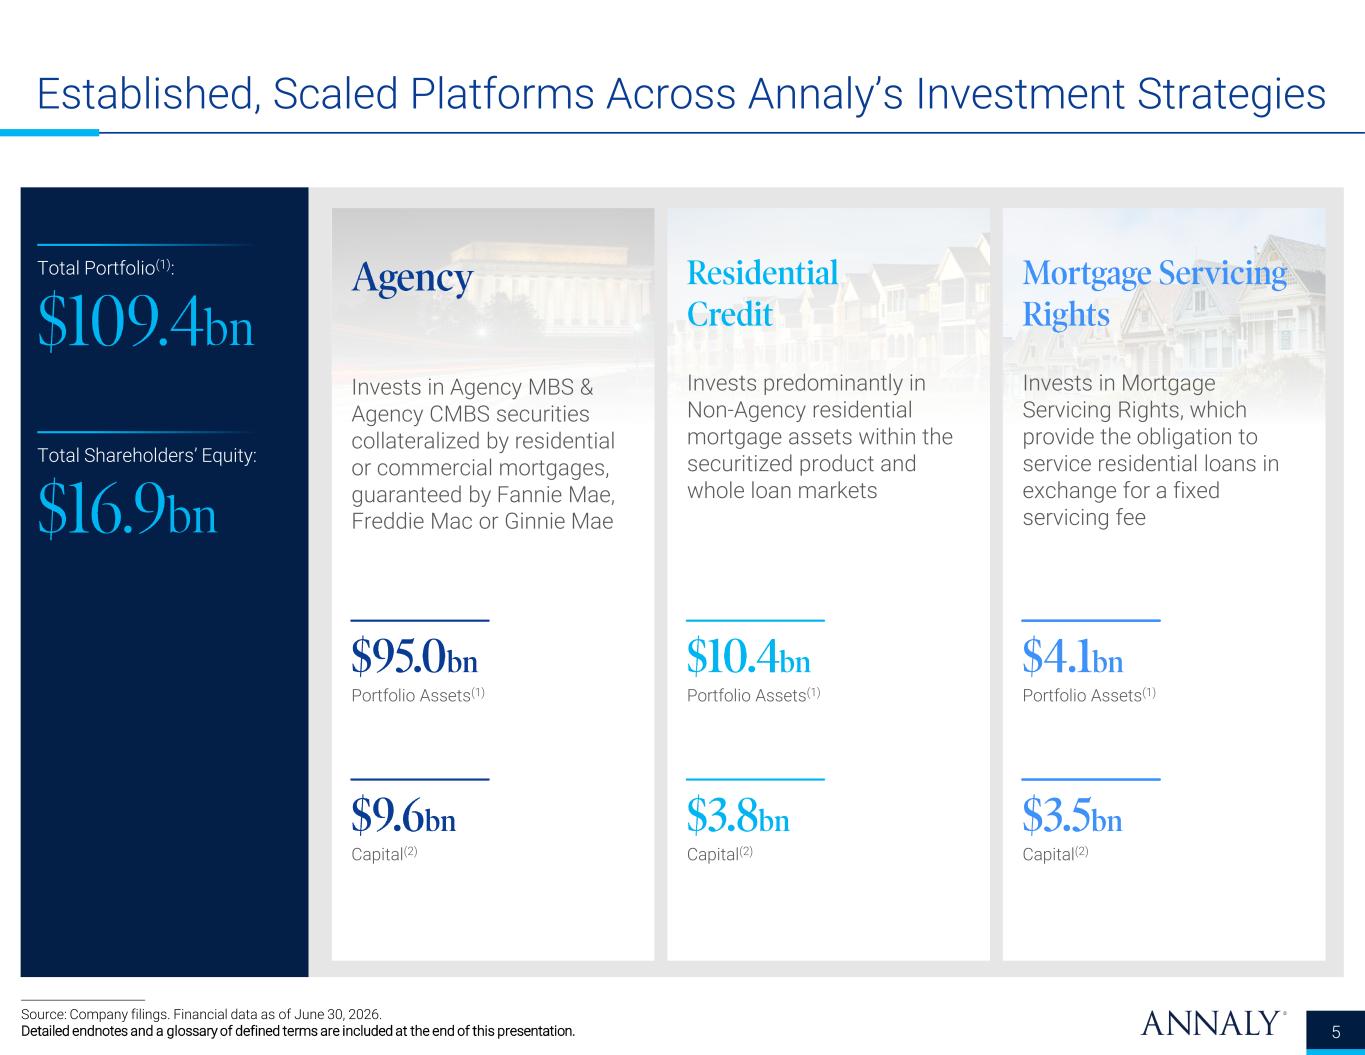
231 230 230 120 167 248 89 84 84 132 151 176 3 31 72 8 59 146 62 145 248 175 171 171 71 87 104 139 203 255 Established, Scaled Platforms Across Annaly’s Investment Strategies 5 Source: Company filings. Financial data as of June 30, 2026. Detailed endnotes and a glossary of defined terms are included at the end of this presentation. Agency Invests in Agency MBS & Agency CMBS securities collateralized by residential or commercial mortgages, guaranteed by Fannie Mae, Freddie Mac or Ginnie Mae $9.6bn Capital(2) $95.0bn Portfolio Assets(1) $3.8bn Capital(2) $10.4bn Portfolio Assets(1) Residential Credit Invests predominantly in Non-Agency residential mortgage assets within the securitized product and whole loan markets Mortgage Servicing Rights Invests in Mortgage Servicing Rights, which provide the obligation to service residential loans in exchange for a fixed servicing fee $3.5bn Capital(2) $4.1bn Portfolio Assets(1) Total Shareholders’ Equity: $16.9bn Total Portfolio(1): $109.4bn
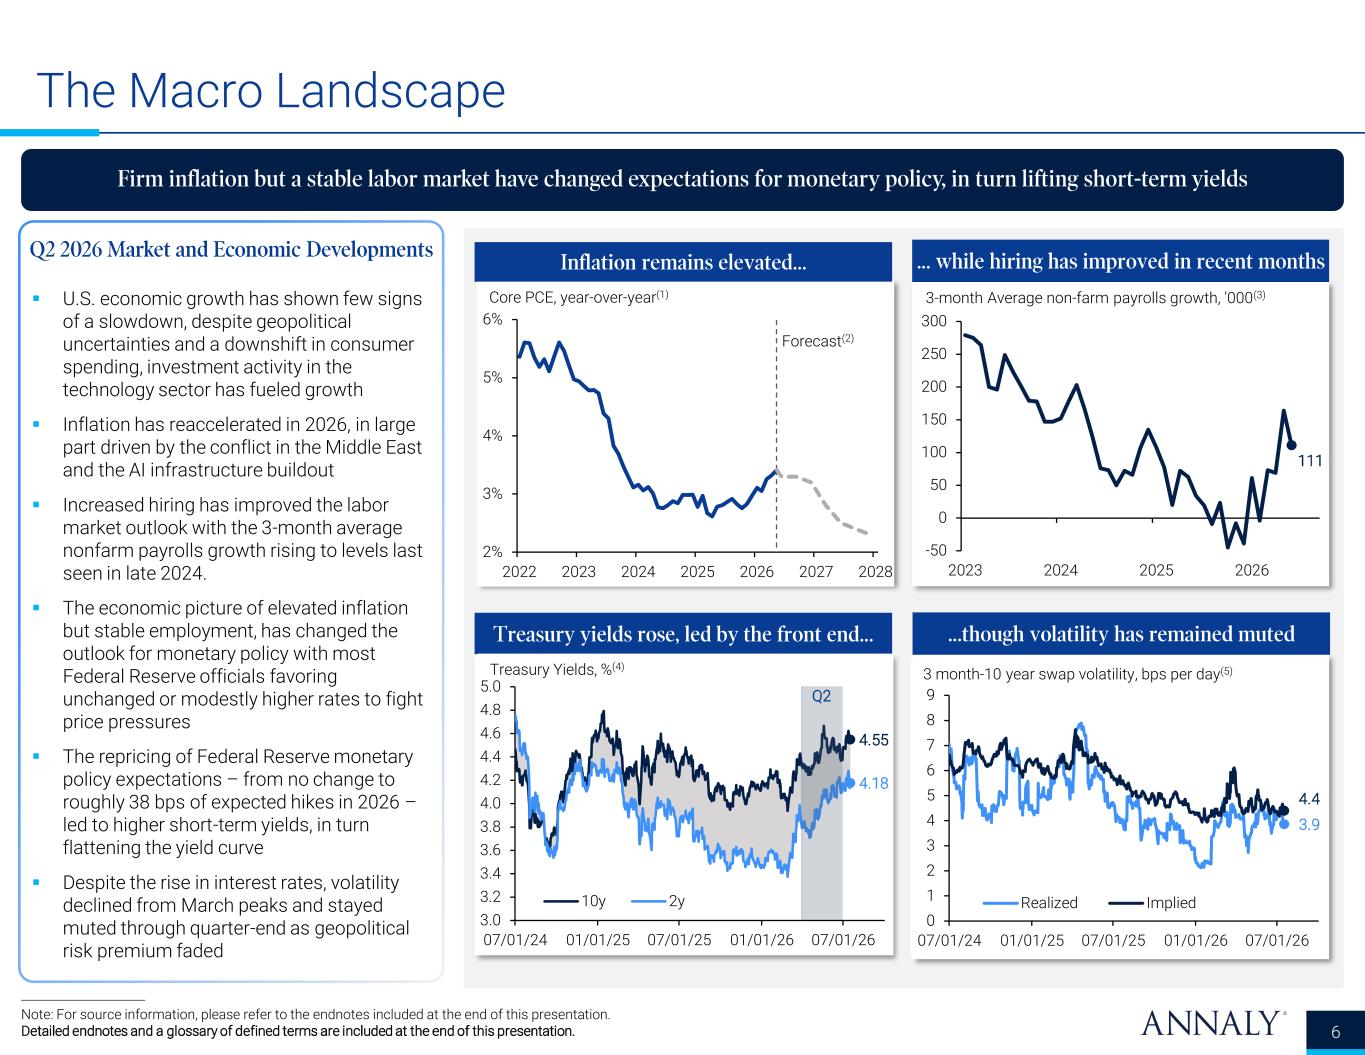
231 230 230 120 167 248 89 84 84 132 151 176 3 31 72 8 59 146 62 145 248 175 171 171 71 87 104 139 203 255 Q2 2026 Market and Economic Developments The Macro Landscape Note: For source information, please refer to the endnotes included at the end of this presentation. Detailed endnotes and a glossary of defined terms are included at the end of this presentation. Firm inflation but a stable labor market have changed expectations for monetary policy, in turn lifting short-term yields 6 ▪ U.S. economic growth has shown few signs of a slowdown, despite geopolitical uncertainties and a downshift in consumer spending, investment activity in the technology sector has fueled growth ▪ Inflation has reaccelerated in 2026, in large part driven by the conflict in the Middle East and the AI infrastructure buildout ▪ Increased hiring has improved the labor market outlook with the 3-month average nonfarm payrolls growth rising to levels last seen in late 2024. ▪ The economic picture of elevated inflation but stable employment, has changed the outlook for monetary policy with most Federal Reserve officials favoring unchanged or modestly higher rates to fight price pressures ▪ The repricing of Federal Reserve monetary policy expectations – from no change to roughly 38 bps of expected hikes in 2026 – led to higher short-term yields, in turn flattening the yield curve ▪ Despite the rise in interest rates, volatility declined from March peaks and stayed muted through quarter-end as geopolitical risk premium faded Treasury yields rose, led by the front end… Inflation remains elevated… …though volatility has remained muted … while hiring has improved in recent months 111 -50 0 50 100 150 200 250 300 2023 2024 2025 2026 3-month Average non-farm payrolls growth, '000(3) 4.55 4.18 3.0 3.2 3.4 3.6 3.8 4.0 4.2 4.4 4.6 4.8 5.0 07/01/24 01/01/25 07/01/25 01/01/26 07/01/26 10y 2y Treasury Yields, %(4) Q2 2% 3% 4% 5% 6% 2022 2023 2024 2025 2026 2027 2028 Core PCE, year-over-year(1) Forecast(2) 3.9 4.4 0 1 2 3 4 5 6 7 8 9 07/01/24 01/01/25 07/01/25 01/01/26 07/01/26 Realized Implied 3 month-10 year swap volatility, bps per day(5)
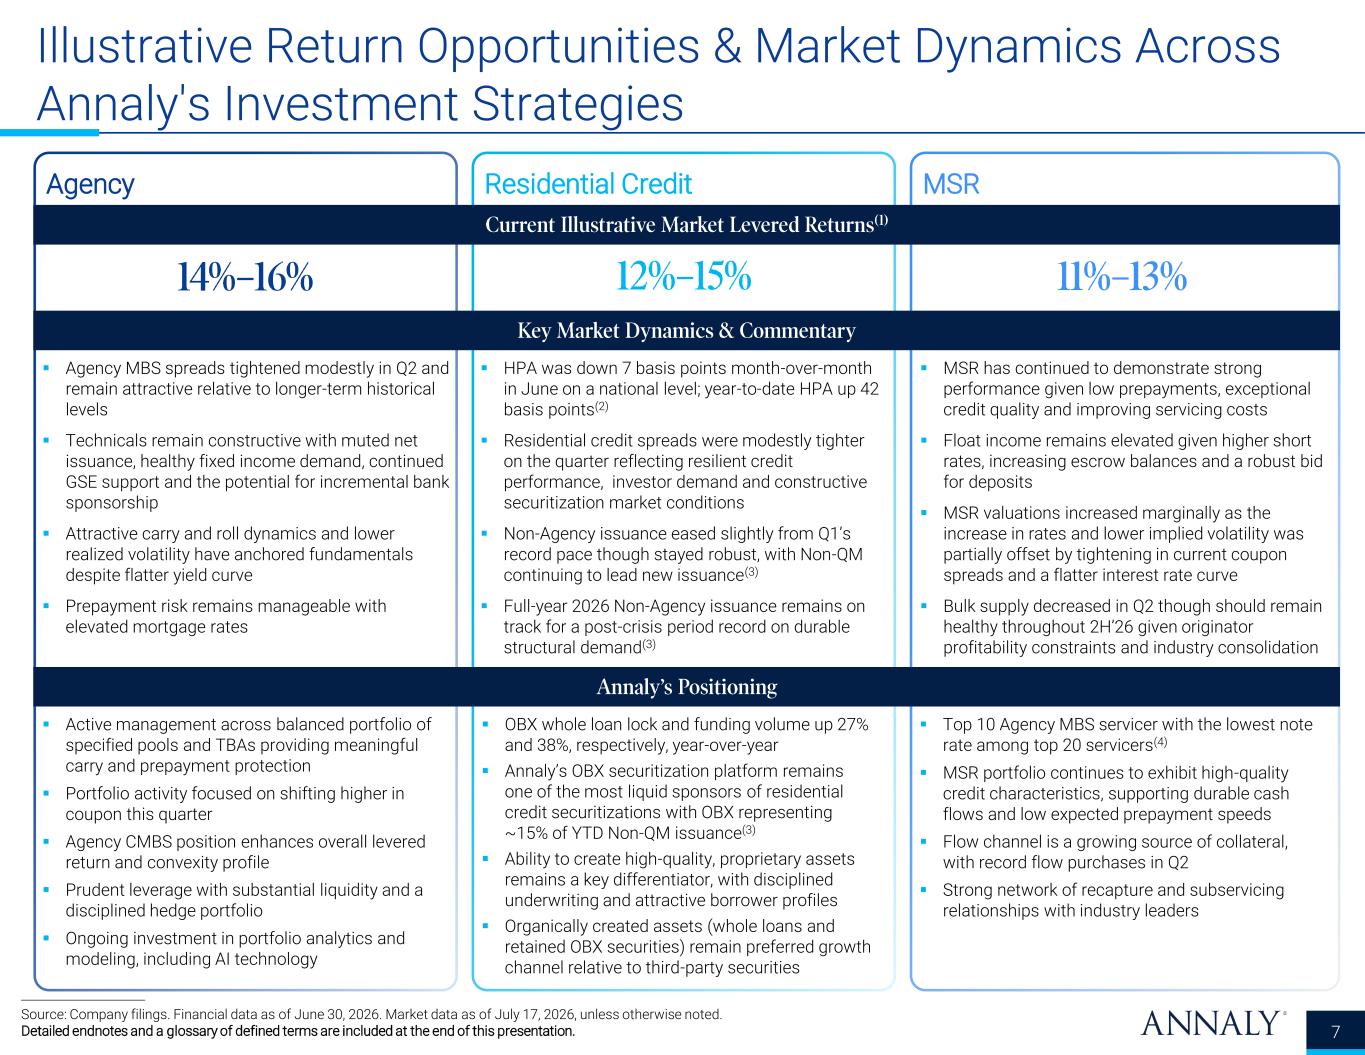
231 230 230 120 167 248 89 84 84 132 151 176 3 31 72 8 59 146 62 145 248 175 171 171 71 87 104 139 203 255 MSRResidential CreditAgency Key Market Dynamics & Commentary Current Illustrative Market Levered Returns(1) Illustrative Return Opportunities & Market Dynamics Across Annaly's Investment Strategies Source: Company filings. Financial data as of June 30, 2026. Market data as of July 17, 2026, unless otherwise noted. Detailed endnotes and a glossary of defined terms are included at the end of this presentation. ▪ Agency MBS spreads tightened modestly in Q2 and remain attractive relative to longer-term historical levels ▪ Technicals remain constructive with muted net issuance, healthy fixed income demand, continued GSE support and the potential for incremental bank sponsorship ▪ Attractive carry and roll dynamics and lower realized volatility have anchored fundamentals despite flatter yield curve ▪ Prepayment risk remains manageable with elevated mortgage rates ▪ HPA was down 7 basis points month-over-month in June on a national level; year-to-date HPA up 42 basis points(2) ▪ Residential credit spreads were modestly tighter on the quarter reflecting resilient credit performance, investor demand and constructive securitization market conditions ▪ Non-Agency issuance eased slightly from Q1’s record pace though stayed robust, with Non-QM continuing to lead new issuance(3) ▪ Full-year 2026 Non-Agency issuance remains on track for a post-crisis period record on durable structural demand(3) ▪ MSR has continued to demonstrate strong performance given low prepayments, exceptional credit quality and improving servicing costs ▪ Float income remains elevated given higher short rates, increasing escrow balances and a robust bid for deposits ▪ MSR valuations increased marginally as the increase in rates and lower implied volatility was partially offset by tightening in current coupon spreads and a flatter interest rate curve ▪ Bulk supply decreased in Q2 though should remain healthy throughout 2H’26 given originator profitability constraints and industry consolidation 14%–16% 12%–15% 11%–13% ▪ Top 10 Agency MBS servicer with the lowest note rate among top 20 servicers(4) ▪ MSR portfolio continues to exhibit high-quality credit characteristics, supporting durable cash flows and low expected prepayment speeds ▪ Flow channel is a growing source of collateral, with record flow purchases in Q2 ▪ Strong network of recapture and subservicing relationships with industry leaders ▪ OBX whole loan lock and funding volume up 27% and 38%, respectively, year-over-year ▪ Annaly’s OBX securitization platform remains one of the most liquid sponsors of residential credit securitizations with OBX representing ~15% of YTD Non-QM issuance(3) ▪ Ability to create high-quality, proprietary assets remains a key differentiator, with disciplined underwriting and attractive borrower profiles ▪ Organically created assets (whole loans and retained OBX securities) remain preferred growth channel relative to third-party securities ▪ Active management across balanced portfolio of specified pools and TBAs providing meaningful carry and prepayment protection ▪ Portfolio activity focused on shifting higher in coupon this quarter ▪ Agency CMBS position enhances overall levered return and convexity profile ▪ Prudent leverage with substantial liquidity and a disciplined hedge portfolio ▪ Ongoing investment in portfolio analytics and modeling, including AI technology 7 Annaly’s Positioning
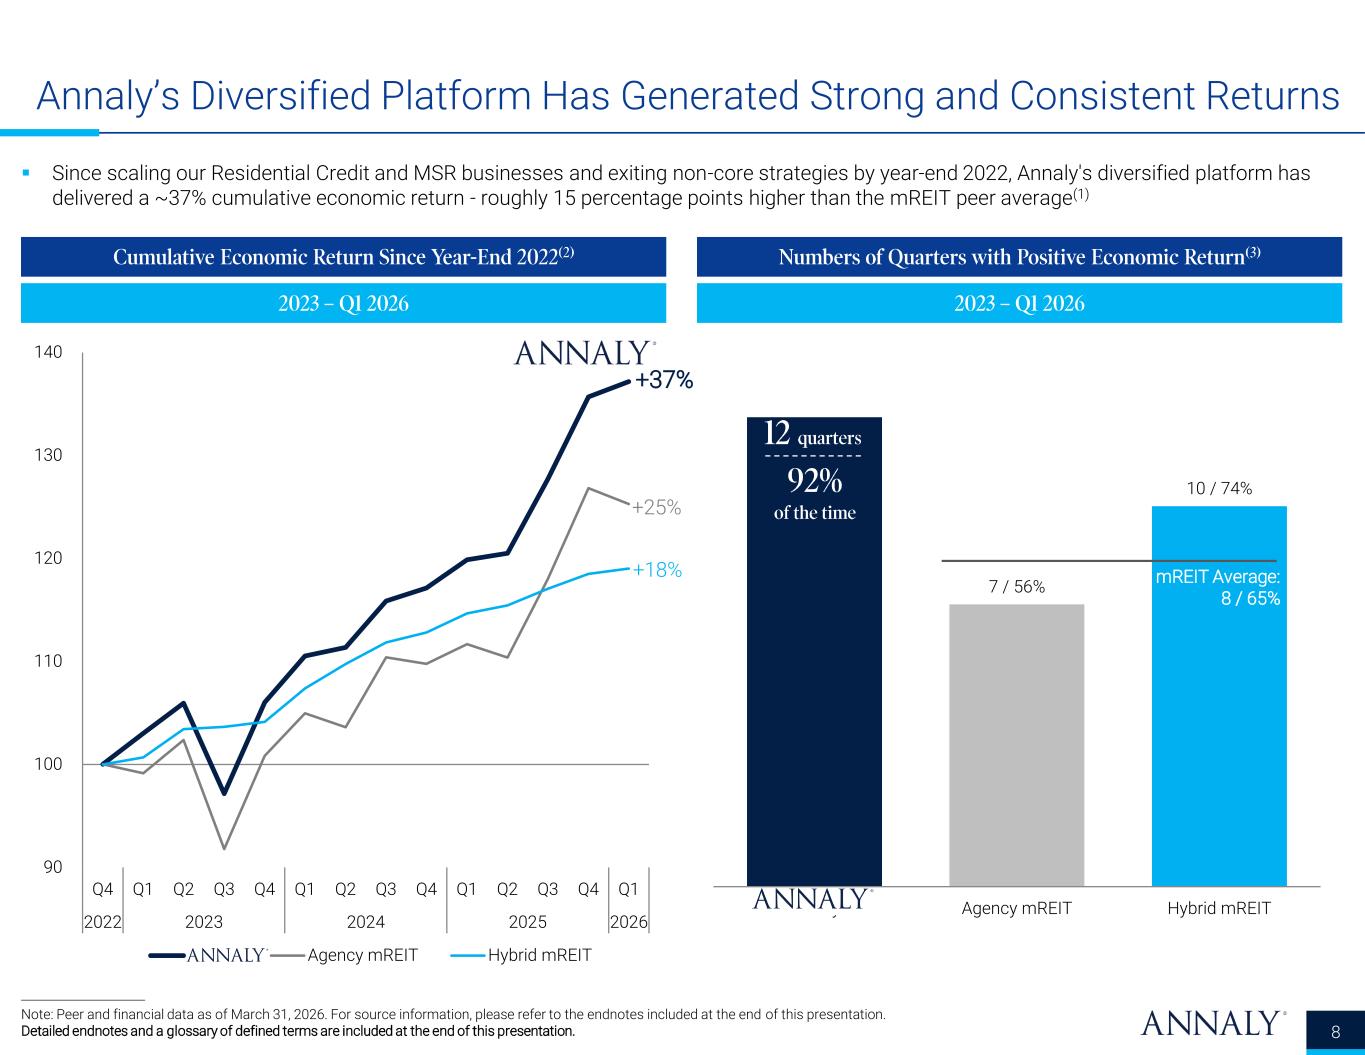
231 230 230 120 167 248 89 84 84 132 151 176 3 31 72 8 59 146 62 145 248 175 171 171 71 87 104 139 203 255 90 100 110 120 130 140 Q4 Q1 Q2 Q3 Q4 Q1 Q2 Q3 Q4 Q1 Q2 Q3 Q4 Q1 2022 2023 2024 2025 2026 Annaly Agency mREIT Hybrid mREIT 7 / 56% 10 / 74% Annaly Agency mREIT Hybrid mREIT Annaly’s Diversified Platform Has Generated Strong and Consistent Returns ▪ Since scaling our Residential Credit and MSR businesses and exiting non-core strategies by year-end 2022, Annaly's diversified platform has delivered a ~37% cumulative economic return - roughly 15 percentage points higher than the mREIT peer average(1) 8 Cumulative Economic Return Since Year-End 2022(2) Numbers of Quarters with Positive Economic Return(3) +37% Note: Peer and financial data as of March 31, 2026. For source information, please refer to the endnotes included at the end of this presentation. Detailed endnotes and a glossary of defined terms are included at the end of this presentation. +25% +18% 12 quarters 92% of the time mREIT Average: 8 / 65% 2023 – Q1 2026 2023 – Q1 2026

Business Update
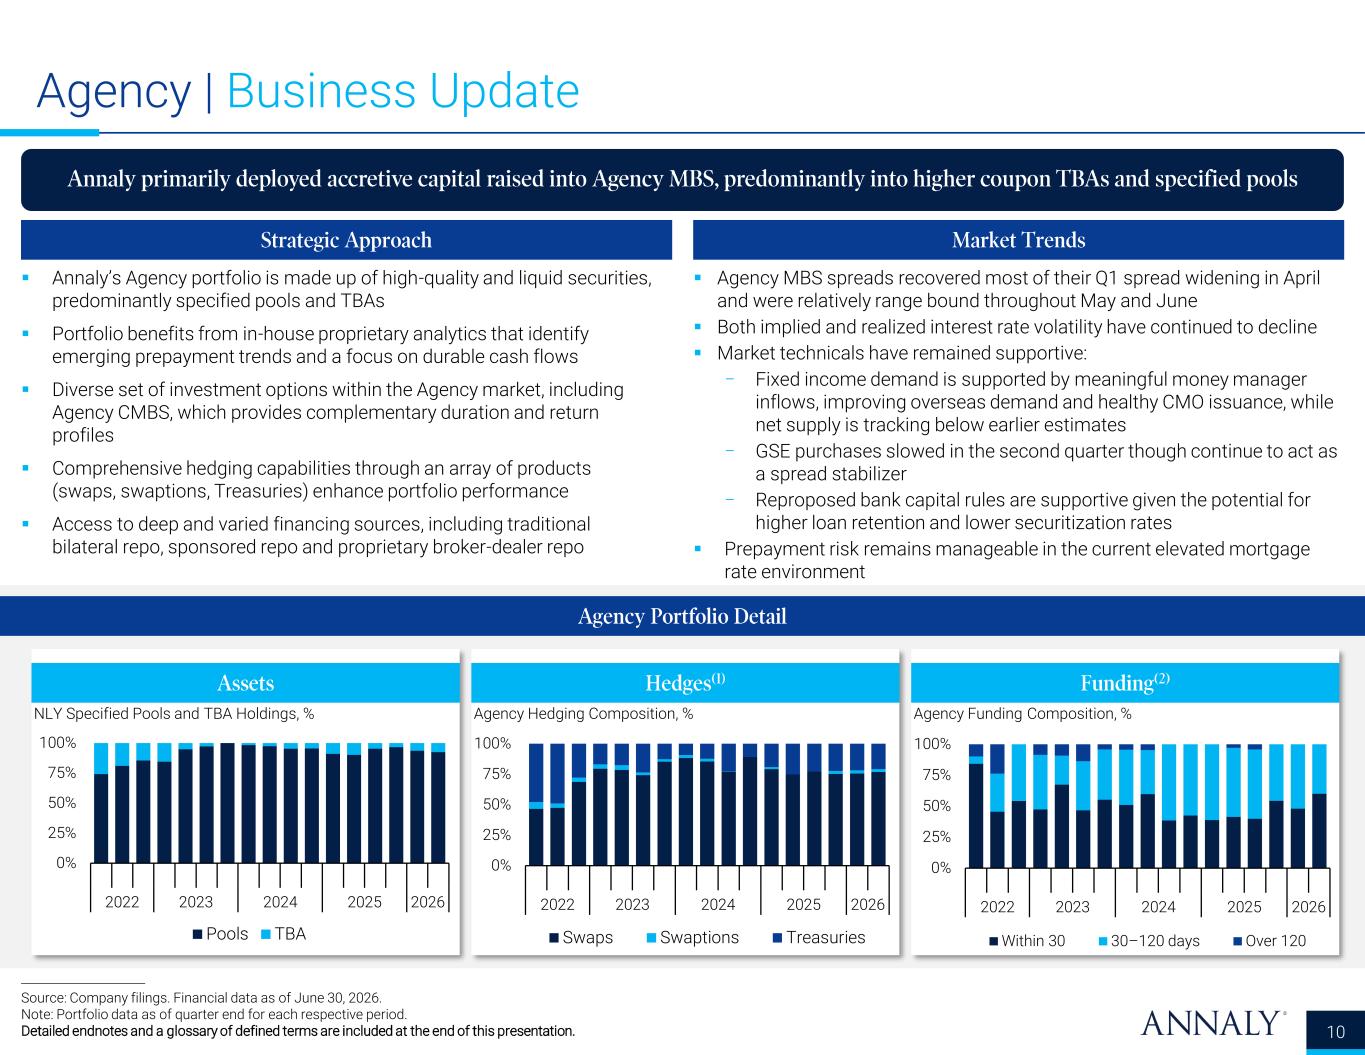
231 230 230 120 167 248 89 84 84 132 151 176 3 31 72 8 59 146 62 145 248 175 171 171 71 87 104 139 203 255 ▪ Annaly’s Agency portfolio is made up of high-quality and liquid securities, predominantly specified pools and TBAs ▪ Portfolio benefits from in-house proprietary analytics that identify emerging prepayment trends and a focus on durable cash flows ▪ Diverse set of investment options within the Agency market, including Agency CMBS, which provides complementary duration and return profiles ▪ Comprehensive hedging capabilities through an array of products (swaps, swaptions, Treasuries) enhance portfolio performance ▪ Access to deep and varied financing sources, including traditional bilateral repo, sponsored repo and proprietary broker-dealer repo Agency | Business Update Annaly primarily deployed accretive capital raised into Agency MBS, predominantly into higher coupon TBAs and specified pools 10 Source: Company filings. Financial data as of June 30, 2026. Note: Portfolio data as of quarter end for each respective period. Detailed endnotes and a glossary of defined terms are included at the end of this presentation. Agency Portfolio Detail Assets Hedges(1) Funding(2) Strategic Approach ▪ Agency MBS spreads recovered most of their Q1 spread widening in April and were relatively range bound throughout May and June ▪ Both implied and realized interest rate volatility have continued to decline ▪ Market technicals have remained supportive: − Fixed income demand is supported by meaningful money manager inflows, improving overseas demand and healthy CMO issuance, while net supply is tracking below earlier estimates − GSE purchases slowed in the second quarter though continue to act as a spread stabilizer − Reproposed bank capital rules are supportive given the potential for higher loan retention and lower securitization rates ▪ Prepayment risk remains manageable in the current elevated mortgage rate environment Market Trends 0% 25% 50% 75% 100% 2022 2023 2024 2025 2026 Pools TBA NLY Specified Pools and TBA Holdings, % 0% 25% 50% 75% 100% 2022 2023 2024 2025 2026 Swaps Swaptions Treasuries Agency Hedging Composition, % 0% 25% 50% 75% 100% 2022 2023 2024 2025 2026 Within 30 30–120 days Over 120 Agency Funding Composition, %
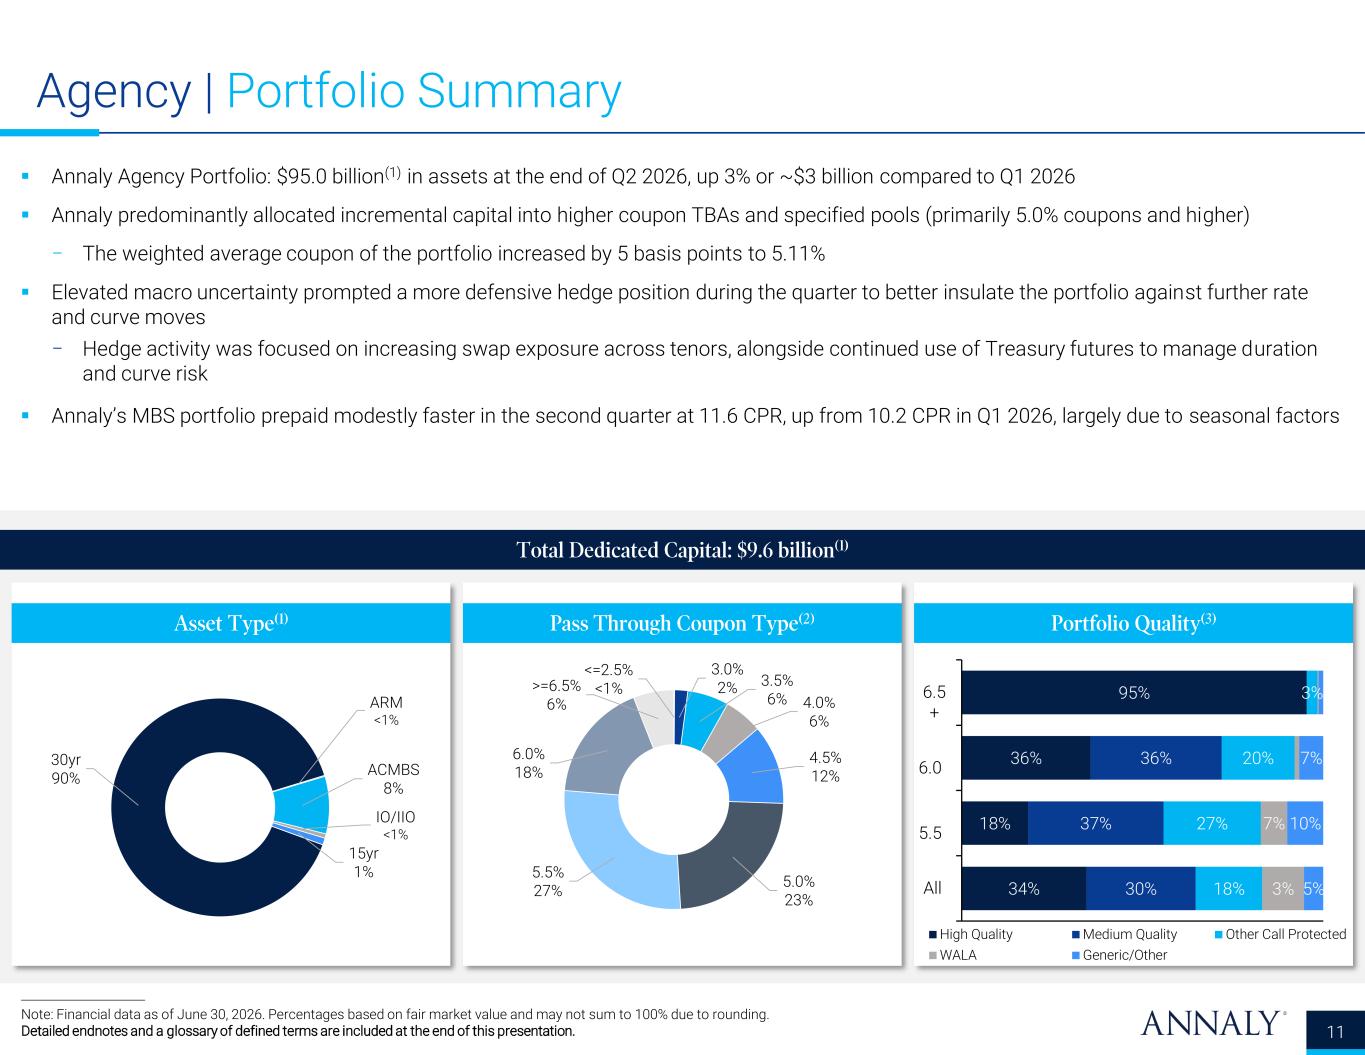
231 230 230 120 167 248 89 84 84 132 151 176 3 31 72 8 59 146 62 145 248 175 171 171 71 87 104 139 203 255 34% 18% 36% 95% 30% 37% 36% 18% 27% 20% 3% 3% 7% 5% 10% 7% All 5.5 6.0 6.5 + High Quality Medium Quality Other Call Protected WALA Generic/Other Agency | Portfolio Summary 11 Total Dedicated Capital: $9.6 billion(1) Note: Financial data as of June 30, 2026. Percentages based on fair market value and may not sum to 100% due to rounding. Detailed endnotes and a glossary of defined terms are included at the end of this presentation. ▪ Annaly Agency Portfolio: $95.0 billion(1) in assets at the end of Q2 2026, up 3% or ~$3 billion compared to Q1 2026 ▪ Annaly predominantly allocated incremental capital into higher coupon TBAs and specified pools (primarily 5.0% coupons and higher) − The weighted average coupon of the portfolio increased by 5 basis points to 5.11% ▪ Elevated macro uncertainty prompted a more defensive hedge position during the quarter to better insulate the portfolio against further rate and curve moves − Hedge activity was focused on increasing swap exposure across tenors, alongside continued use of Treasury futures to manage duration and curve risk ▪ Annaly’s MBS portfolio prepaid modestly faster in the second quarter at 11.6 CPR, up from 10.2 CPR in Q1 2026, largely due to seasonal factors Asset Type (1) Pass Through Coupon Type (2) Portfolio Quality(3) <=2.5% <1% 3.0% 2% 3.5% 6% 4.0% 6% 4.5% 12% 5.0% 23% 5.5% 27% 6.0% 18% >=6.5% 6% 30yr 90% ARM <1% ACMBS 8% IO/IIO <1% 15yr 1%
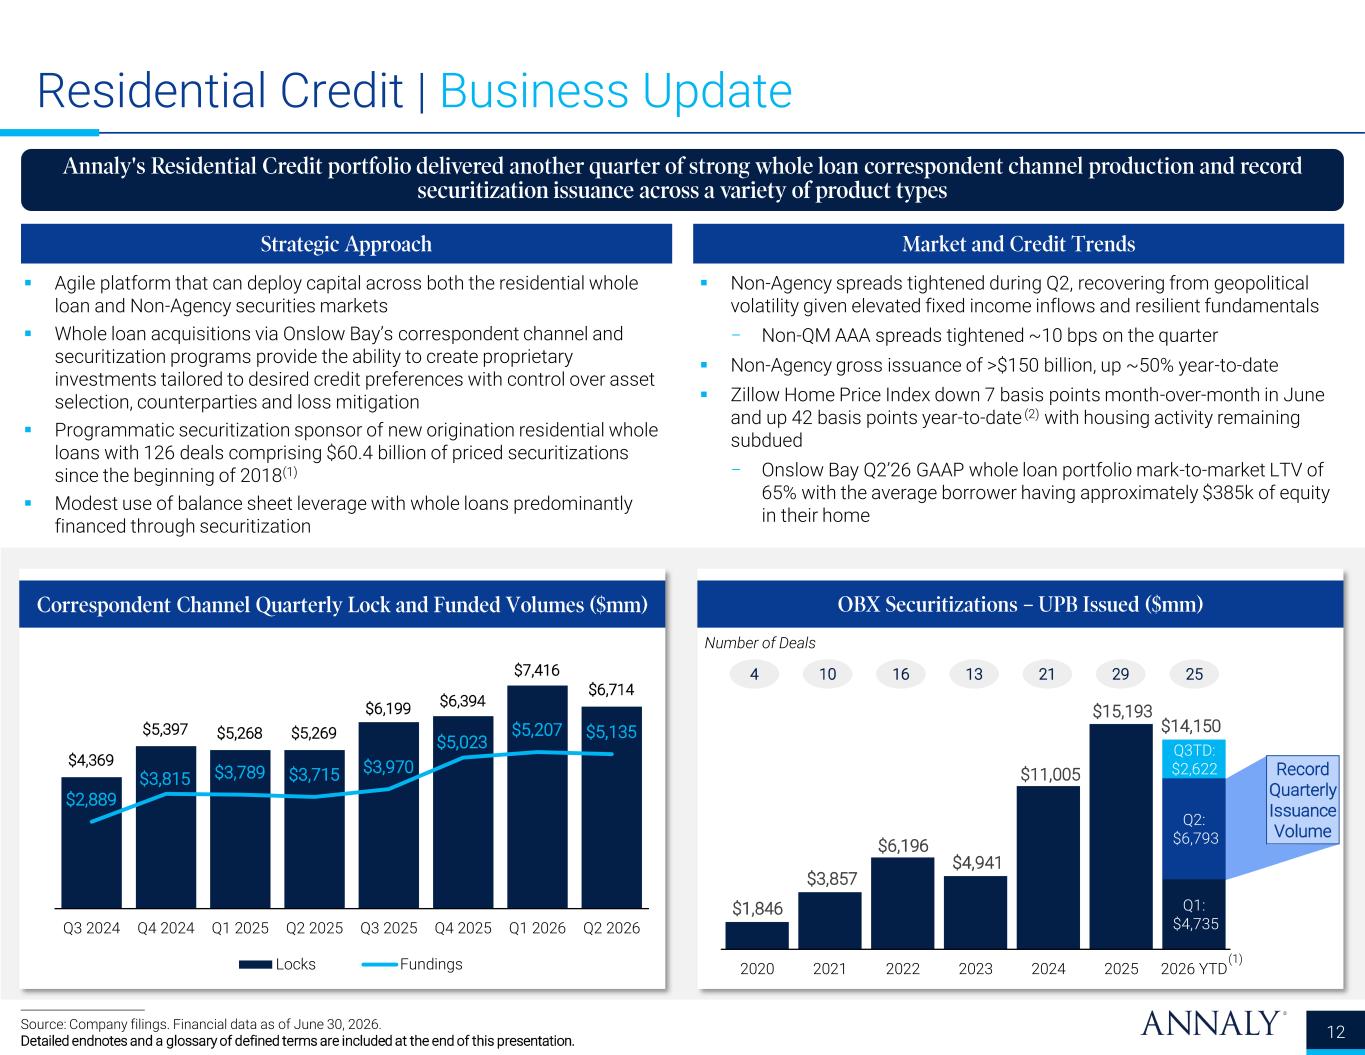
231 230 230 120 167 248 89 84 84 132 151 176 3 31 72 8 59 146 62 145 248 175 171 171 71 87 104 139 203 255 Residential Credit | Business Update Annaly's Residential Credit portfolio delivered another quarter of strong whole loan correspondent channel production and reco d securitization issuance across a variety of product types 12 Source: Company filings. Financial data as of June 30, 2026. Detailed endnotes and a glossary of defined terms are included at the end of this presentation. ▪ Agile platform that can deploy capital across both the residential whole loan and Non-Agency securities markets ▪ Whole loan acquisitions via Onslow Bay’s correspondent channel and securitization programs provide the ability to create proprietary investments tailored to desired credit preferences with control over asset selection, counterparties and loss mitigation ▪ Programmatic securitization sponsor of new origination residential whole loans with 126 deals comprising $60.4 billion of priced securitizations since the beginning of 2018(1) ▪ Modest use of balance sheet leverage with whole loans predominantly financed through securitization Strategic Approach ▪ Non-Agency spreads tightened during Q2, recovering from geopolitical volatility given elevated fixed income inflows and resilient fundamentals − Non-QM AAA spreads tightened ~10 bps on the quarter ▪ Non-Agency gross issuance of >$150 billion, up ~50% year-to-date ▪ Zillow Home Price Index down 7 basis points month-over-month in June and up 42 basis points year-to-date (2) with housing activity remaining subdued − Onslow Bay Q2’26 GAAP whole loan portfolio mark-to-market LTV of 65% with the average borrower having approximately $385k of equity in their home Market and Credit Trends Correspondent Channel Quarterly Lock and Funded Volumes ($mm) OBX Securitizations – UPB Issued ($mm) 4 131610 21 29 25 Number of Deals Record Quarterly Issuance Volume (1) Q1: $4,735 Q2: $6,793 Q3TD: $2,622 $1,846 $3,857 $6,196 $4,941 $11,005 $15,193 $14,150 2020 2021 2022 2023 2024 2025 2026 YTD $4,369 $5,397 $5,268 $5,269 $6,199 $6,394 $7,416 $6,714 $2,889 $3,815 $3,789 $3,715 $3,970 $5,023 $5,207 $5,135 Q3 2024 Q4 2024 Q1 2025 Q2 2025 Q3 2025 Q4 2025 Q1 2026 Q2 2026 Locks Fundings
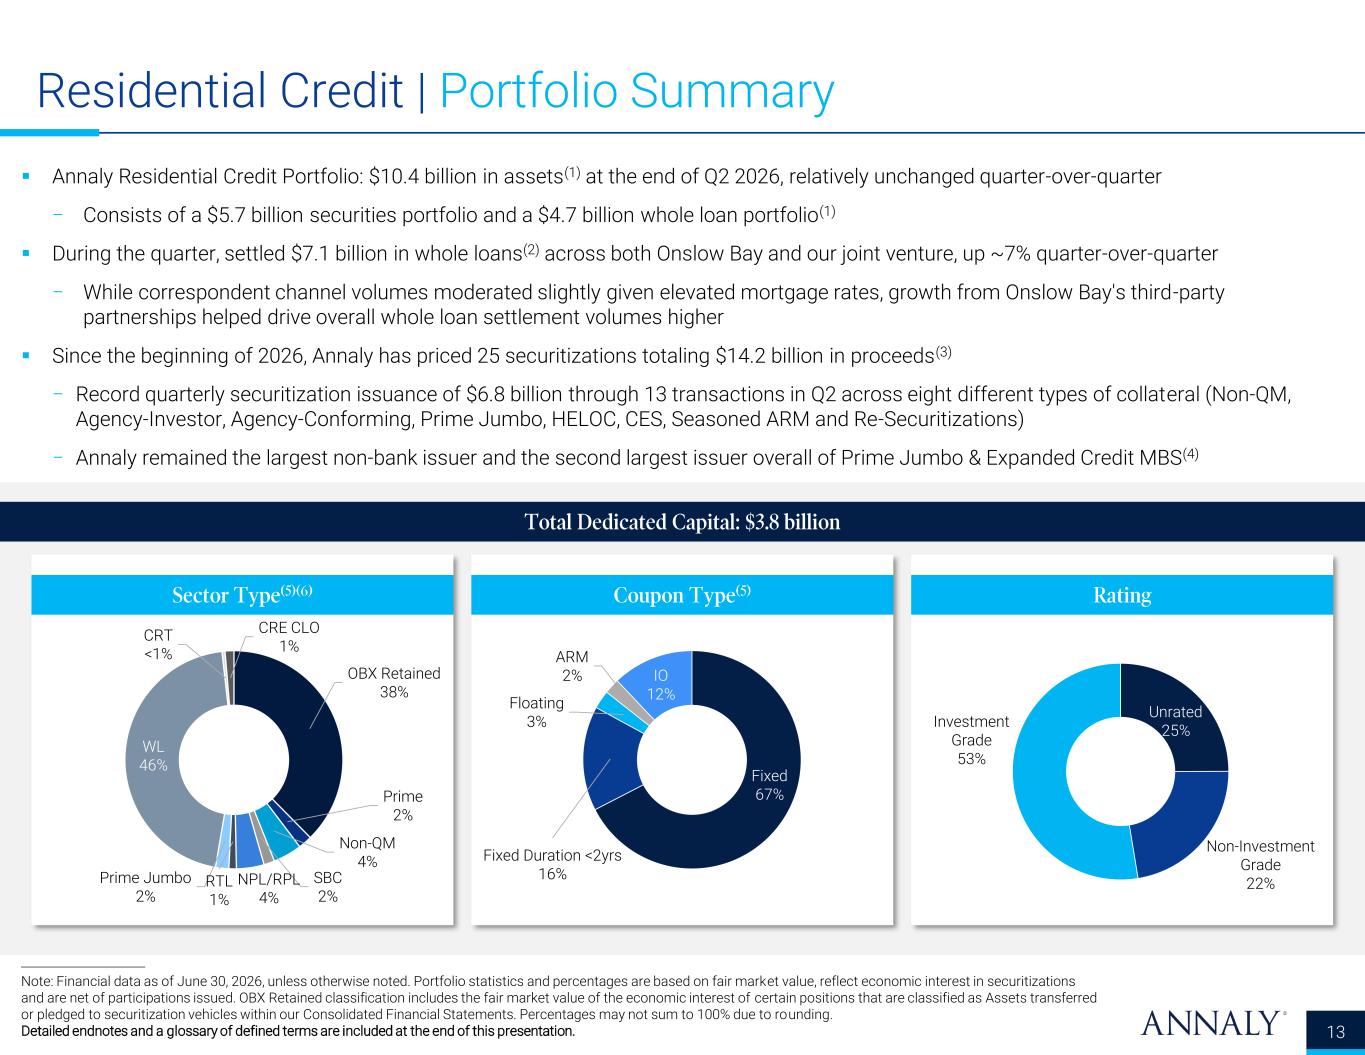
231 230 230 120 167 248 89 84 84 132 151 176 3 31 72 8 59 146 62 145 248 175 171 171 71 87 104 139 203 255 Residential Credit | Portfolio Summary ▪ Annaly Residential Credit Portfolio: $10.4 billion in assets(1) at the end of Q2 2026, relatively unchanged quarter-over-quarter − Consists of a $5.7 billion securities portfolio and a $4.7 billion whole loan portfolio(1) ▪ During the quarter, settled $7.1 billion in whole loans(2) across both Onslow Bay and our joint venture, up ~7% quarter-over-quarter − While correspondent channel volumes moderated slightly given elevated mortgage rates, growth from Onslow Bay's third-party partnerships helped drive overall whole loan settlement volumes higher ▪ Since the beginning of 2026, Annaly has priced 25 securitizations totaling $14.2 billion in proceeds(3) − Record quarterly securitization issuance of $6.8 billion through 13 transactions in Q2 across eight different types of collateral (Non-QM, Agency-Investor, Agency-Conforming, Prime Jumbo, HELOC, CES, Seasoned ARM and Re-Securitizations) − Annaly remained the largest non-bank issuer and the second largest issuer overall of Prime Jumbo & Expanded Credit MBS(4) 13 Note: Financial data as of June 30, 2026, unless otherwise noted. Portfolio statistics and percentages are based on fair market value, reflect economic interest in securitizations and are net of participations issued. OBX Retained classification includes the fair market value of the economic interest of certain positions that are classified as Assets transferred or pledged to securitization vehicles within our Consolidated Financial Statements. Percentages may not sum to 100% due to rounding. Detailed endnotes and a glossary of defined terms are included at the end of this presentation. Total Dedicated Capital: $3.8 billion Sector Type(5)(6) Coupon Type (5) Rating Unrated 25% Non-Investment Grade 22% Investment Grade 53% Fixed 67% Fixed Duration <2yrs 16% Floating 3% ARM 2% IO 12% OBX Retained 38% Prime 2% Non-QM 4% SBC 2% NPL/RPL 4% RTL 1% Prime Jumbo 2% WL 46% CRT <1% CRE CLO 1%
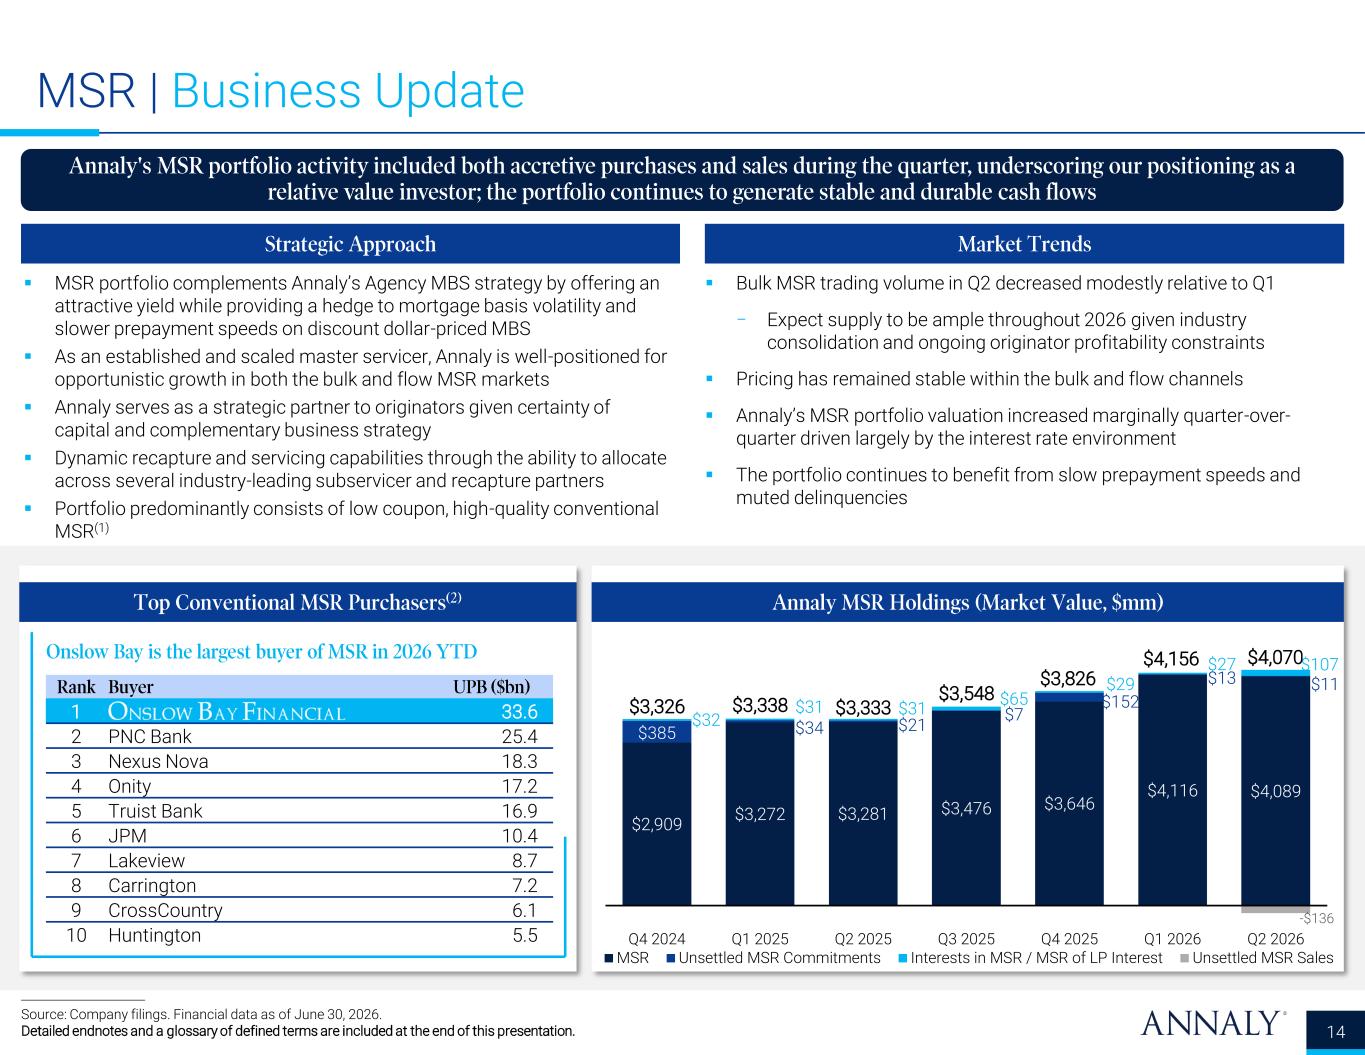
231 230 230 120 167 248 89 84 84 132 151 176 3 31 72 8 59 146 62 145 248 175 171 171 71 87 104 139 203 255 MSR | Business Update 14 Source: Company filings. Financial data as of June 30, 2026. Detailed endnotes and a glossary of defined terms are included at the end of this presentation. Annaly MSR Holdings (Market Value, $mm) Annaly's MSR portfolio activity included both accretive purchases and sales during the quarter, underscoring our positioning as a relative value investor; the portfolio continues to generate stable and durable cash flows ▪ MSR portfolio complements Annaly’s Agency MBS strategy by offering an attractive yield while providing a hedge to mortgage basis volatility and slower prepayment speeds on discount dollar-priced MBS ▪ As an established and scaled master servicer, Annaly is well-positioned for opportunistic growth in both the bulk and flow MSR markets ▪ Annaly serves as a strategic partner to originators given certainty of capital and complementary business strategy ▪ Dynamic recapture and servicing capabilities through the ability to allocate across several industry-leading subservicer and recapture partners ▪ Portfolio predominantly consists of low coupon, high-quality conventional MSR(1) Strategic Approach ▪ Bulk MSR trading volume in Q2 decreased modestly relative to Q1 − Expect supply to be ample throughout 2026 given industry consolidation and ongoing originator profitability constraints ▪ Pricing has remained stable within the bulk and flow channels ▪ Annaly’s MSR portfolio valuation increased marginally quarter-over- quarter driven largely by the interest rate environment ▪ The portfolio continues to benefit from slow prepayment speeds and muted delinquencies Market Trends Top Conventional MSR Purchasers(2) Onslow Bay is the largest buyer of MSR in 2026 YTD Rank Buyer UPB ($bn) 1 33.6 2 PNC Bank 25.4 3 Nexus Nova 18.3 4 Onity 17.2 5 Truist Bank 16.9 6 JPM 10.4 7 Lakeview 8.7 8 Carrington 7.2 9 CrossCountry 6.1 10 Huntington 5.5 $2,909 $3,272 $3,281 $3,476 $3,646 $4,116 $4,089 $385 $34 $21 $7 $152 $13 $11 $32 $31 $31 $65 $29 $27 $107 $3,326 $3,338 $3,333 $3,548 $3,826 $4,156 $4,070 -$136 Q4 2024 Q1 2025 Q2 2025 Q3 2025 Q4 2025 Q1 2026 Q2 2026 MSR Unsettled MSR Commitments Interests in MSR / MSR of LP Interest Unsettled MSR Sales
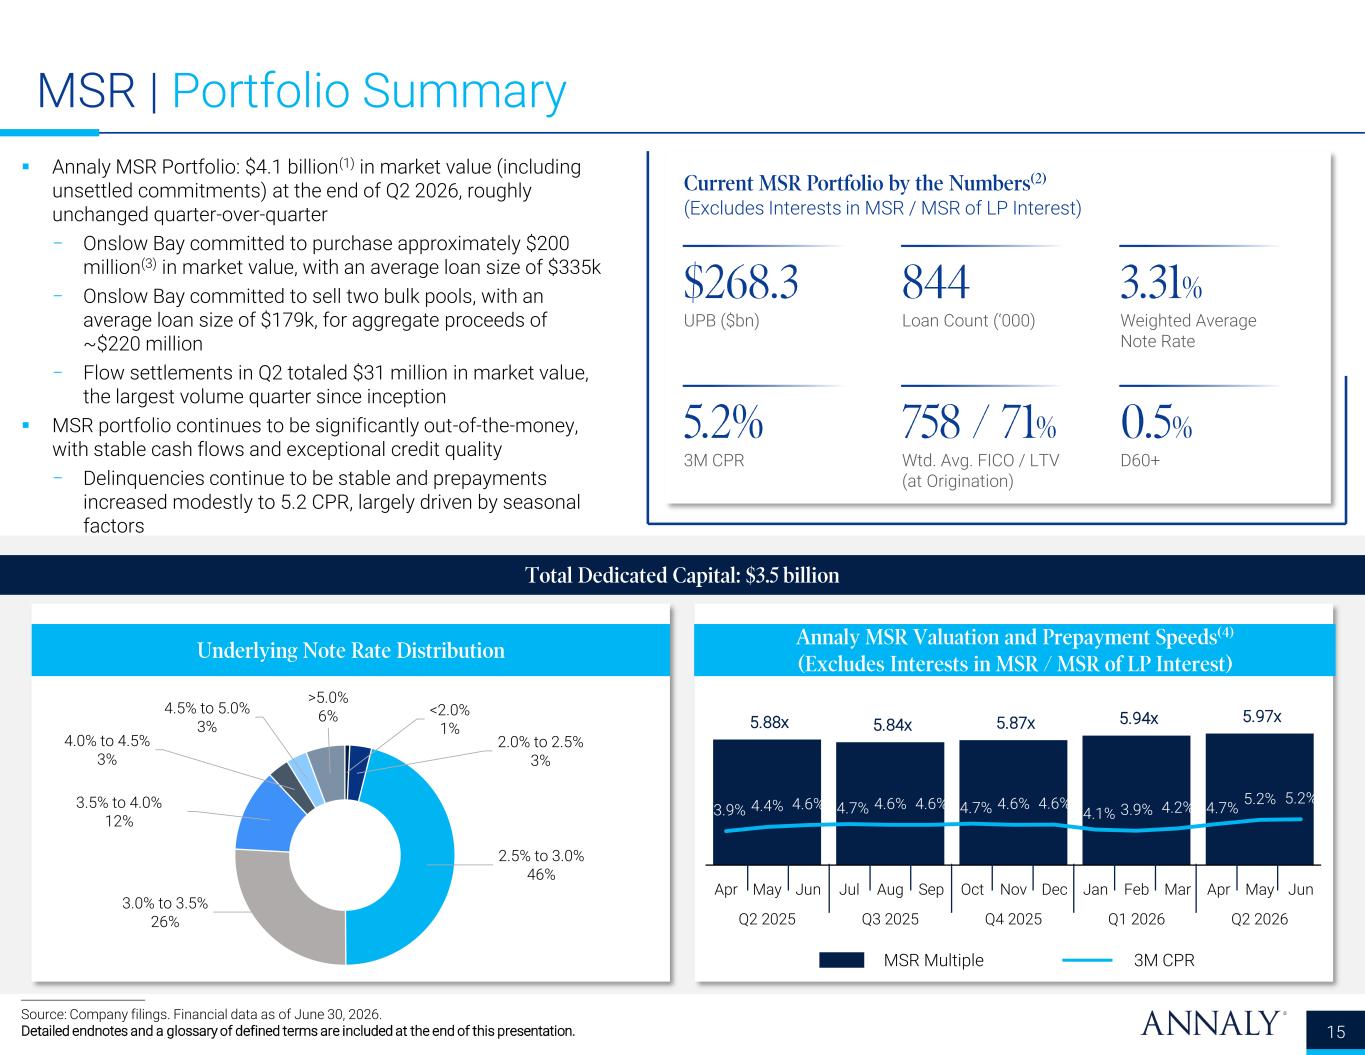
231 230 230 120 167 248 89 84 84 132 151 176 3 31 72 8 59 146 62 145 248 175 171 171 71 87 104 139 203 255 MSR | Portfolio Summary 15 Source: Company filings. Financial data as of June 30, 2026. Detailed endnotes and a glossary of defined terms are included at the end of this presentation. Current MSR Portfolio by the Numbers(2) (Excludes Interests in MSR / MSR of LP Interest) 3M CPR 5.2% UPB ($bn) $268.3 Loan Count (‘000) 844 Weighted Average Note Rate 3.31% Wtd. Avg. FICO / LTV (at Origination) 758 / 71% D60+ 0.5% Total Dedicated Capital: $3.5 billion Underlying Note Rate Distribution Annaly MSR Valuation and Prepayment Speeds(4) (Excludes Interests in MSR / MSR of LP Interest) MSR Multiple 3M CPR ▪ Annaly MSR Portfolio: $4.1 billion(1) in market value (including unsettled commitments) at the end of Q2 2026, roughly unchanged quarter-over-quarter − Onslow Bay committed to purchase approximately $200 million(3) in market value, with an average loan size of $335k − Onslow Bay committed to sell two bulk pools, with an average loan size of $179k, for aggregate proceeds of ~$220 million − Flow settlements in Q2 totaled $31 million in market value, the largest volume quarter since inception ▪ MSR portfolio continues to be significantly out-of-the-money, with stable cash flows and exceptional credit quality − Delinquencies continue to be stable and prepayments increased modestly to 5.2 CPR, largely driven by seasonal factors <2.0% 1% 2.0% to 2.5% 3% 2.5% to 3.0% 46% 3.0% to 3.5% 26% 3.5% to 4.0% 12% 4.0% to 4.5% 3% 4.5% to 5.0% 3% >5.0% 6% 5.88x 5.84x 5.87x 5.94x 5.97x 3.9% 4.4% 4.6% 4.7% 4.6% 4.6% 4.7% 4.6% 4.6% 4.1% 3.9% 4.2% 4.7% 5.2% 5.2% Apr May Jun Jul Aug Sep Oct Nov Dec Jan Feb Mar Apr May Jun Q2 2025 Q3 2025 Q4 2025 Q1 2026 Q2 2026

Financial Highlights and Trends
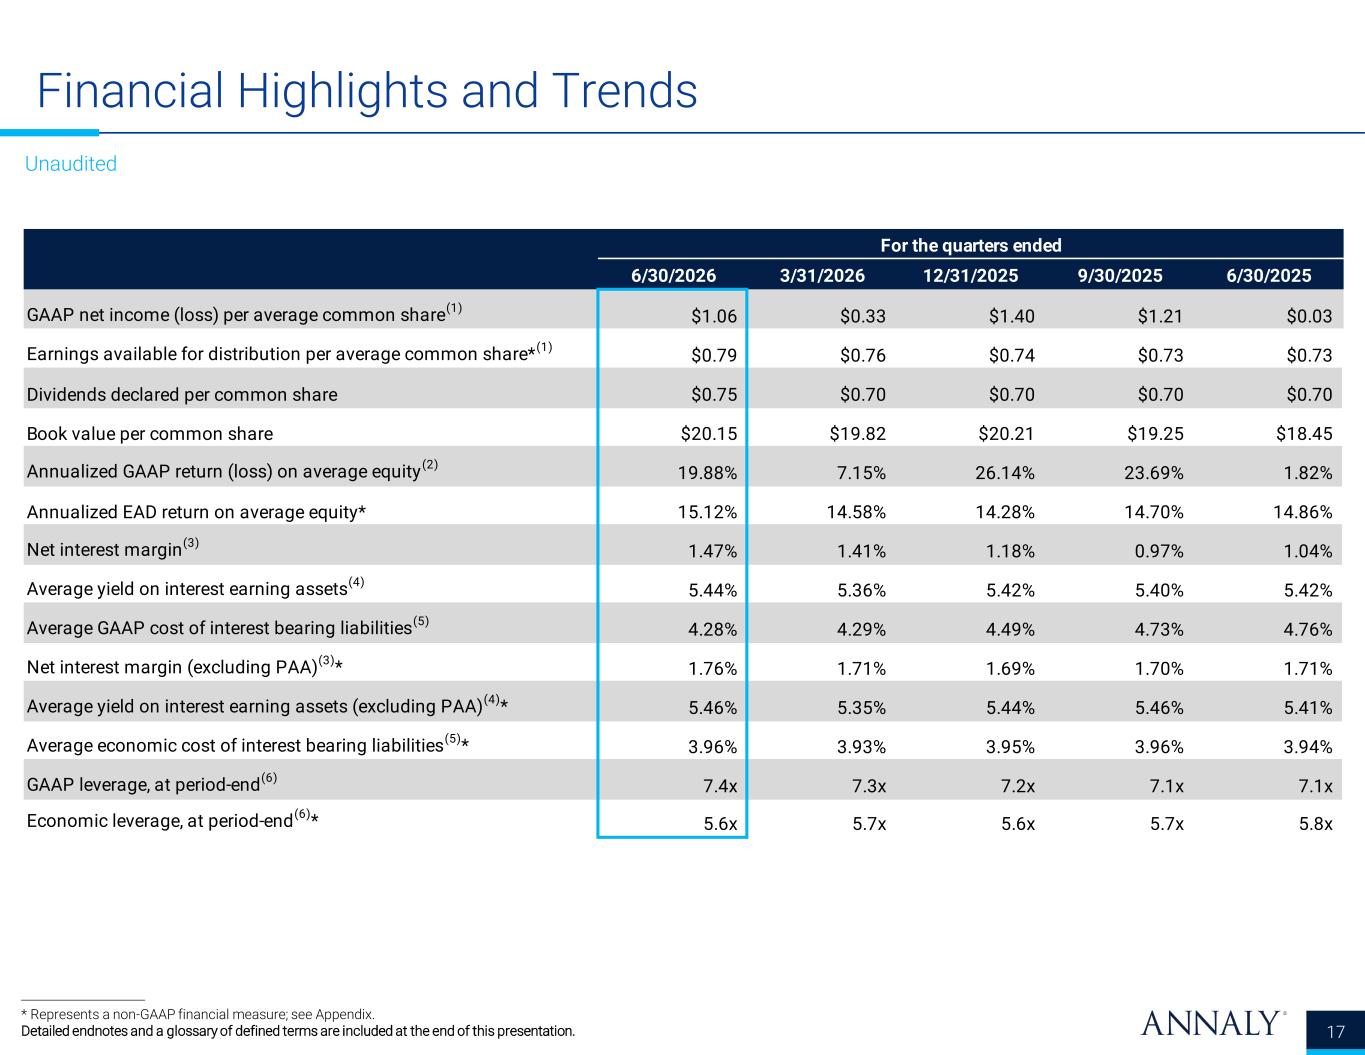
231 230 230 120 167 248 89 84 84 132 151 176 3 31 72 8 59 146 62 145 248 175 171 171 71 87 104 139 203 255 Financial Highlights and Trends 17 * Represents a non-GAAP financial measure; see Appendix. Detailed endnotes and a glossary of defined terms are included at the end of this presentation. Unaudited For the quarters ended 6/30/2026 3/31/2026 12/31/2025 9/30/2025 6/30/2025 GAAP net income (loss) per average common share (1) $1.06 $0.33 $1.40 $1.21 $0.03 Earnings available for distribution per average common share* (1) $0.79 $0.76 $0.74 $0.73 $0.73 Dividends declared per common share $0.75 $0.70 $0.70 $0.70 $0.70 Book value per common share $20.15 $19.82 $20.21 $19.25 $18.45 Annualized GAAP return (loss) on average equity (2) 19.88% 7.15% 26.14% 23.69% 1.82% Annualized EAD return on average equity* 15.12% 14.58% 14.28% 14.70% 14.86% Net interest margin(3) 1.47% 1.41% 1.18% 0.97% 1.04% Average yield on interest earning assets(4) 5.44% 5.36% 5.42% 5.40% 5.42% Average GAAP cost of interest bearing liabilities(5) 4.28% 4.29% 4.49% 4.73% 4.76% Net interest margin (excluding PAA)(3)* 1.76% 1.71% 1.69% 1.70% 1.71% Average yield on interest earning assets (excluding PAA)(4)* 5.46% 5.35% 5.44% 5.46% 5.41% Average economic cost of interest bearing liabilities(5)* 3.96% 3.93% 3.95% 3.96% 3.94% GAAP leverage, at period-end(6) 7.4x 7.3x 7.2x 7.1x 7.1x Economic leverage, at period-end (6) * 5.6x 5.7x 5.6x 5.7x 5.8x
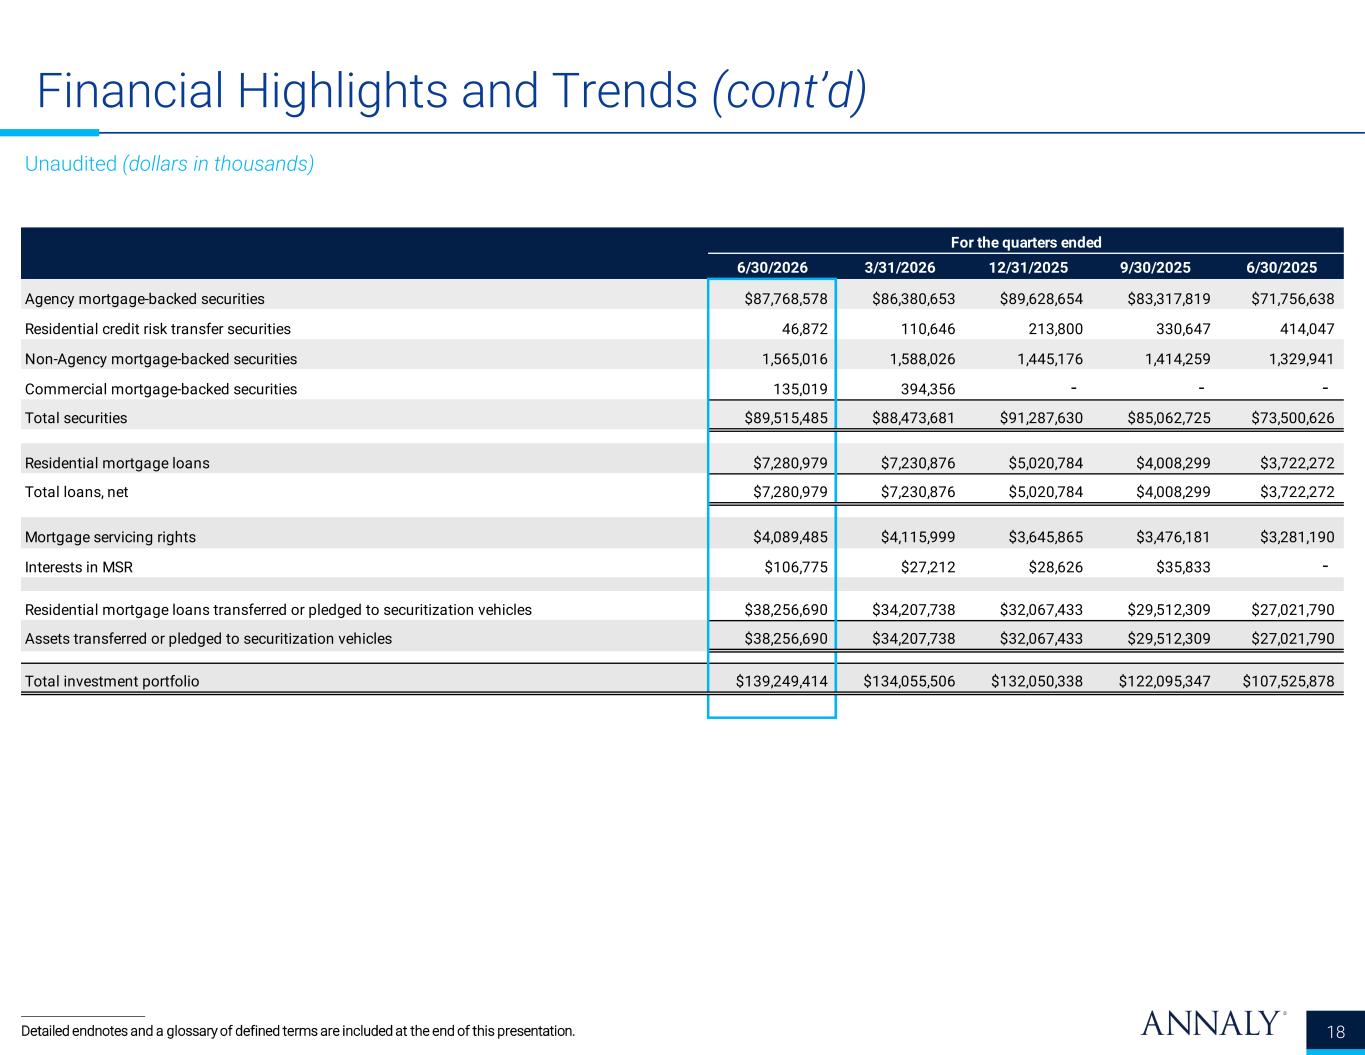
231 230 230 120 167 248 89 84 84 132 151 176 3 31 72 8 59 146 62 145 248 175 171 171 71 87 104 139 203 255 Financial Highlights and Trends (cont’d) 18 Unaudited (dollars in thousands) Detailed endnotes and a glossary of defined terms are included at the end of this presentation. For the quarters ended 6/30/2026 3/31/2026 12/31/2025 9/30/2025 6/30/2025 Agency mortgage-backed securities $87,768,578 $86,380,653 $89,628,654 $83,317,819 $71,756,638 Residential credit risk transfer securities 46,872 110,646 213,800 330,647 414,047 Non-Agency mortgage-backed securities 1,565,016 1,588,026 1,445,176 1,414,259 1,329,941 Commercial mortgage-backed securities 135,019 394,356 - - - Total securities $89,515,485 $88,473,681 $91,287,630 $85,062,725 $73,500,626 Residential mortgage loans $7,280,979 $7,230,876 $5,020,784 $4,008,299 $3,722,272 Total loans, net $7,280,979 $7,230,876 $5,020,784 $4,008,299 $3,722,272 Mortgage servicing rights $4,089,485 $4,115,999 $3,645,865 $3,476,181 $3,281,190 Interests in MSR $106,775 $27,212 $28,626 $35,833 - Residential mortgage loans transferred or pledged to securitization vehicles $38,256,690 $34,207,738 $32,067,433 $29,512,309 $27,021,790 Assets transferred or pledged to securitization vehicles $38,256,690 $34,207,738 $32,067,433 $29,512,309 $27,021,790 Total investment portfolio $139,249,414 $134,055,506 $132,050,338 $122,095,347 $107,525,878
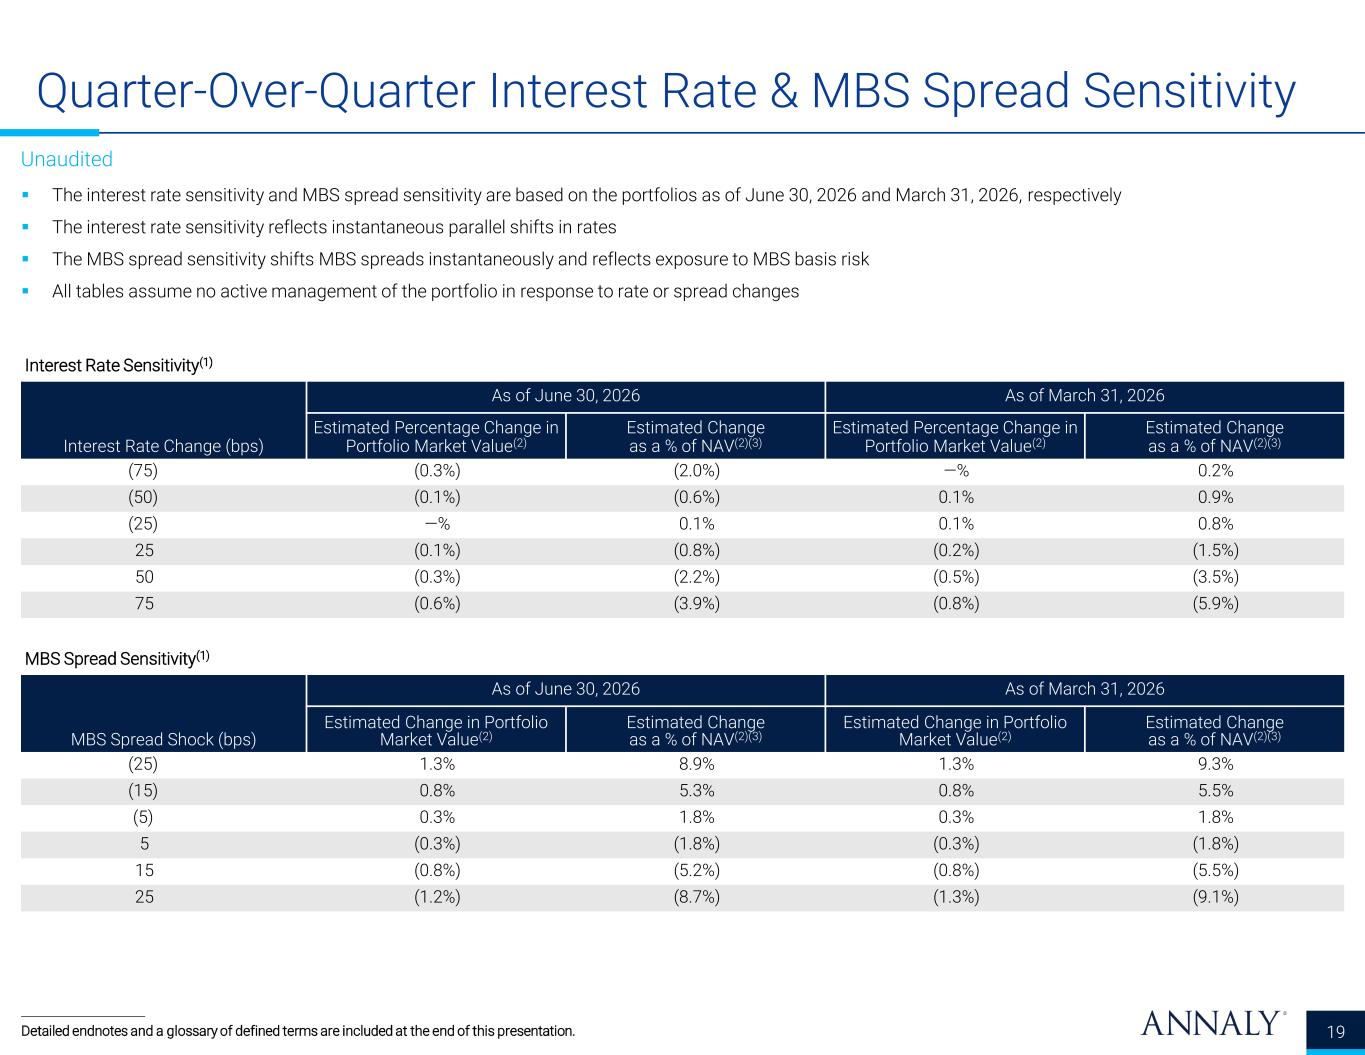
231 230 230 120 167 248 89 84 84 132 151 176 3 31 72 8 59 146 62 145 248 175 171 171 71 87 104 139 203 255 Quarter-Over-Quarter Interest Rate & MBS Spread Sensitivity ▪ The interest rate sensitivity and MBS spread sensitivity are based on the portfolios as of June 30, 2026 and March 31, 2026, respectively ▪ The interest rate sensitivity reflects instantaneous parallel shifts in rates ▪ The MBS spread sensitivity shifts MBS spreads instantaneously and reflects exposure to MBS basis risk ▪ All tables assume no active management of the portfolio in response to rate or spread changes 19 Unaudited Interest Rate Sensitivity(1) Interest Rate Change (bps) As of June 30, 2026 As of March 31, 2026 Estimated Percentage Change in Portfolio Market Value(2) Estimated Change as a % of NAV(2)(3) Estimated Percentage Change in Portfolio Market Value(2) Estimated Change as a % of NAV(2)(3) (75) (0.3%) (2.0%) —% 0.2% (50) (0.1%) (0.6%) 0.1% 0.9% (25) —% 0.1% 0.1% 0.8% 25 (0.1%) (0.8%) (0.2%) (1.5%) 50 (0.3%) (2.2%) (0.5%) (3.5%) 75 (0.6%) (3.9%) (0.8%) (5.9%) MBS Spread Sensitivity(1) MBS Spread Shock (bps) As of June 30, 2026 As of March 31, 2026 Estimated Change in Portfolio Market Value(2) Estimated Change as a % of NAV(2)(3) Estimated Change in Portfolio Market Value(2) Estimated Change as a % of NAV(2)(3) (25) 1.3% 8.9% 1.3% 9.3% (15) 0.8% 5.3% 0.8% 5.5% (5) 0.3% 1.8% 0.3% 1.8% 5 (0.3%) (1.8%) (0.3%) (1.8%) 15 (0.8%) (5.2%) (0.8%) (5.5%) 25 (1.2%) (8.7%) (1.3%) (9.1%) Detailed endnotes and a glossary of defined terms are included at the end of this presentation.

Appendix | Non-GAAP Reconciliations
231 230 230 120 167 248 89 84 84 132 151 176 3 31 72 8 59 146 62 145 248 175 171 171 71 87 104 139 203 255 Non-GAAP Reconciliations 21 Earnings Available for Distribution (“EAD”), a non-GAAP measure, is defined as the sum of (a) economic net interest income, (b) TBA dollar roll income, (c) net servicing income less realized amortization of MSR, (d) other income (loss) (excluding amortization of intangibles, non-EAD income allocated to equity method investments and other non-EAD components of other income (loss)), (e) general and administrative expenses (excluding transaction expenses and non-recurring items) and (f) income taxes (excluding the income tax effect of non-EAD income (loss) items) and excludes (g) the premium amortization adjustment ("PAA") representing the cumulative impact on prior periods, but not the current period, of quarter-over-quarter changes in estimated long-term prepayment speeds related to the Company’s Agency mortgage-backed securities. For additional definitions of non-GAAP measures, please refer to Annaly’s Second Quarter 2026 earnings release.
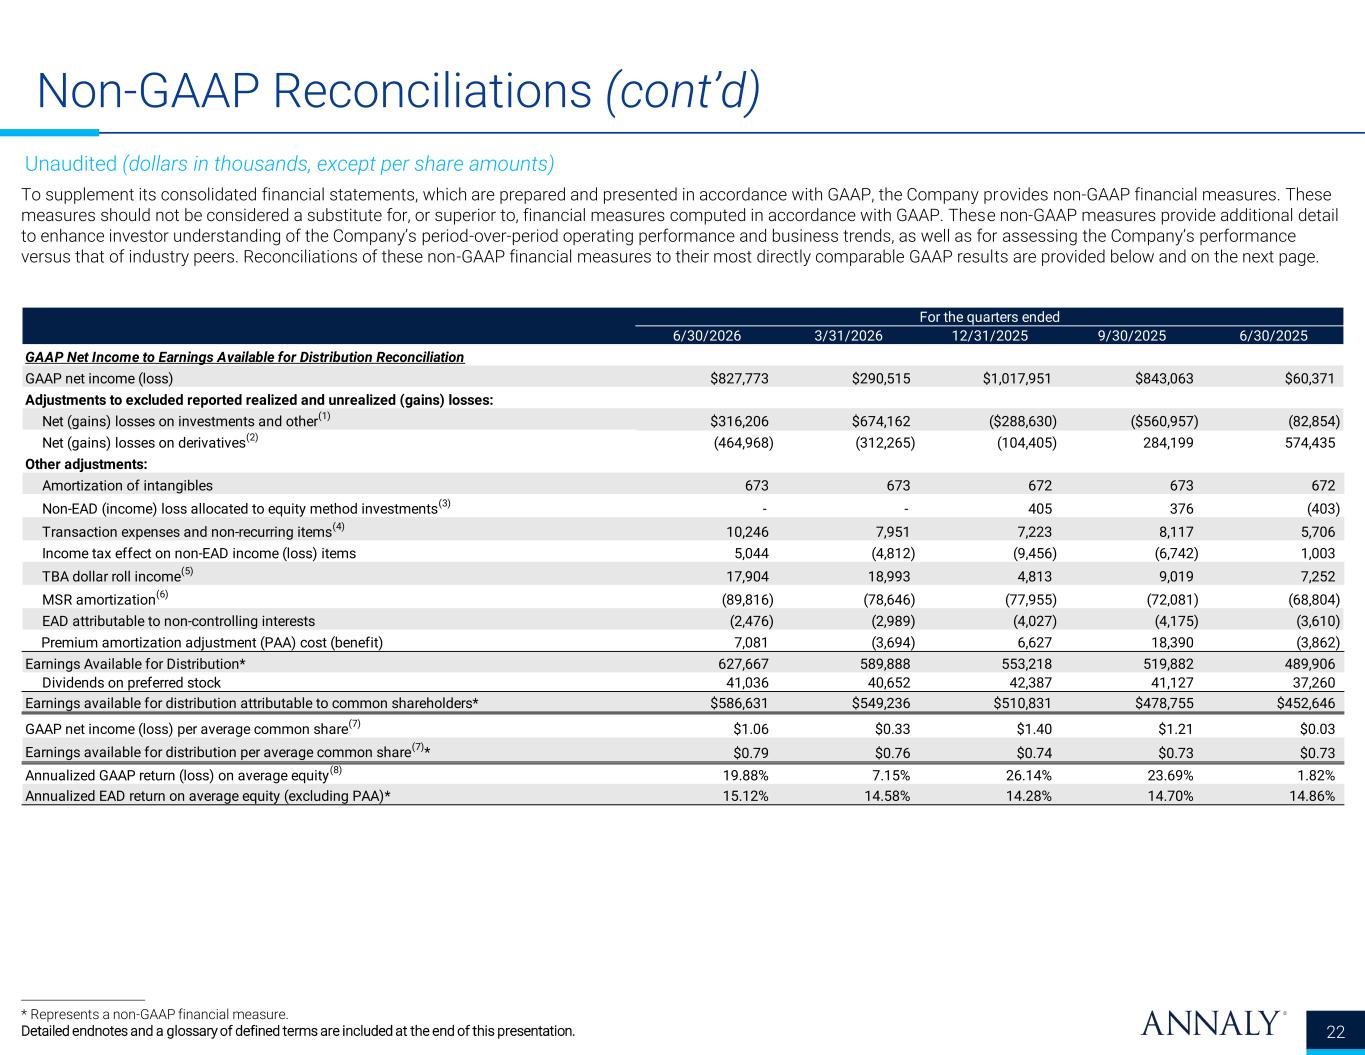
231 230 230 120 167 248 89 84 84 132 151 176 3 31 72 8 59 146 62 145 248 175 171 171 71 87 104 139 203 255 Non-GAAP Reconciliations (cont’d) 22 To supplement its consolidated financial statements, which are prepared and presented in accordance with GAAP, the Company provides non-GAAP financial measures. These measures should not be considered a substitute for, or superior to, financial measures computed in accordance with GAAP. These non-GAAP measures provide additional detail to enhance investor understanding of the Company’s period-over-period operating performance and business trends, as well as for assessing the Company’s performance versus that of industry peers. Reconciliations of these non-GAAP financial measures to their most directly comparable GAAP results are provided below and on the next page. Unaudited (dollars in thousands, except per share amounts) * Represents a non-GAAP financial measure. Detailed endnotes and a glossary of defined terms are included at the end of this presentation. For the quarters ended 6/30/2026 3/31/2026 12/31/2025 9/30/2025 6/30/2025 GAAP Net Income to Earnings Available for Distribution Reconciliation GAAP net income (loss) $827,773 $290,515 $1,017,951 $843,063 $60,371 Adjustments to excluded reported realized and unrealized (gains) losses: Net (gains) losses on investments and other(1) $316,206 $674,162 ($288,630) ($560,957) (82,854) Net (gains) losses on derivatives (2) (464,968) (312,265) (104,405) 284,199 574,435 Other adjustments: Amortization of intangibles 673 673 672 673 672 Non-EAD (income) loss allocated to equity method investments (3) - - 405 376 (403) Transaction expenses and non-recurring items (4) 10,246 7,951 7,223 8,117 5,706 Income tax effect on non-EAD income (loss) items 5,044 (4,812) (9,456) (6,742) 1,003 TBA dollar roll income (5) 17,904 18,993 4,813 9,019 7,252 MSR amortization(6) (89,816) (78,646) (77,955) (72,081) (68,804) EAD attributable to non-controlling interests (2,476) (2,989) (4,027) (4,175) (3,610) Premium amortization adjustment (PAA) cost (benefit) 7,081 (3,694) 6,627 18,390 (3,862) Earnings Available for Distribution* 627,667 589,888 553,218 519,882 489,906 Dividends on preferred stock 41,036 40,652 42,387 41,127 37,260 Earnings available for distribution attributable to common shareholders* $586,631 $549,236 $510,831 $478,755 $452,646 GAAP net income (loss) per average common share (7) $1.06 $0.33 $1.40 $1.21 $0.03 Earnings available for distribution per average common share(7)* $0.79 $0.76 $0.74 $0.73 $0.73 Annualized GAAP return (loss) on average equity (8) 19.88% 7.15% 26.14% 23.69% 1.82% Annualized EAD return on average equity (excluding PAA)* 15.12% 14.58% 14.28% 14.70% 14.86%
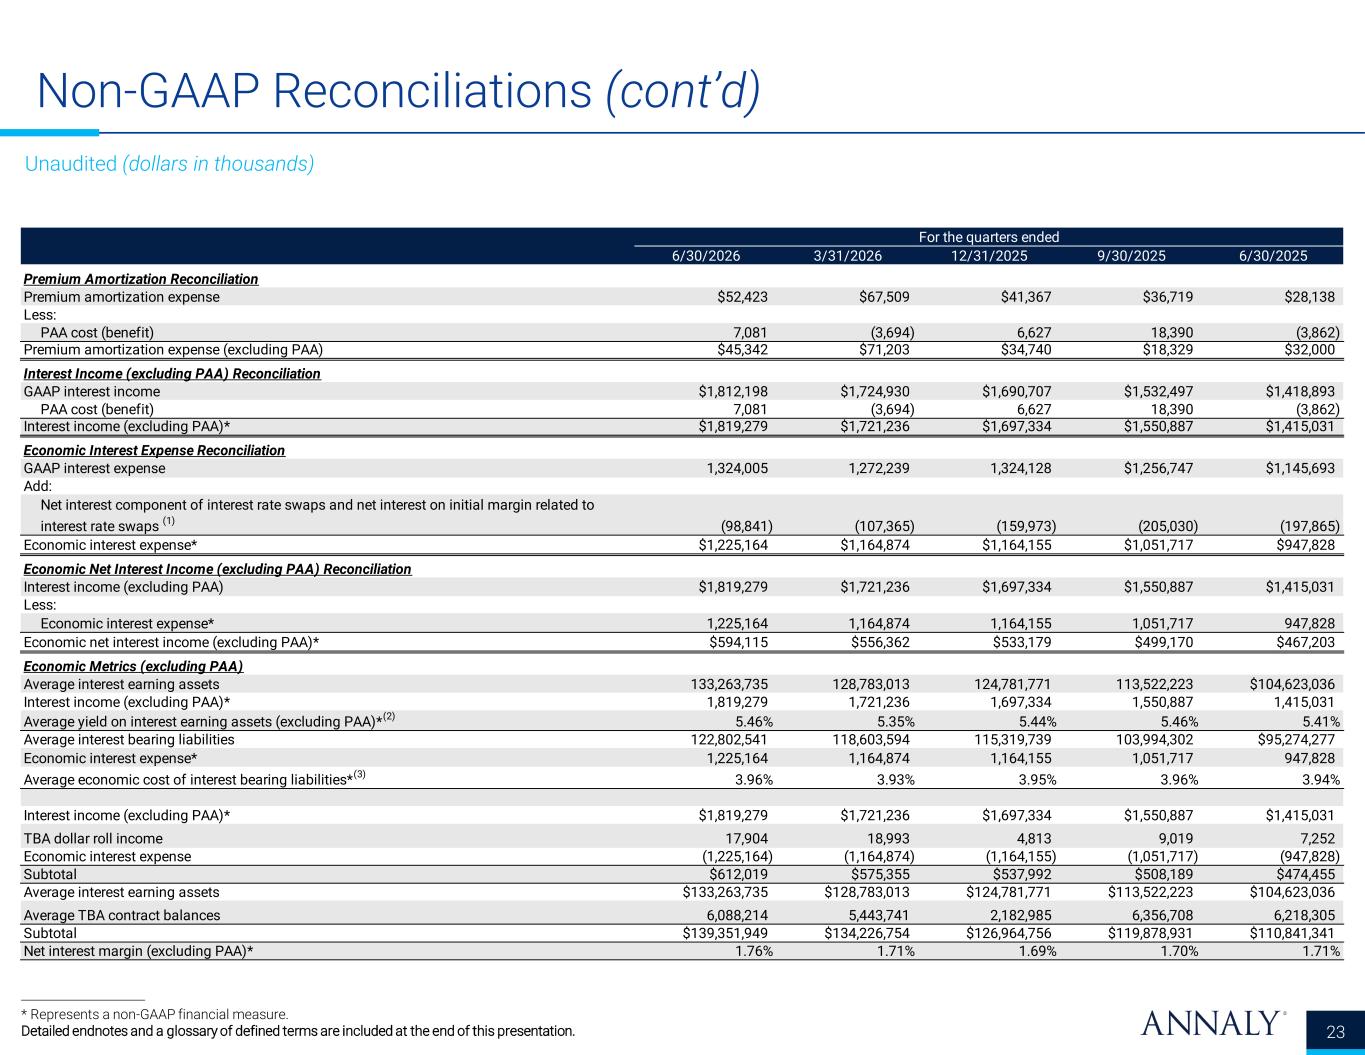
231 230 230 120 167 248 89 84 84 132 151 176 3 31 72 8 59 146 62 145 248 175 171 171 71 87 104 139 203 255 Non-GAAP Reconciliations (cont’d) 23 Unaudited (dollars in thousands) * Represents a non-GAAP financial measure. Detailed endnotes and a glossary of defined terms are included at the end of this presentation. For the quarters ended 6/30/2026 3/31/2026 12/31/2025 9/30/2025 6/30/2025 Premium Amortization Reconciliation Premium amortization expense $52,423 $67,509 $41,367 $36,719 $28,138 Less: PAA cost (benefit) 7,081 (3,694) 6,627 18,390 (3,862) Premium amortization expense (excluding PAA) $45,342 $71,203 $34,740 $18,329 $32,000 Interest Income (excluding PAA) Reconciliation GAAP interest income $1,812,198 $1,724,930 $1,690,707 $1,532,497 $1,418,893 PAA cost (benefit) 7,081 (3,694) 6,627 18,390 (3,862) Interest income (excluding PAA)* $1,819,279 $1,721,236 $1,697,334 $1,550,887 $1,415,031 Economic Interest Expense Reconciliation GAAP interest expense 1,324,005 1,272,239 1,324,128 $1,256,747 $1,145,693 Add: Net interest component of interest rate swaps and net interest on initial margin related to interest rate swaps (1) (98,841) (107,365) (159,973) (205,030) (197,865) Economic interest expense* $1,225,164 $1,164,874 $1,164,155 $1,051,717 $947,828 Economic Net Interest Income (excluding PAA) Reconciliation Interest income (excluding PAA) $1,819,279 $1,721,236 $1,697,334 $1,550,887 $1,415,031 Less: Economic interest expense* 1,225,164 1,164,874 1,164,155 1,051,717 947,828 Economic net interest income (excluding PAA)* $594,115 $556,362 $533,179 $499,170 $467,203 Economic Metrics (excluding PAA) Average interest earning assets 133,263,735 128,783,013 124,781,771 113,522,223 $104,623,036 Interest income (excluding PAA)* 1,819,279 1,721,236 1,697,334 1,550,887 1,415,031 Average yield on interest earning assets (excluding PAA)*(2) 5.46% 5.35% 5.44% 5.46% 5.41% Average interest bearing liabilities 122,802,541 118,603,594 115,319,739 103,994,302 $95,274,277 Economic interest expense* 1,225,164 1,164,874 1,164,155 1,051,717 947,828 Average economic cost of interest bearing liabilities* (3) 3.96% 3.93% 3.95% 3.96% 3.94% Interest income (excluding PAA)* $1,819,279 $1,721,236 $1,697,334 $1,550,887 $1,415,031 TBA dollar roll income 17,904 18,993 4,813 9,019 7,252 Economic interest expense (1,225,164) (1,164,874) (1,164,155) (1,051,717) (947,828) Subtotal $612,019 $575,355 $537,992 $508,189 $474,455 Average interest earning assets $133,263,735 $128,783,013 $124,781,771 $113,522,223 $104,623,036 Average TBA contract balances 6,088,214 5,443,741 2,182,985 6,356,708 6,218,305 Subtotal $139,351,949 $134,226,754 $126,964,756 $119,878,931 $110,841,341 Net interest margin (excluding PAA)* 1.76% 1.71% 1.69% 1.70% 1.71%
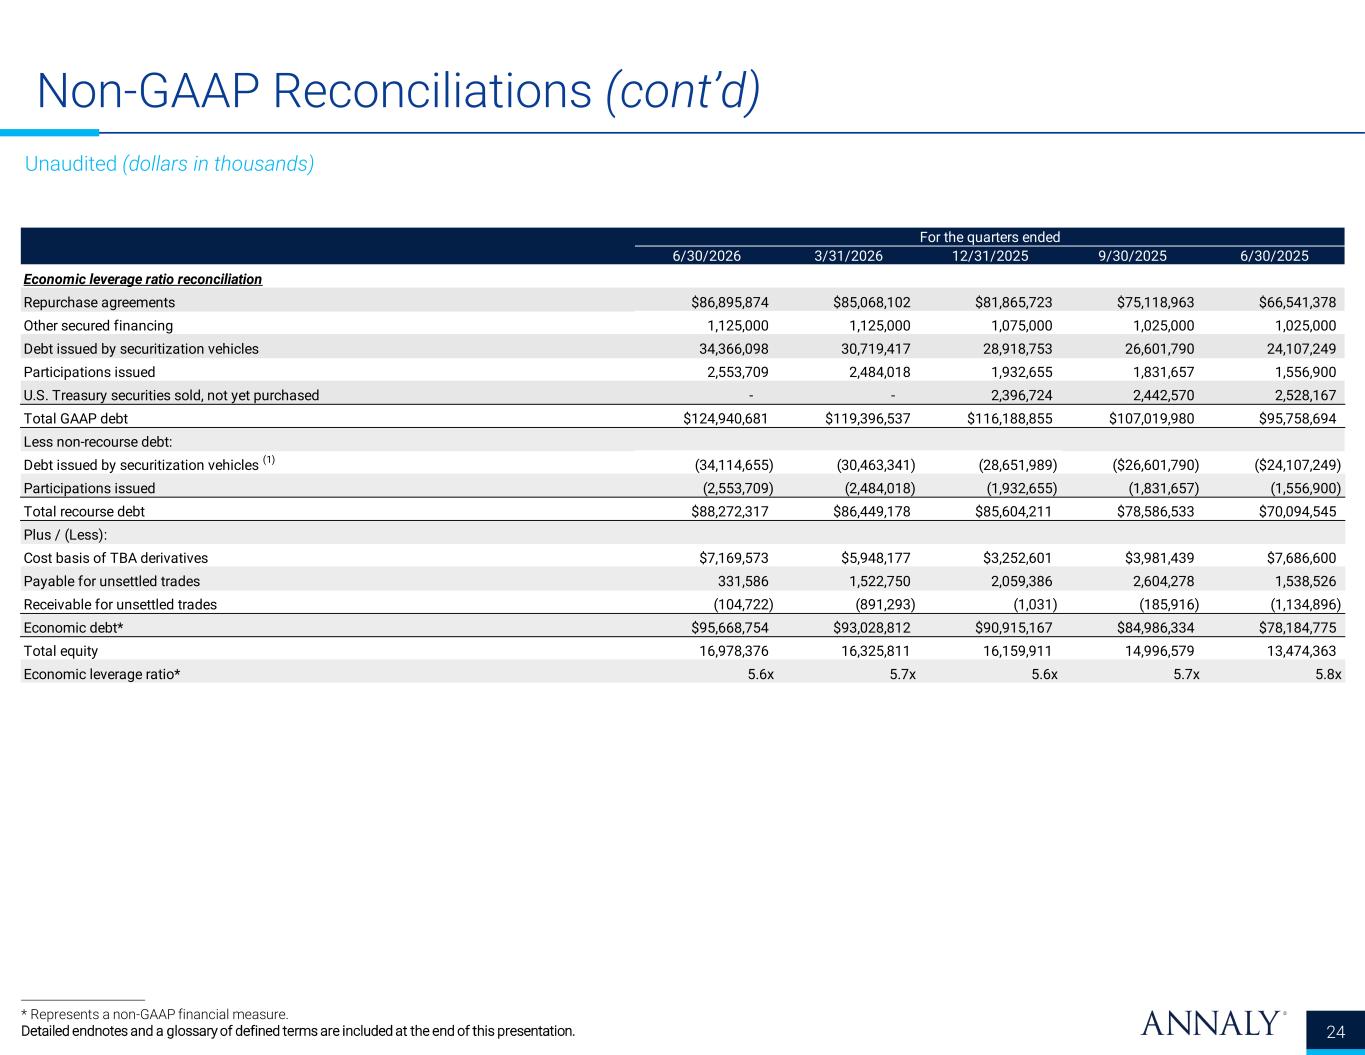
231 230 230 120 167 248 89 84 84 132 151 176 3 31 72 8 59 146 62 145 248 175 171 171 71 87 104 139 203 255 Non-GAAP Reconciliations (cont’d) 24 Unaudited (dollars in thousands) * Represents a non-GAAP financial measure. Detailed endnotes and a glossary of defined terms are included at the end of this presentation. For the quarters ended 6/30/2026 3/31/2026 12/31/2025 9/30/2025 6/30/2025 Economic leverage ratio reconciliation Repurchase agreements $86,895,874 $85,068,102 $81,865,723 $75,118,963 $66,541,378 Other secured financing 1,125,000 1,125,000 1,075,000 1,025,000 1,025,000 Debt issued by securitization vehicles 34,366,098 30,719,417 28,918,753 26,601,790 24,107,249 Participations issued 2,553,709 2,484,018 1,932,655 1,831,657 1,556,900 U.S. Treasury securities sold, not yet purchased - - 2,396,724 2,442,570 2,528,167 Total GAAP debt $124,940,681 $119,396,537 $116,188,855 $107,019,980 $95,758,694 Less non-recourse debt: Debt issued by securitization vehicles (1) (34,114,655) (30,463,341) (28,651,989) ($26,601,790) ($24,107,249) Participations issued (2,553,709) (2,484,018) (1,932,655) (1,831,657) (1,556,900) Total recourse debt $88,272,317 $86,449,178 $85,604,211 $78,586,533 $70,094,545 Plus / (Less): Cost basis of TBA derivatives $7,169,573 $5,948,177 $3,252,601 $3,981,439 $7,686,600 Payable for unsettled trades 331,586 1,522,750 2,059,386 2,604,278 1,538,526 Receivable for unsettled trades (104,722) (891,293) (1,031) (185,916) (1,134,896) Economic debt* $95,668,754 $93,028,812 $90,915,167 $84,986,334 $78,184,775 Total equity 16,978,376 16,325,811 16,159,911 14,996,579 13,474,363 Economic leverage ratio* 5.6x 5.7x 5.6x 5.7x 5.8x

Glossary and Endnotes
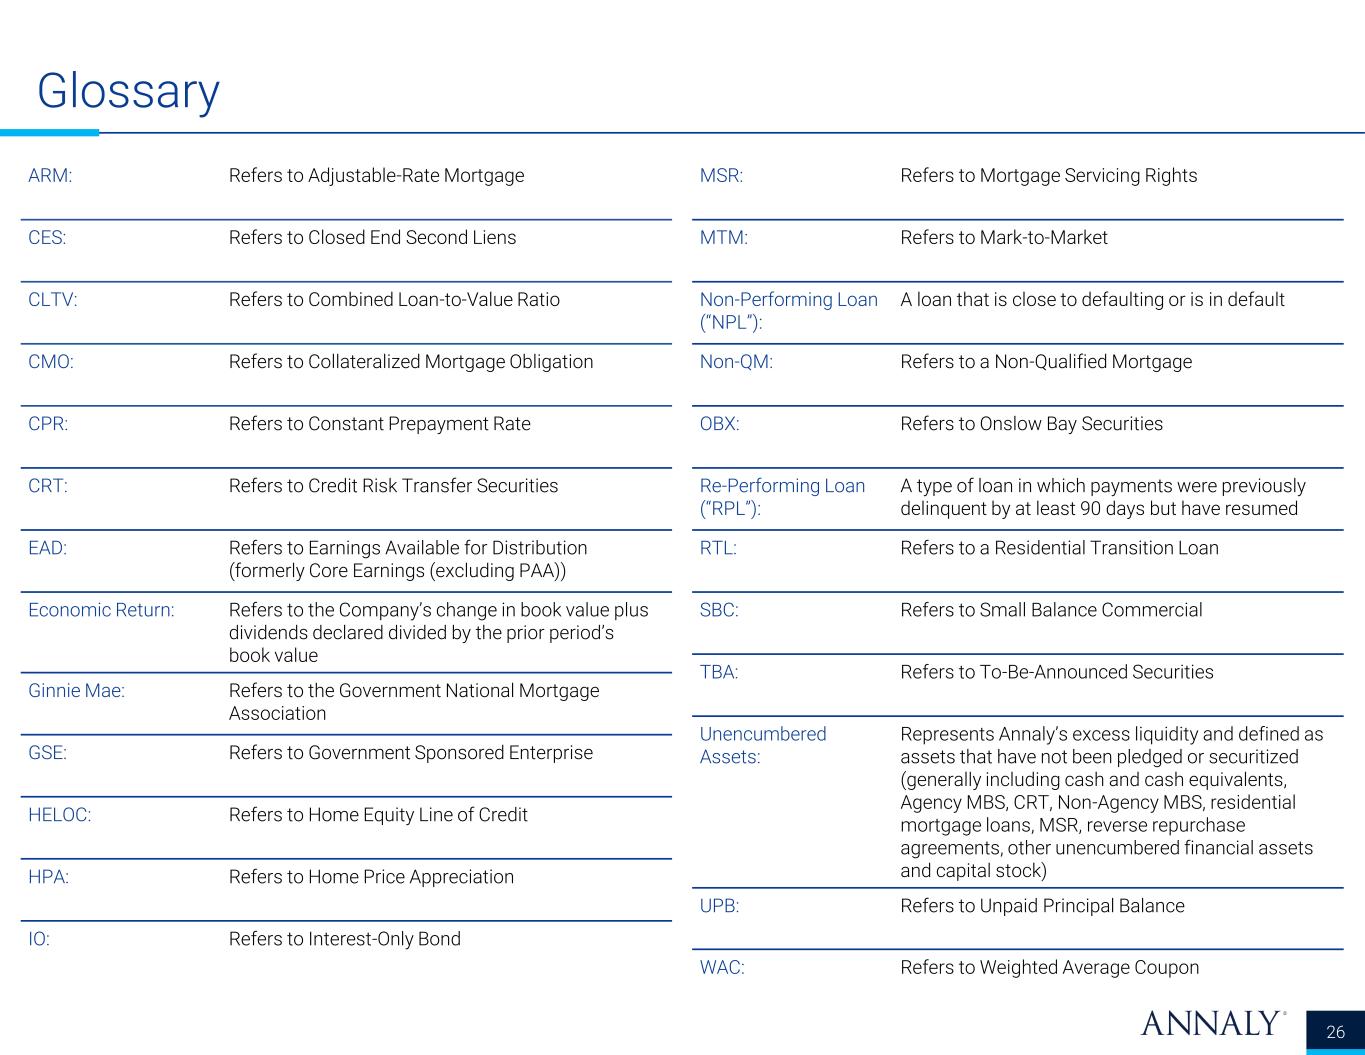
231 230 230 120 167 248 89 84 84 132 151 176 3 31 72 8 59 146 62 145 248 175 171 171 71 87 104 139 203 255 Glossary 26 ARM: Refers to Adjustable-Rate Mortgage CES: Refers to Closed End Second Liens CLTV: Refers to Combined Loan-to-Value Ratio CMO: Refers to Collateralized Mortgage Obligation CPR: Refers to Constant Prepayment Rate CRT: Refers to Credit Risk Transfer Securities EAD: Refers to Earnings Available for Distribution (formerly Core Earnings (excluding PAA)) Economic Return: Refers to the Company’s change in book value plus dividends declared divided by the prior period’s book value Ginnie Mae: Refers to the Government National Mortgage Association GSE: Refers to Government Sponsored Enterprise HELOC: Refers to Home Equity Line of Credit HPA: Refers to Home Price Appreciation IO: Refers to Interest-Only Bond MSR: Refers to Mortgage Servicing Rights MTM: Refers to Mark-to-Market Non-Performing Loan (“NPL”): A loan that is close to defaulting or is in default Non-QM: Refers to a Non-Qualified Mortgage OBX: Refers to Onslow Bay Securities Re-Performing Loan (“RPL”): A type of loan in which payments were previously delinquent by at least 90 days but have resumed RTL: Refers to a Residential Transition Loan SBC: Refers to Small Balance Commercial TBA: Refers to To-Be-Announced Securities Unencumbered Assets: Represents Annaly’s excess liquidity and defined as assets that have not been pledged or securitized (generally including cash and cash equivalents, Agency MBS, CRT, Non-Agency MBS, residential mortgage loans, MSR, reverse repurchase agreements, other unencumbered financial assets and capital stock) UPB: Refers to Unpaid Principal Balance WAC: Refers to Weighted Average Coupon
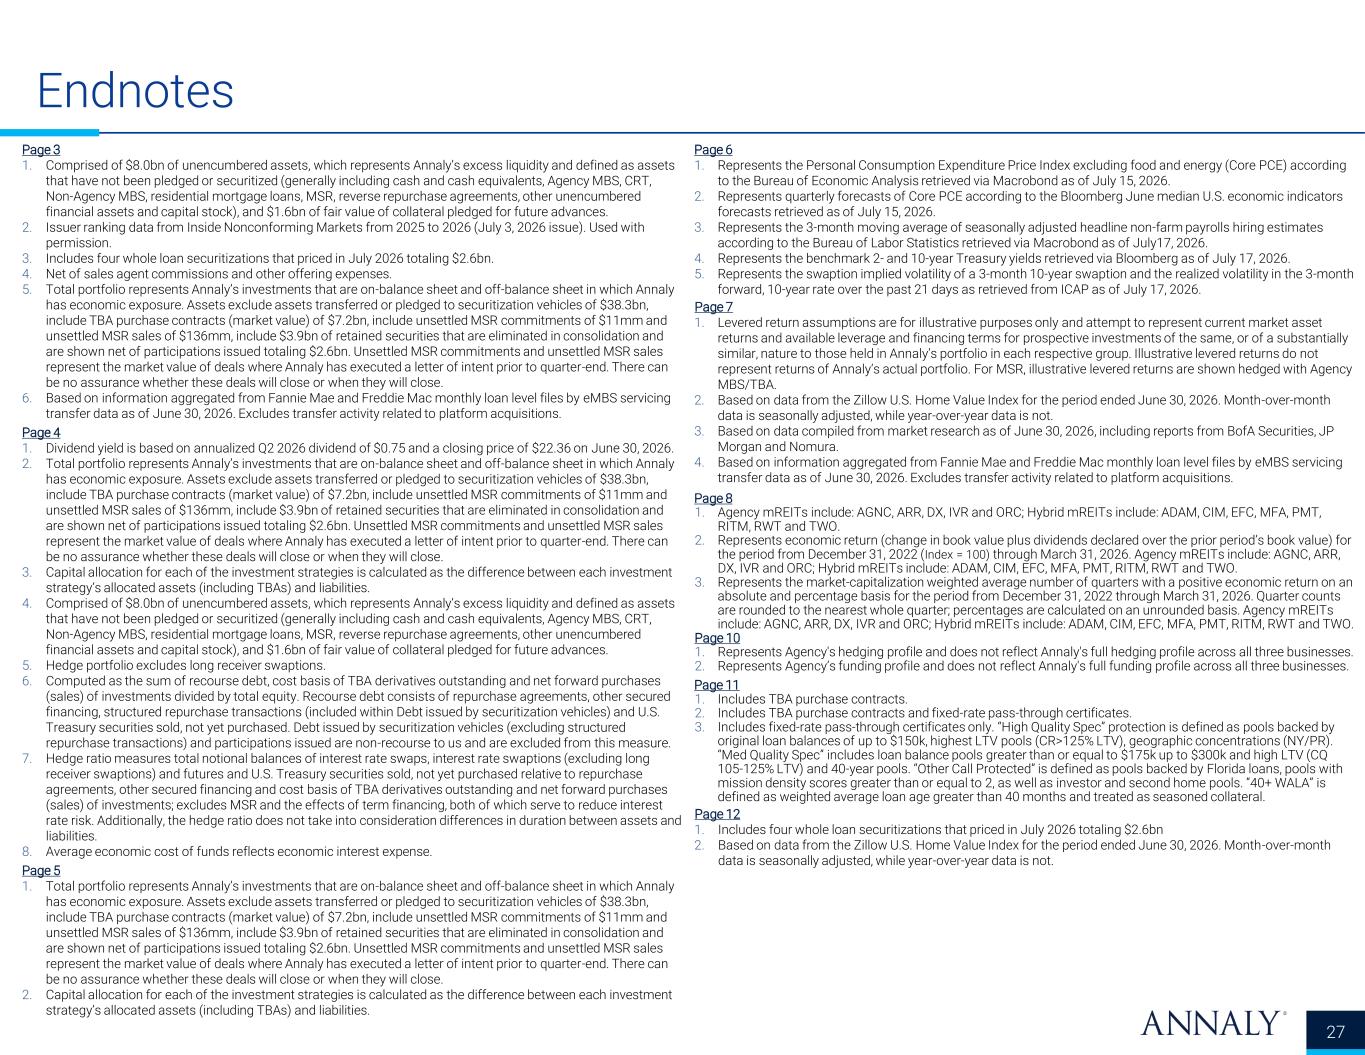
231 230 230 120 167 248 89 84 84 132 151 176 3 31 72 8 59 146 62 145 248 175 171 171 71 87 104 139 203 255 Endnotes 27 Page 3 1. Comprised of $8.0bn of unencumbered assets, which represents Annaly’s excess liquidity and defined as assets that have not been pledged or securitized (generally including cash and cash equivalents, Agency MBS, CRT, Non-Agency MBS, residential mortgage loans, MSR, reverse repurchase agreements, other unencumbered financial assets and capital stock), and $1.6bn of fair value of collateral pledged for future advances. 2. Issuer ranking data from Inside Nonconforming Markets from 2025 to 2026 (July 3, 2026 issue). Used with permission. 3. Includes four whole loan securitizations that priced in July 2026 totaling $2.6bn. 4. Net of sales agent commissions and other offering expenses. 5. Total portfolio represents Annaly’s investments that are on-balance sheet and off-balance sheet in which Annaly has economic exposure. Assets exclude assets transferred or pledged to securitization vehicles of $38.3bn, include TBA purchase contracts (market value) of $7.2bn, include unsettled MSR commitments of $11mm and unsettled MSR sales of $136mm, include $3.9bn of retained securities that are eliminated in consolidation and are shown net of participations issued totaling $2.6bn. Unsettled MSR commitments and unsettled MSR sales represent the market value of deals where Annaly has executed a letter of intent prior to quarter-end. There can be no assurance whether these deals will close or when they will close. 6. Based on information aggregated from Fannie Mae and Freddie Mac monthly loan level files by eMBS servicing transfer data as of June 30, 2026. Excludes transfer activity related to platform acquisitions. Page 4 1. Dividend yield is based on annualized Q2 2026 dividend of $0.75 and a closing price of $22.36 on June 30, 2026. 2. Total portfolio represents Annaly’s investments that are on-balance sheet and off-balance sheet in which Annaly has economic exposure. Assets exclude assets transferred or pledged to securitization vehicles of $38.3bn, include TBA purchase contracts (market value) of $7.2bn, include unsettled MSR commitments of $11mm and unsettled MSR sales of $136mm, include $3.9bn of retained securities that are eliminated in consolidation and are shown net of participations issued totaling $2.6bn. Unsettled MSR commitments and unsettled MSR sales represent the market value of deals where Annaly has executed a letter of intent prior to quarter-end. There can be no assurance whether these deals will close or when they will close. 3. Capital allocation for each of the investment strategies is calculated as the difference between each investment strategy’s allocated assets (including TBAs) and liabilities. 4. Comprised of $8.0bn of unencumbered assets, which represents Annaly’s excess liquidity and defined as assets that have not been pledged or securitized (generally including cash and cash equivalents, Agency MBS, CRT, Non-Agency MBS, residential mortgage loans, MSR, reverse repurchase agreements, other unencumbered financial assets and capital stock), and $1.6bn of fair value of collateral pledged for future advances. 5. Hedge portfolio excludes long receiver swaptions. 6. Computed as the sum of recourse debt, cost basis of TBA derivatives outstanding and net forward purchases (sales) of investments divided by total equity. Recourse debt consists of repurchase agreements, other secured financing, structured repurchase transactions (included within Debt issued by securitization vehicles) and U.S. Treasury securities sold, not yet purchased. Debt issued by securitization vehicles (excluding structured repurchase transactions) and participations issued are non-recourse to us and are excluded from this measure. 7. Hedge ratio measures total notional balances of interest rate swaps, interest rate swaptions (excluding long receiver swaptions) and futures and U.S. Treasury securities sold, not yet purchased relative to repurchase agreements, other secured financing and cost basis of TBA derivatives outstanding and net forward purchases (sales) of investments; excludes MSR and the effects of term financing, both of which serve to reduce interest rate risk. Additionally, the hedge ratio does not take into consideration differences in duration between assets and liabilities. 8. Average economic cost of funds reflects economic interest expense. Page 5 1. Total portfolio represents Annaly’s investments that are on-balance sheet and off-balance sheet in which Annaly has economic exposure. Assets exclude assets transferred or pledged to securitization vehicles of $38.3bn, include TBA purchase contracts (market value) of $7.2bn, include unsettled MSR commitments of $11mm and unsettled MSR sales of $136mm, include $3.9bn of retained securities that are eliminated in consolidation and are shown net of participations issued totaling $2.6bn. Unsettled MSR commitments and unsettled MSR sales represent the market value of deals where Annaly has executed a letter of intent prior to quarter-end. There can be no assurance whether these deals will close or when they will close. 2. Capital allocation for each of the investment strategies is calculated as the difference between each investment strategy’s allocated assets (including TBAs) and liabilities. Page 6 1. Represents the Personal Consumption Expenditure Price Index excluding food and energy (Core PCE) according to the Bureau of Economic Analysis retrieved via Macrobond as of July 15, 2026. 2. Represents quarterly forecasts of Core PCE according to the Bloomberg June median U.S. economic indicators forecasts retrieved as of July 15, 2026. 3. Represents the 3-month moving average of seasonally adjusted headline non-farm payrolls hiring estimates according to the Bureau of Labor Statistics retrieved via Macrobond as of July17, 2026. 4. Represents the benchmark 2- and 10-year Treasury yields retrieved via Bloomberg as of July 17, 2026. 5. Represents the swaption implied volatility of a 3-month 10-year swaption and the realized volatility in the 3-month forward, 10-year rate over the past 21 days as retrieved from ICAP as of July 17, 2026. Page 7 1. Levered return assumptions are for illustrative purposes only and attempt to represent current market asset returns and available leverage and financing terms for prospective investments of the same, or of a substantially similar, nature to those held in Annaly’s portfolio in each respective group. Illustrative levered returns do not represent returns of Annaly’s actual portfolio. For MSR, illustrative levered returns are shown hedged with Agency MBS/TBA. 2. Based on data from the Zillow U.S. Home Value Index for the period ended June 30, 2026. Month-over-month data is seasonally adjusted, while year-over-year data is not. 3. Based on data compiled from market research as of June 30, 2026, including reports from BofA Securities, JP Morgan and Nomura. 4. Based on information aggregated from Fannie Mae and Freddie Mac monthly loan level files by eMBS servicing transfer data as of June 30, 2026. Excludes transfer activity related to platform acquisitions. Page 8 1. Agency mREITs include: AGNC, ARR, DX, IVR and ORC; Hybrid mREITs include: ADAM, CIM, EFC, MFA, PMT, RITM, RWT and TWO. 2. Represents economic return (change in book value plus dividends declared over the prior period’s book value) for the period from December 31, 2022 (Index = 100) through March 31, 2026. Agency mREITs include: AGNC, ARR, DX, IVR and ORC; Hybrid mREITs include: ADAM, CIM, EFC, MFA, PMT, RITM, RWT and TWO. 3. Represents the market-capitalization weighted average number of quarters with a positive economic return on an absolute and percentage basis for the period from December 31, 2022 through March 31, 2026. Quarter counts are rounded to the nearest whole quarter; percentages are calculated on an unrounded basis. Agency mREITs include: AGNC, ARR, DX, IVR and ORC; Hybrid mREITs include: ADAM, CIM, EFC, MFA, PMT, RITM, RWT and TWO. Page 10 1. Represents Agency's hedging profile and does not reflect Annaly's full hedging profile across all three businesses. 2. Represents Agency’s funding profile and does not reflect Annaly's full funding profile across all three businesses. Page 11 1. Includes TBA purchase contracts. 2. Includes TBA purchase contracts and fixed-rate pass-through certificates. 3. Includes fixed-rate pass-through certificates only. “High Quality Spec” protection is defined as pools backed by original loan balances of up to $150k, highest LTV pools (CR>125% LTV), geographic concentrations (NY/PR). “Med Quality Spec” includes loan balance pools greater than or equal to $175k up to $300k and high LTV (CQ 105-125% LTV) and 40-year pools. “Other Call Protected” is defined as pools backed by Florida loans, pools with mission density scores greater than or equal to 2, as well as investor and second home pools. “40+ WALA” is defined as weighted average loan age greater than 40 months and treated as seasoned collateral. Page 12 1. Includes four whole loan securitizations that priced in July 2026 totaling $2.6bn 2. Based on data from the Zillow U.S. Home Value Index for the period ended June 30, 2026. Month-over-month data is seasonally adjusted, while year-over-year data is not.
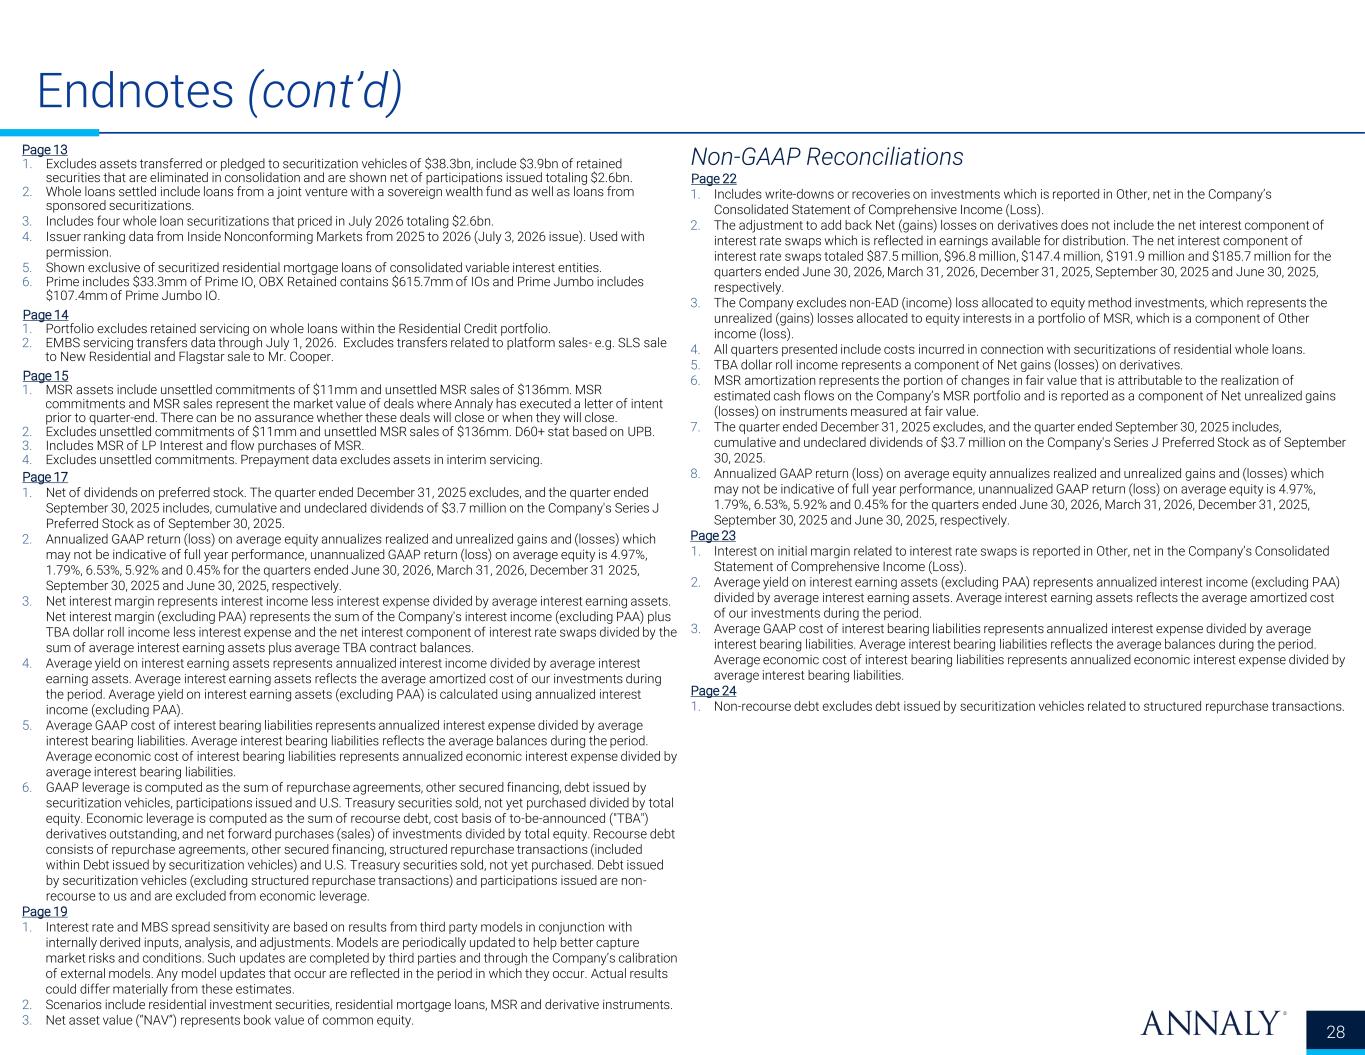
231 230 230 120 167 248 89 84 84 132 151 176 3 31 72 8 59 146 62 145 248 175 171 171 71 87 104 139 203 255 Endnotes (cont’d) 28 Page 13 1. Excludes assets transferred or pledged to securitization vehicles of $38.3bn, include $3.9bn of retained securities that are eliminated in consolidation and are shown net of participations issued totaling $2.6bn. 2. Whole loans settled include loans from a joint venture with a sovereign wealth fund as well as loans from sponsored securitizations. 3. Includes four whole loan securitizations that priced in July 2026 totaling $2.6bn. 4. Issuer ranking data from Inside Nonconforming Markets from 2025 to 2026 (July 3, 2026 issue). Used with permission. 5. Shown exclusive of securitized residential mortgage loans of consolidated variable interest entities. 6. Prime includes $33.3mm of Prime IO, OBX Retained contains $615.7mm of IOs and Prime Jumbo includes $107.4mm of Prime Jumbo IO. Page 14 1. Portfolio excludes retained servicing on whole loans within the Residential Credit portfolio. 2. EMBS servicing transfers data through July 1, 2026. Excludes transfers related to platform sales- e.g. SLS sale to New Residential and Flagstar sale to Mr. Cooper. Page 15 1. MSR assets include unsettled commitments of $11mm and unsettled MSR sales of $136mm. MSR commitments and MSR sales represent the market value of deals where Annaly has executed a letter of intent prior to quarter-end. There can be no assurance whether these deals will close or when they will close. 2. Excludes unsettled commitments of $11mm and unsettled MSR sales of $136mm. D60+ stat based on UPB. 3. Includes MSR of LP Interest and flow purchases of MSR. 4. Excludes unsettled commitments. Prepayment data excludes assets in interim servicing. Page 17 1. Net of dividends on preferred stock. The quarter ended December 31, 2025 excludes, and the quarter ended September 30, 2025 includes, cumulative and undeclared dividends of $3.7 million on the Company's Series J Preferred Stock as of September 30, 2025. 2. Annualized GAAP return (loss) on average equity annualizes realized and unrealized gains and (losses) which may not be indicative of full year performance, unannualized GAAP return (loss) on average equity is 4.97%, 1.79%, 6.53%, 5.92% and 0.45% for the quarters ended June 30, 2026, March 31, 2026, December 31 2025, September 30, 2025 and June 30, 2025, respectively. 3. Net interest margin represents interest income less interest expense divided by average interest earning assets. Net interest margin (excluding PAA) represents the sum of the Company's interest income (excluding PAA) plus TBA dollar roll income less interest expense and the net interest component of interest rate swaps divided by the sum of average interest earning assets plus average TBA contract balances. 4. Average yield on interest earning assets represents annualized interest income divided by average interest earning assets. Average interest earning assets reflects the average amortized cost of our investments during the period. Average yield on interest earning assets (excluding PAA) is calculated using annualized interest income (excluding PAA). 5. Average GAAP cost of interest bearing liabilities represents annualized interest expense divided by average interest bearing liabilities. Average interest bearing liabilities reflects the average balances during the period. Average economic cost of interest bearing liabilities represents annualized economic interest expense divided by average interest bearing liabilities. 6. GAAP leverage is computed as the sum of repurchase agreements, other secured financing, debt issued by securitization vehicles, participations issued and U.S. Treasury securities sold, not yet purchased divided by total equity. Economic leverage is computed as the sum of recourse debt, cost basis of to-be-announced ("TBA") derivatives outstanding, and net forward purchases (sales) of investments divided by total equity. Recourse debt consists of repurchase agreements, other secured financing, structured repurchase transactions (included within Debt issued by securitization vehicles) and U.S. Treasury securities sold, not yet purchased. Debt issued by securitization vehicles (excluding structured repurchase transactions) and participations issued are non- recourse to us and are excluded from economic leverage. Page 19 1. Interest rate and MBS spread sensitivity are based on results from third party models in conjunction with internally derived inputs, analysis, and adjustments. Models are periodically updated to help better capture market risks and conditions. Such updates are completed by third parties and through the Company’s calibration of external models. Any model updates that occur are reflected in the period in which they occur. Actual results could differ materially from these estimates. 2. Scenarios include residential investment securities, residential mortgage loans, MSR and derivative instruments. 3. Net asset value (“NAV”) represents book value of common equity. Non-GAAP Reconciliations Page 22 1. Includes write-downs or recoveries on investments which is reported in Other, net in the Company’s Consolidated Statement of Comprehensive Income (Loss). 2. The adjustment to add back Net (gains) losses on derivatives does not include the net interest component of interest rate swaps which is reflected in earnings available for distribution. The net interest component of interest rate swaps totaled $87.5 million, $96.8 million, $147.4 million, $191.9 million and $185.7 million for the quarters ended June 30, 2026, March 31, 2026, December 31, 2025, September 30, 2025 and June 30, 2025, respectively. 3. The Company excludes non-EAD (income) loss allocated to equity method investments, which represents the unrealized (gains) losses allocated to equity interests in a portfolio of MSR, which is a component of Other income (loss). 4. All quarters presented include costs incurred in connection with securitizations of residential whole loans. 5. TBA dollar roll income represents a component of Net gains (losses) on derivatives. 6. MSR amortization represents the portion of changes in fair value that is attributable to the realization of estimated cash flows on the Company’s MSR portfolio and is reported as a component of Net unrealized gains (losses) on instruments measured at fair value. 7. The quarter ended December 31, 2025 excludes, and the quarter ended September 30, 2025 includes, cumulative and undeclared dividends of $3.7 million on the Company's Series J Preferred Stock as of September 30, 2025. 8. Annualized GAAP return (loss) on average equity annualizes realized and unrealized gains and (losses) which may not be indicative of full year performance, unannualized GAAP return (loss) on average equity is 4.97%, 1.79%, 6.53%, 5.92% and 0.45% for the quarters ended June 30, 2026, March 31, 2026, December 31, 2025, September 30, 2025 and June 30, 2025, respectively. Page 23 1. Interest on initial margin related to interest rate swaps is reported in Other, net in the Company’s Consolidated Statement of Comprehensive Income (Loss). 2. Average yield on interest earning assets (excluding PAA) represents annualized interest income (excluding PAA) divided by average interest earning assets. Average interest earning assets reflects the average amortized cost of our investments during the period. 3. Average GAAP cost of interest bearing liabilities represents annualized interest expense divided by average interest bearing liabilities. Average interest bearing liabilities reflects the average balances during the period. Average economic cost of interest bearing liabilities represents annualized economic interest expense divided by average interest bearing liabilities. Page 24 1. Non-recourse debt excludes debt issued by securitization vehicles related to structured repurchase transactions.