
Exhibit 99.2
Fourth Quarter Fiscal Year 2026 Earnings Call July 21, 2026
Note : All results and expectations in the presentation reflect continuing operations unless otherwise noted . This presentation contains certain statements relating to future results, which are forward - looking statements as that term is defined in the Private Securities Litigation Reform Act of 1995 , which reflect management’s expectations about future conditions, including, but not limited to, our first quarter and full year FY 2027 guidance ; continued focus on sales growth, margin expansion, and cash flow generation ; financial flexibility and disciplined capital allocation ; successful integration of acquisitions and achievement of related synergies ; and creation of long - term value for employees, customers and stockholders . These forward - looking statements are based on the beliefs of Company management, as well as assumptions and estimates based on information available to the Company as of the dates such assumptions and estimates are made, and are subject to certain risks and uncertainties that could cause actual results to differ materially from historical results or those anticipated, depending on a variety of factors, including : ( i ) factors that adversely affect the commercial aviation industry ; (ii) adverse events and negative publicity in the aviation industry ; (iii) a reduction in sales to the U . S . government and its contractors ; (iv) cost overruns and losses on fixed - price contracts ; (v) nonperformance by subcontractors or suppliers ; (vi) our ability to manage our operational footprint ; (vii) a reduction in outsourcing of maintenance and repair activity by airlines ; (viii) a shortage of skilled personnel or work stoppages ; (ix) competition from other companies ; (x) financial, operational and legal risks arising as a result of operating internationally ; (xi) failure to complete, integrate, and realize the anticipated benefits of acquisitions, including execution of related operational and financial plans ; (xii) circumstances associated with divestitures ; (xiii) inability to recover costs due to fluctuations in market values for aviation products and equipment ; (xiv) cyber or other security threats or disruptions ; (xv) a need to make significant capital expenditures to keep pace with technological developments in our industry ; (xvi) restrictions on use of intellectual property and tooling important to our business ; (xvii) inability to protect the value of our intellectual property ; (xviii) our ability to manage our debt and fund our other liquidity needs ; (xix) limitations on our ability to access the debt and equity capital markets or to draw down funds under loan agreements ; (xx) non - compliance with restrictive and financial covenants contained in our debt and loan agreements ; (xxi) changes in or non - compliance with laws and regulations related to federal contractors, the aviation industry, international operations, safety, and environmental matters, and the costs of complying with such laws and regulations ; and (xxii) exposure to product liability and property claims that may be in excess of our liability insurance coverage . Should one or more of those risks or uncertainties materialize adversely, or should underlying assumptions or estimates prove incorrect, actual results may vary materially from those described . For a discussion of these and other risks and uncertainties, refer to our Annual Report on Form 10 - K, Part I, “Item 1 A, Risk Factors” and our other filings filed from time to time with the U . S . Securities and Exchange Commission . These events and uncertainties are difficult or impossible to predict accurately and many are beyond our control . The risks described in these reports are not the only risks we face, as additional risks and uncertainties are not currently known or foreseeable or impossible to predict accurately or risks that are beyond our control or deemed immaterial may materially adversely affect our business, financial condition or results of operations in future periods . We assume no obligation to update any forward - looking statements to reflect events or circumstances after the date of such statements or to reflect the occurrence of anticipated or unanticipated events , except as required by law . Non - GAAP Financial Measures : This presentation includes certain non - GAAP financial measures . Please refer to the Appendix for additional information on these non - GAAP financial measures and reconciliations to the most directly comparable GAAP financial measures . Unless otherwise noted, the statements made and the information provided in this presentation are as of July 21 , 2026 . Forward - looking Statements © 2026 AAR CORP. All rights reserved worldwide 2
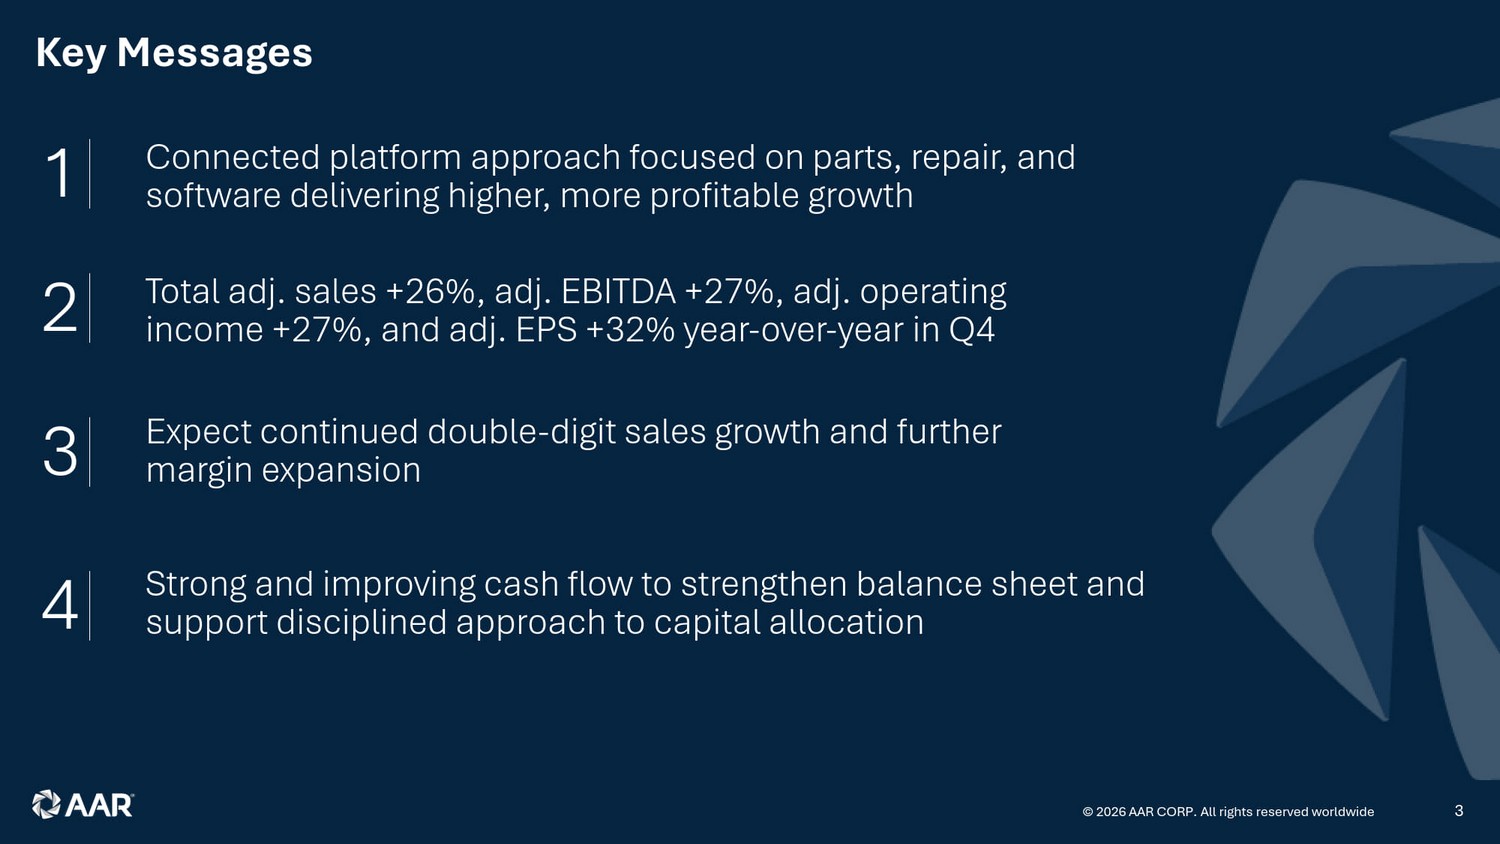
Key Messages © 2026 AAR CORP. All rights reserved worldwide 3 1 Connected platform approach focused on parts, repair, and software delivering higher, more profitable growth 2 Total adj. sales +26%, adj. EBITDA +27%, adj. operating income +27%, and adj. EPS +32% year - over - year in Q4 3 Expect continued double - digit sales growth and further margin expansion 4 Strong and improving cash flow to strengthen balance sheet and support disciplined approach to capital allocation
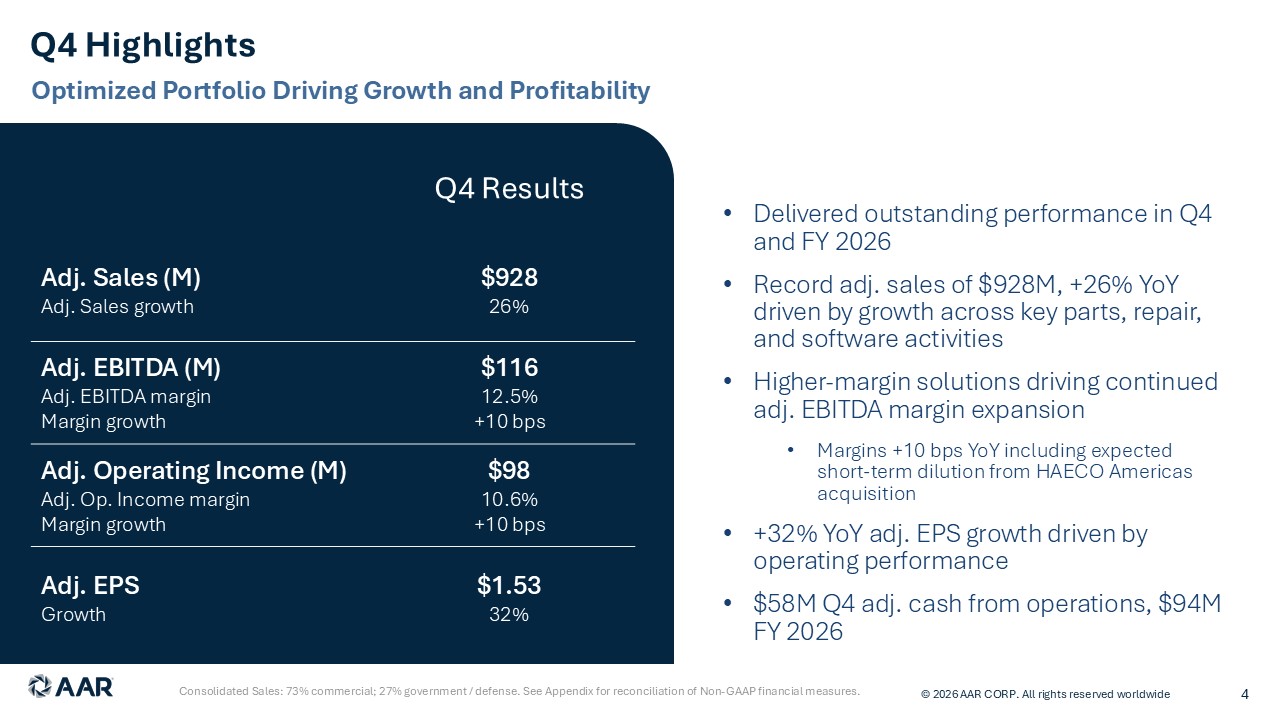
Q4 Highlights © 2026 AAR CORP. All rights reserved worldwide 4 Consolidated Sales: 73% commercial; 27% government / defense. See Appendix for reconciliation of Non - GAAP financial measures. Optimized Portfolio Driving Growth and Profitability Q4 Results $928 26% Adj. Sales (M) Adj. Sales growth $116 12.5% +10 bps Adj. EBITDA (M) Adj. EBITDA margin Margin growth $98 10.6% +10 bps Adj. Operating Income (M) Adj. Op. Income margin Margin growth $1.53 32% Adj. EPS Growth • Delivered outstanding performance in Q4 and FY 2026 • Record adj. sales of $928M, +26% YoY driven by growth across key parts, repair, and software activities • Higher - margin solutions driving continued adj. EBITDA margin expansion • Margins +10 bps YoY including expected short - term dilution from HAECO Americas integration • +32% YoY adj. EPS growth driven by operating performance • $58M Q4 adj. cash from operations, $94M FY 2026
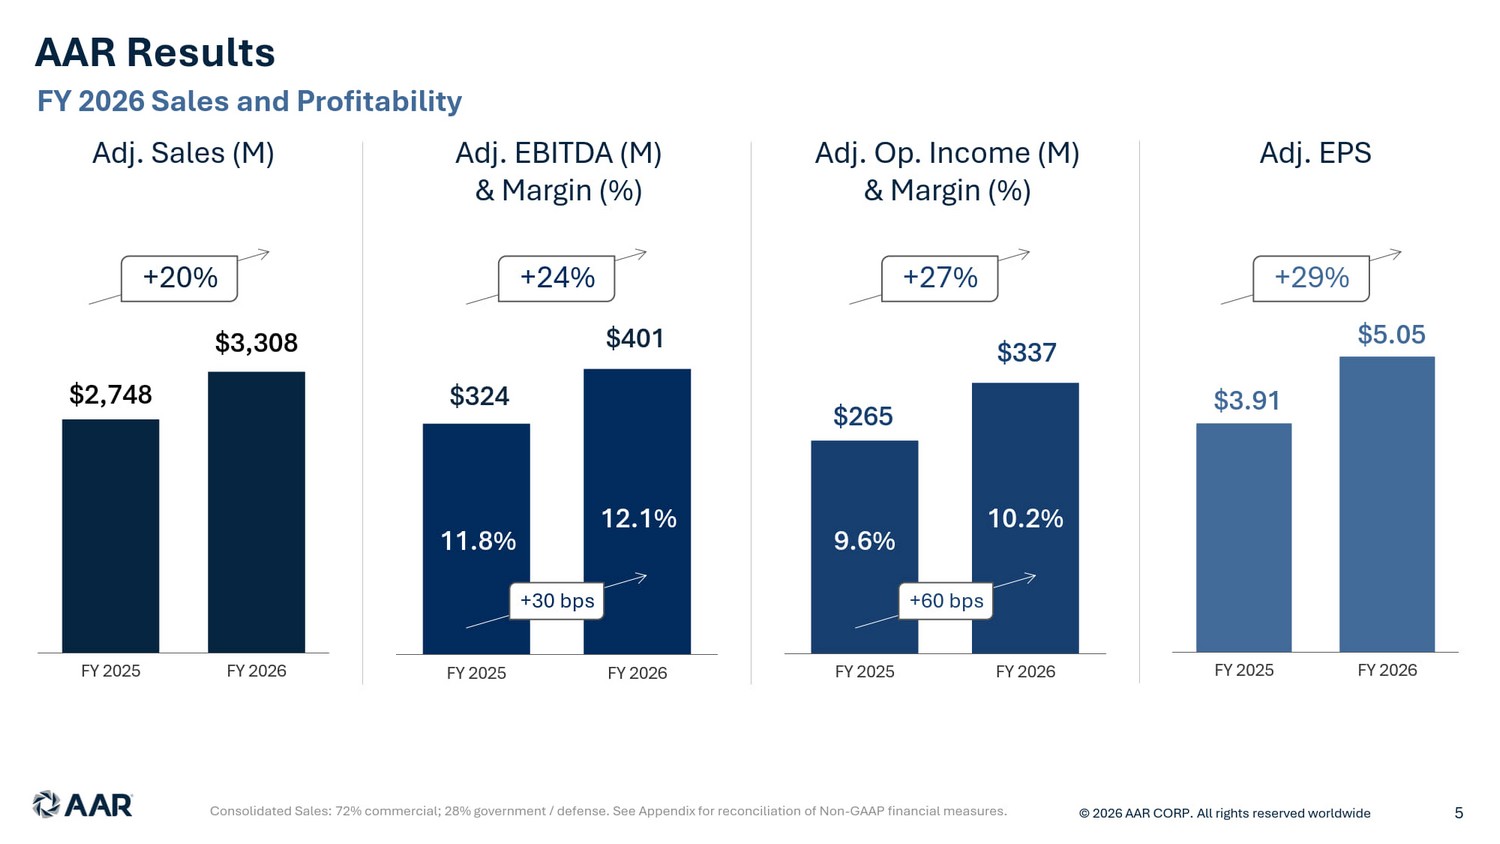
AAR Results © 2026 AAR CORP. All rights reserved worldwide 5 Consolidated Sales: 72% commercial; 28% government / defense. See Appendix for reconciliation of Non - GAAP financial measures. $3.91 $5.05 FY 2025 FY 2026 Adj. EPS $2,748 $3,308 FY 2025 FY 2026 Adj. Sales ( M ) $265 $337 FY 2025 FY 2026 Adj. Op. Income (M) & Margin (%) $324 $401 FY 2025 FY 2026 Adj. EBITDA (M) & Margin (%) +20% +24% + 27 % +29% 11.8% 12.1% 9.6% 10.2% +30 bps +60 bps FY 2026 Sales and Profitability
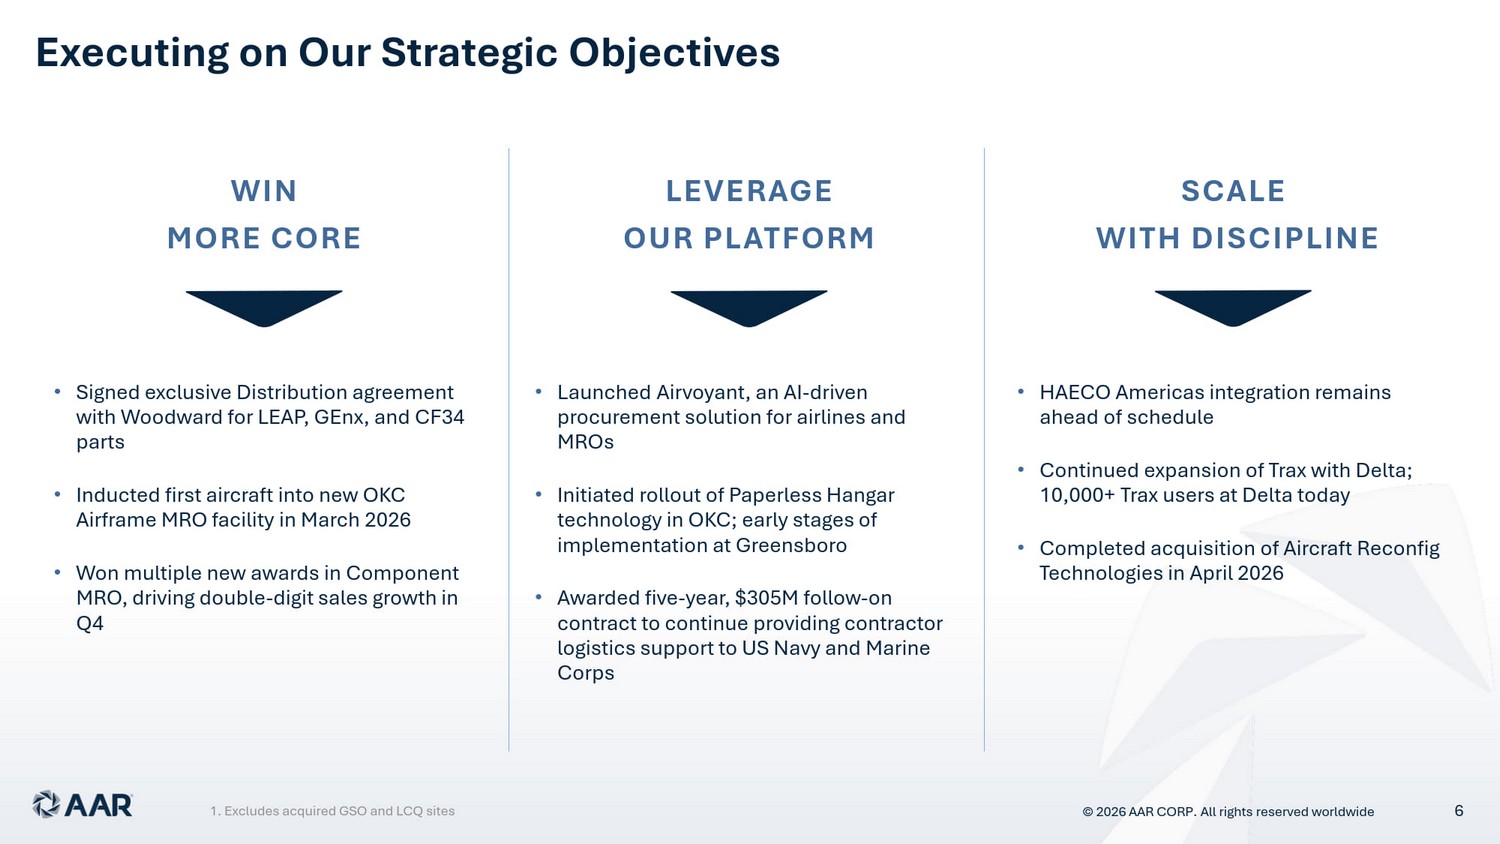
Executing on Our Strategic Objectives © 2026 AAR CORP. All rights reserved worldwide 6 WIN MORE CORE LEVERAGE OUR PLATFORM SCALE WITH DISCIPLINE • Signed exclusive Distribution agreement with Woodward for LEAP, GEnx , and CF34 parts • Inducted first aircraft into new OKC Airframe MRO facility in March 2026 • Won multiple new awards in Component MRO, driving double - digit sales growth in Q4 • Launched Airvoyant , an AI - driven procurement solution for airlines and MROs • Initiated rollout of Paperless Hangar technology in OKC; early stages of implementation at Greensboro • Awarded five - year, $305M follow - on contract to continue providing contractor logistics support to US Navy and Marine Corps • HAECO Americas integration remains ahead of schedule • Continued expansion of Trax with Delta; 10,000+ Trax users at Delta today • Completed acquisition of Aircraft Reconfig Technologies in April 2026 1. Excludes acquired GSO and LCQ sites
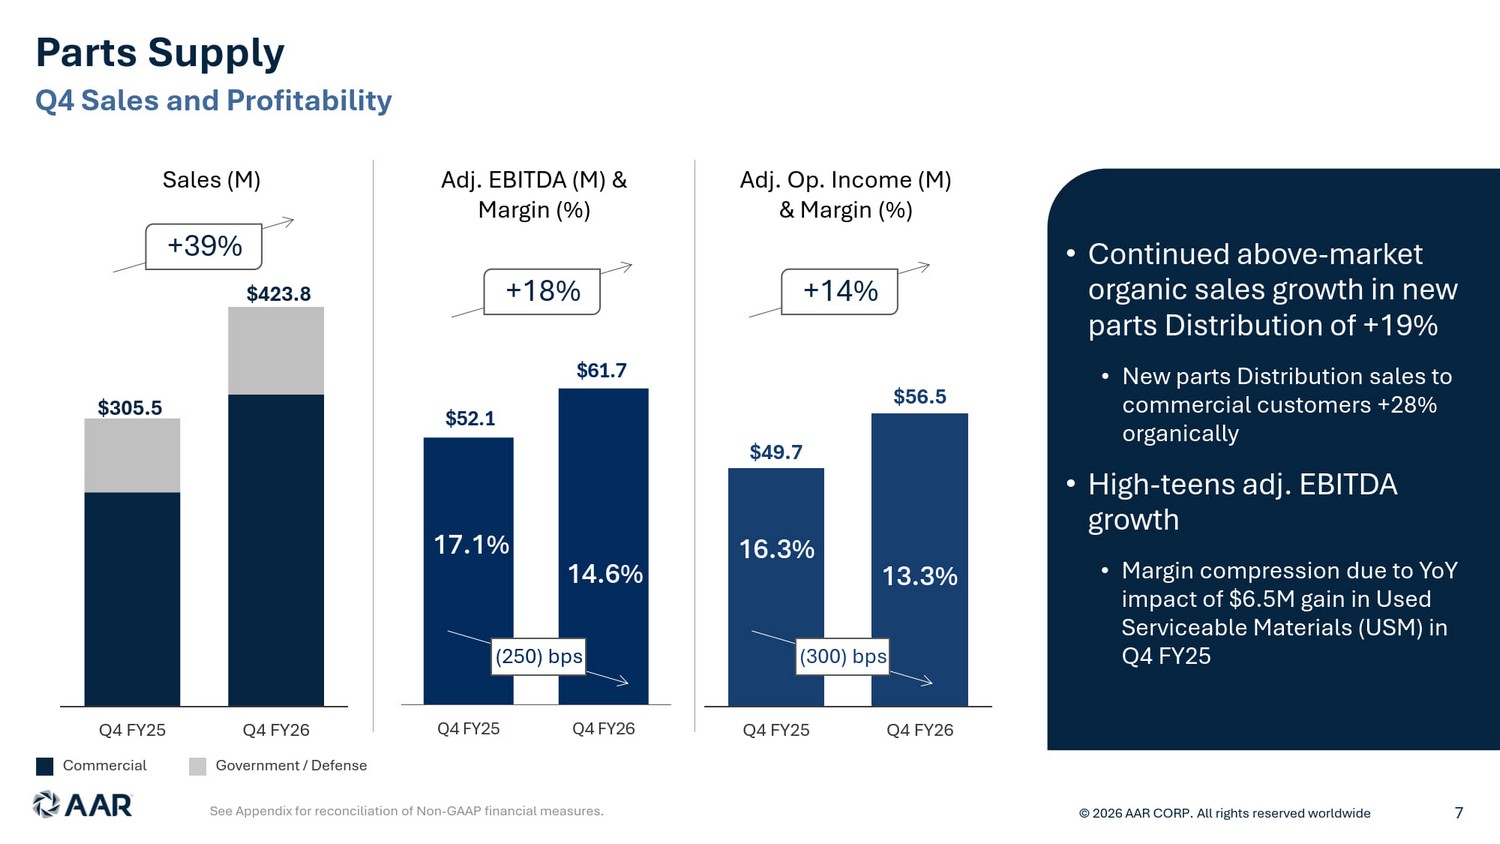
$49.7 $56.5 Q4 FY25 Q4 FY26 Q4 Sales and Profitability Parts Supply See Appendix for reconciliation of Non - GAAP financial measures. Sales (M) Adj. EBITDA (M) & Margin (%) $52.1 $61.7 Q4 FY25 Q4 FY26 • Continued above - market organic sales growth in new parts Distribution of +19% • New parts Distribution sales to commercial customers +28% organically • High - teens adj. EBITDA growth • Margin compression due to YoY impact of $6.5M gain in Used Serviceable Materials (USM) in Q4 FY25 Adj. Op. Income (M) & Margin (%) © 2026 AAR CORP. All rights reserved worldwide 7 +39% +18% 17.1% 14.6% +14% 16.3% 13.3% (250) bps (300) bps $305.5 $423.8 Q4 FY25 Q4 FY26 Commercial Government / Defense
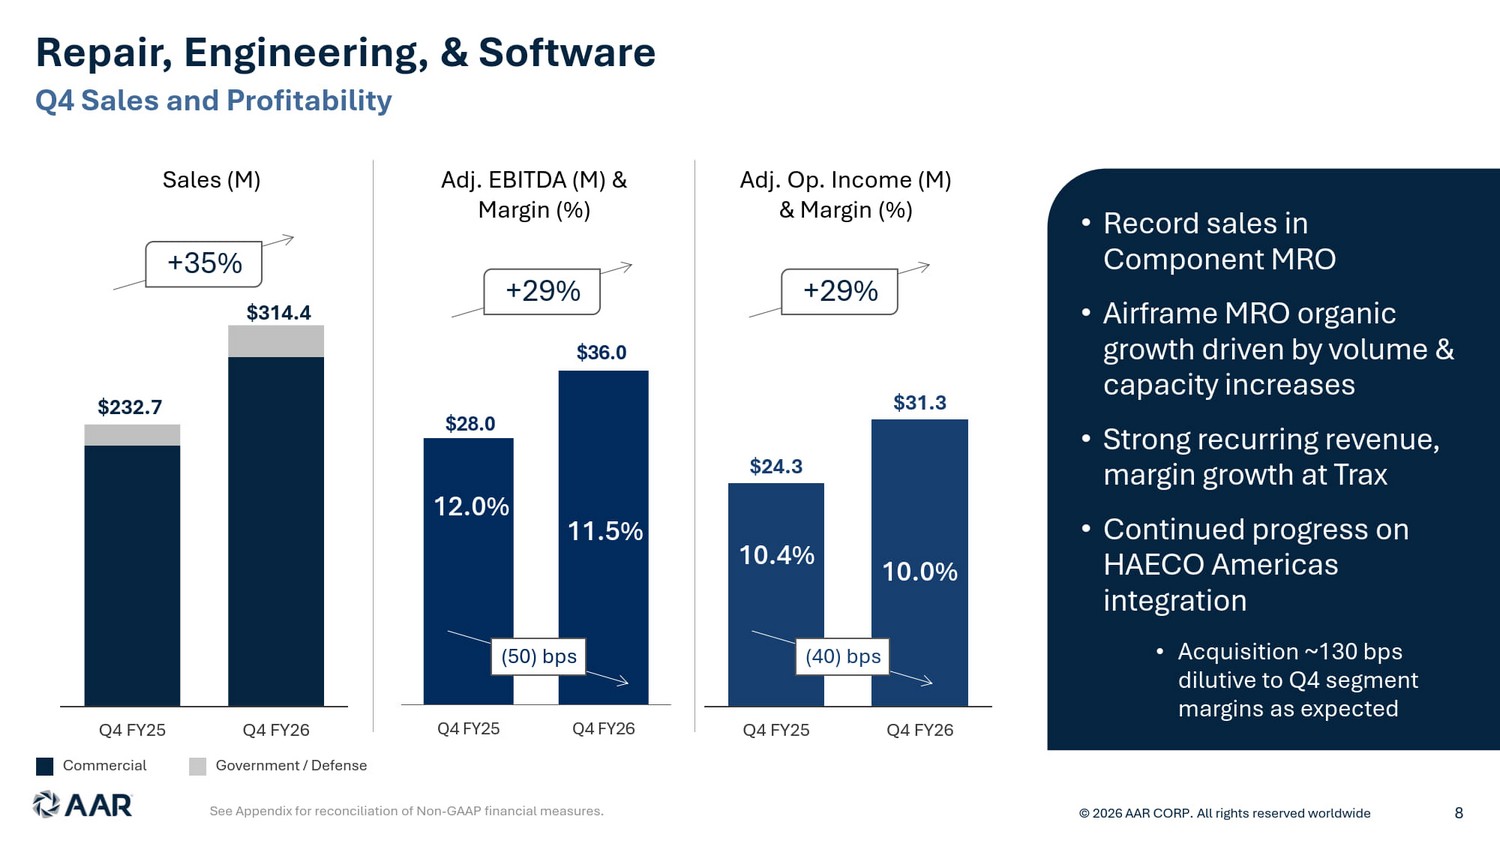
$24.3 $31.3 Q4 FY25 Q4 FY26 Q4 Sales and Profitability Repair, Engineering, & Software See Appendix for reconciliation of Non - GAAP financial measures. Sales (M) Adj. EBITDA (M) & Margin (%) $28.0 $36.0 Q4 FY25 Q4 FY26 • Record sales in Component MRO • Airframe MRO organic growth driven by volume & capacity increases • Strong recurring revenue, margin growth at Trax • Continued progress on HAECO Americas integration • Acquisition ~130 bps dilutive to Q4 segment margins as expected © 2026 AAR CORP. All rights reserved worldwide 8 +35% +29% 12.0% 11.5% +29% 10.4% 10.0% (50) bps (40) bps $232.7 $314.4 Q4 FY25 Q4 FY26 Adj. Op. Income (M) & Margin (%) Commercial Government / Defense
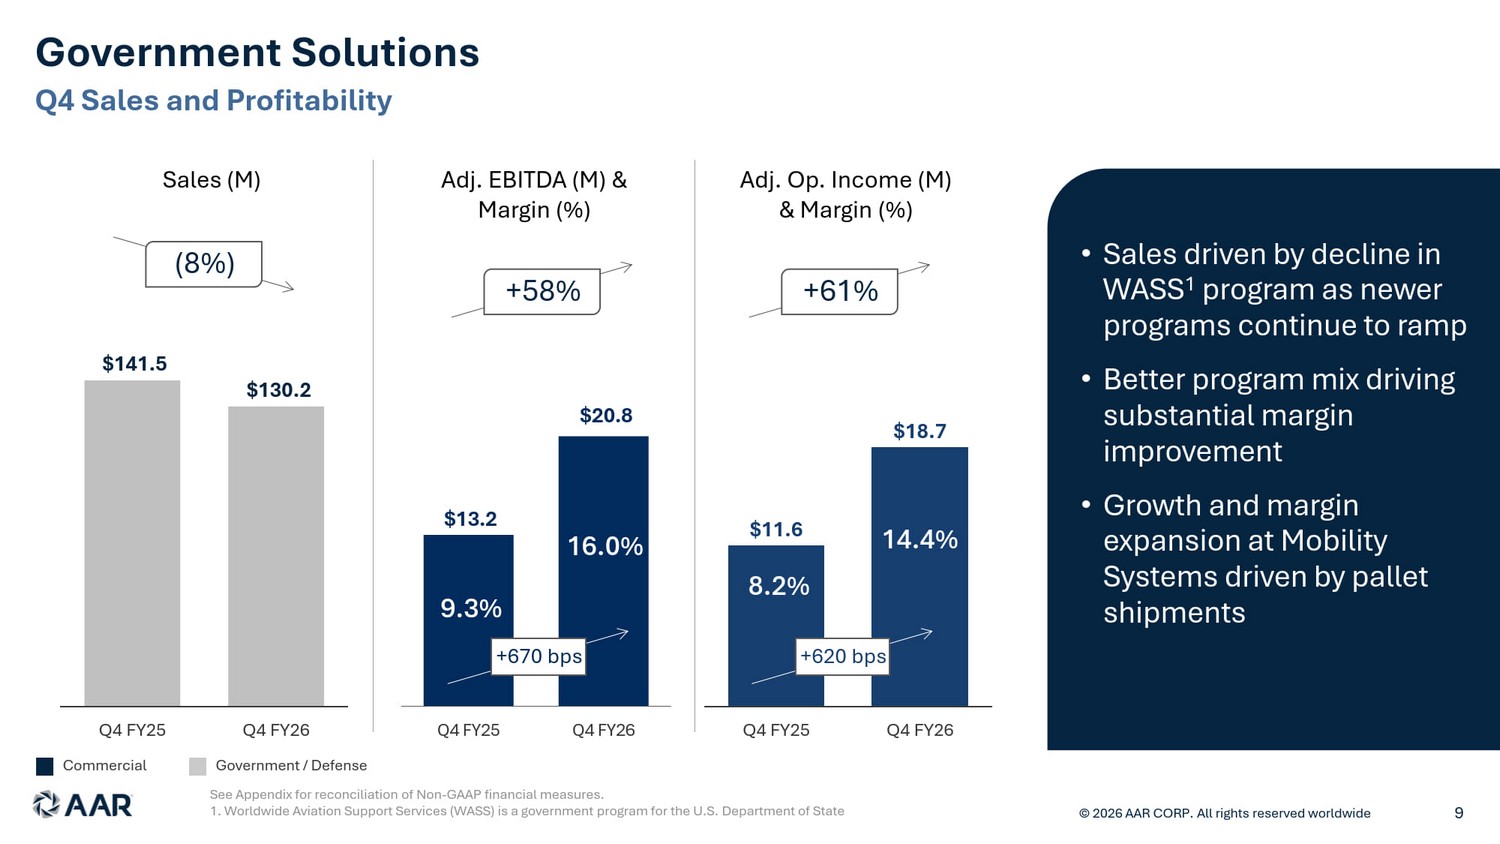
$11.6 $18.7 Q4 FY25 Q4 FY26 Q4 Sales and Profitability Government Solutions See Appendix for reconciliation of Non - GAAP financial measures. 1. Worldwide Aviation Support Services (WASS) is a government program for the U.S. Department of State Sales (M) Adj. EBITDA (M) & Margin (%) Commercial Government / Defense $13.2 $20.8 Q4 FY25 Q4 FY26 • Sales driven by decline in WASS 1 program as newer programs continue to ramp • Better program mix driving substantial margin improvement • Growth and margin expansion at Mobility Systems driven by pallet shipments © 2026 AAR CORP. All rights reserved worldwide 9 (8%) +58% 9.3% 16.0% +61% 8.2% 14.4% +670 bps +620 bps $141.5 $130.2 Q4 FY25 Q4 FY26 Adj. Op. Income (M) & Margin (%)
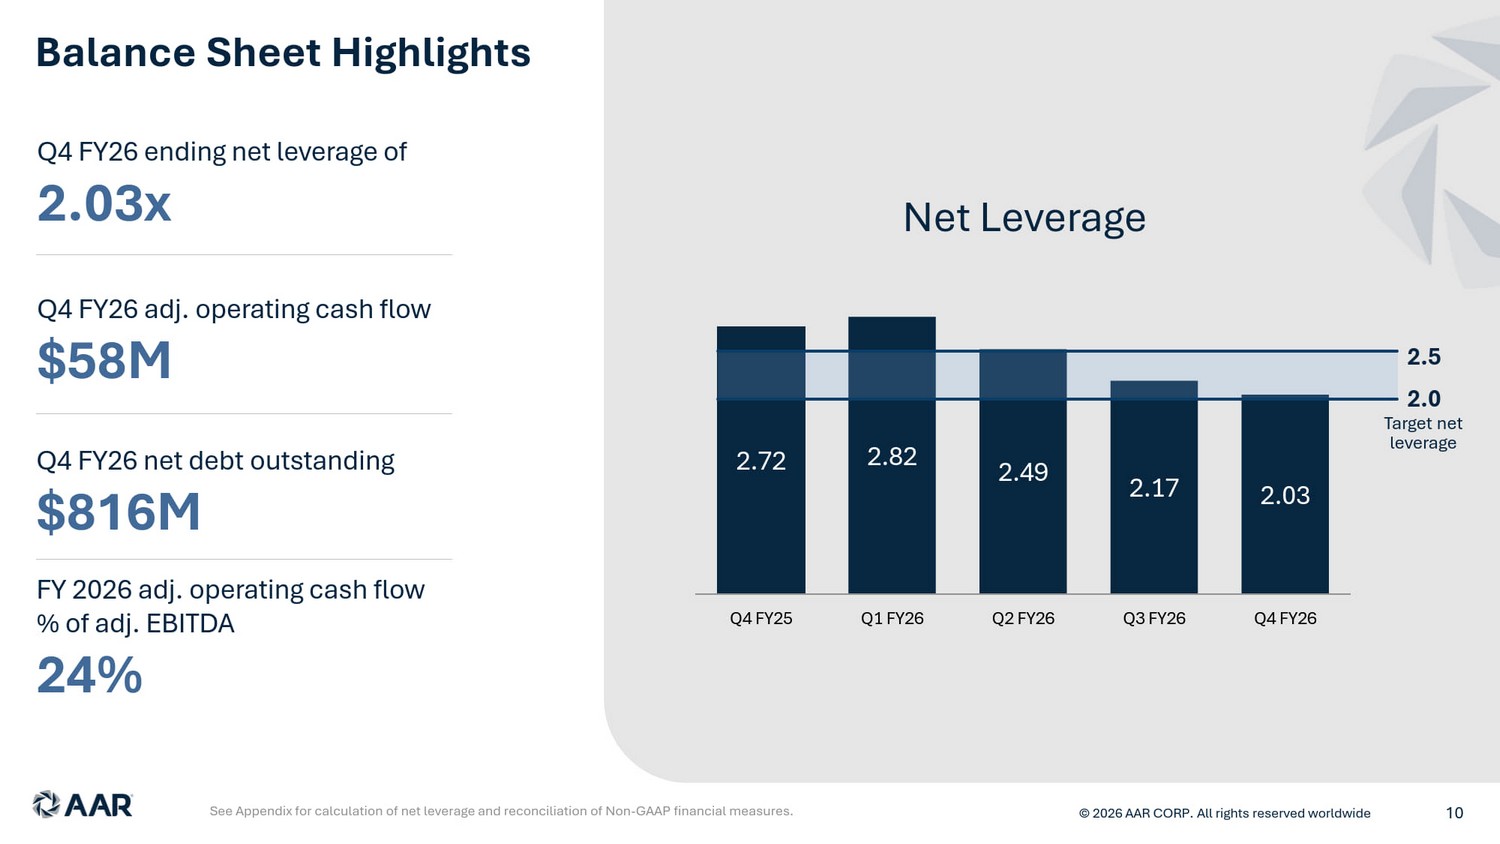
Balance Sheet Highlights See Appendix for calculation of net leverage and reconciliation of Non - GAAP financial measures. Q4 FY26 ending net leverage of 2.03x Q4 FY26 net debt outstanding $816M 2.72 2.82 2.49 2.17 2.03 Q4 FY25 Q1 FY26 Q2 FY26 Q3 FY26 Q4 FY26 Net Leverage Target net leverage 2.0 2.5 © 2026 AAR CORP. All rights reserved worldwide 10 Q4 FY26 adj. operating cash flow $58M FY 2026 adj. operating cash flow % of adj. EBITDA 24%
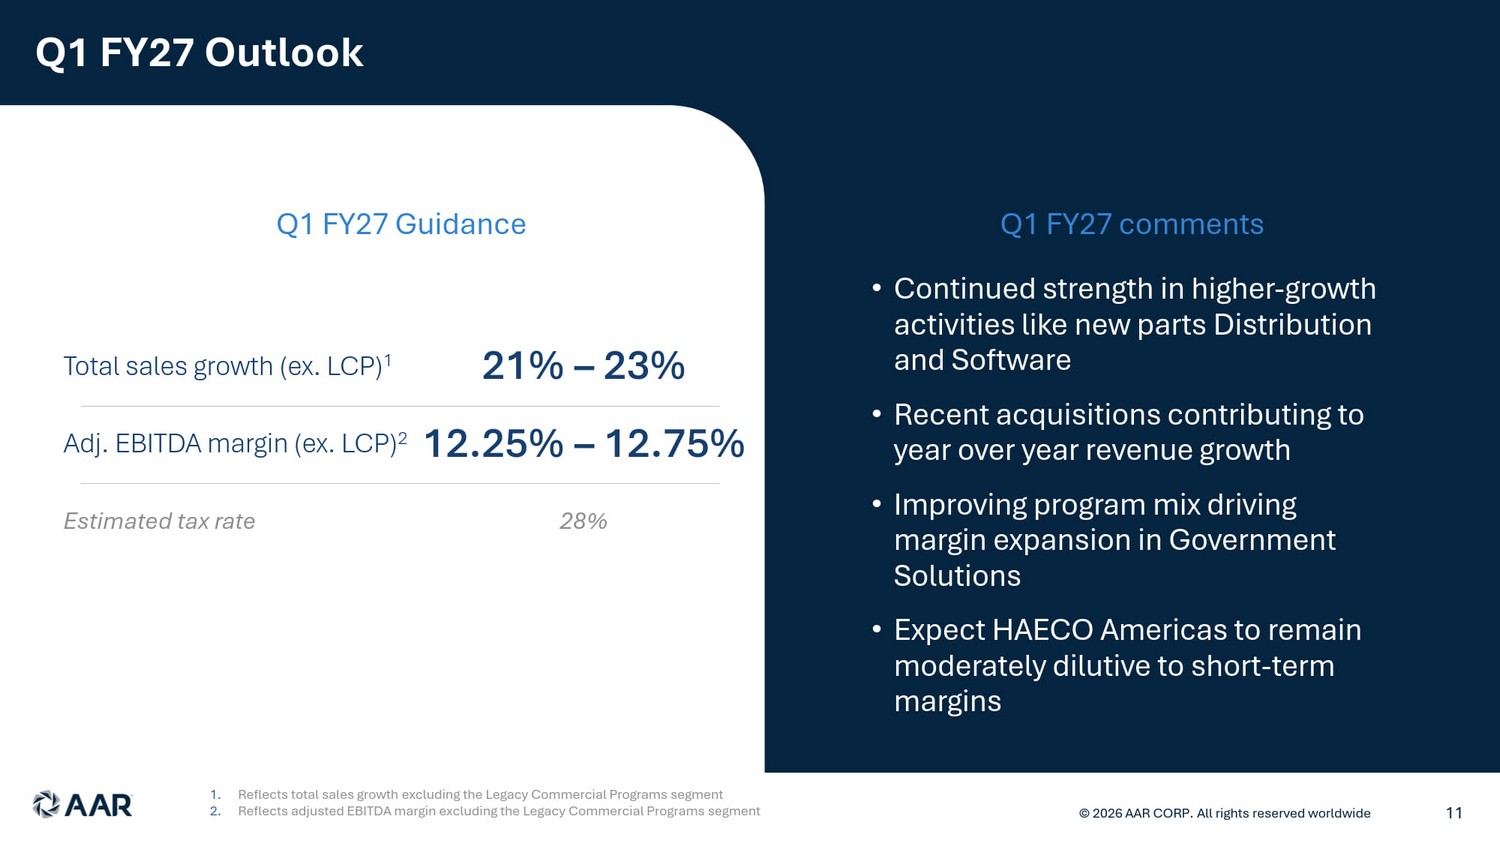
Q1 FY27 Outlook Total sales growth (ex. LCP) 1 21 % – 23% Adj. EBITDA margin (ex. LCP) 2 12.25 % – 12.75% Q1 FY27 Guidance © 2026 AAR CORP. All rights reserved worldwide 11 Estimated tax rate 28% • Continued strength in higher - growth activities like new parts Distribution and Software • Recent acquisitions contributing to year over year revenue growth • Improving program mix driving margin expansion in Government Solutions • Expect HAECO Americas to remain moderately dilutive to short - term margins Q1 FY27 comments 1. Reflects total sales growth excluding the Legacy Commercial Programs segment 2. Reflects adjusted EBITDA margin excluding the Legacy Commercial Programs segment
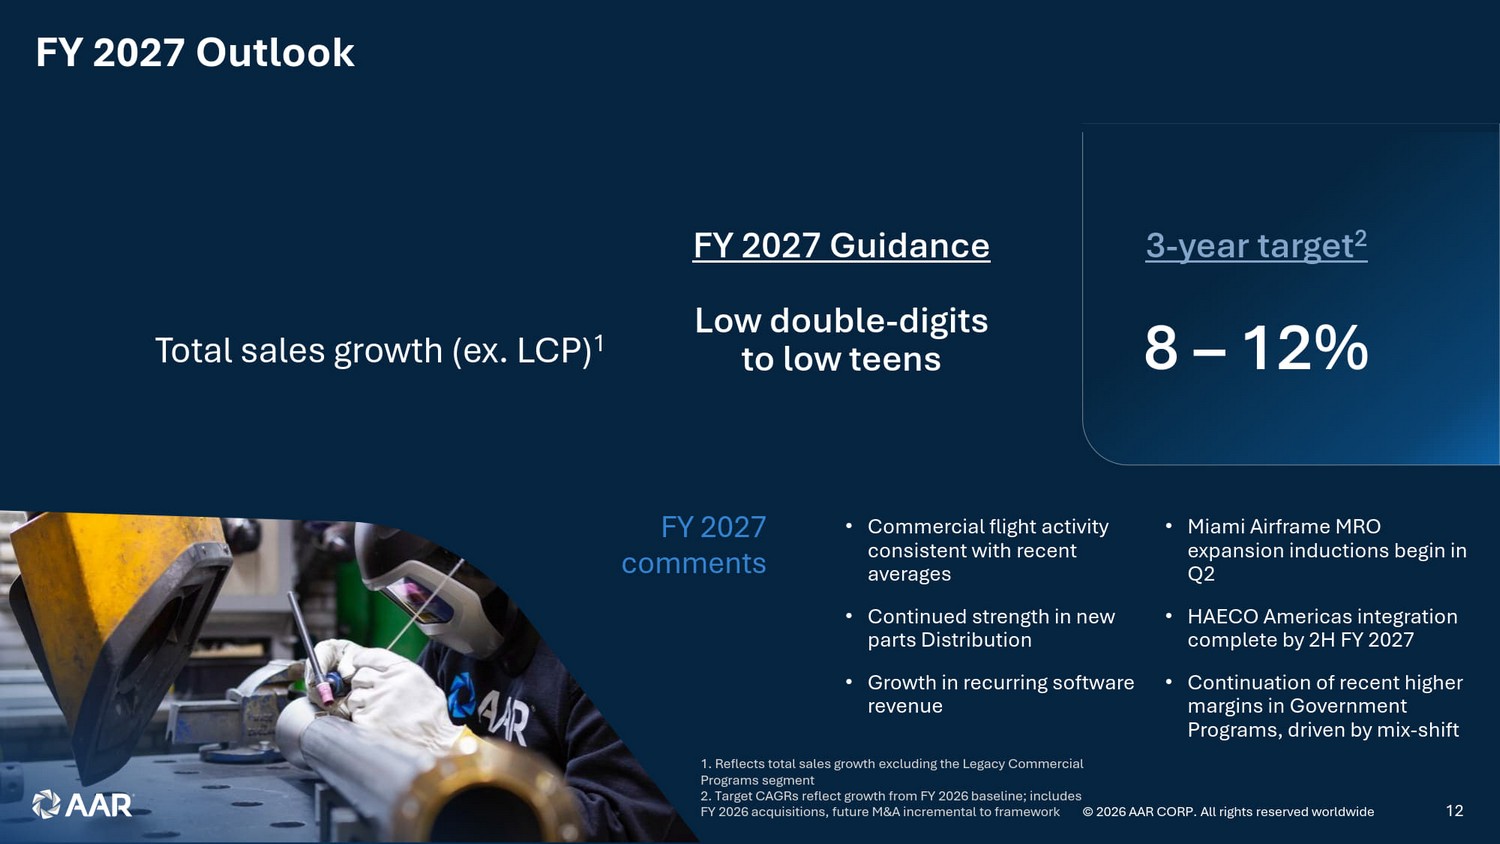
FY 2027 Outlook © 2026 AAR CORP. All rights reserved worldwide 12 1. Reflects total sales growth excluding the Legacy Commercial Programs segment 2. Target CAGRs reflect growth from FY 2026 baseline; includes FY 2026 acquisitions, future M&A incremental to framework 8 – 12% 3 - year target 2 Low double - digits to low teens FY 2027 Guidance Total sales growth (ex. LCP) 1 FY 2027 comments • Commercial flight activity consistent with recent averages • Continued strength in new parts Distribution • Growth in recurring software revenue • Miami Airframe MRO expansion inductions begin in Q2 • HAECO Americas integration complete by 2H FY 2027 • Continuation of recent higher margins in Government Programs, driven by mix - shift

© 2026 AAR CORP. All rights reserved worldwide 13

© 2026 AAR CORP. All rights reserved worldwide. 14 Appendix
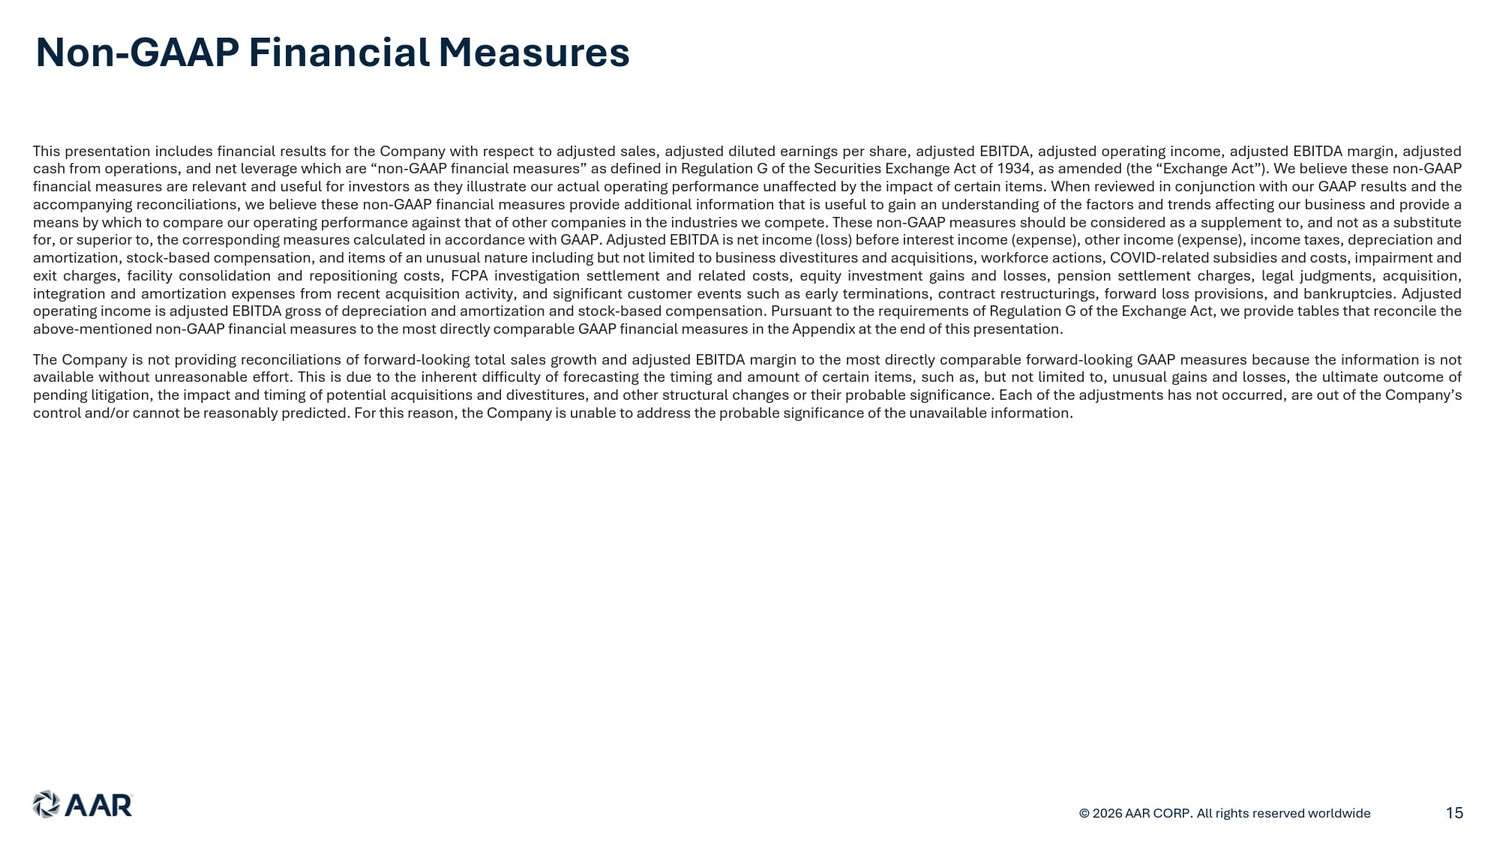
© 2026 AAR CORP. All rights reserved worldwide 15 This presentation includes financial results for the Company with respect to adjusted sales, adjusted diluted earnings per share, adjusted EBITDA , adjusted operating income, adjusted EBITDA margin, adjusted cash from operations, and net leverage which are “non - GAAP financial measures” as defined in Regulation G of the Securities Exchange Act of 1934 , as amended (the “Exchange Act”) . We believe these non - GAAP financial measures are relevant and useful for investors as they illustrate our actual operating performance unaffected by the impact of certain items . When reviewed in conjunction with our GAAP results and the accompanying reconciliations, we believe these non - GAAP financial measures provide additional information that is useful to gain an understanding of the factors and trends affecting our business and provide a means by which to compare our operating performance against that of other companies in the industries we compete . These non - GAAP measures should be considered as a supplement to, and not as a substitute for, or superior to, the corresponding measures calculated in accordance with GAAP . Adjusted EBITDA is net income (loss) before interest income (expense), other income (expense), income taxes, depreciation and amortization, stock - based compensation, and items of an unusual nature including but not limited to business divestitures and acquisitions, workforce actions, COVID - related subsidies and costs, impairment and exit charges, facility consolidation and repositioning costs, FCPA investigation settlement and related costs, equity investment gains and losses, pension settlement charges, legal judgments, acquisition, integration and amortization expenses from recent acquisition activity, and significant customer events such as early terminations, contract restructurings, forward loss provisions, and bankruptcies . Adjusted operating income is adjusted EBITDA gross of depreciation and amortization and stock - based compensation . Pursuant to the requirements of Regulation G of the Exchange Act, we provide tables that reconcile the above - mentioned non - GAAP financial measures to the most directly comparable GAAP financial measures in the Appendix at the end of this presentation . The Company is not providing reconciliations of forward - looking total sales growth and adjusted EBITDA margin to the most directly comparable forward - looking GAAP measures because the information is not available without unreasonable effort . This is due to the inherent difficulty of forecasting the timing and amount of certain items, such as, but not limited to, unusual gains and losses, the ultimate outcome of pending litigation, the impact and timing of potential acquisitions and divestitures, and other structural changes or their probable significance . Each of the adjustments has not occurred, are out of the Company’s control and/or cannot be reasonably predicted . For this reason, the Company is unable to address the probable significance of the unavailable information . Non - GAAP Financial Measures
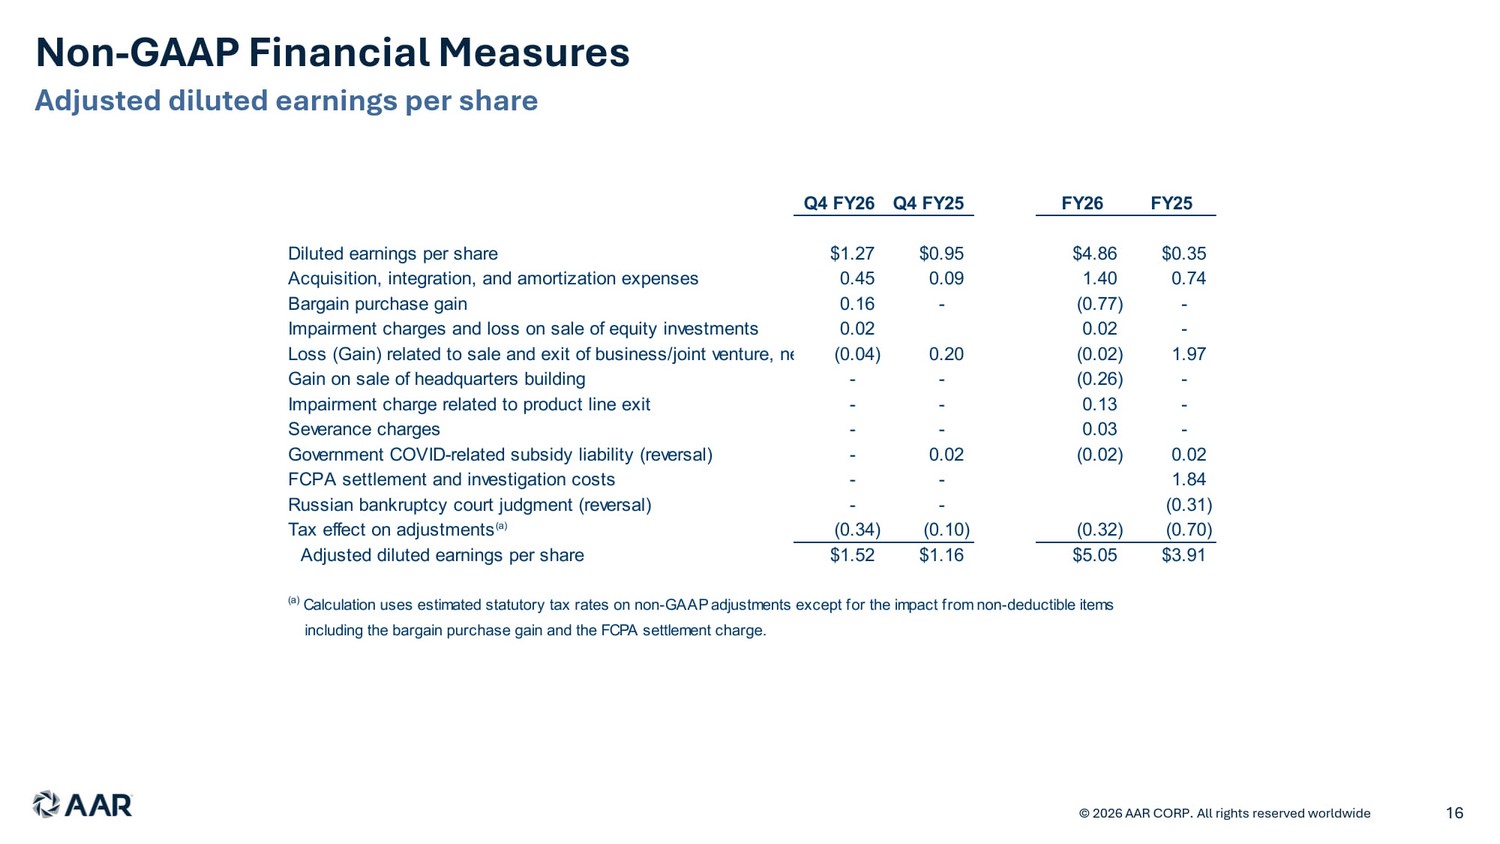
Adjusted diluted earnings per share © 2026 AAR CORP. All rights reserved worldwide 16 Non - GAAP Financial Measures Q4 FY26 Q4 FY25 FY26 FY25 Diluted earnings per share $1.27 $0.95 $4.86 $0.35 Acquisition, integration, and amortization expenses 0.45 0.09 1.40 0.74 Bargain purchase gain 0.16 - (0.77) - Impairment charges and loss on sale of equity investments 0.02 0.02 - Loss (Gain) related to sale and exit of business/joint venture, net (0.04) 0.20 (0.02) 1.97 Gain on sale of headquarters building - - (0.26) - Impairment charge related to product line exit - - 0.13 - Severance charges - - 0.03 - Government COVID-related subsidy liability (reversal) - 0.02 (0.02) 0.02 FCPA settlement and investigation costs - - 1.84 Russian bankruptcy court judgment (reversal) - - (0.31) Tax effect on adjustments (a) (0.34) (0.10) (0.32) (0.70) Adjusted diluted earnings per share $1.52 $1.16 $5.05 $3.91 (a) Calculation uses estimated statutory tax rates on non-GAAP adjustments except for the impact from non-deductible items including the bargain purchase gain and the FCPA settlement charge.
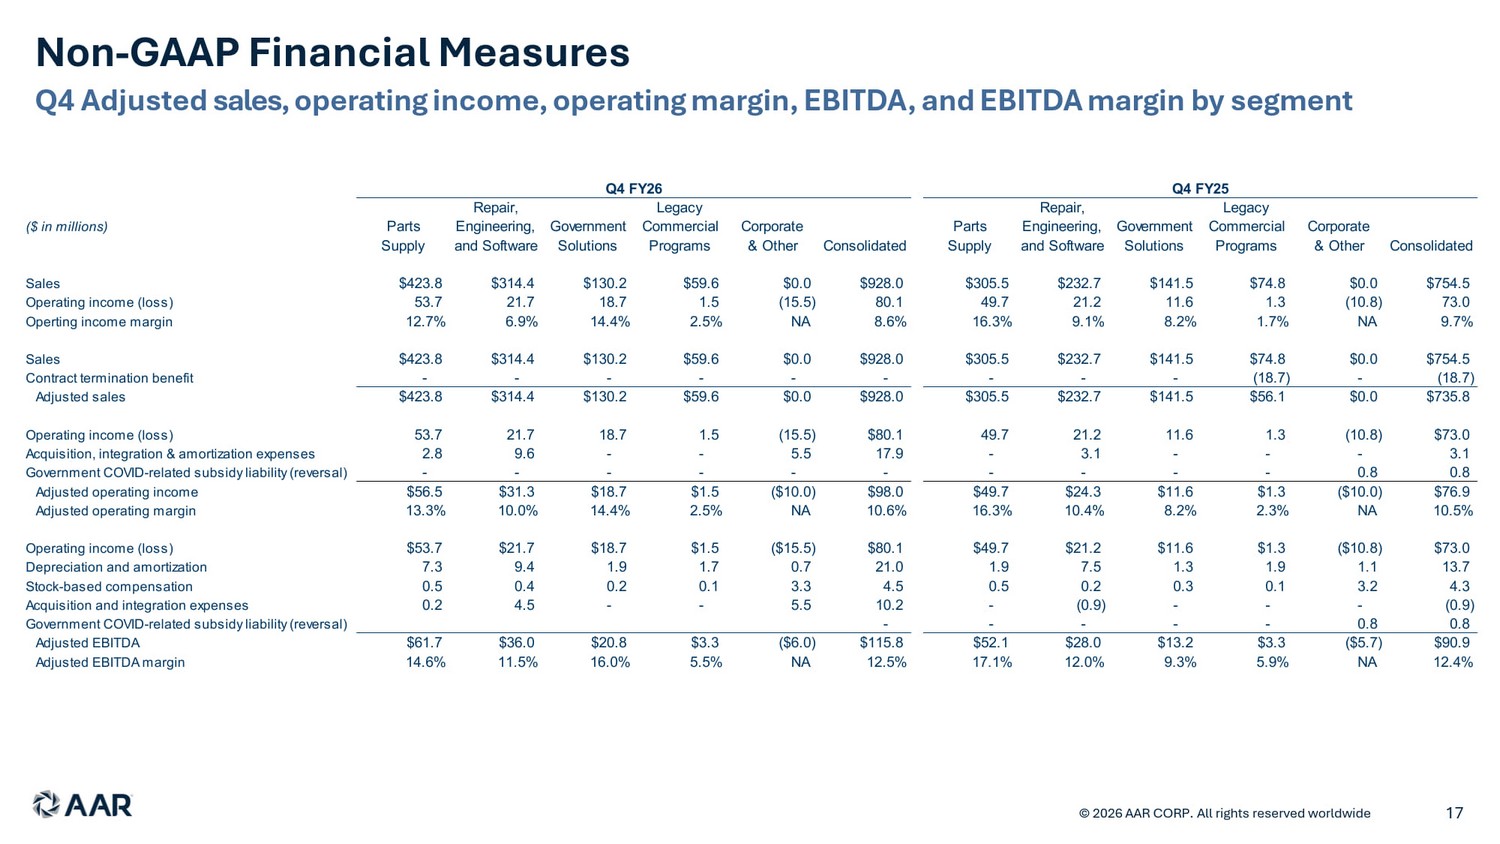
Q4 Adjusted sales, operating income, operating margin, EBITDA, and EBITDA margin by segment © 2024 AAR CORP. All rights reserved worldwide. 17 © 2026 AAR CORP. All rights reserved worldwide Non - GAAP Financial Measures Q4 FY26 Q4 FY25 Repair, Legacy Repair, Legacy ($ in millions) Parts Engineering, Government Commercial Corporate Parts Engineering, Government Commercial Corporate Supply and Software Solutions Programs & Other Consolidated Supply and Software Solutions Programs & Other Consolidated Sales $423.8 $314.4 $130.2 $59.6 $0.0 $928.0 $305.5 $232.7 $141.5 $74.8 $0.0 $754.5 Operating income (loss) 53.7 21.7 18.7 1.5 (15.5) 80.1 49.7 21.2 11.6 1.3 (10.8) 73.0 Operting income margin 12.7% 6.9% 14.4% 2.5% NA 8.6% 16.3% 9.1% 8.2% 1.7% NA 9.7% Sales $423.8 $314.4 $130.2 $59.6 $0.0 $928.0 $305.5 $232.7 $141.5 $74.8 $0.0 $754.5 Contract termination benefit - - - - - - - - - (18.7) - (18.7) Adjusted sales $423.8 $314.4 $130.2 $59.6 $0.0 $928.0 $305.5 $232.7 $141.5 $56.1 $0.0 $735.8 Operating income (loss) 53.7 21.7 18.7 1.5 (15.5) $80.1 49.7 21.2 11.6 1.3 (10.8) $73.0 Acquisition, integration & amortization expenses 2.8 9.6 - - 5.5 17.9 - 3.1 - - - 3.1 Government COVID-related subsidy liability (reversal) - - - - - - - - - - 0.8 0.8 Adjusted operating income $56.5 $31.3 $18.7 $1.5 ($10.0) $98.0 $49.7 $24.3 $11.6 $1.3 ($10.0) $76.9 Adjusted operating margin 13.3% 10.0% 14.4% 2.5% NA 10.6% 16.3% 10.4% 8.2% 2.3% NA 10.5% Operating income (loss) $53.7 $21.7 $18.7 $1.5 ($15.5) $80.1 $49.7 $21.2 $11.6 $1.3 ($10.8) $73.0 Depreciation and amortization 7.3 9.4 1.9 1.7 0.7 21.0 1.9 7.5 1.3 1.9 1.1 13.7 Stock-based compensation 0.5 0.4 0.2 0.1 3.3 4.5 0.5 0.2 0.3 0.1 3.2 4.3 Acquisition and integration expenses 0.2 4.5 - - 5.5 10.2 - (0.9) - - - (0.9) Government COVID-related subsidy liability (reversal) - - - - - 0.8 0.8 Adjusted EBITDA $61.7 $36.0 $20.8 $3.3 ($6.0) $115.8 $52.1 $28.0 $13.2 $3.3 ($5.7) $90.9 Adjusted EBITDA margin 14.6% 11.5% 16.0% 5.5% NA 12.5% 17.1% 12.0% 9.3% 5.9% NA 12.4%
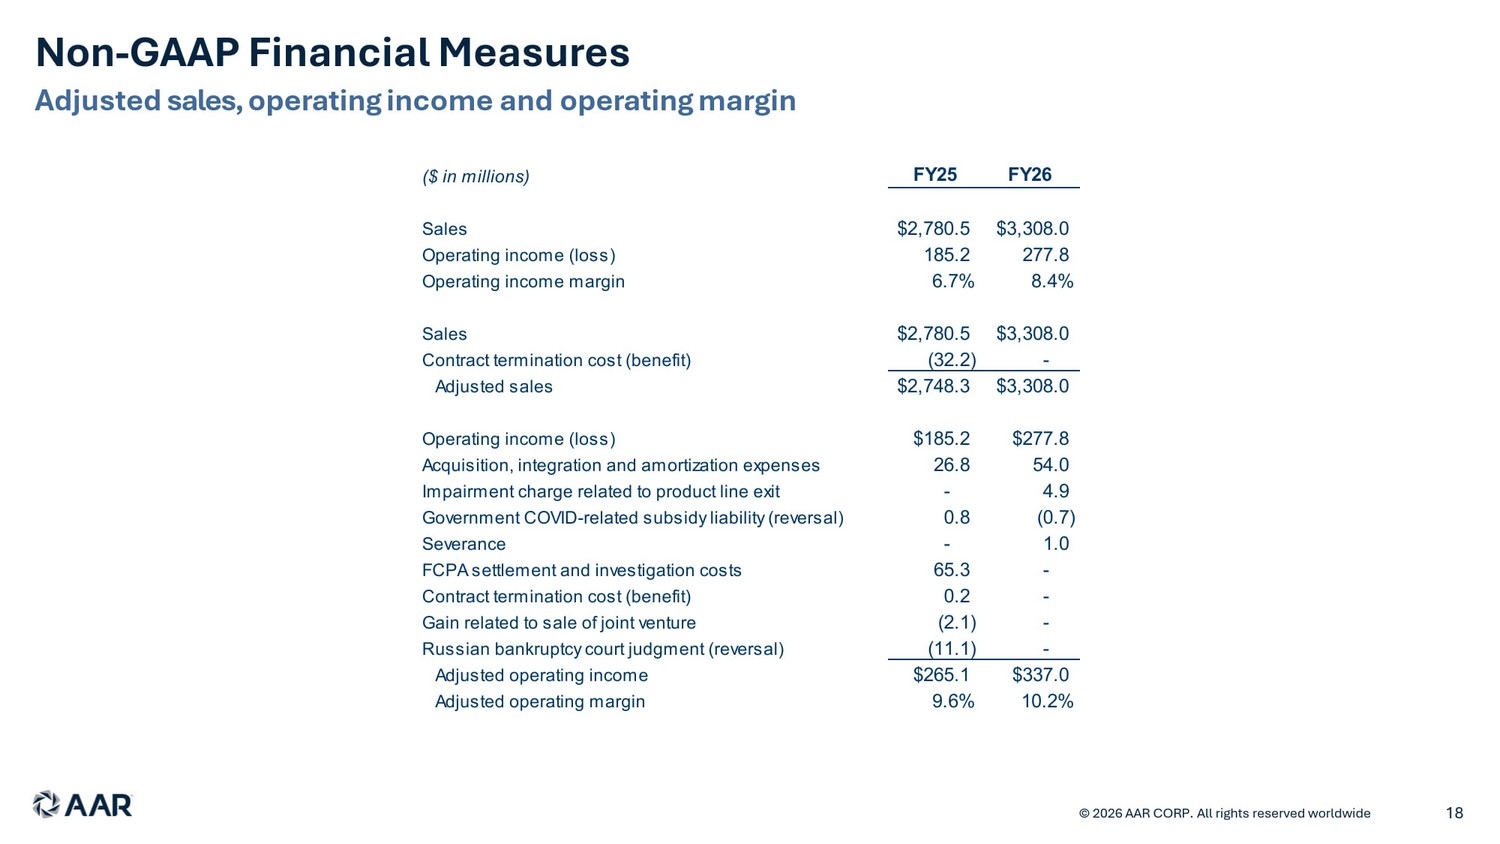
Adjusted sales, operating income and operating margin © 2024 AAR CORP. All rights reserved worldwide. 18 © 2026 AAR CORP. All rights reserved worldwide Non - GAAP Financial Measures ($ in millions) FY25 FY26 Sales $2,780.5 $3,308.0 Operating income (loss) 185.2 277.8 Operating income margin 6.7% 8.4% Sales $2,780.5 $3,308.0 Contract termination cost (benefit) (32.2) - Adjusted sales $2,748.3 $3,308.0 Operating income (loss) $185.2 $277.8 Acquisition, integration and amortization expenses 26.8 54.0 Impairment charge related to product line exit - 4.9 Government COVID-related subsidy liability (reversal) 0.8 (0.7) Severance - 1.0 FCPA settlement and investigation costs 65.3 - Contract termination cost (benefit) 0.2 - Gain related to sale of joint venture (2.1) - Russian bankruptcy court judgment (reversal) (11.1) - Adjusted operating income $265.1 $337.0 Adjusted operating margin 9.6% 10.2%
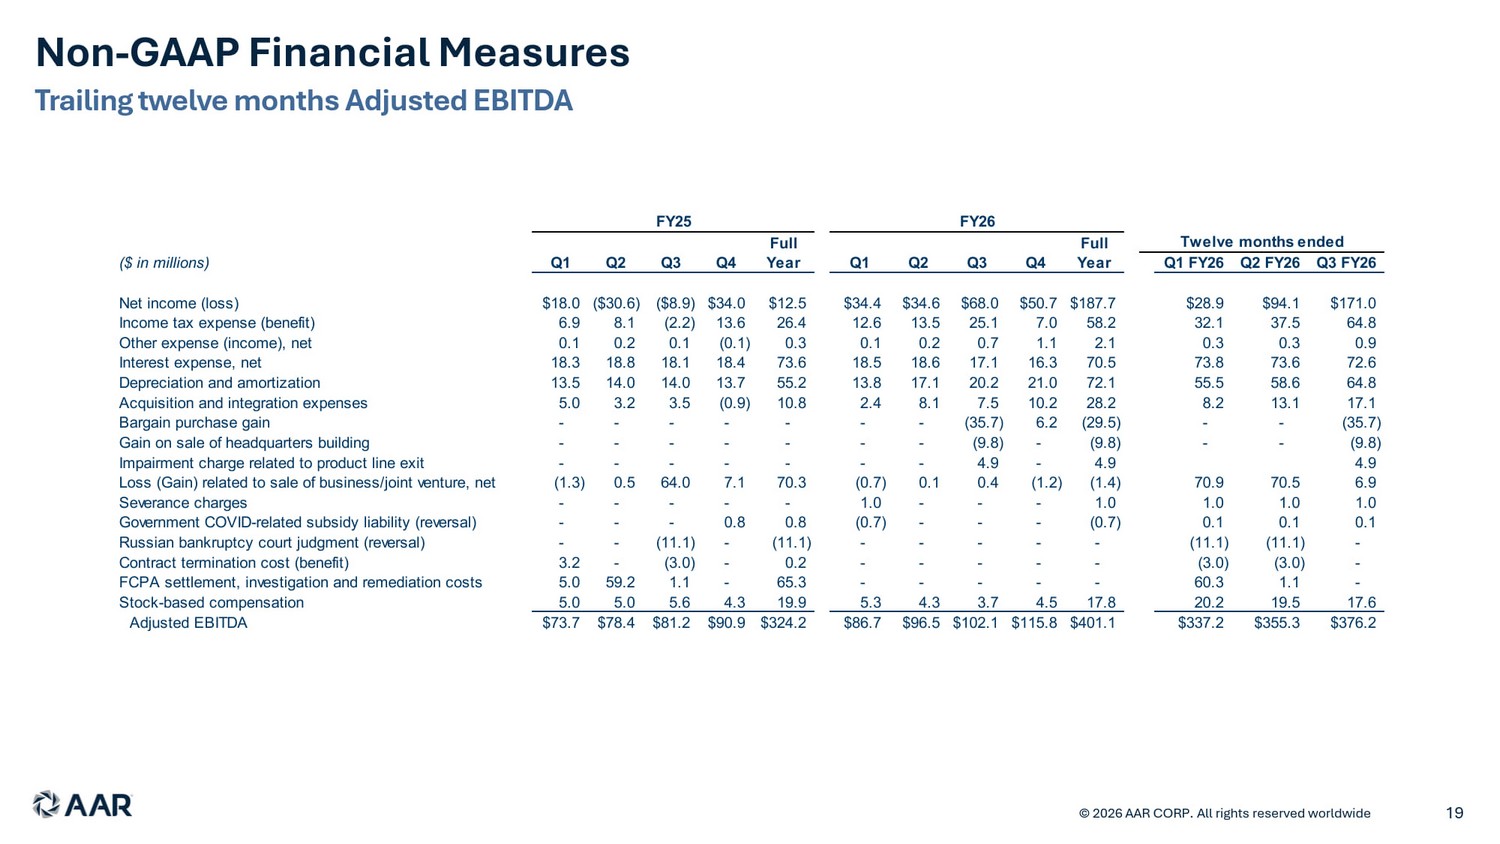
Trailing twelve months Adjusted EBITDA © 2024 AAR CORP. All rights reserved worldwide. 19 © 2026 AAR CORP. All rights reserved worldwide Non - GAAP Financial Measures Full Full ($ in millions) Q1 Q2 Q3 Q4 Year Q1 Q2 Q3 Q4 Year Q1 FY26 Q2 FY26 Q3 FY26 Net income (loss) $18.0 ($30.6) ($8.9) $34.0 $12.5 $34.4 $34.6 $68.0 $50.7 $187.7 $28.9 $94.1 $171.0 Income tax expense (benefit) 6.9 8.1 (2.2) 13.6 26.4 12.6 13.5 25.1 7.0 58.2 32.1 37.5 64.8 Other expense (income), net 0.1 0.2 0.1 (0.1) 0.3 0.1 0.2 0.7 1.1 2.1 0.3 0.3 0.9 Interest expense, net 18.3 18.8 18.1 18.4 73.6 18.5 18.6 17.1 16.3 70.5 73.8 73.6 72.6 Depreciation and amortization 13.5 14.0 14.0 13.7 55.2 13.8 17.1 20.2 21.0 72.1 55.5 58.6 64.8 Acquisition and integration expenses 5.0 3.2 3.5 (0.9) 10.8 2.4 8.1 7.5 10.2 28.2 8.2 13.1 17.1 Bargain purchase gain - - - - - - - (35.7) 6.2 (29.5) - - (35.7) Gain on sale of headquarters building - - - - - - - (9.8) - (9.8) - - (9.8) Impairment charge related to product line exit - - - - - - - 4.9 - 4.9 4.9 Loss (Gain) related to sale of business/joint venture, net (1.3) 0.5 64.0 7.1 70.3 (0.7) 0.1 0.4 (1.2) (1.4) 70.9 70.5 6.9 Severance charges - - - - - 1.0 - - - 1.0 1.0 1.0 1.0 Government COVID-related subsidy liability (reversal) - - - 0.8 0.8 (0.7) - - - (0.7) 0.1 0.1 0.1 Russian bankruptcy court judgment (reversal) - - (11.1) - (11.1) - - - - - (11.1) (11.1) - Contract termination cost (benefit) 3.2 - (3.0) - 0.2 - - - - - (3.0) (3.0) - FCPA settlement, investigation and remediation costs 5.0 59.2 1.1 - 65.3 - - - - - 60.3 1.1 - Stock-based compensation 5.0 5.0 5.6 4.3 19.9 5.3 4.3 3.7 4.5 17.8 20.2 19.5 17.6 Adjusted EBITDA $73.7 $78.4 $81.2 $90.9 $324.2 $86.7 $96.5 $102.1 $115.8 $401.1 $337.2 $355.3 $376.2 FY25 Twelve months ended FY26
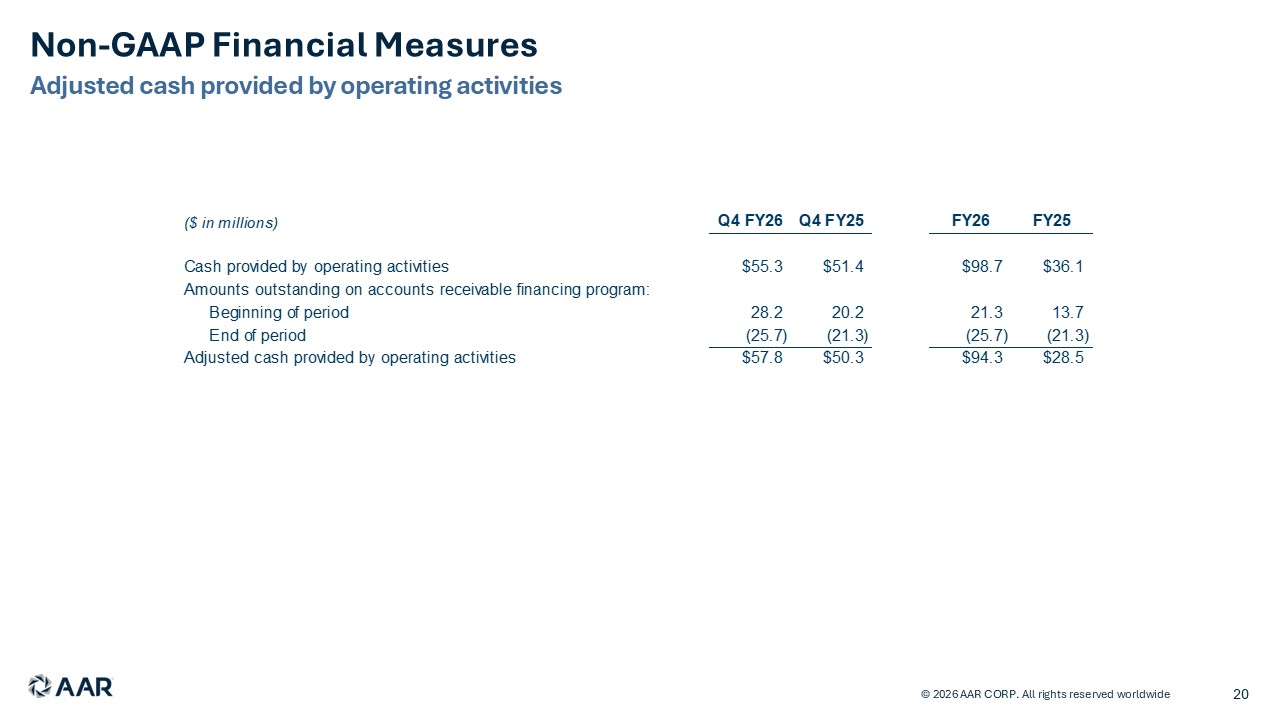
Adjusted cash provided by operating activities © 2024 AAR CORP. All rights reserved worldwide. 20 © 2026 AAR CORP. All rights reserved worldwide Non - GAAP Financial Measures (In millions - unaudited) 2026 2025 2026 2025 Cash provided by operating activities $55.30 $51.40 $98.70 $36.10 Amounts outstanding on accounts receivable financing program: Beginning of period 28.2 20.2 21.3 13.7 End of period -25.7 -21.3 -25.7 -21.3 Adjusted cash provided by operating activities $57.80 $50.30 $94.30 $28.50 Three months ended May 31, Year ended May 31,
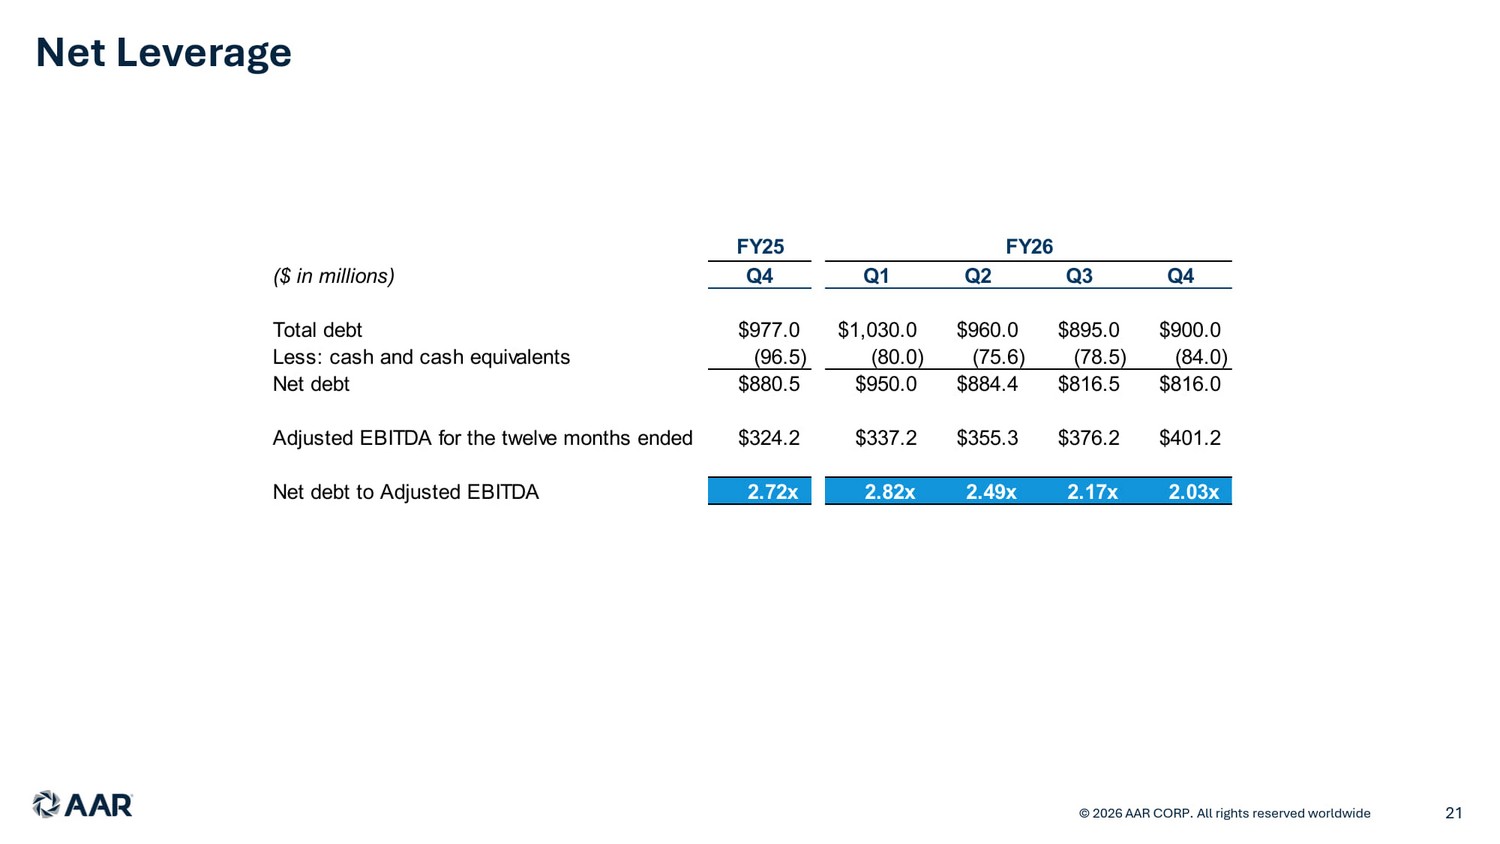
Net Leverage © 2024 AAR CORP. All rights reserved worldwide. 21 © 2026 AAR CORP. All rights reserved worldwide ($ in millions) Q4 Q1 Q2 Q3 Q4 Total debt $977.0 $1,030.0 $960.0 $895.0 $900.0 Less: cash and cash equivalents (96.5) (80.0) (75.6) (78.5) (84.0) Net debt $880.5 $950.0 $884.4 $816.5 $816.0 Adjusted EBITDA for the twelve months ended $324.2 $337.2 $355.3 $376.2 $401.2 Net debt to Adjusted EBITDA 2.72x 2.82x 2.49x 2.17x 2.03x FY25 FY26