Pay vs Performance Disclosure
Apr. 30, 2026
USD ($)
Pay Versus Performance
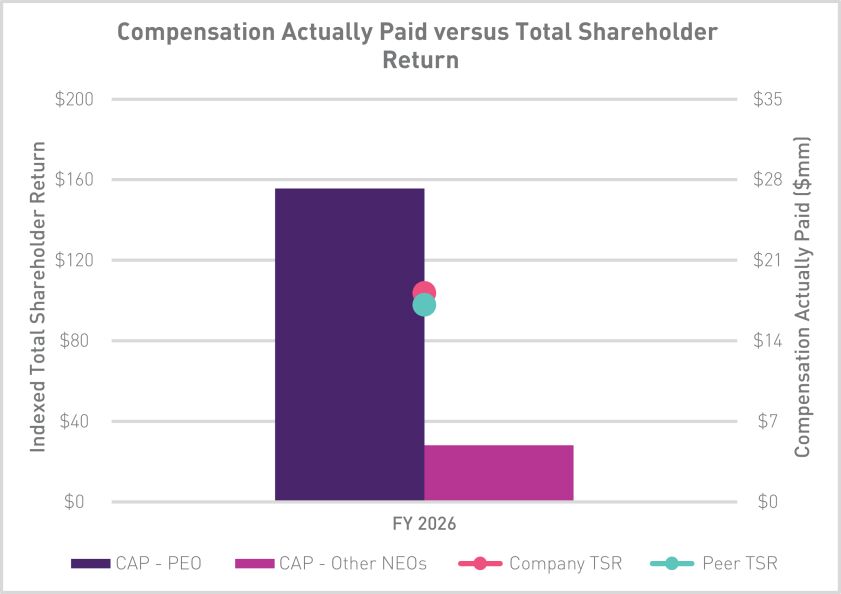
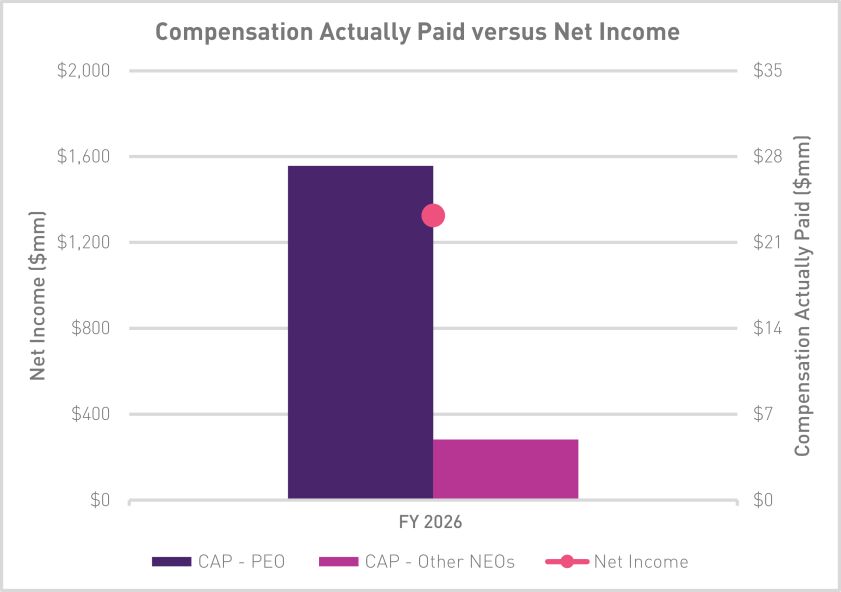
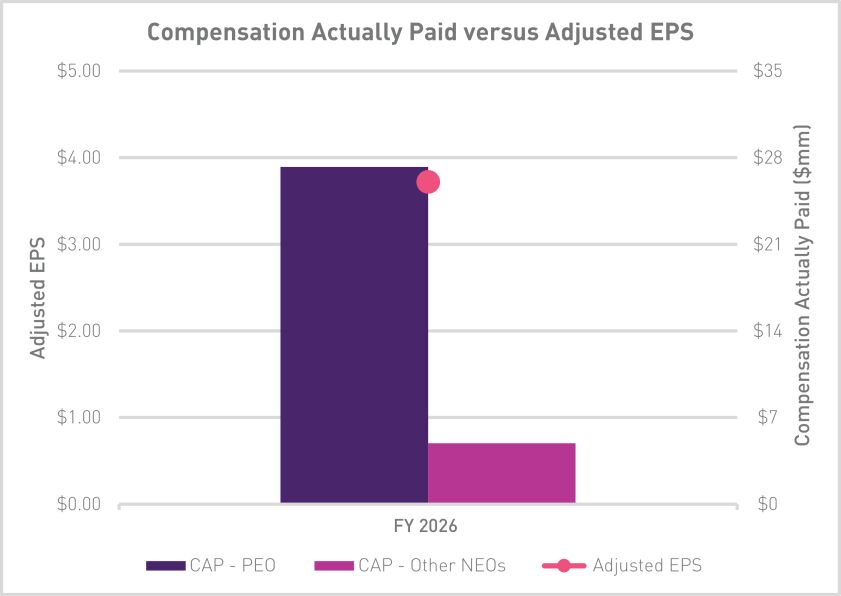
As required by Section 953(a) of the Dodd-Frank Wall Street Reform and Consumer Protection Act, and Item 402(v) of the SEC’s Regulation ”)) and our other NEOs as compared to the Company’s total shareholder return (“”), the TSR of our selected peer group, our net income, and our Company-selected performance measure, adjusted earnings per share (“”). For further information concerning our performance-based approach to executive compensation and how we align our executive compensation program with our performance, please refer to the “Compensation Discussion and Analysis” above.
S-K,
we are providing the following information about the relationship between “Compensation Actually Paid,” referred to as “CAP,” to our CEO (or principal executive officer (“PEO
TSR
EPS
Pay Versus Performance Table
Year |
Summary Compensation Table Total for PEO ($) (1) |
Compensation Actually Paid to PEO ($) (1) |
Average Summary Compensation Table Total for Non-PEO Named Executive Officers ($) (2) |
Average Compensation Actually Paid to Non-PEO Named Executive Officers ($) (2) |
Value of Initial Fixed $100 Investment Based On: |
Net Income |
Adjusted EPS ($) (5) | |||||||||||||||||||||||||||||||||
Total Shareholder Return ($) (3) |
Peer Group Total Shareholder Return ($) (3)(4) | |||||||||||||||||||||||||||||||||||||||
2026 |
$ | 14,627,631 | $ | 20,165,946 | $ | 3,168,912 | $ | 4,023,964 | $ | 104 | $ | 98 | $ | 1,325 | $ | 3.72 | ||||||||||||||||||||||||
(1) |
Reflects the fiscal 2026 executive compensation for our Chief Executive Officer, Brendan Horgan, who served as our Principal Executive Officer (“ PEO |
(2) |
Reflects the fiscal 2026 executive compensation for the NEOs other than the PEO ( i.e. |
(3) |
TSR reflects the cumulative return for the period beginning March 2, 2026, the first day on which shares of Sunbelt Common Stock were traded on the NYSE, through April 30, 2026, the last day of our fiscal year 2026. |
(4) |
The Peer Group used for TSR comparisons reflects S&P 500 Industrials (Sector) index. |
(5) |
Reflects Sunbelt’s adjusted earnings per share for fiscal 2026; for a reconciliation of adjusted EPS to the most directly comparable GAAP measure, please see Annex A. |
To calculate “Compensation Actually Paid” for our CEO and other NEOs, the following adjustments were made to the “Total” compensation as reported in the “2026 Summary Compensation Table” above.
Adjustments |
2026 |
|||||||
PEO |
Non-PEO NEO Average |
|||||||
Summary Compensation Table Total |
$ | 14,627,631 | $ | 3,168,912 | ||||
Deduction for amount reported in “Stock Awards” column of the Summary Compensation Table |
$ | 11,077,565 | $ | 1,756,074 | ||||
Addition of fair value at fiscal year (“FY”) end, of equity awards granted during the FY that remained outstanding |
$ | 10,718,562 | $ | 1,686,377 | ||||
Addition of change in fair value of awards granted during prior fiscal years* that were outstanding and unvested as of applicable fiscal year end, determined based on change in fair value from prior fiscal year end to applicable fiscal year end |
$ | 4,102,495 | $ | 575,449 | ||||
Addition of change in fair value of awards granted during prior fiscal years* that vested during applicable fiscal year, determined based on change in fair value from prior fiscal year end to vesting date |
— | $ | 43,204 | |||||
Increase based on dividends or other earnings paid during the applicable fiscal year prior to the vesting date |
$ | 122,456 | $ | 20,780 | ||||
Increase based on the incremental fair value of awards modified during the applicable fiscal year |
$ | 1,672,367 | $ | 285,316 | ||||
Compensation Actually Paid |
$ | 20,165,946 | $ | 4,023,964 | ||||
| * | “Awards granted during prior fiscal years” refers to PSUs and RSUs granted by Ashtead between fiscal years 2023 and 2025 and assumed by Sunbelt upon the effective date of the Scheme. |
(1) |
Reflects the fiscal 2026 executive compensation for our Chief Executive Officer, Brendan Horgan, who served as our Principal Executive Officer (“ PEO |
(2) |
Reflects the fiscal 2026 executive compensation for the NEOs other than the PEO ( i.e. |
To calculate “Compensation Actually Paid” for our CEO and other NEOs, the following adjustments were made to the “Total” compensation as reported in the “2026 Summary Compensation Table” above.
Adjustments |
2026 |
|||||||
PEO |
Non-PEO NEO Average |
|||||||
Summary Compensation Table Total |
$ | 14,627,631 | $ | 3,168,912 | ||||
Deduction for amount reported in “Stock Awards” column of the Summary Compensation Table |
$ | 11,077,565 | $ | 1,756,074 | ||||
Addition of fair value at fiscal year (“FY”) end, of equity awards granted during the FY that remained outstanding |
$ | 10,718,562 | $ | 1,686,377 | ||||
Addition of change in fair value of awards granted during prior fiscal years* that were outstanding and unvested as of applicable fiscal year end, determined based on change in fair value from prior fiscal year end to applicable fiscal year end |
$ | 4,102,495 | $ | 575,449 | ||||
Addition of change in fair value of awards granted during prior fiscal years* that vested during applicable fiscal year, determined based on change in fair value from prior fiscal year end to vesting date |
— | $ | 43,204 | |||||
Increase based on dividends or other earnings paid during the applicable fiscal year prior to the vesting date |
$ | 122,456 | $ | 20,780 | ||||
Increase based on the incremental fair value of awards modified during the applicable fiscal year |
$ | 1,672,367 | $ | 285,316 | ||||
Compensation Actually Paid |
$ | 20,165,946 | $ | 4,023,964 | ||||
To calculate “Compensation Actually Paid” for our CEO and other NEOs, the following adjustments were made to the “Total” compensation as reported in the “2026 Summary Compensation Table” above.
Adjustments |
2026 |
|||||||
PEO |
Non-PEO NEO Average |
|||||||
Summary Compensation Table Total |
$ | 14,627,631 | $ | 3,168,912 | ||||
Deduction for amount reported in “Stock Awards” column of the Summary Compensation Table |
$ | 11,077,565 | $ | 1,756,074 | ||||
Addition of fair value at fiscal year (“FY”) end, of equity awards granted during the FY that remained outstanding |
$ | 10,718,562 | $ | 1,686,377 | ||||
Addition of change in fair value of awards granted during prior fiscal years* that were outstanding and unvested as of applicable fiscal year end, determined based on change in fair value from prior fiscal year end to applicable fiscal year end |
$ | 4,102,495 | $ | 575,449 | ||||
Addition of change in fair value of awards granted during prior fiscal years* that vested during applicable fiscal year, determined based on change in fair value from prior fiscal year end to vesting date |
— | $ | 43,204 | |||||
Increase based on dividends or other earnings paid during the applicable fiscal year prior to the vesting date |
$ | 122,456 | $ | 20,780 | ||||
Increase based on the incremental fair value of awards modified during the applicable fiscal year |
$ | 1,672,367 | $ | 285,316 | ||||
Compensation Actually Paid |
$ | 20,165,946 | $ | 4,023,964 | ||||
Tabular List of Company Performance Measures
The following table alphabetically lists the measures we believe are most important in linking compensation actually paid to Company performance during fiscal 2026:
| (1) | Compound Adjusted Earnings Per Share; |
| (2) | Adjusted Return on Investment; and |
| (3) | Relative Total Shareholder Return. |