CoastalSouth Bancshares, Inc. Third Quarter 2025 Investor Presentation October 20, 2025 July 20, 2026 Second Quarter 2026 Investor Presentation Exhibit 99.2
Disclosures Forward Looking Statements Statements in this Investor Presentation regarding future events and our expectations and beliefs about our future financial performance and financial condition, as well as trends in our business and markets, constitute “forward-looking statements” within the meaning of, and subject to the protections of, Section 27A of the Securities Act of 1933, as amended, and Section 21E of the Securities Exchange Act of 1934, as amended. Forward-looking statements are not historical in nature and may be identified by references to a future period or periods by the use of the words “believe,” “expect,” “anticipate,” “intend,” “plan,” “estimate,” “project,” “outlook,” or words of similar meaning, or future or conditional verbs such as “will,” “would,” “should,” “could,” or “may.” The forward-looking statements in this Investor Presentation should not be relied on because they are based on current information and on assumptions that we make about future events and circumstances that are subject to a number of known and unknown risks and uncertainties that are often difficult to predict and beyond our control. As a result of those risks and uncertainties, and other factors, our actual financial results in the future could differ, possibly materially, from those expressed in or implied by the forward-looking statements contained in this Investor Presentation and could cause us to make changes to our future plans. Factors that might cause such differences include, but are not limited to: the impact of current and future economic conditions, particularly those affecting the financial services industry, including the effects of declines in the real estate market, high unemployment rates, inflationary pressures, elevated interest rates and slowdowns in economic growth, as well as the financial stress on borrowers as a result of the foregoing; potential impacts of any adverse developments in the banking industry, including any impacts on customer confidence, deposit outflows, liquidity and the regulatory response thereto; changes in the interest rate environment, including changes to the federal funds rate; changes in prices, values and sales volumes of residential and commercial real estate; competition in our markets that may result in increased funding costs or reduced earning assets yields, thus reducing margins and net interest income; interest rate fluctuations, which could have an adverse effect on the Company’s profitability; a breach in security of our information systems, including the occurrence of cyber-attack incidents or deficiencies in cyber security; risks related to potential acquisitions; government actions or inactions, including a prolonged shutdown of the federal government, tariffs, or trade wars (including reduced consumer spending, lower economic growth or recession, reduced demand for U.S. exports, disruptions to supply chains, and decreased demand for other banking products and services), legislation or regulatory changes which could adversely affect the ability of the consolidated Company to conduct business combinations or new operations; changes in tax laws; significant turbulence or a disruption in the capital or financial markets and the effect of a fall in stock market prices on our investment securities; the effects of war or other conflicts, domestic civil unrest and tyranny, and changes in the overall geopolitical landscape; and adverse results from current or future litigation, regulatory examinations or other legal and/or regulatory actions, including as a result of the Company’s participation in and execution of government programs. Therefore, the Company can give no assurance that the results contemplated in the forward-looking statements will be realized. Additional information regarding these and other risks and uncertainties to which our business and future financial performance are subject is contained in the sections titled “Cautionary Note Regarding Forward-Looking Statements” and “Risk Factors” in the Company’s 2025 Annual Report on Form 10-K under the Securities Act of 1933, as amended, filed with the Securities and Exchange Commission (the “SEC”) on March 12, 2026 and in other documents that we file with the SEC from time to time, which are available on the SEC’s website, http://www.sec.gov. In addition, our actual financial results in the future may differ from those currently expected due to additional risks and uncertainties of which we are not currently aware or which we do not currently view as, but in the future may become, material to our business or operating results. Due to these and other possible uncertainties and risks, readers are cautioned not to place undue reliance on the forward-looking statements contained in this Investor Presentation or to make predictions based solely on historical financial performance. Any forward-looking statement speaks only as of the date on which it is made, and we do not undertake any obligation to update or review any forward-looking statement, whether as a result of new information, future developments or otherwise, except as required by law. All forward-looking statements, express or implied, included in this Investor Presentation are qualified in their entirety by this cautionary statement.
Disclosures Non-GAAP Financial Measures In addition to results presented in accordance with U.S. generally accepted accounting principles (“GAAP”), this Investor Presentation contains certain non-GAAP financial measures. The Company believes that providing certain non-GAAP financial measures provides investors with information useful in understanding our financial performance, performance trends and financial position. Our management uses these measures for internal planning and forecasting purposes and we believe that our presentation and discussion, together with the accompanying reconciliations, allows investors, security analysts and other interested parties to view our performance and the factors and trends affecting our business in a manner similar to management. These non-GAAP measures should not be considered a substitute for GAAP measures and we strongly encourage investors to review our consolidated financial statements in their entirety and not to rely on any single financial measure to evaluate the Company. Non-GAAP financial measures have inherent limitations, are not uniformly applied and are not audited. Because non-GAAP financial measures are not standardized, it may not be possible to compare these financial measures with other companies’ non-GAAP financial measures having the same or similar names. The measures entitled return on average tangible common shareholders' equity, tangible book value per common share, tangible common equity, tangible assets, adjusted nonperforming assets to total assets, adjusted nonperforming assets, pre-tax pre-provision net revenue ("PPNR"), tangible common equity to tangible assets, core deposits and average core deposits are not measures recognized under accounting principles generally accepted in the United States of America (“GAAP”) and therefore are considered non-GAAP financial measures. The most comparable GAAP measures to these measures are return on average shareholders’ equity, book value per share, total shareholders’ equity, total assets, total nonperforming assets to total assets, total nonperforming assets, net income, total common equity to total assets, and total deposits, respectively. The delivery of this Investor Presentation will not, under any circumstances, create an implication that there has been no change in the affairs of the Company since the date of this Investor Presentation. The Company is not making any implied or express representation or warranty as to the accuracy or completeness of the information summarized herein or made available in connection with any further investigation of the Company. The Company expressly disclaims any and all liability which may be based on such information, errors therein or omission therefrom.
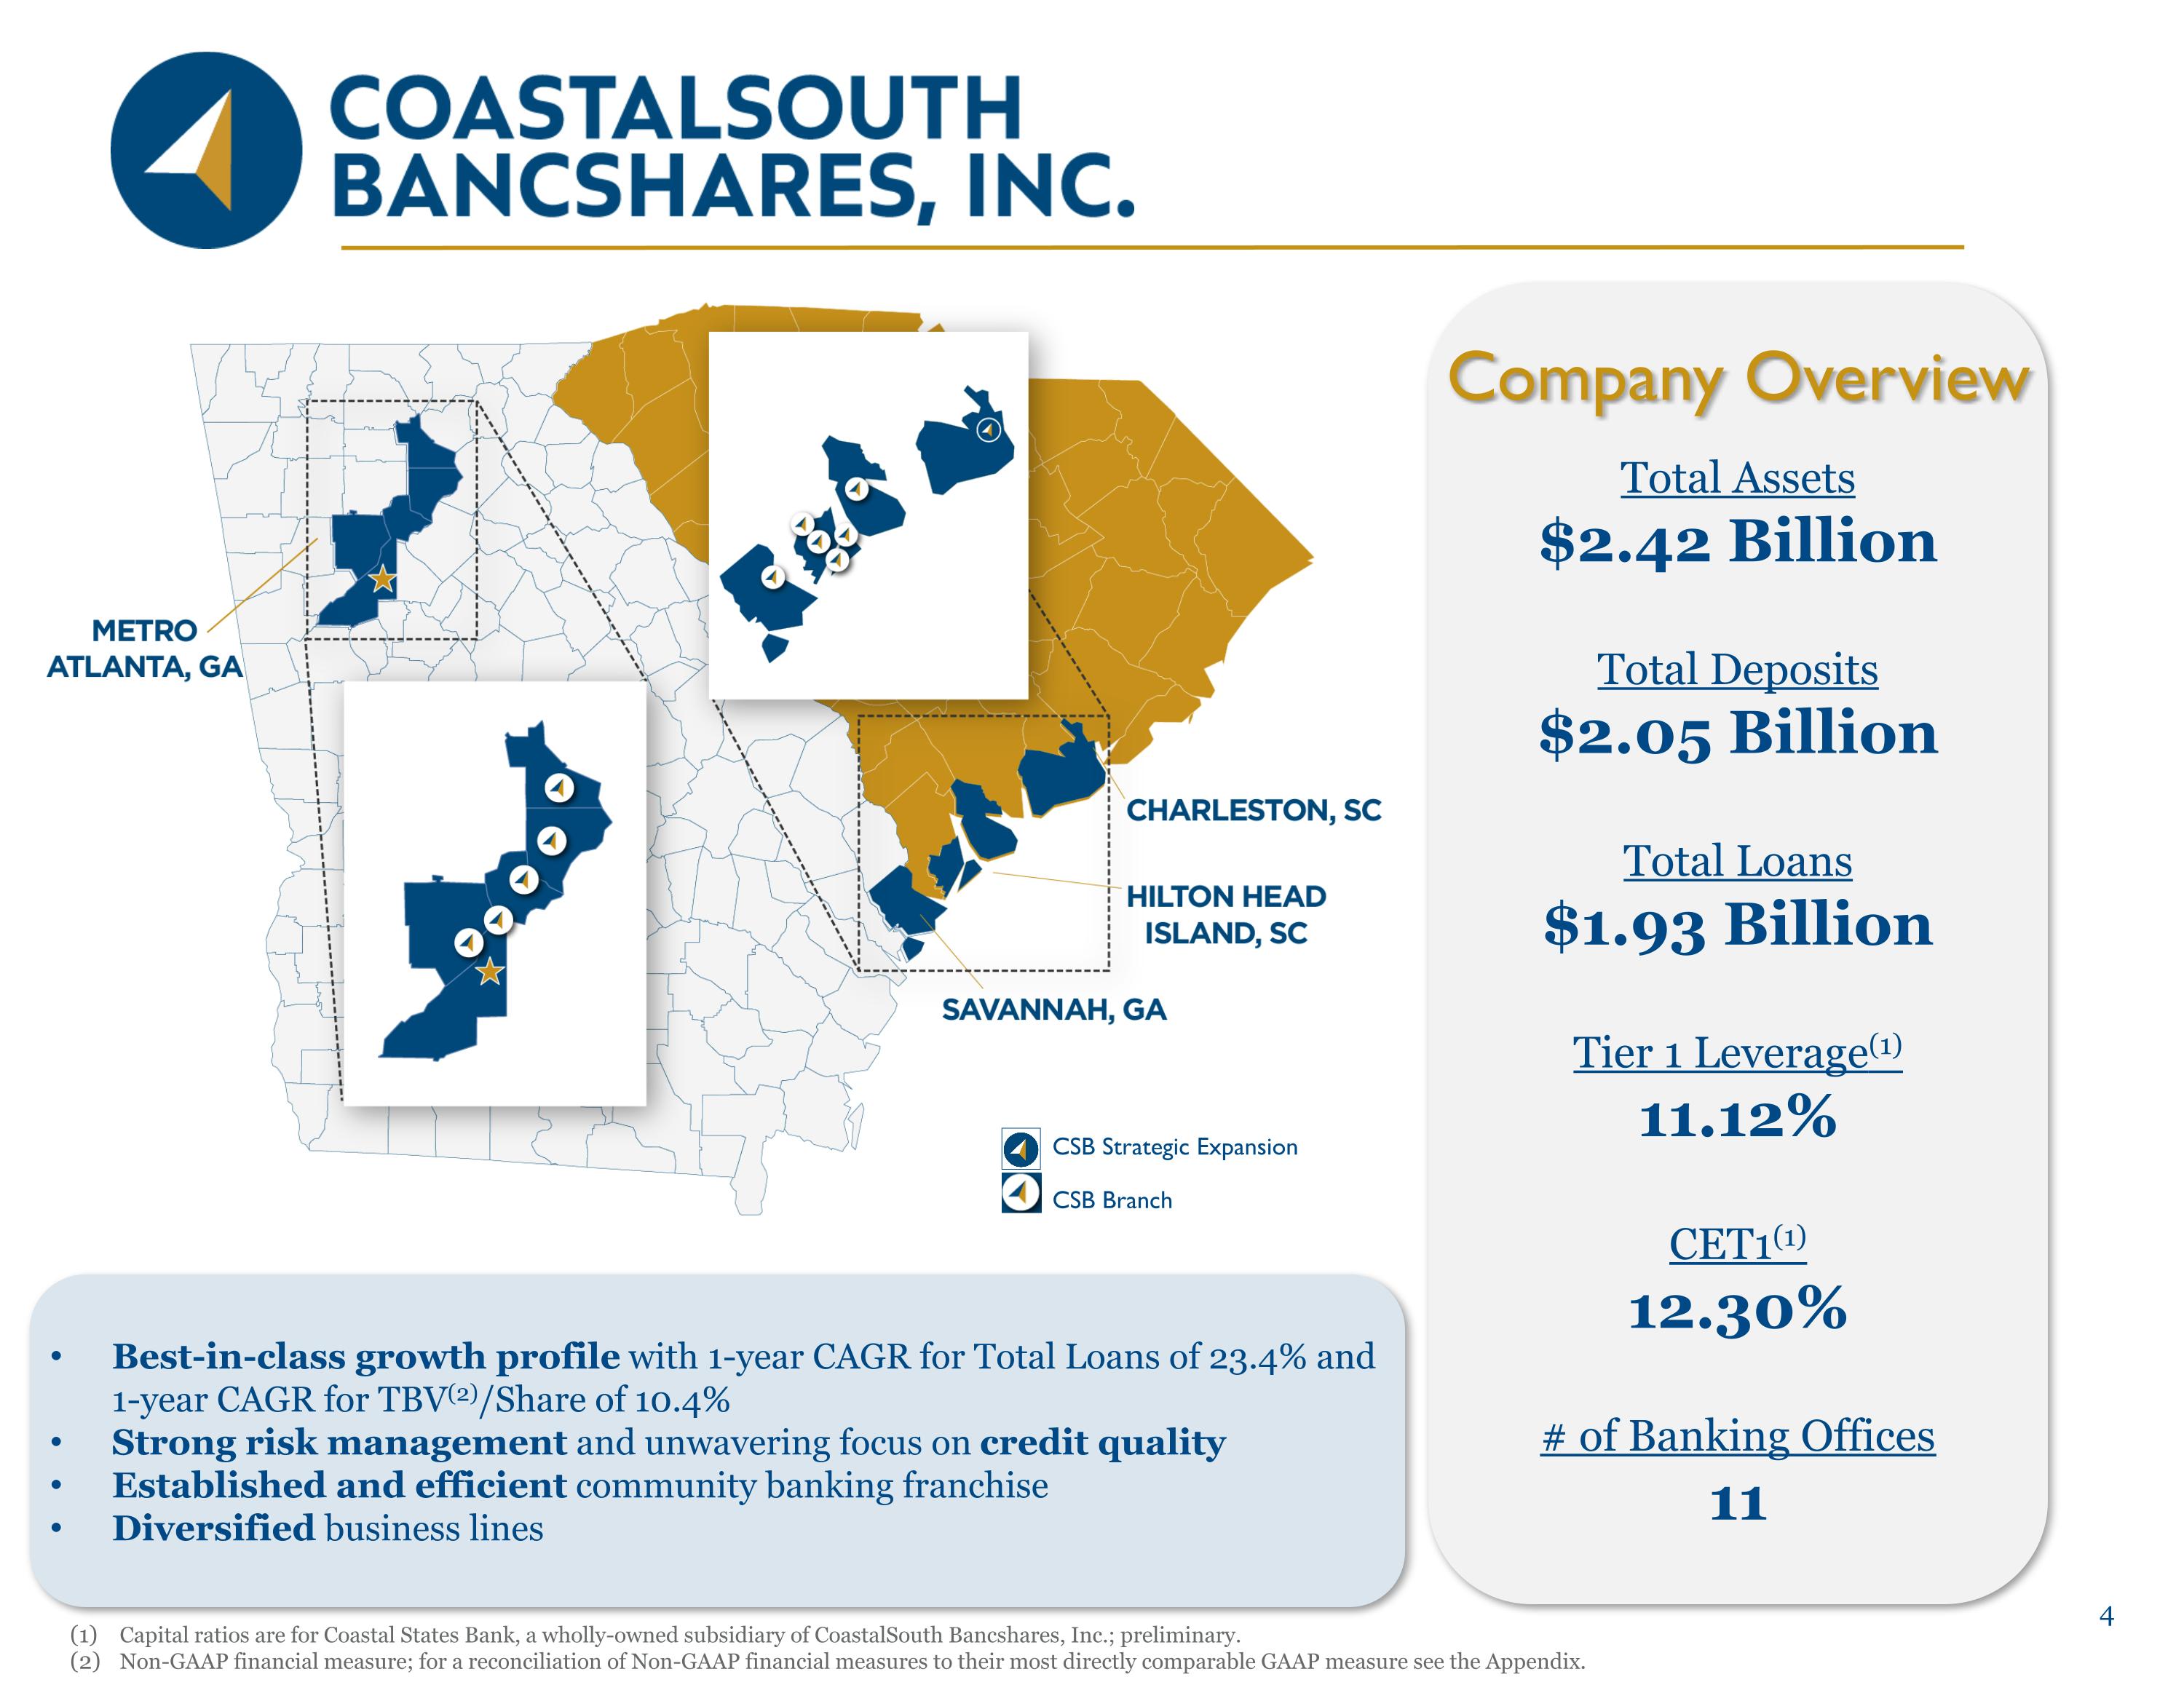
Company Overview Total Assets $2.42 Billion Total Deposits $2.05 Billion Total Loans $1.93 Billion Tier 1 Leverage(1) 11.12% CET1(1) 12.30% # of Banking Offices 11 Best-in-class growth profile with 1-year CAGR for Total Loans of 23.4% and 1-year CAGR for TBV(2)/Share of 10.4% Strong risk management and unwavering focus on credit quality Established and efficient community banking franchise Diversified business lines Capital ratios are for Coastal States Bank, a wholly-owned subsidiary of CoastalSouth Bancshares, Inc.; preliminary. Non-GAAP financial measure; for a reconciliation of Non-GAAP financial measures to their most directly comparable GAAP measure see the Appendix. CSB Strategic Expansion CSB Branch
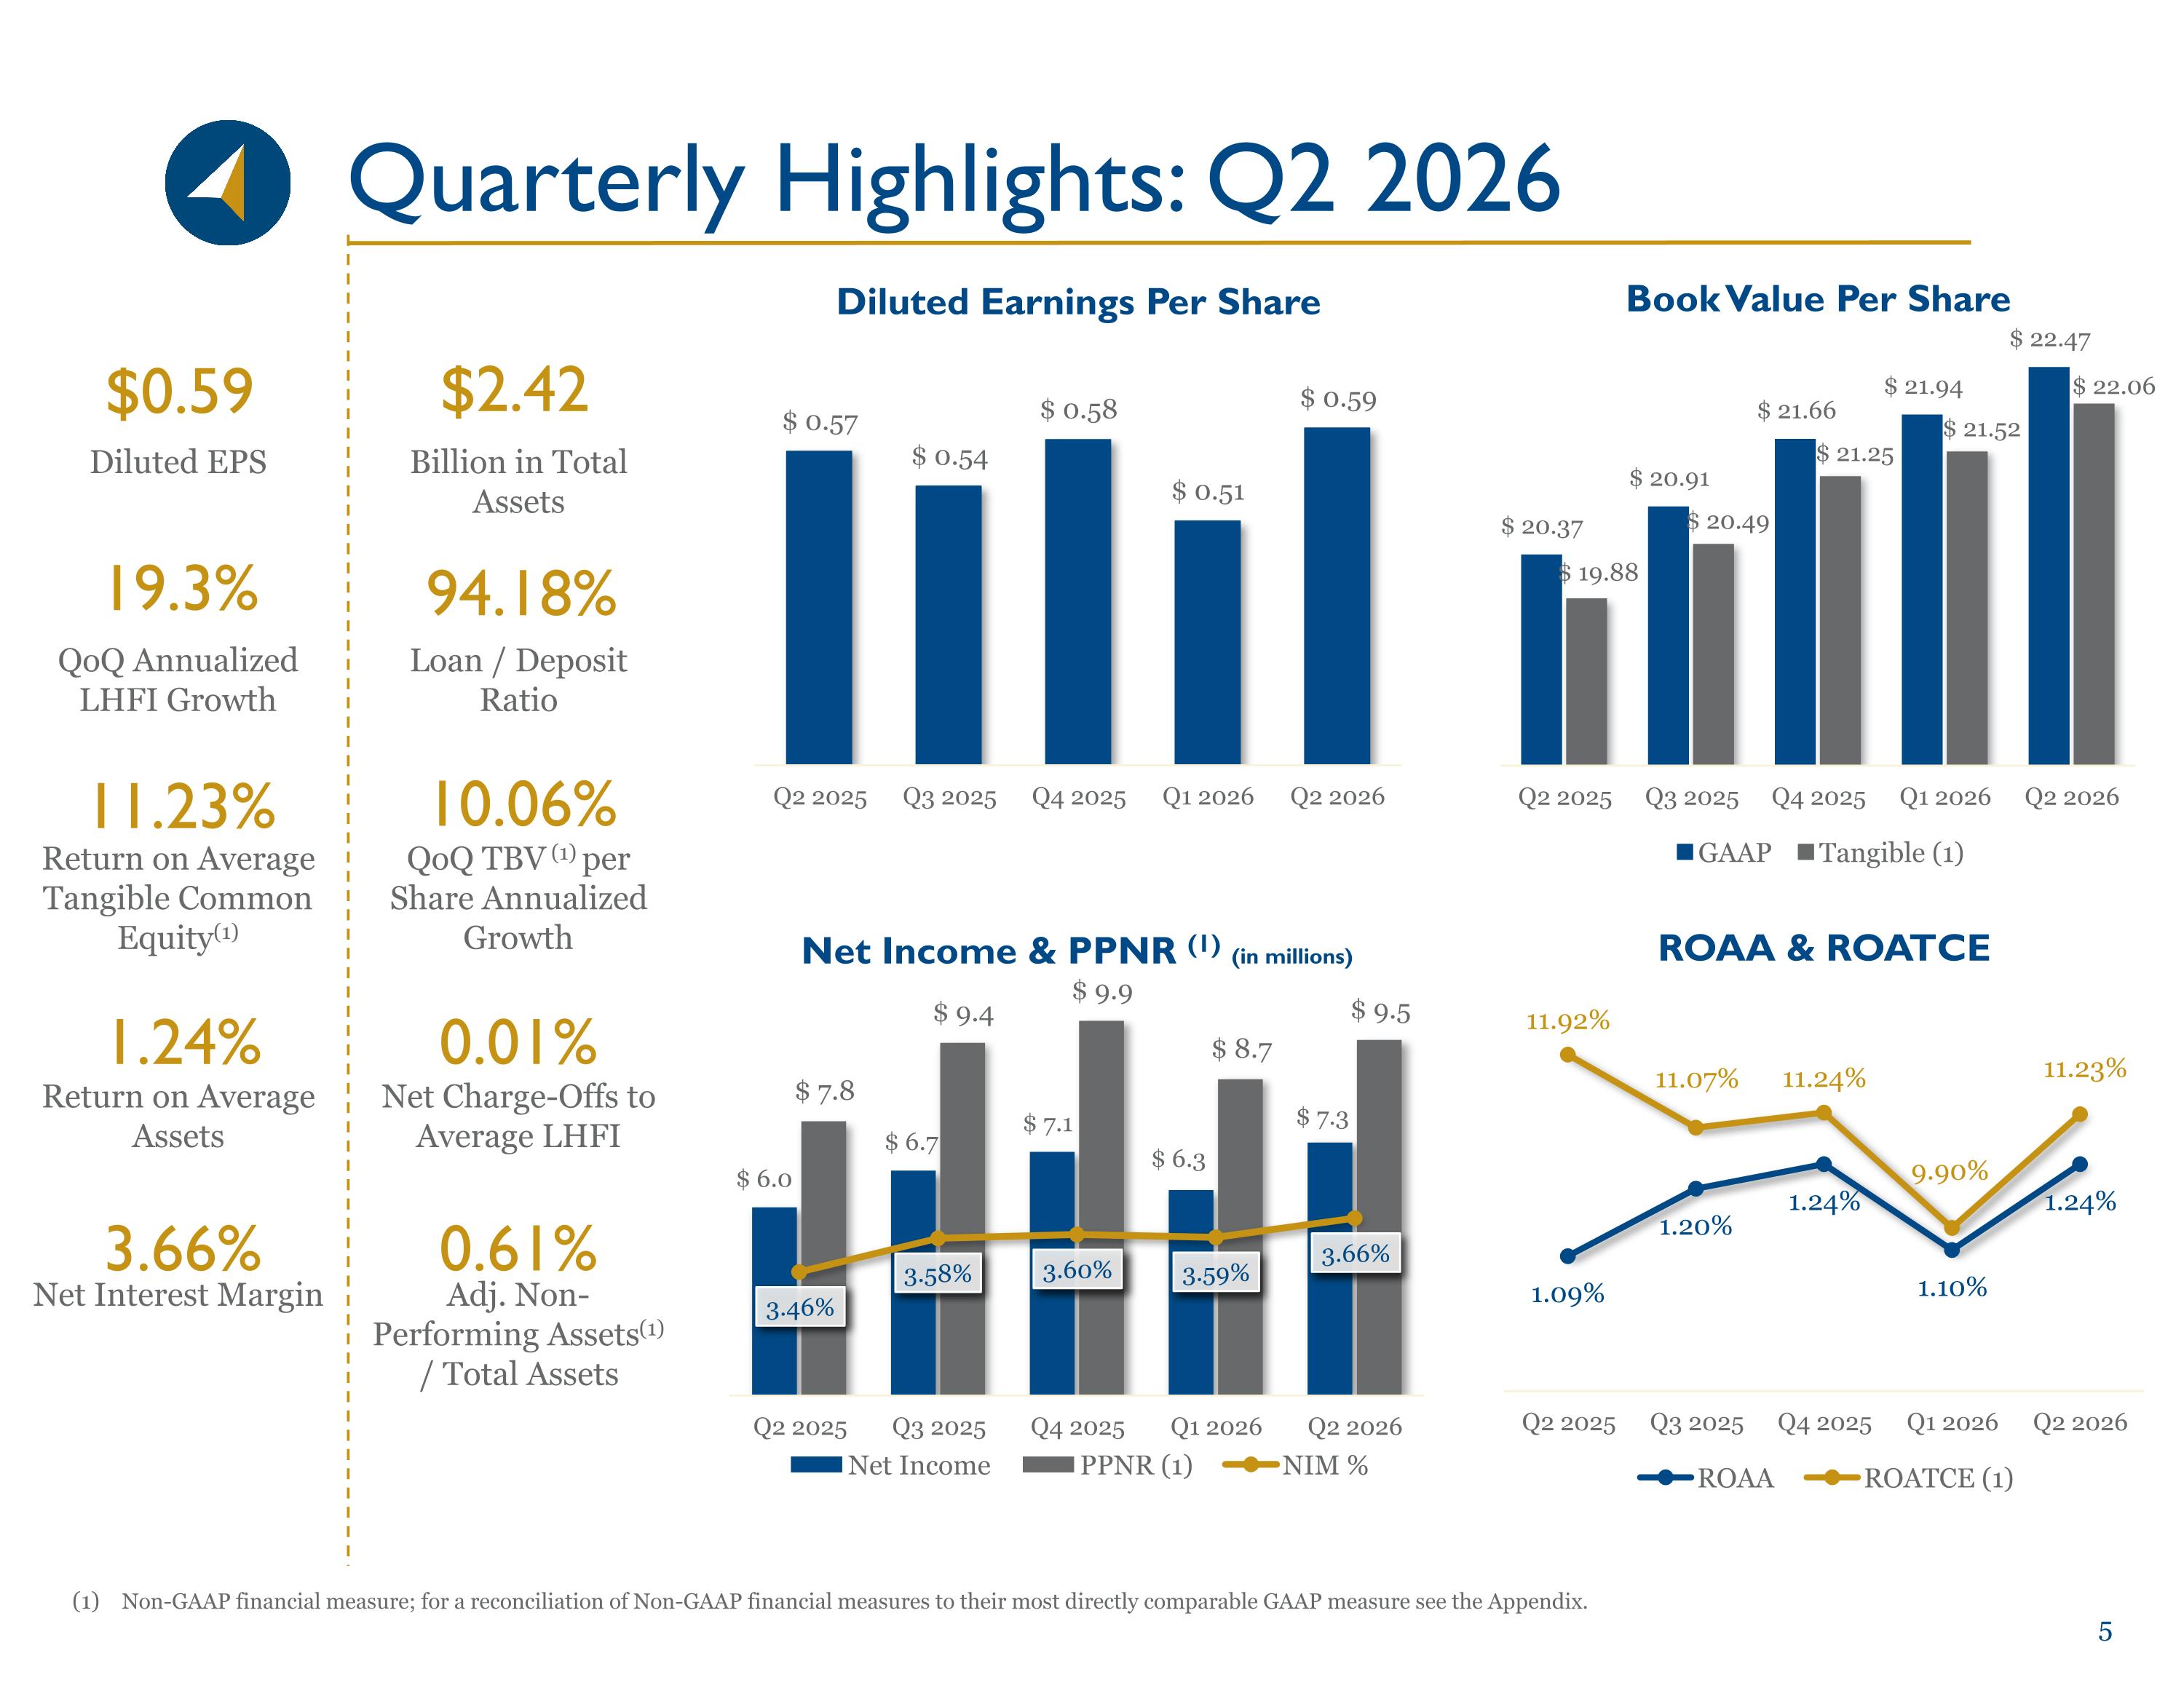
Diluted EPS QoQ Annualized LHFI Growth Return on Average Tangible Common Equity(1) Return on Average Assets Net Interest Margin Quarterly Highlights: Q2 2026 Non-GAAP financial measure; for a reconciliation of Non-GAAP financial measures to their most directly comparable GAAP measure see the Appendix. Billion in Total Assets Loan / Deposit Ratio QoQ TBV (1) per Share Annualized Growth Net Charge-Offs to Average LHFI Adj. Non-Performing Assets(1) / Total Assets $0.59 3.66% 10.06% $2.42 19.3% 94.18% 0.61% 11.23% 0.01% 1.24%
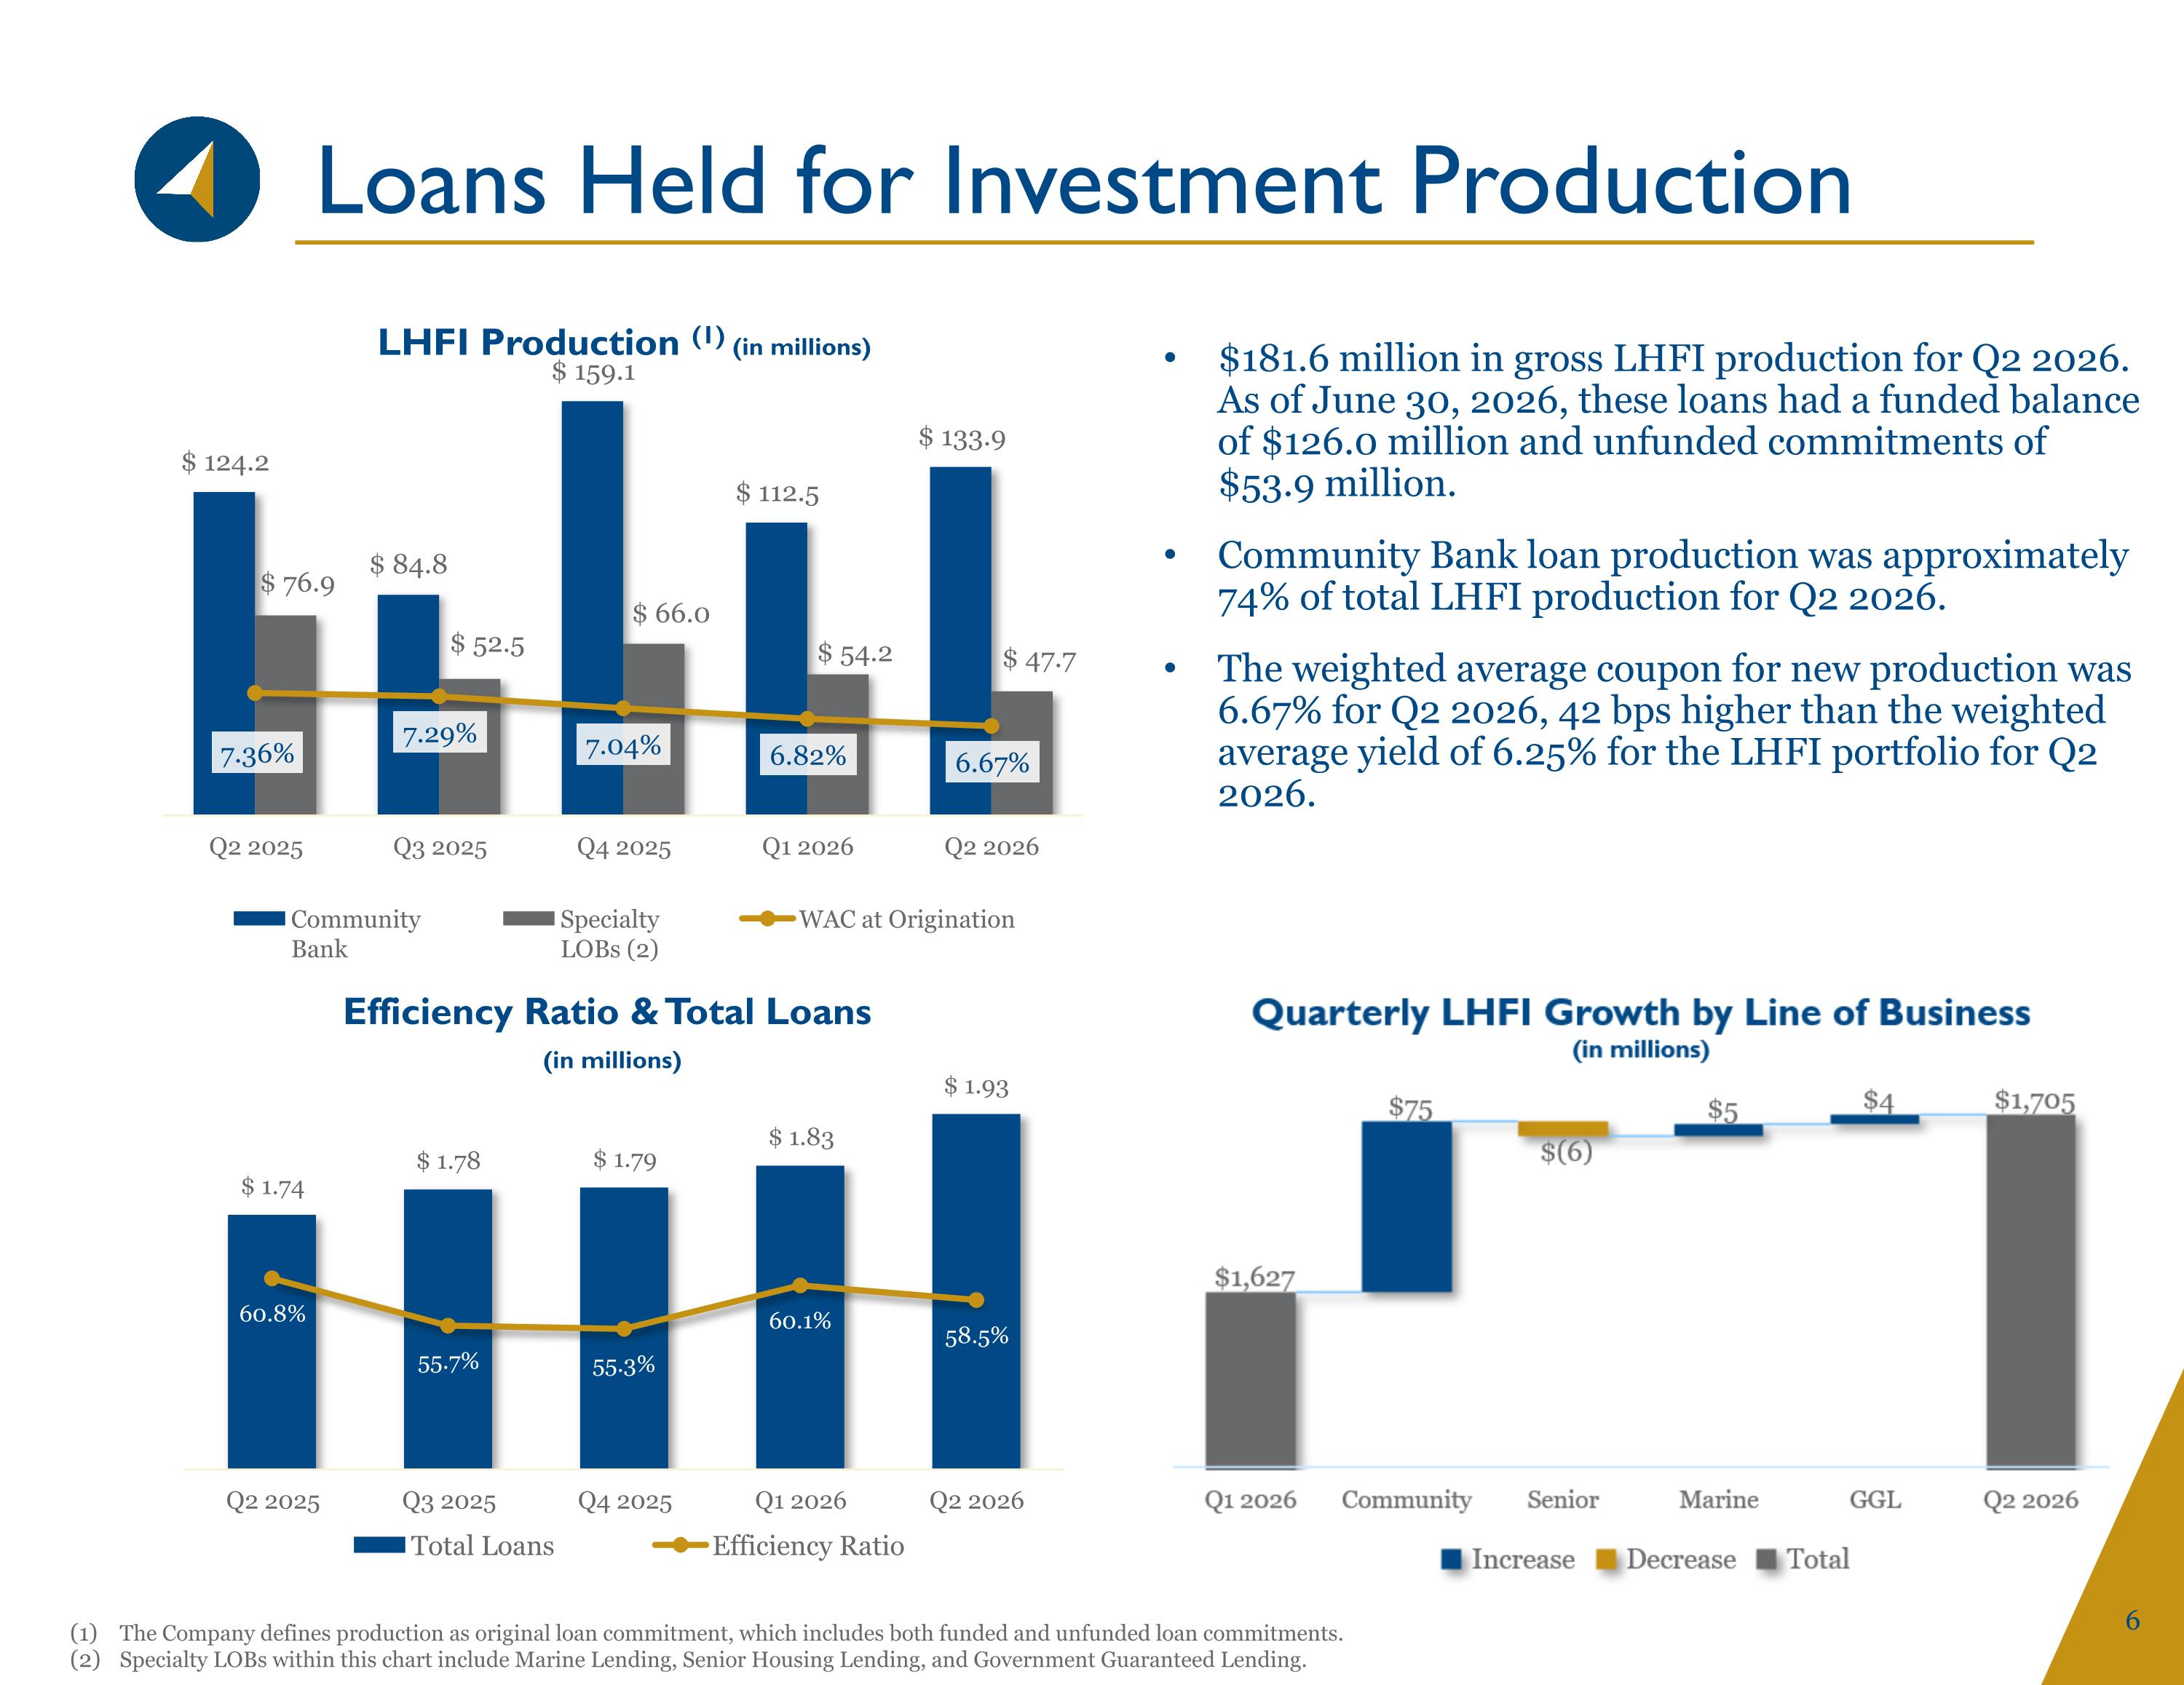
Loans Held for Investment Production $181.6 million in gross LHFI production for Q2 2026. As of June 30, 2026, these loans had a funded balance of $126.0 million and unfunded commitments of $53.9 million. Community Bank loan production was approximately 74% of total LHFI production for Q2 2026. The weighted average coupon for new production was 6.67% for Q2 2026, 42 bps higher than the weighted average yield of 6.25% for the LHFI portfolio for Q2 2026. The Company defines production as original loan commitment, which includes both funded and unfunded loan commitments. Specialty LOBs within this chart include Marine Lending, Senior Housing Lending, and Government Guaranteed Lending.
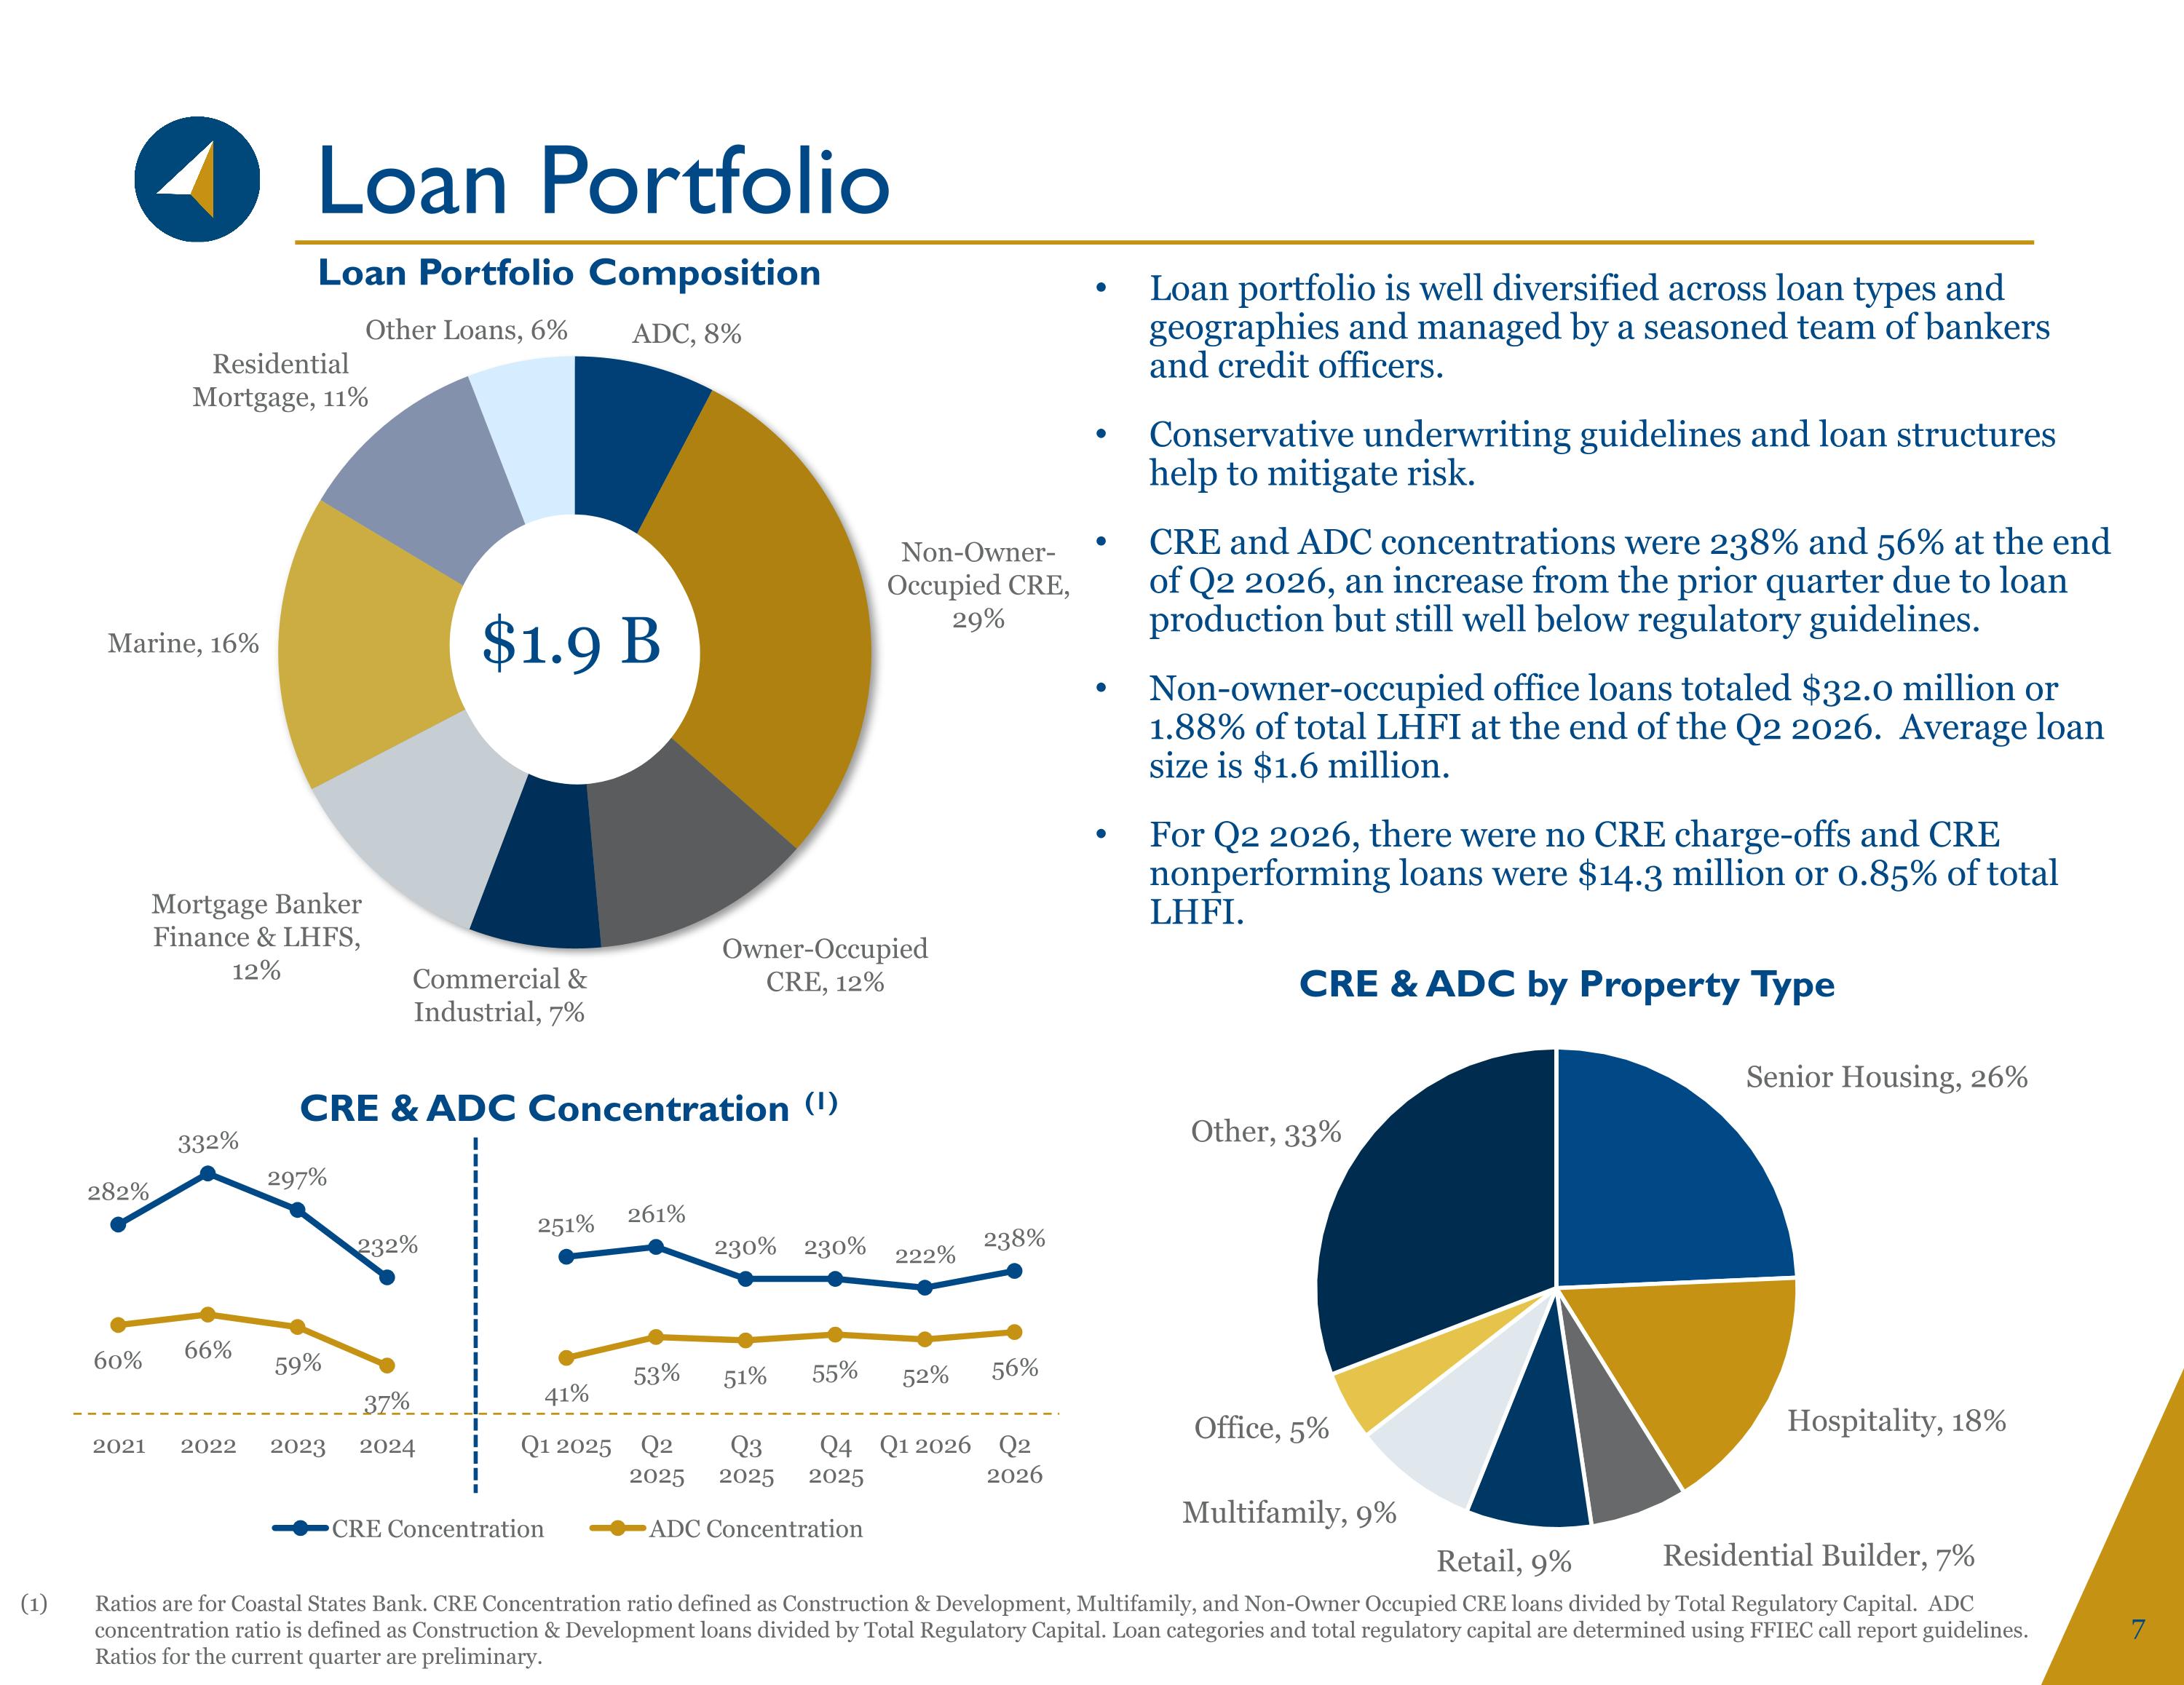
Loan Portfolio Loan portfolio is well diversified across loan types and geographies and managed by a seasoned team of bankers and credit officers. Conservative underwriting guidelines and loan structures help to mitigate risk. CRE and ADC concentrations were 238% and 56% at the end of Q2 2026, an increase from the prior quarter due to loan production but still well below regulatory guidelines. Non-owner-occupied office loans totaled $32.0 million or 1.88% of total LHFI at the end of the Q2 2026. Average loan size is $1.6 million. For Q2 2026, there were no CRE charge-offs and CRE nonperforming loans were $14.3 million or 0.85% of total LHFI. Ratios are for Coastal States Bank. CRE Concentration ratio defined as Construction & Development, Multifamily, and Non-Owner Occupied CRE loans divided by Total Regulatory Capital. ADC concentration ratio is defined as Construction & Development loans divided by Total Regulatory Capital. Loan categories and total regulatory capital are determined using FFIEC call report guidelines. Ratios for the current quarter are preliminary. $1.9 B
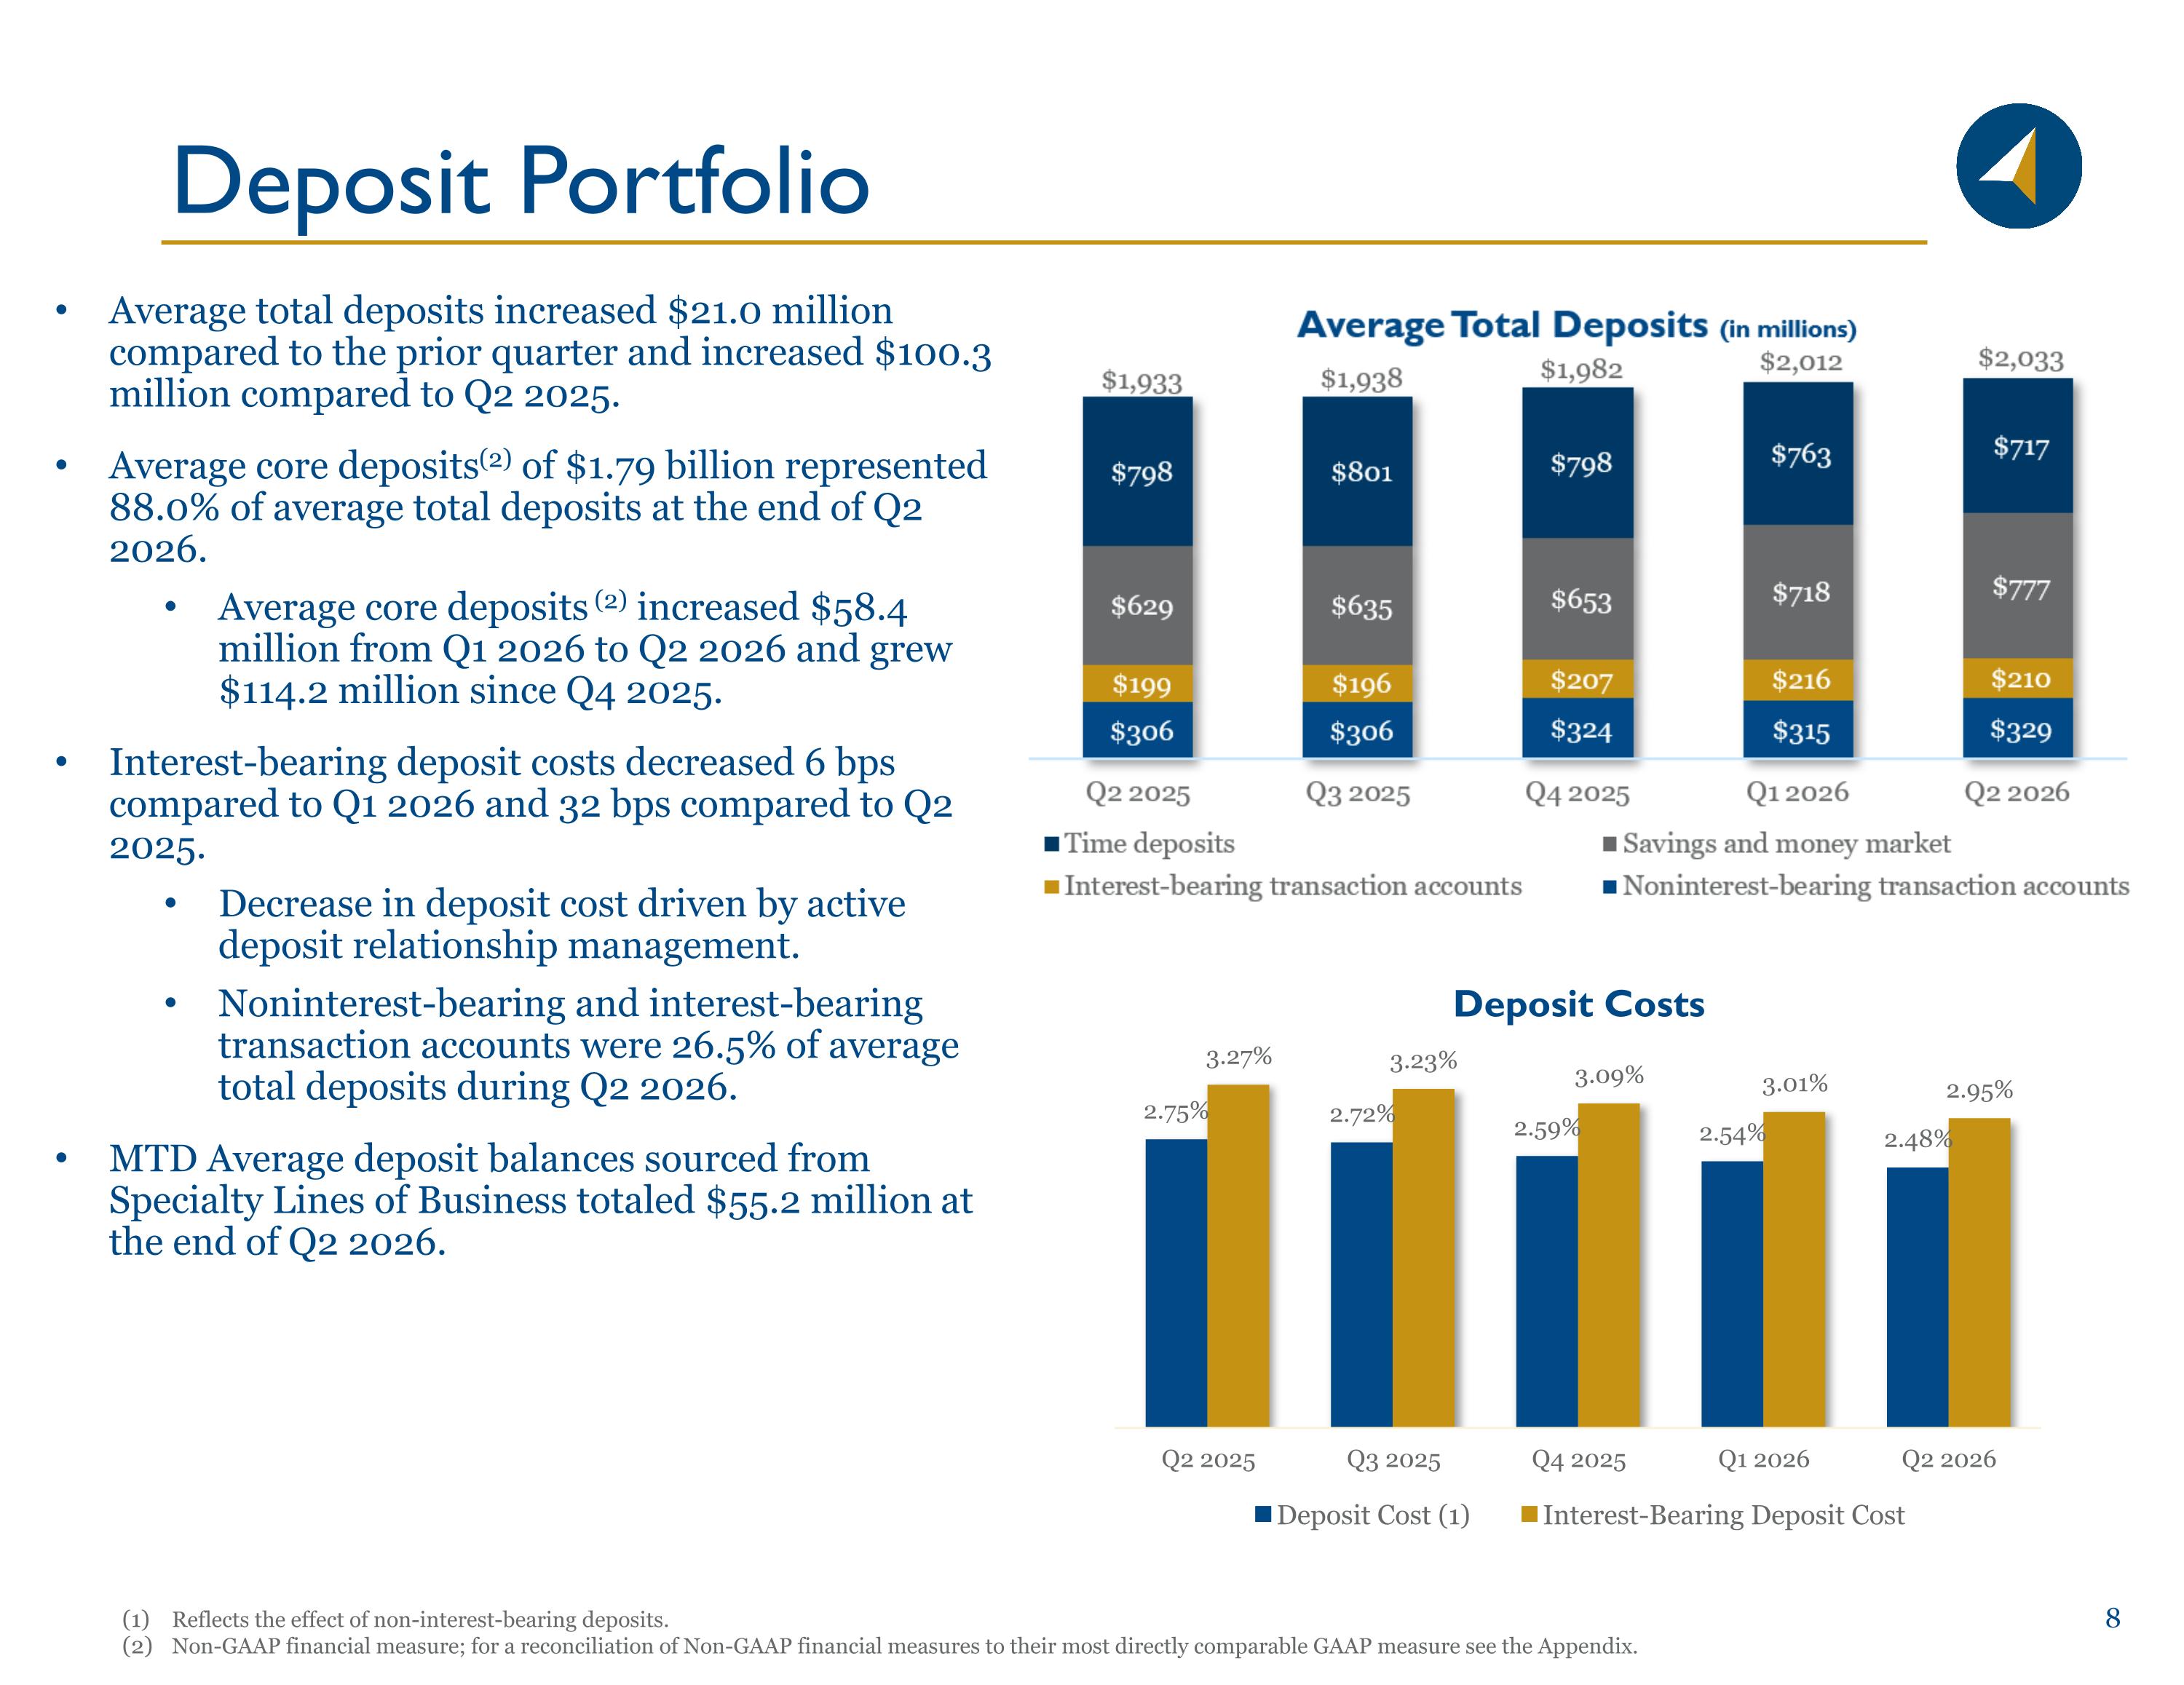
Deposit Portfolio Reflects the effect of non-interest-bearing deposits. Non-GAAP financial measure; for a reconciliation of Non-GAAP financial measures to their most directly comparable GAAP measure see the Appendix. Average total deposits increased $21.0 million compared to the prior quarter and increased $100.3 million compared to Q2 2025. Average core deposits(2) of $1.79 billion represented 88.0% of average total deposits at the end of Q2 2026. Average core deposits (2) increased $58.4 million from Q1 2026 to Q2 2026 and grew $114.2 million since Q4 2025. Interest-bearing deposit costs decreased 6 bps compared to Q1 2026 and 32 bps compared to Q2 2025. Decrease in deposit cost driven by active deposit relationship management. Noninterest-bearing and interest-bearing transaction accounts were 26.5% of average total deposits during Q2 2026. MTD Average deposit balances sourced from Specialty Lines of Business totaled $55.2 million at the end of Q2 2026.
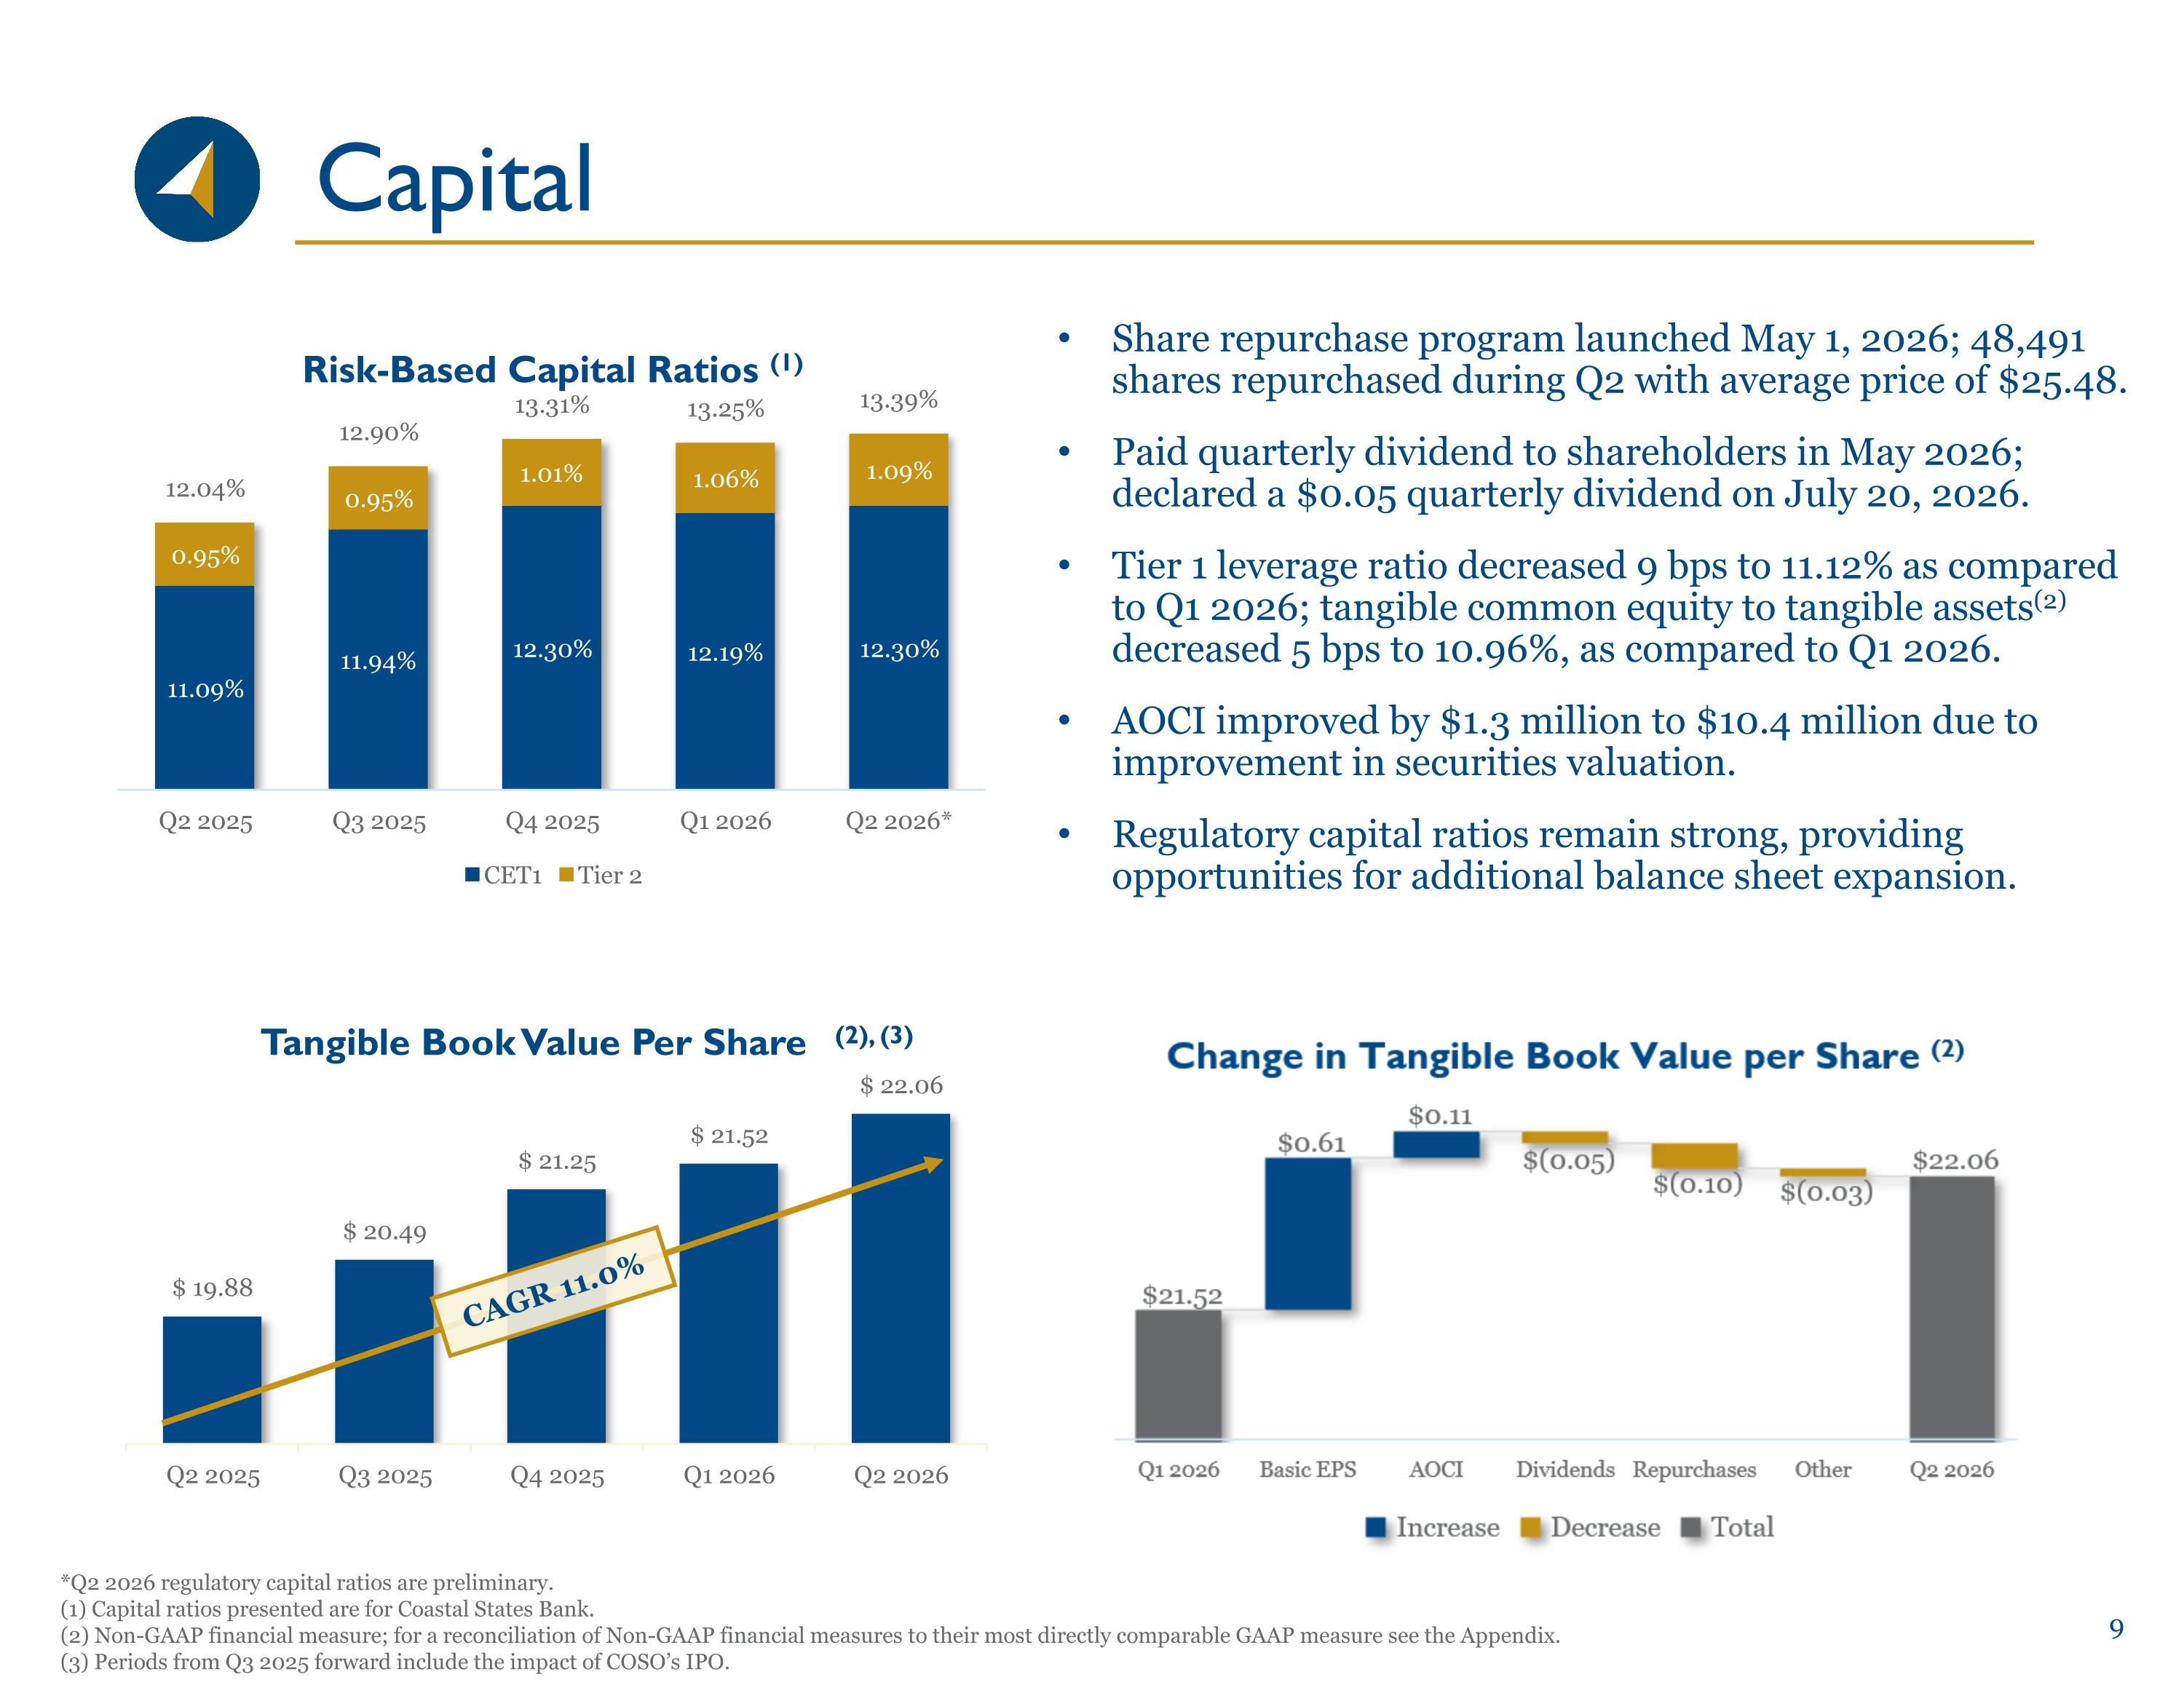
Capital *Q2 2026 regulatory capital ratios are preliminary. (1) Capital ratios presented are for Coastal States Bank. (2) Non-GAAP financial measure; for a reconciliation of Non-GAAP financial measures to their most directly comparable GAAP measure see the Appendix. (3) Periods from Q3 2025 forward include the impact of COSO’s IPO. Share repurchase program launched May 1, 2026; 48,491 shares repurchased during Q2 with average price of $25.48. Paid quarterly dividend to shareholders in May 2026; declared a $0.05 quarterly dividend on July 20, 2026. Tier 1 leverage ratio decreased 9 bps to 11.12% as compared to Q1 2026; tangible common equity to tangible assets(2) decreased 5 bps to 10.96%, as compared to Q1 2026. AOCI improved by $1.3 million to $10.4 million due to improvement in securities valuation. Regulatory capital ratios remain strong, providing opportunities for additional balance sheet expansion. CAGR 11.0%
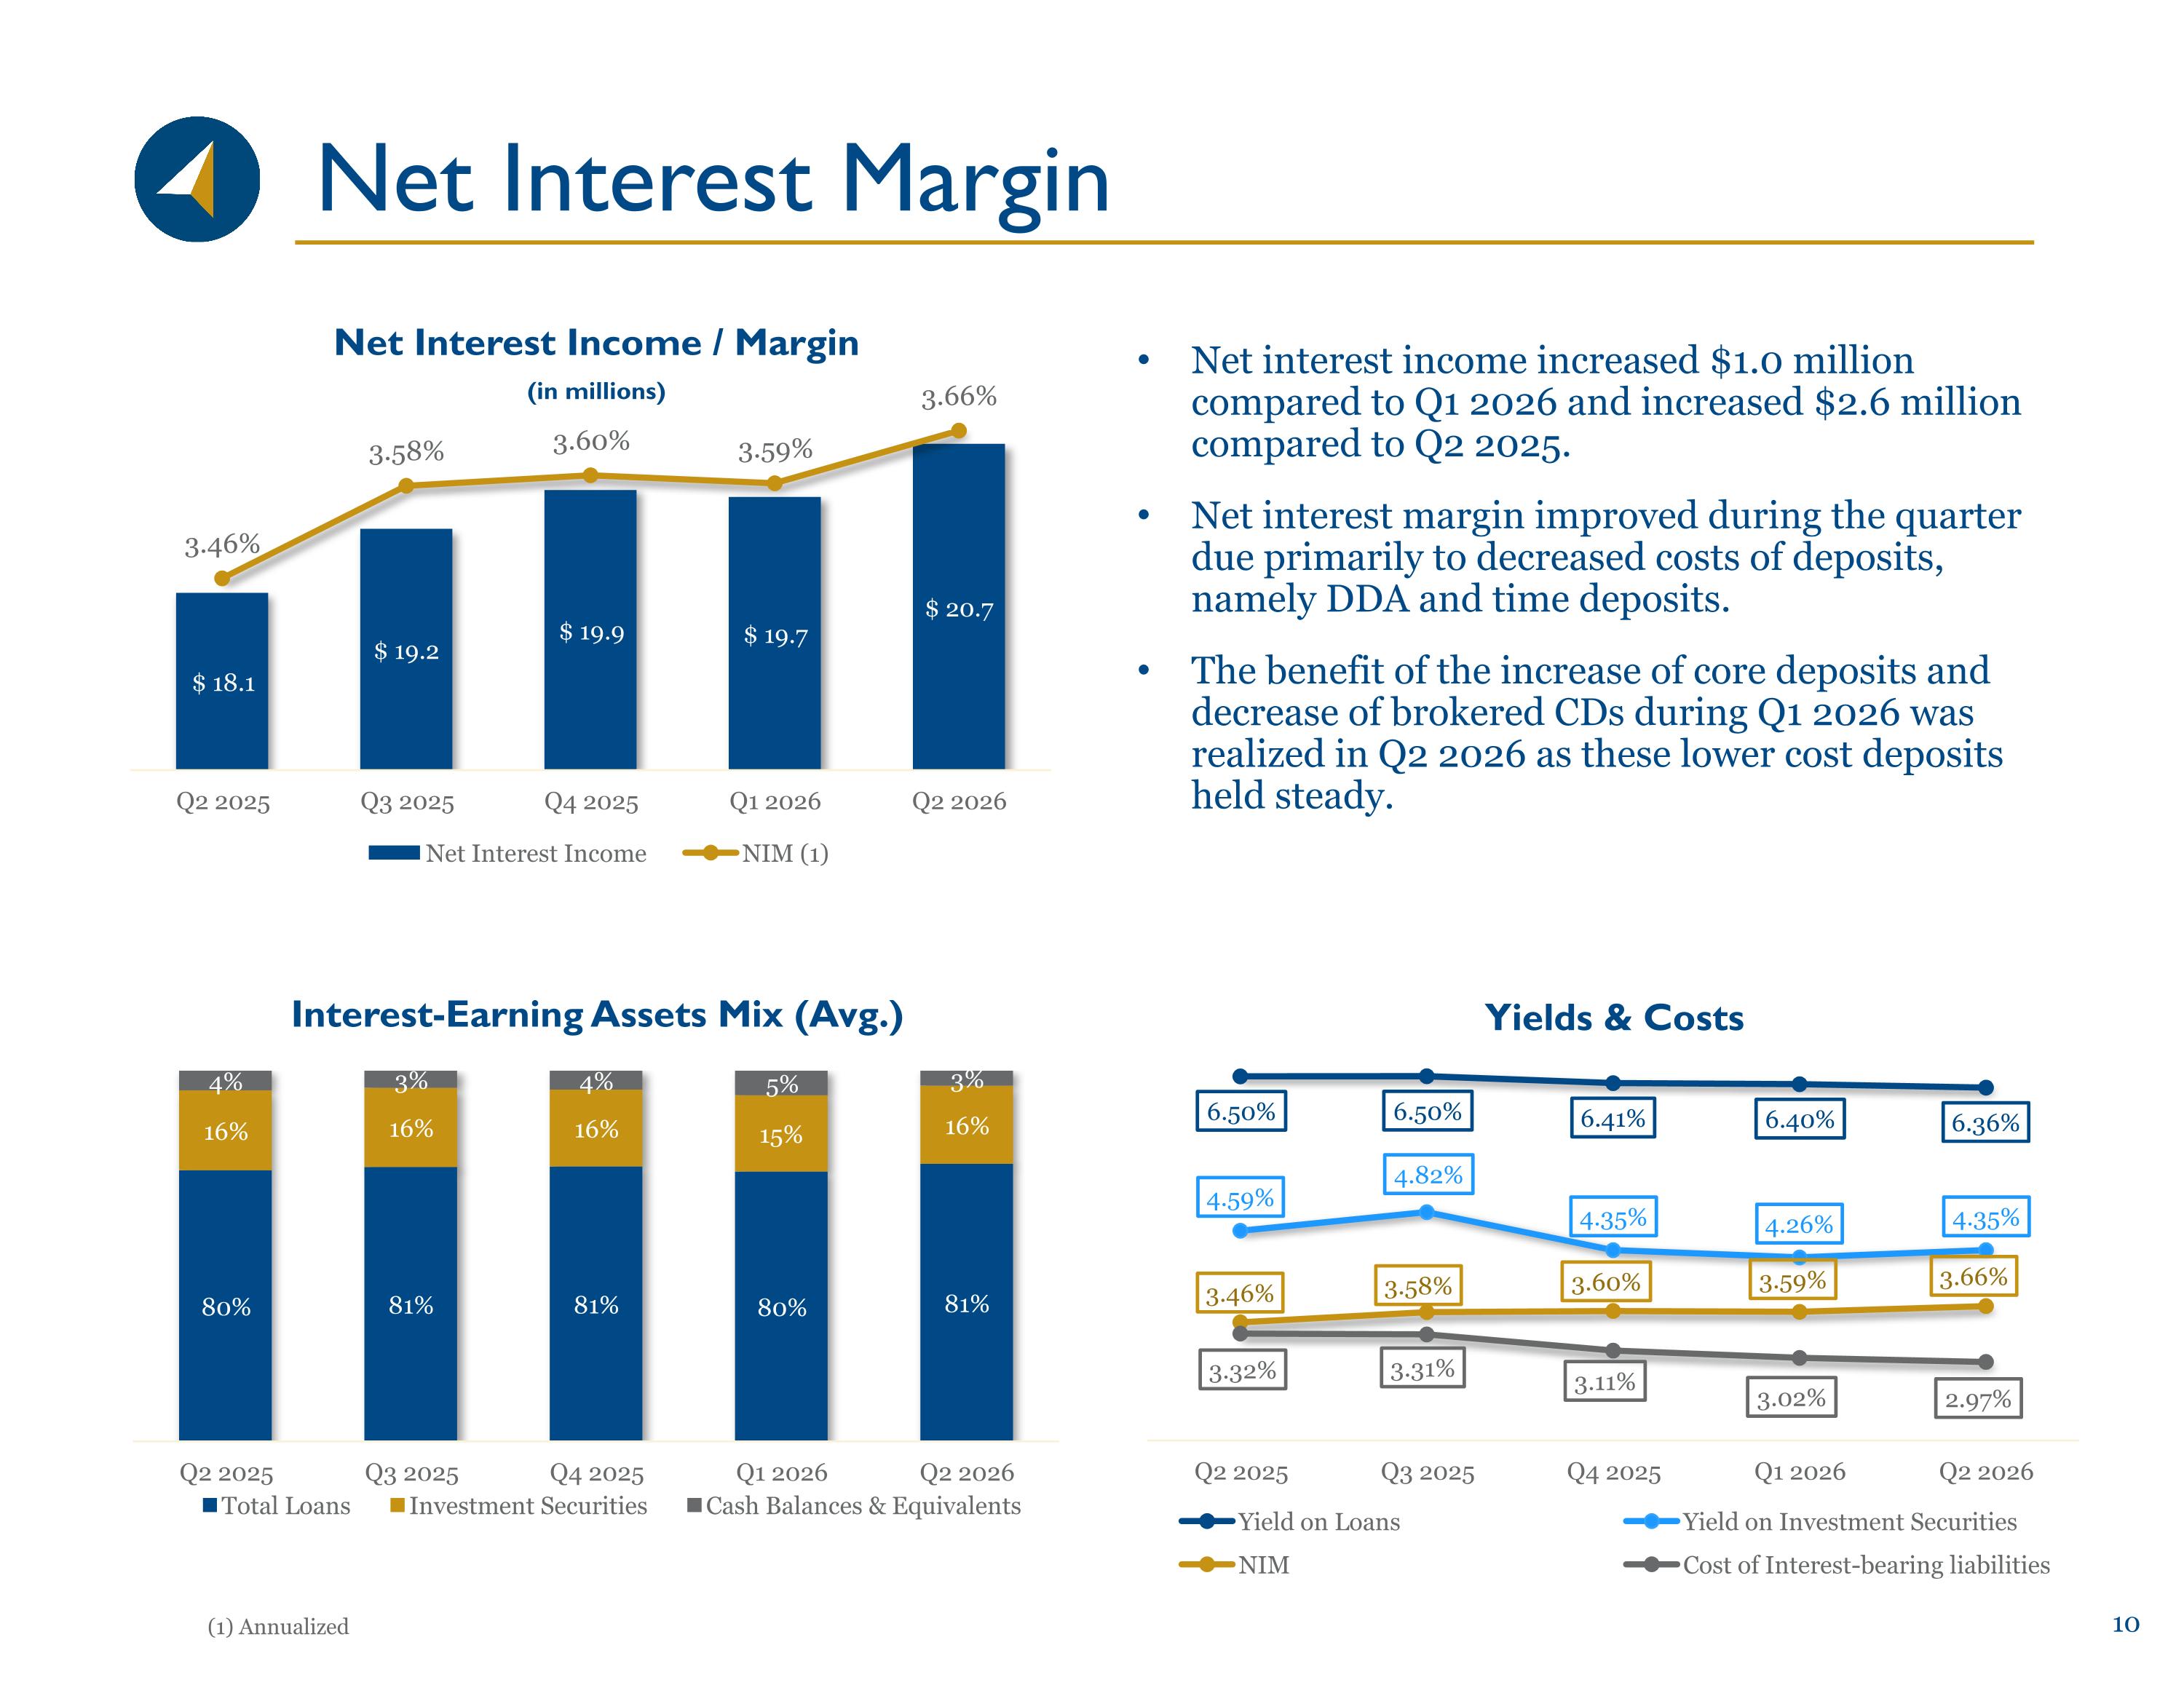
Net Interest Margin (1) Annualized Net interest income increased $1.0 million compared to Q1 2026 and increased $2.6 million compared to Q2 2025. Net interest margin improved during the quarter due primarily to decreased costs of deposits, namely DDA and time deposits. The benefit of the increase of core deposits and decrease of brokered CDs during Q1 2026 was realized in Q2 2026 as these lower cost deposits held steady.
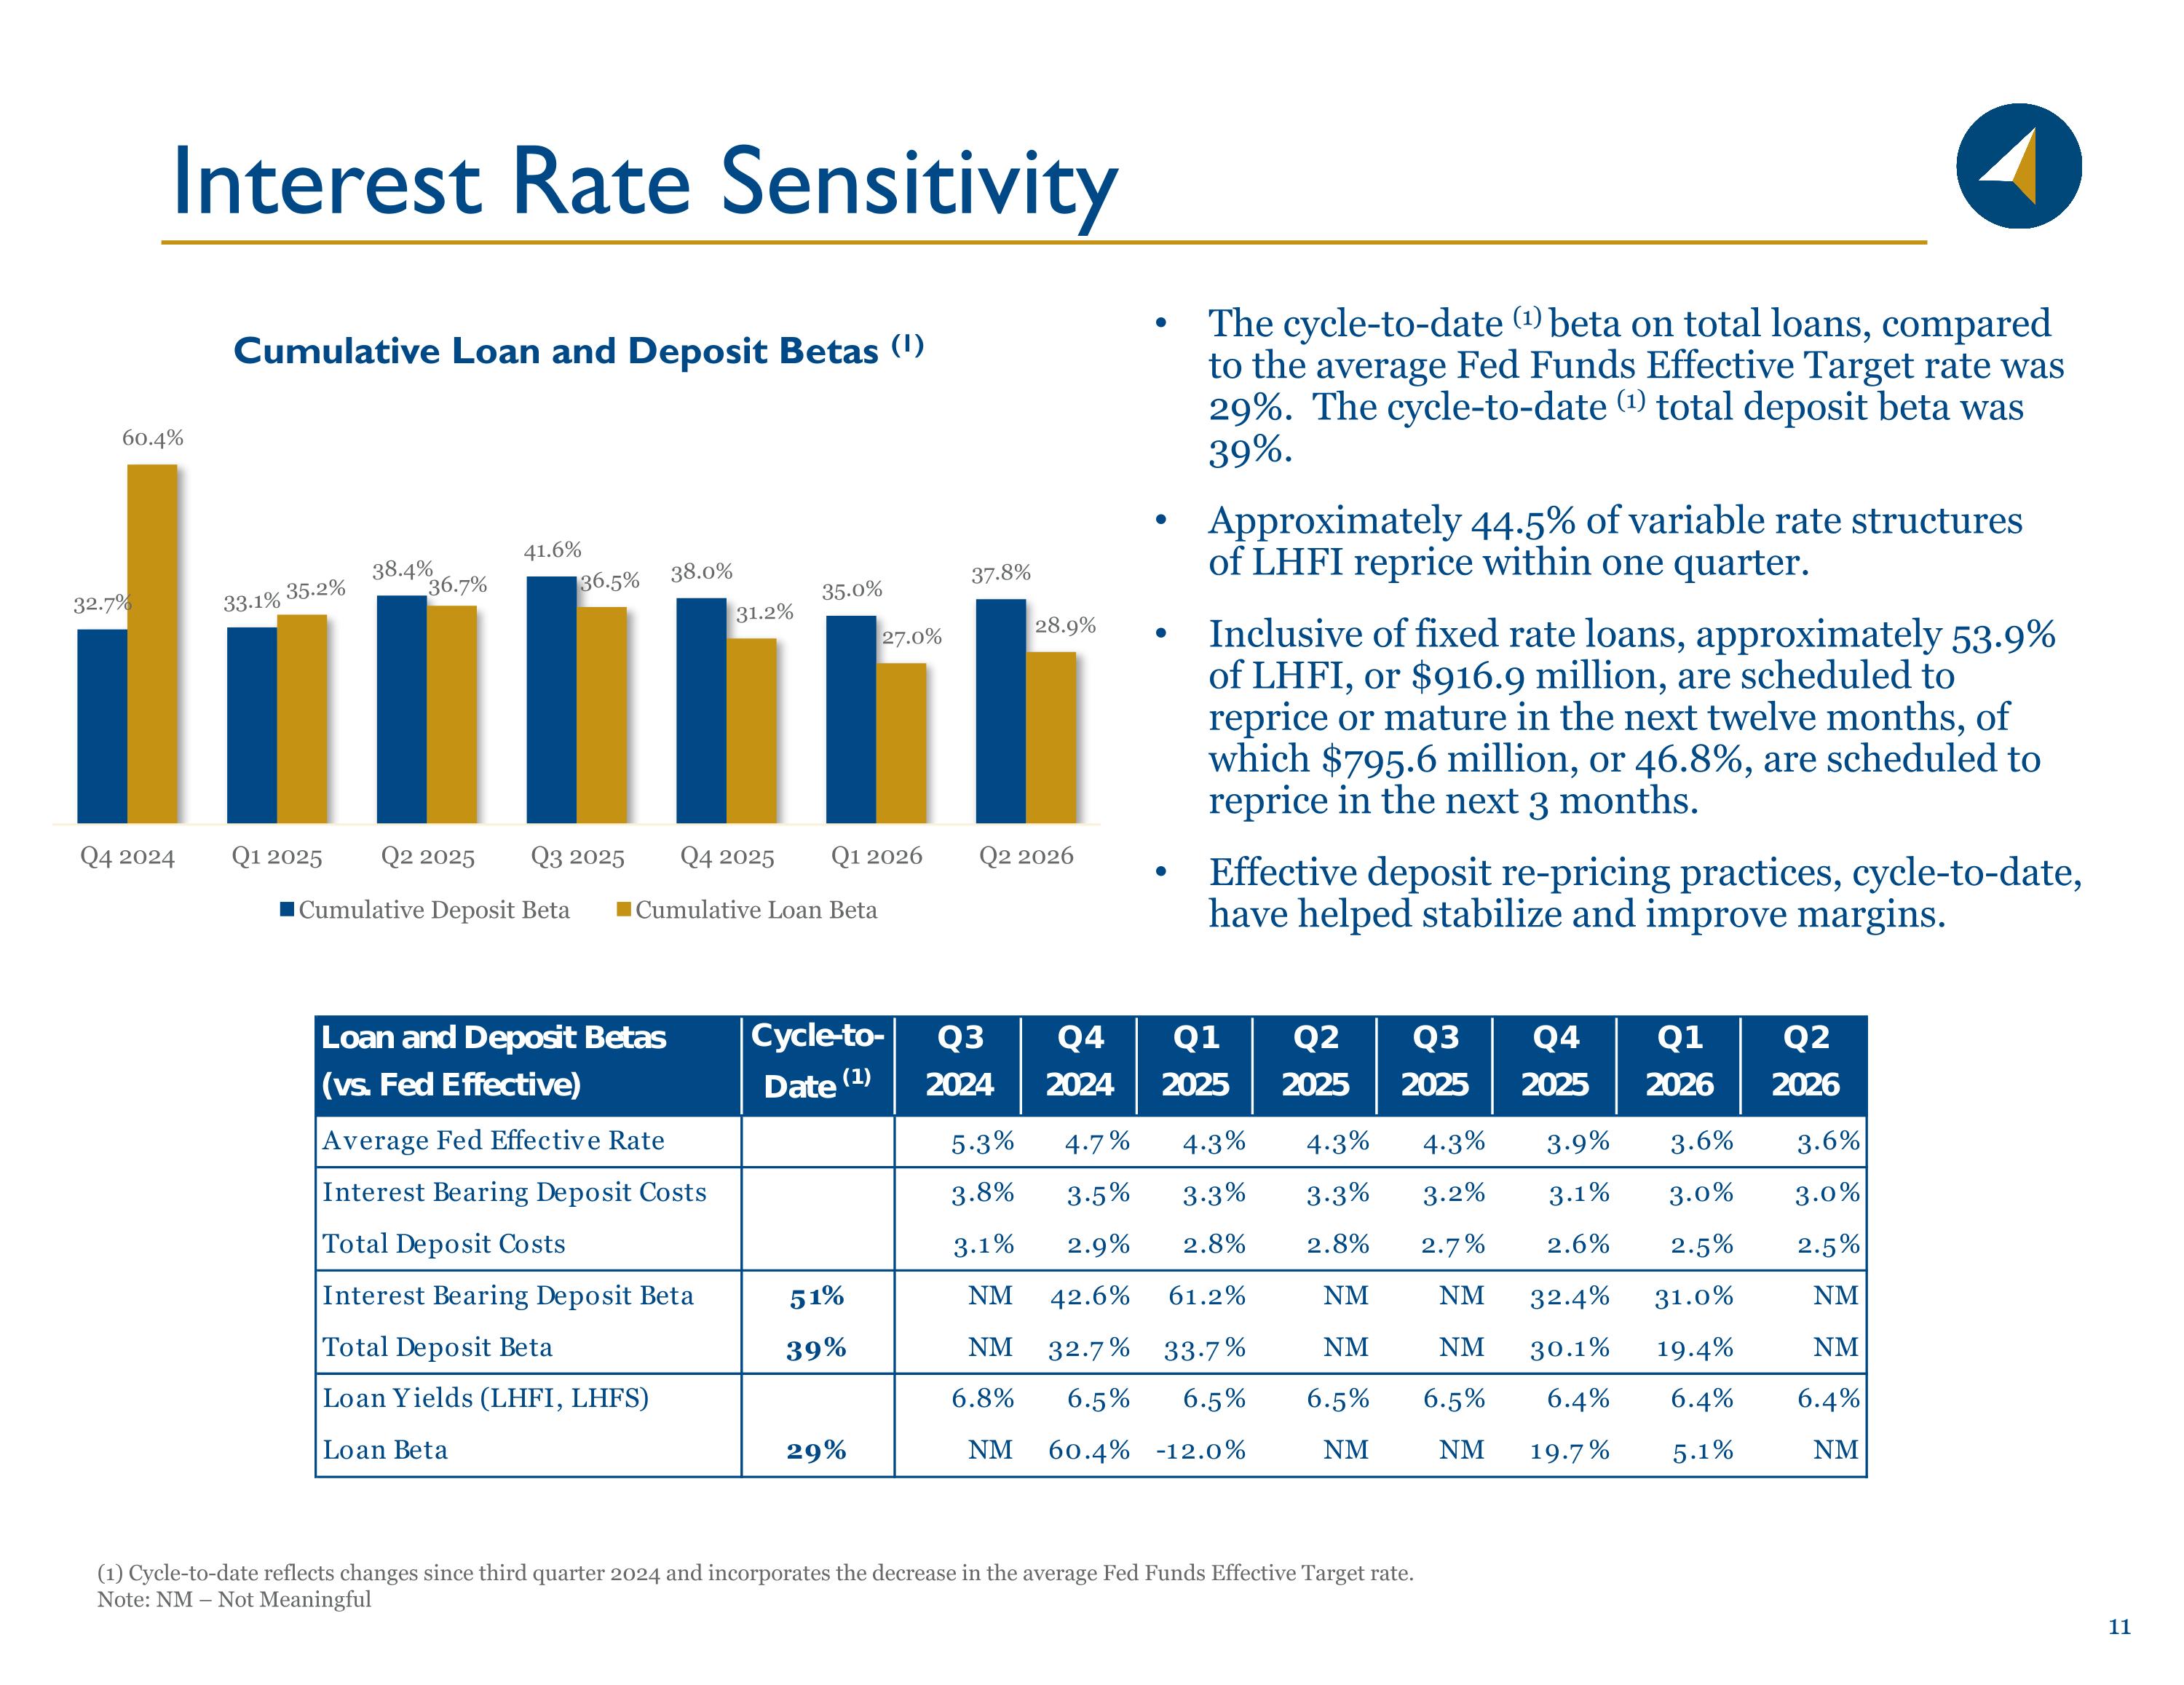
Interest Rate Sensitivity (1) Cycle-to-date reflects changes since third quarter 2024 and incorporates the decrease in the average Fed Funds Effective Target rate. Note: NM – Not Meaningful The cycle-to-date (1) beta on total loans, compared to the average Fed Funds Effective Target rate was 29%. The cycle-to-date (1) total deposit beta was 39%. Approximately 44.5% of variable rate structures of LHFI reprice within one quarter. Inclusive of fixed rate loans, approximately 53.9% of LHFI, or $916.9 million, are scheduled to reprice or mature in the next twelve months, of which $795.6 million, or 46.8%, are scheduled to reprice in the next 3 months. Effective deposit re-pricing practices, cycle-to-date, have helped stabilize and improve margins.
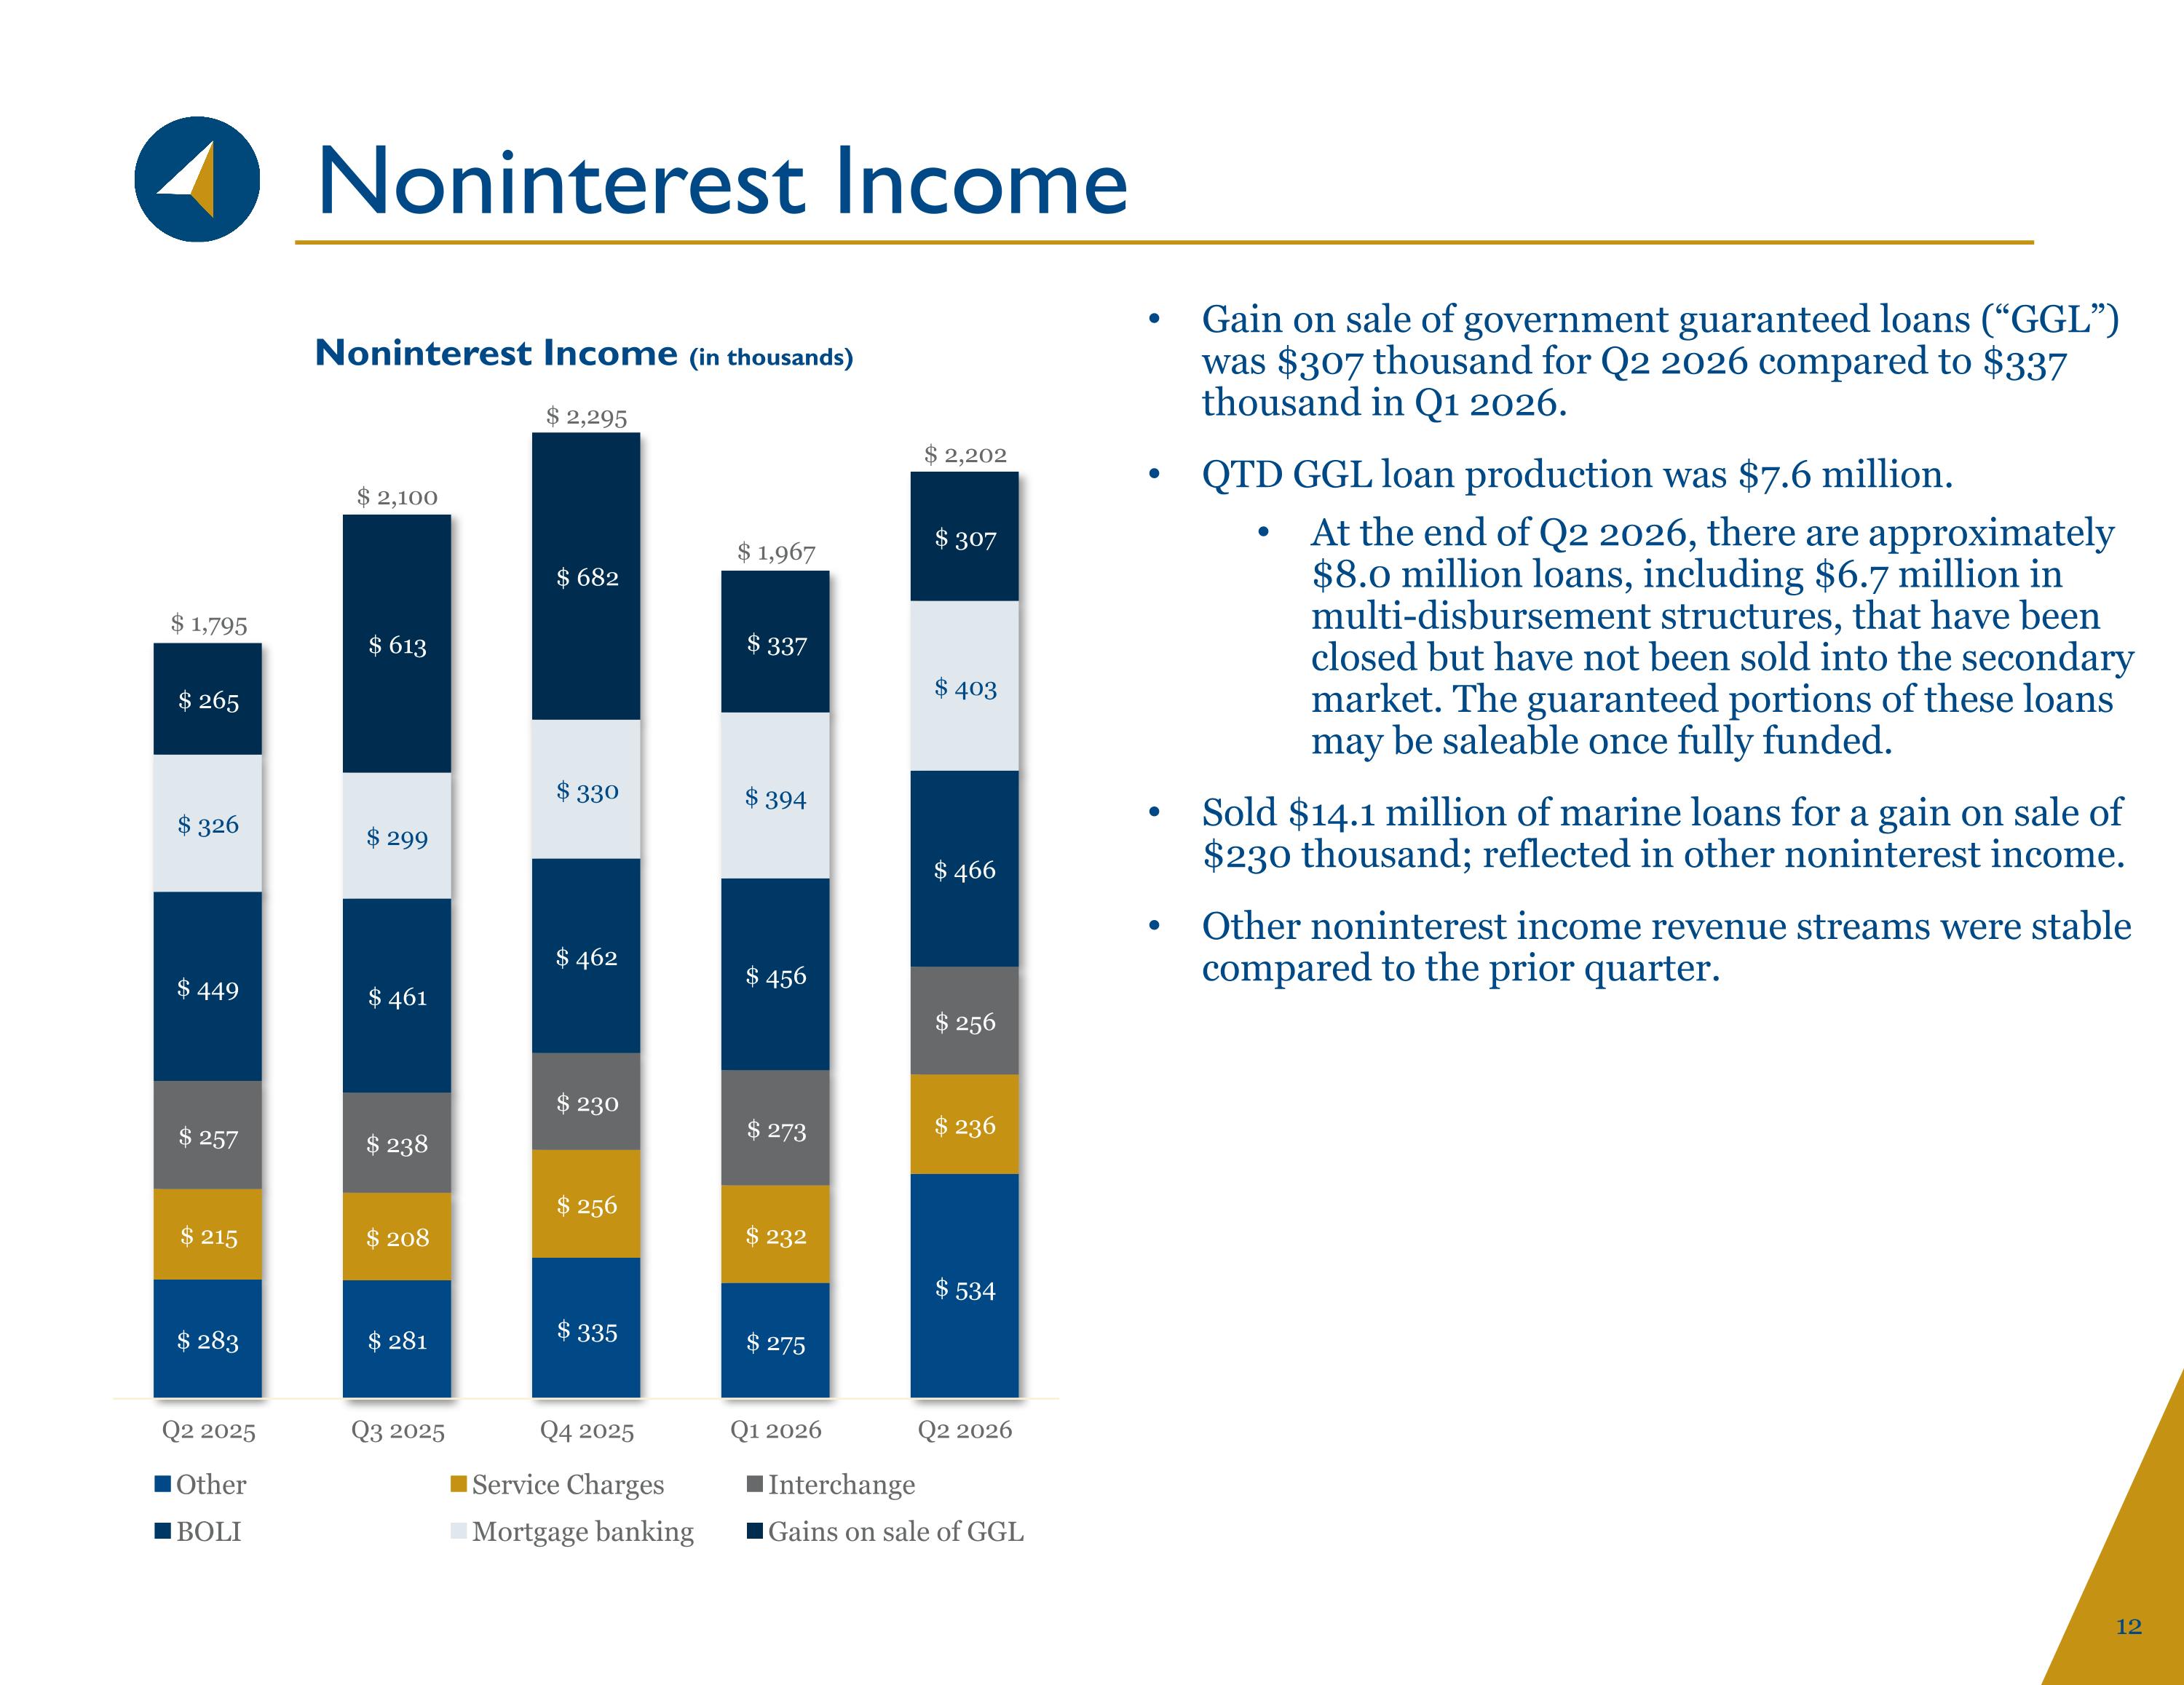
Noninterest Income Gain on sale of government guaranteed loans (“GGL”) was $307 thousand for Q2 2026 compared to $337 thousand in Q1 2026. QTD GGL loan production was $7.6 million. At the end of Q2 2026, there are approximately $8.0 million loans, including $6.7 million in multi-disbursement structures, that have been closed but have not been sold into the secondary market. The guaranteed portions of these loans may be saleable once fully funded. Sold $14.1 million of marine loans for a gain on sale of $230 thousand; reflected in other noninterest income. Other noninterest income revenue streams were stable compared to the prior quarter.
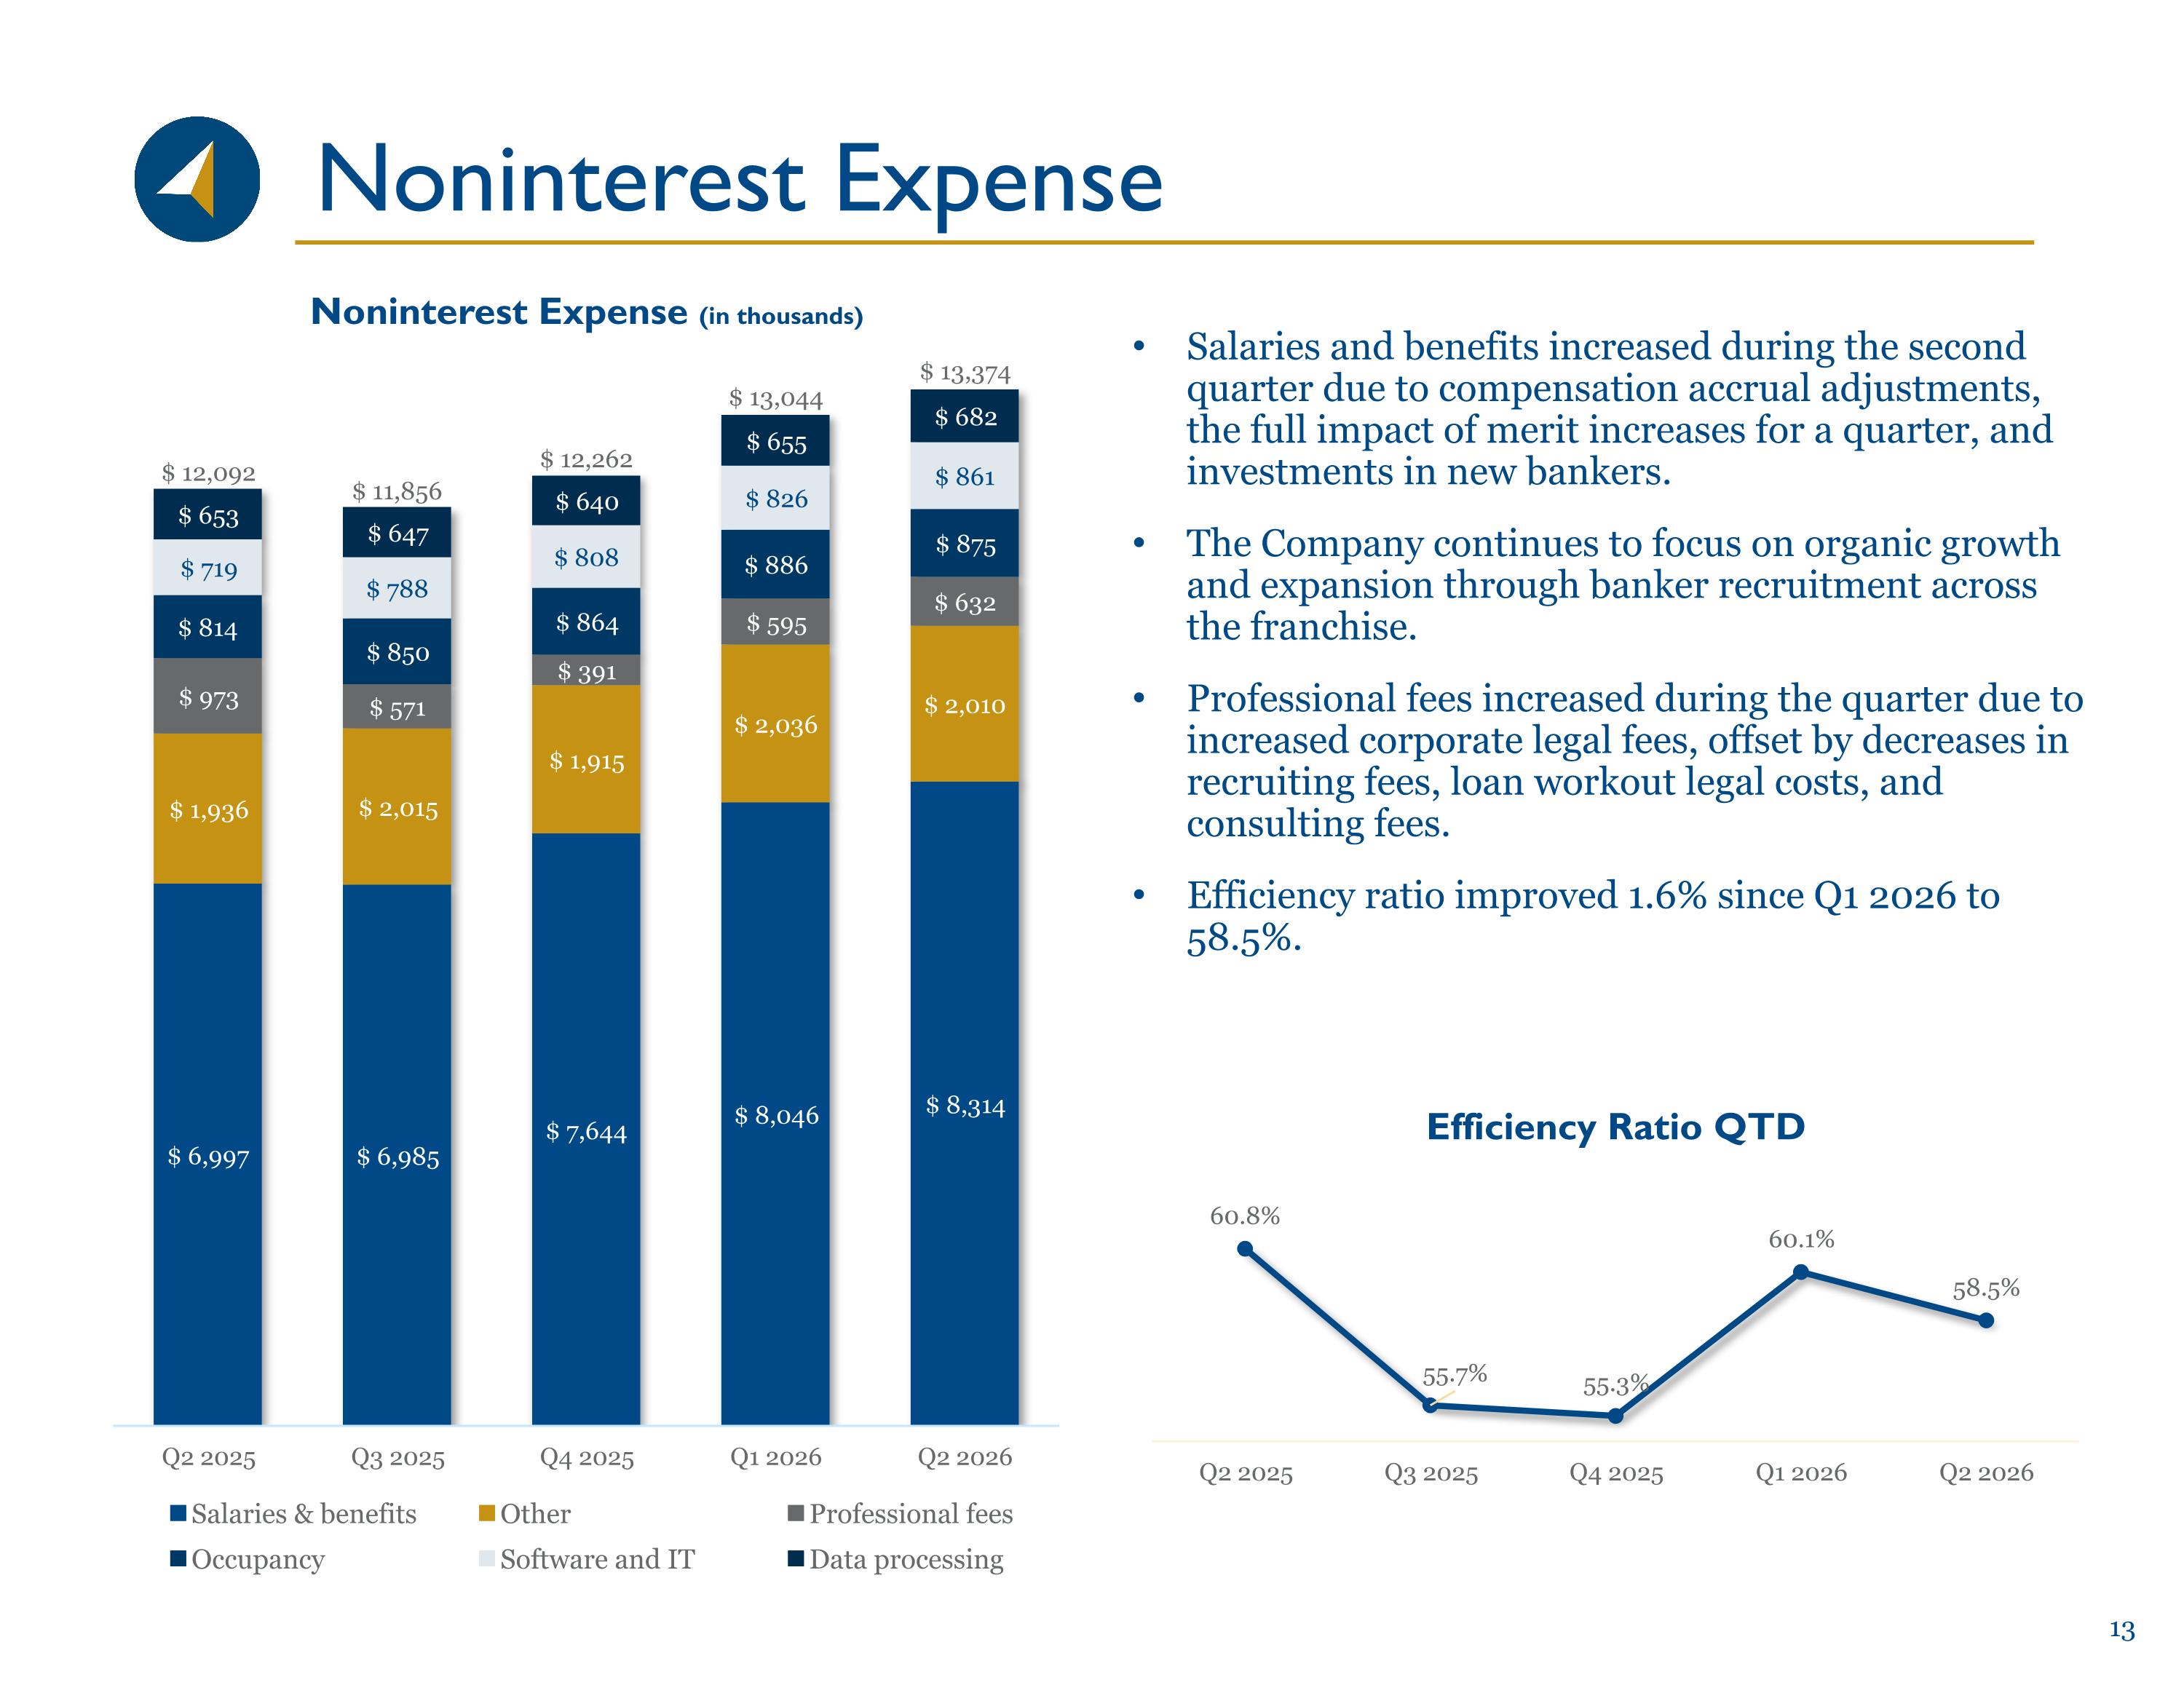
Noninterest Expense Salaries and benefits increased during the second quarter due to compensation accrual adjustments, the full impact of merit increases for a quarter, and investments in new bankers. The Company continues to focus on organic growth and expansion through banker recruitment across the franchise. Professional fees increased during the quarter due to increased corporate legal fees, offset by decreases in recruiting fees, loan workout legal costs, and consulting fees. Efficiency ratio improved 1.6% since Q1 2026 to 58.5%.
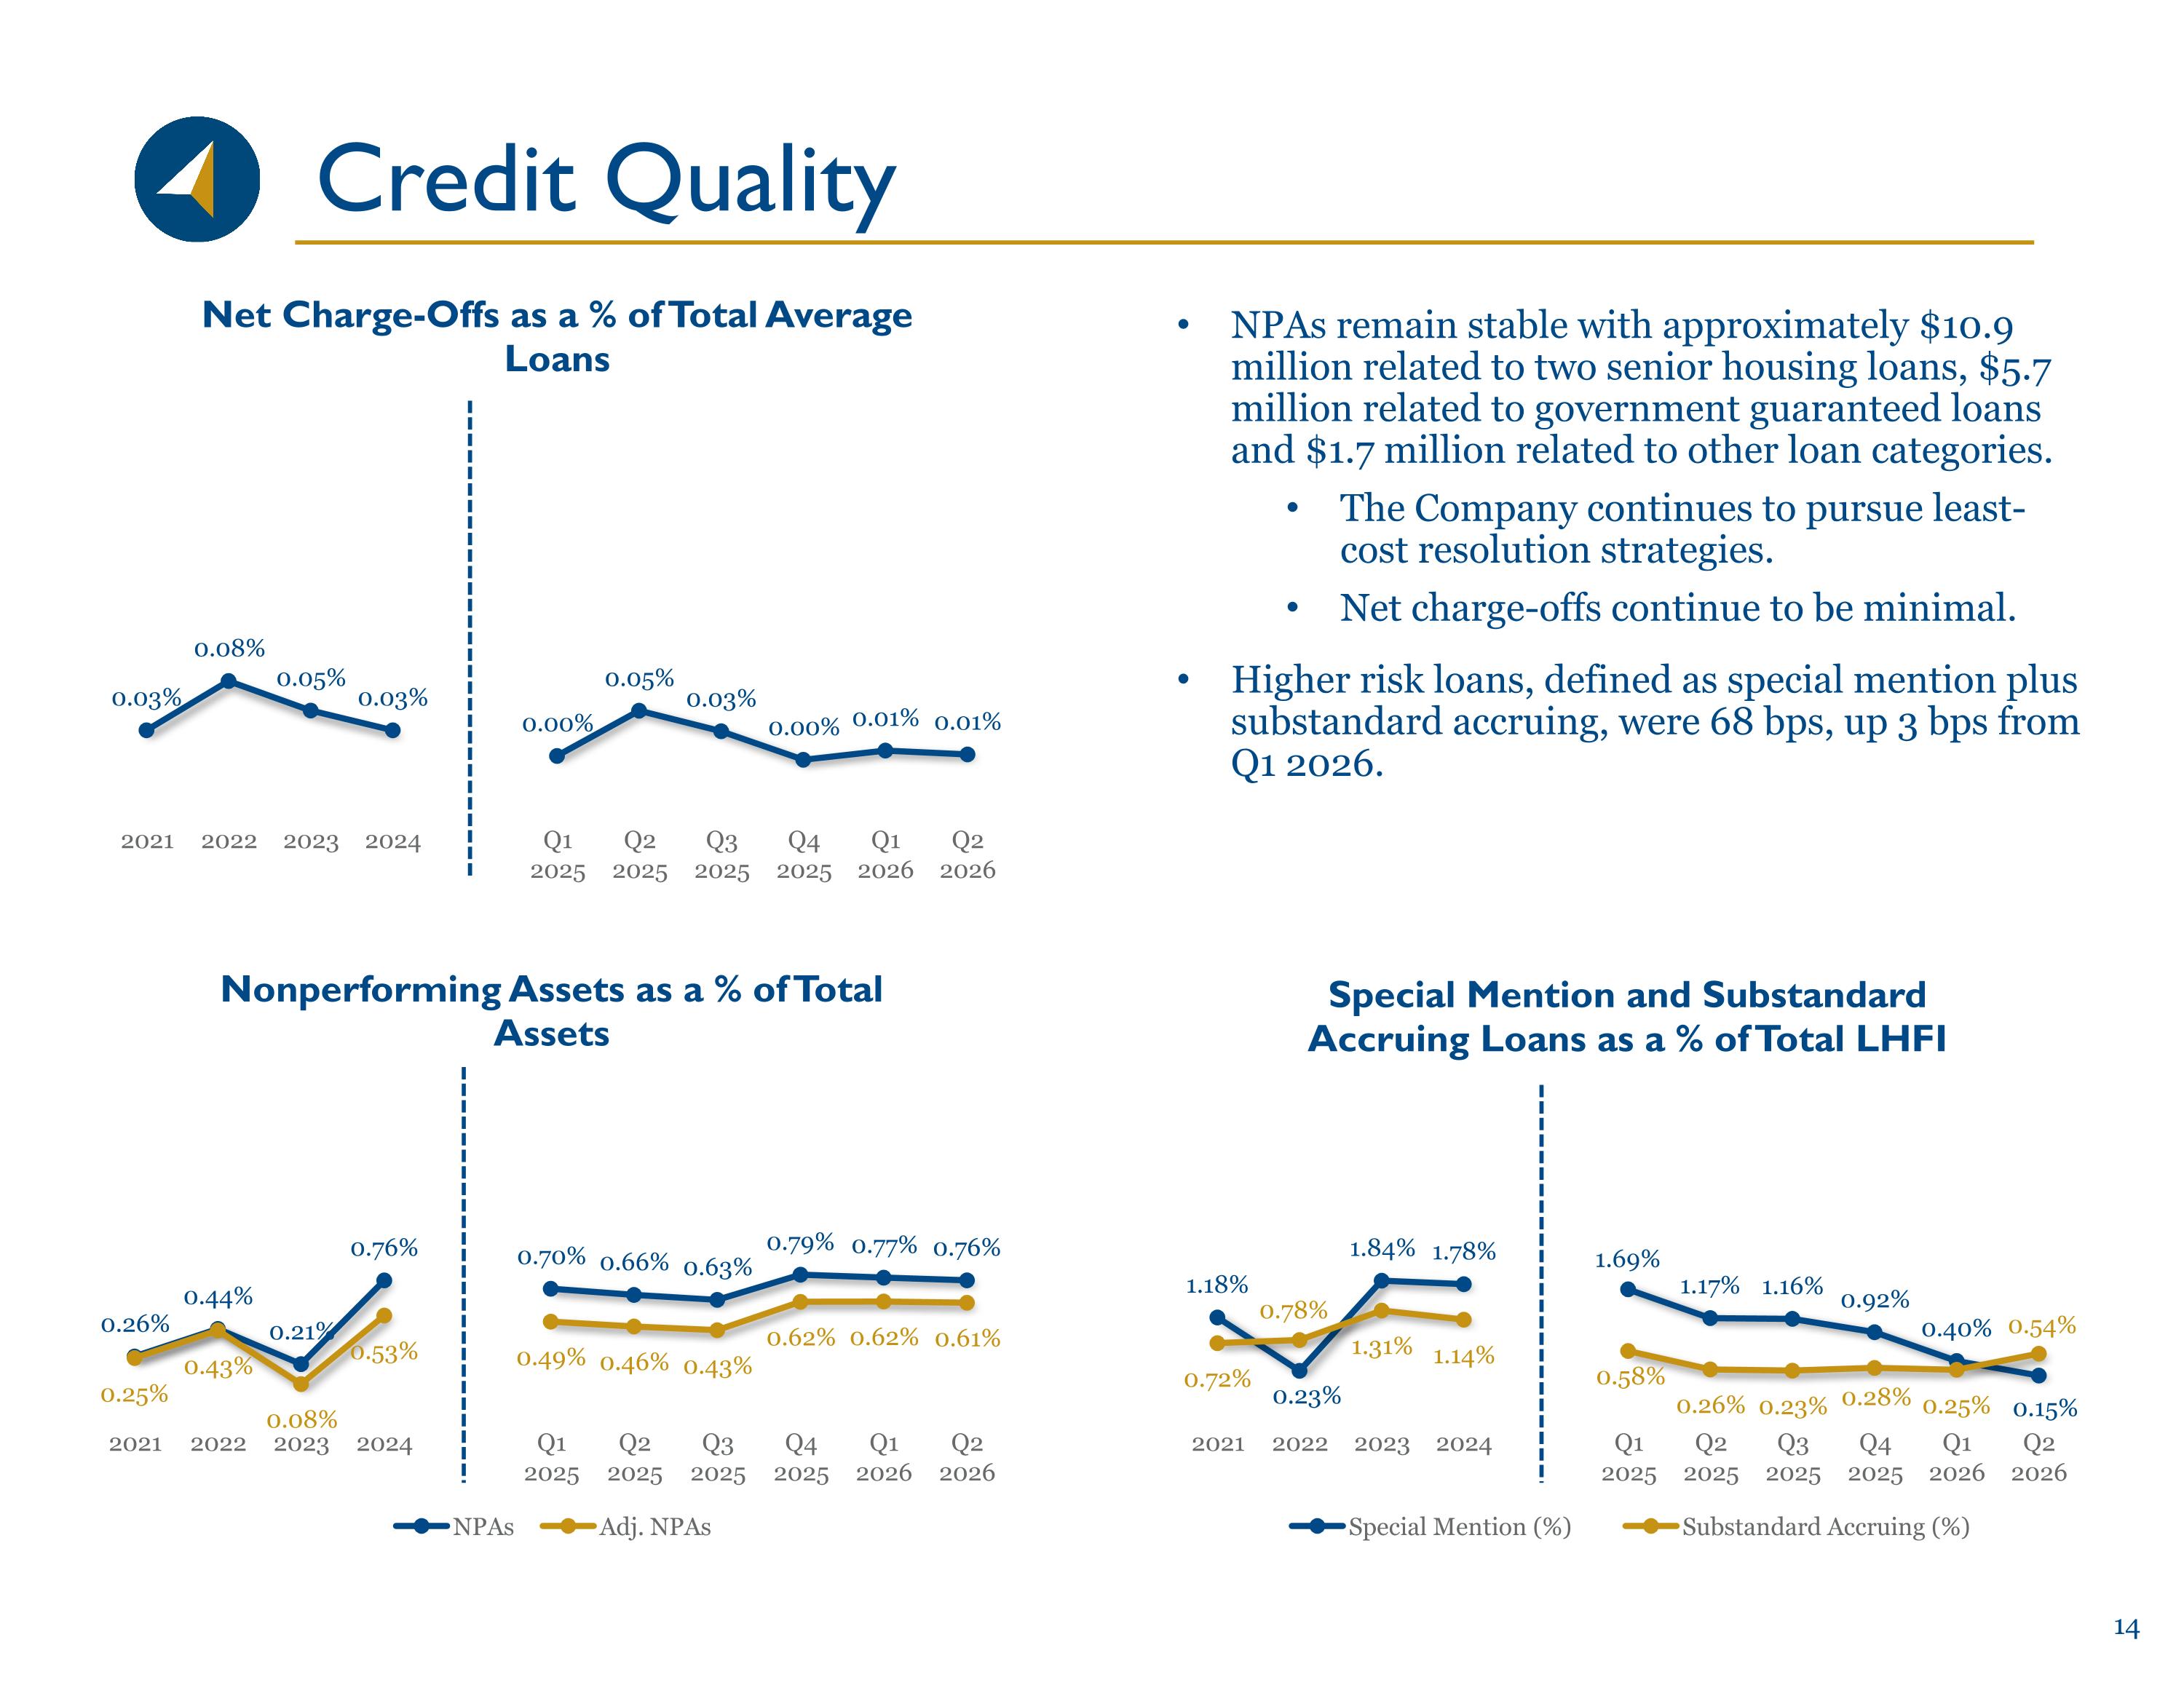
Credit Quality NPAs remain stable with approximately $10.9 million related to two senior housing loans, $5.7 million related to government guaranteed loans and $1.7 million related to other loan categories. The Company continues to pursue least-cost resolution strategies. Net charge-offs continue to be minimal. Higher risk loans, defined as special mention plus substandard accruing, were 68 bps, up 3 bps from Q1 2026.
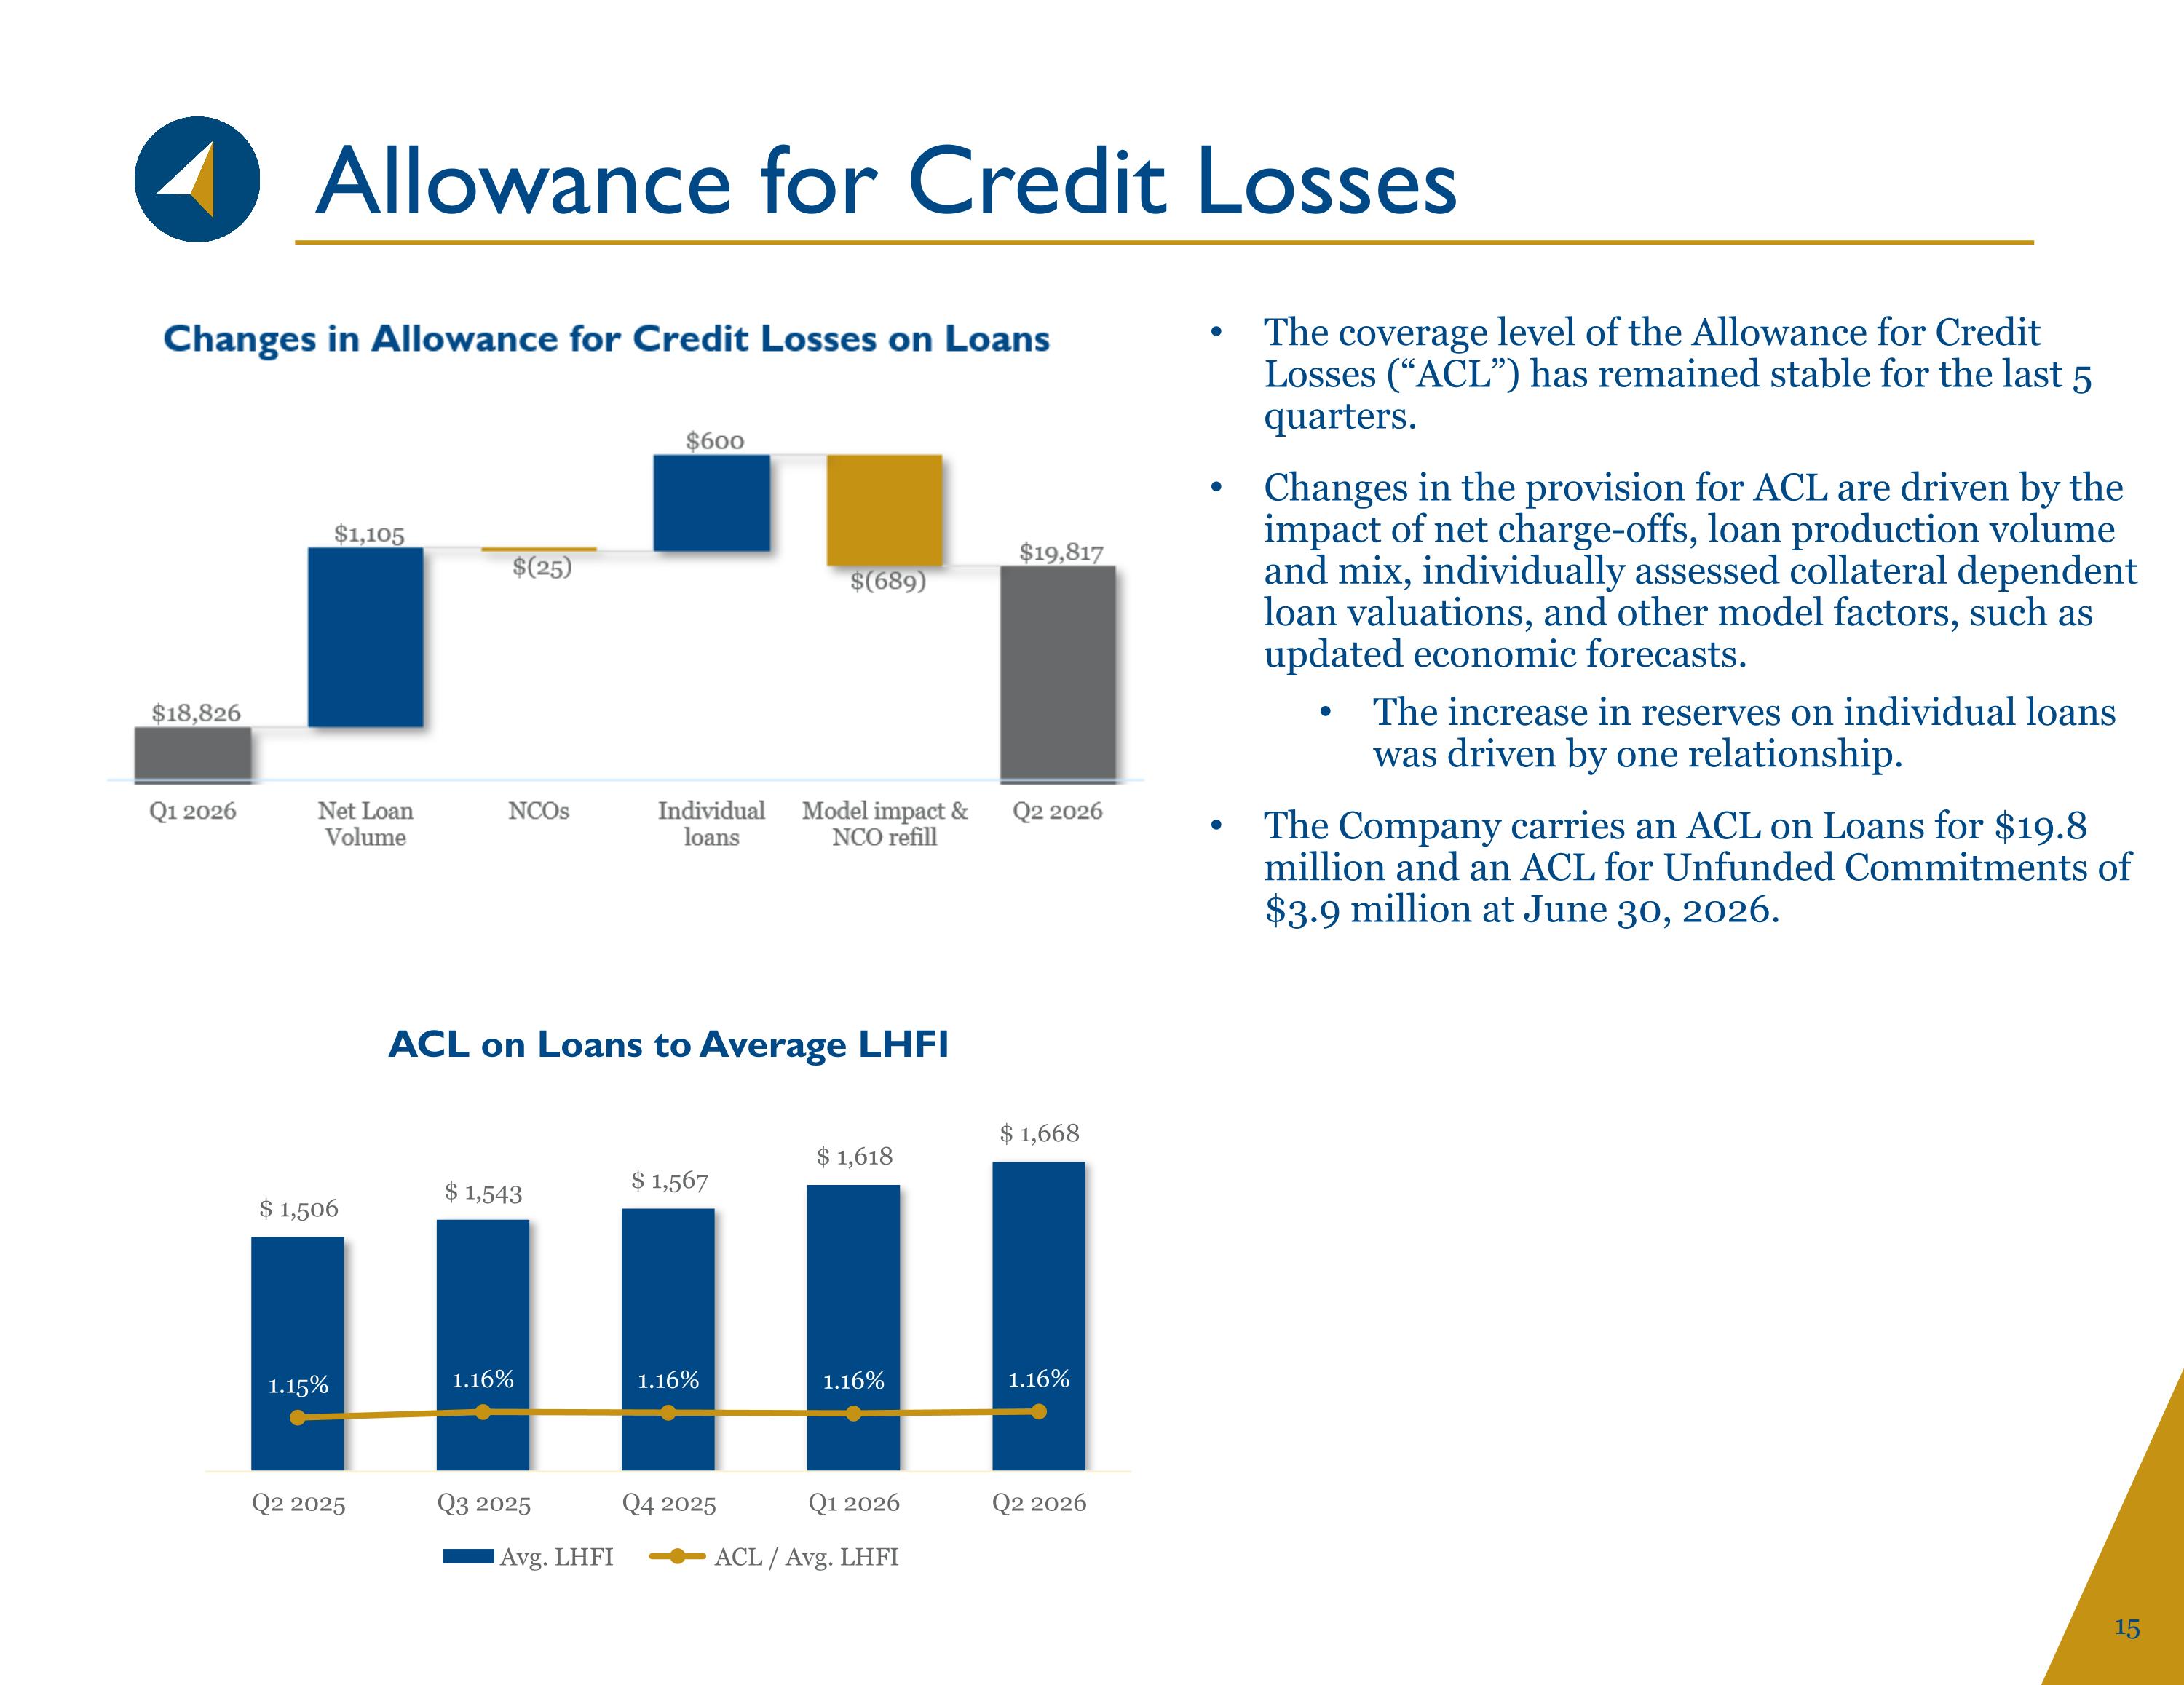
Allowance for Credit Losses The coverage level of the Allowance for Credit Losses (“ACL”) has remained stable for the last 5 quarters. Changes in the provision for ACL are driven by the impact of net charge-offs, loan production volume and mix, individually assessed collateral dependent loan valuations, and other model factors, such as updated economic forecasts. The increase in reserves on individual loans was driven by one relationship. The Company carries an ACL on Loans for $19.8 million and an ACL for Unfunded Commitments of $3.9 million at June 30, 2026.
Appendix
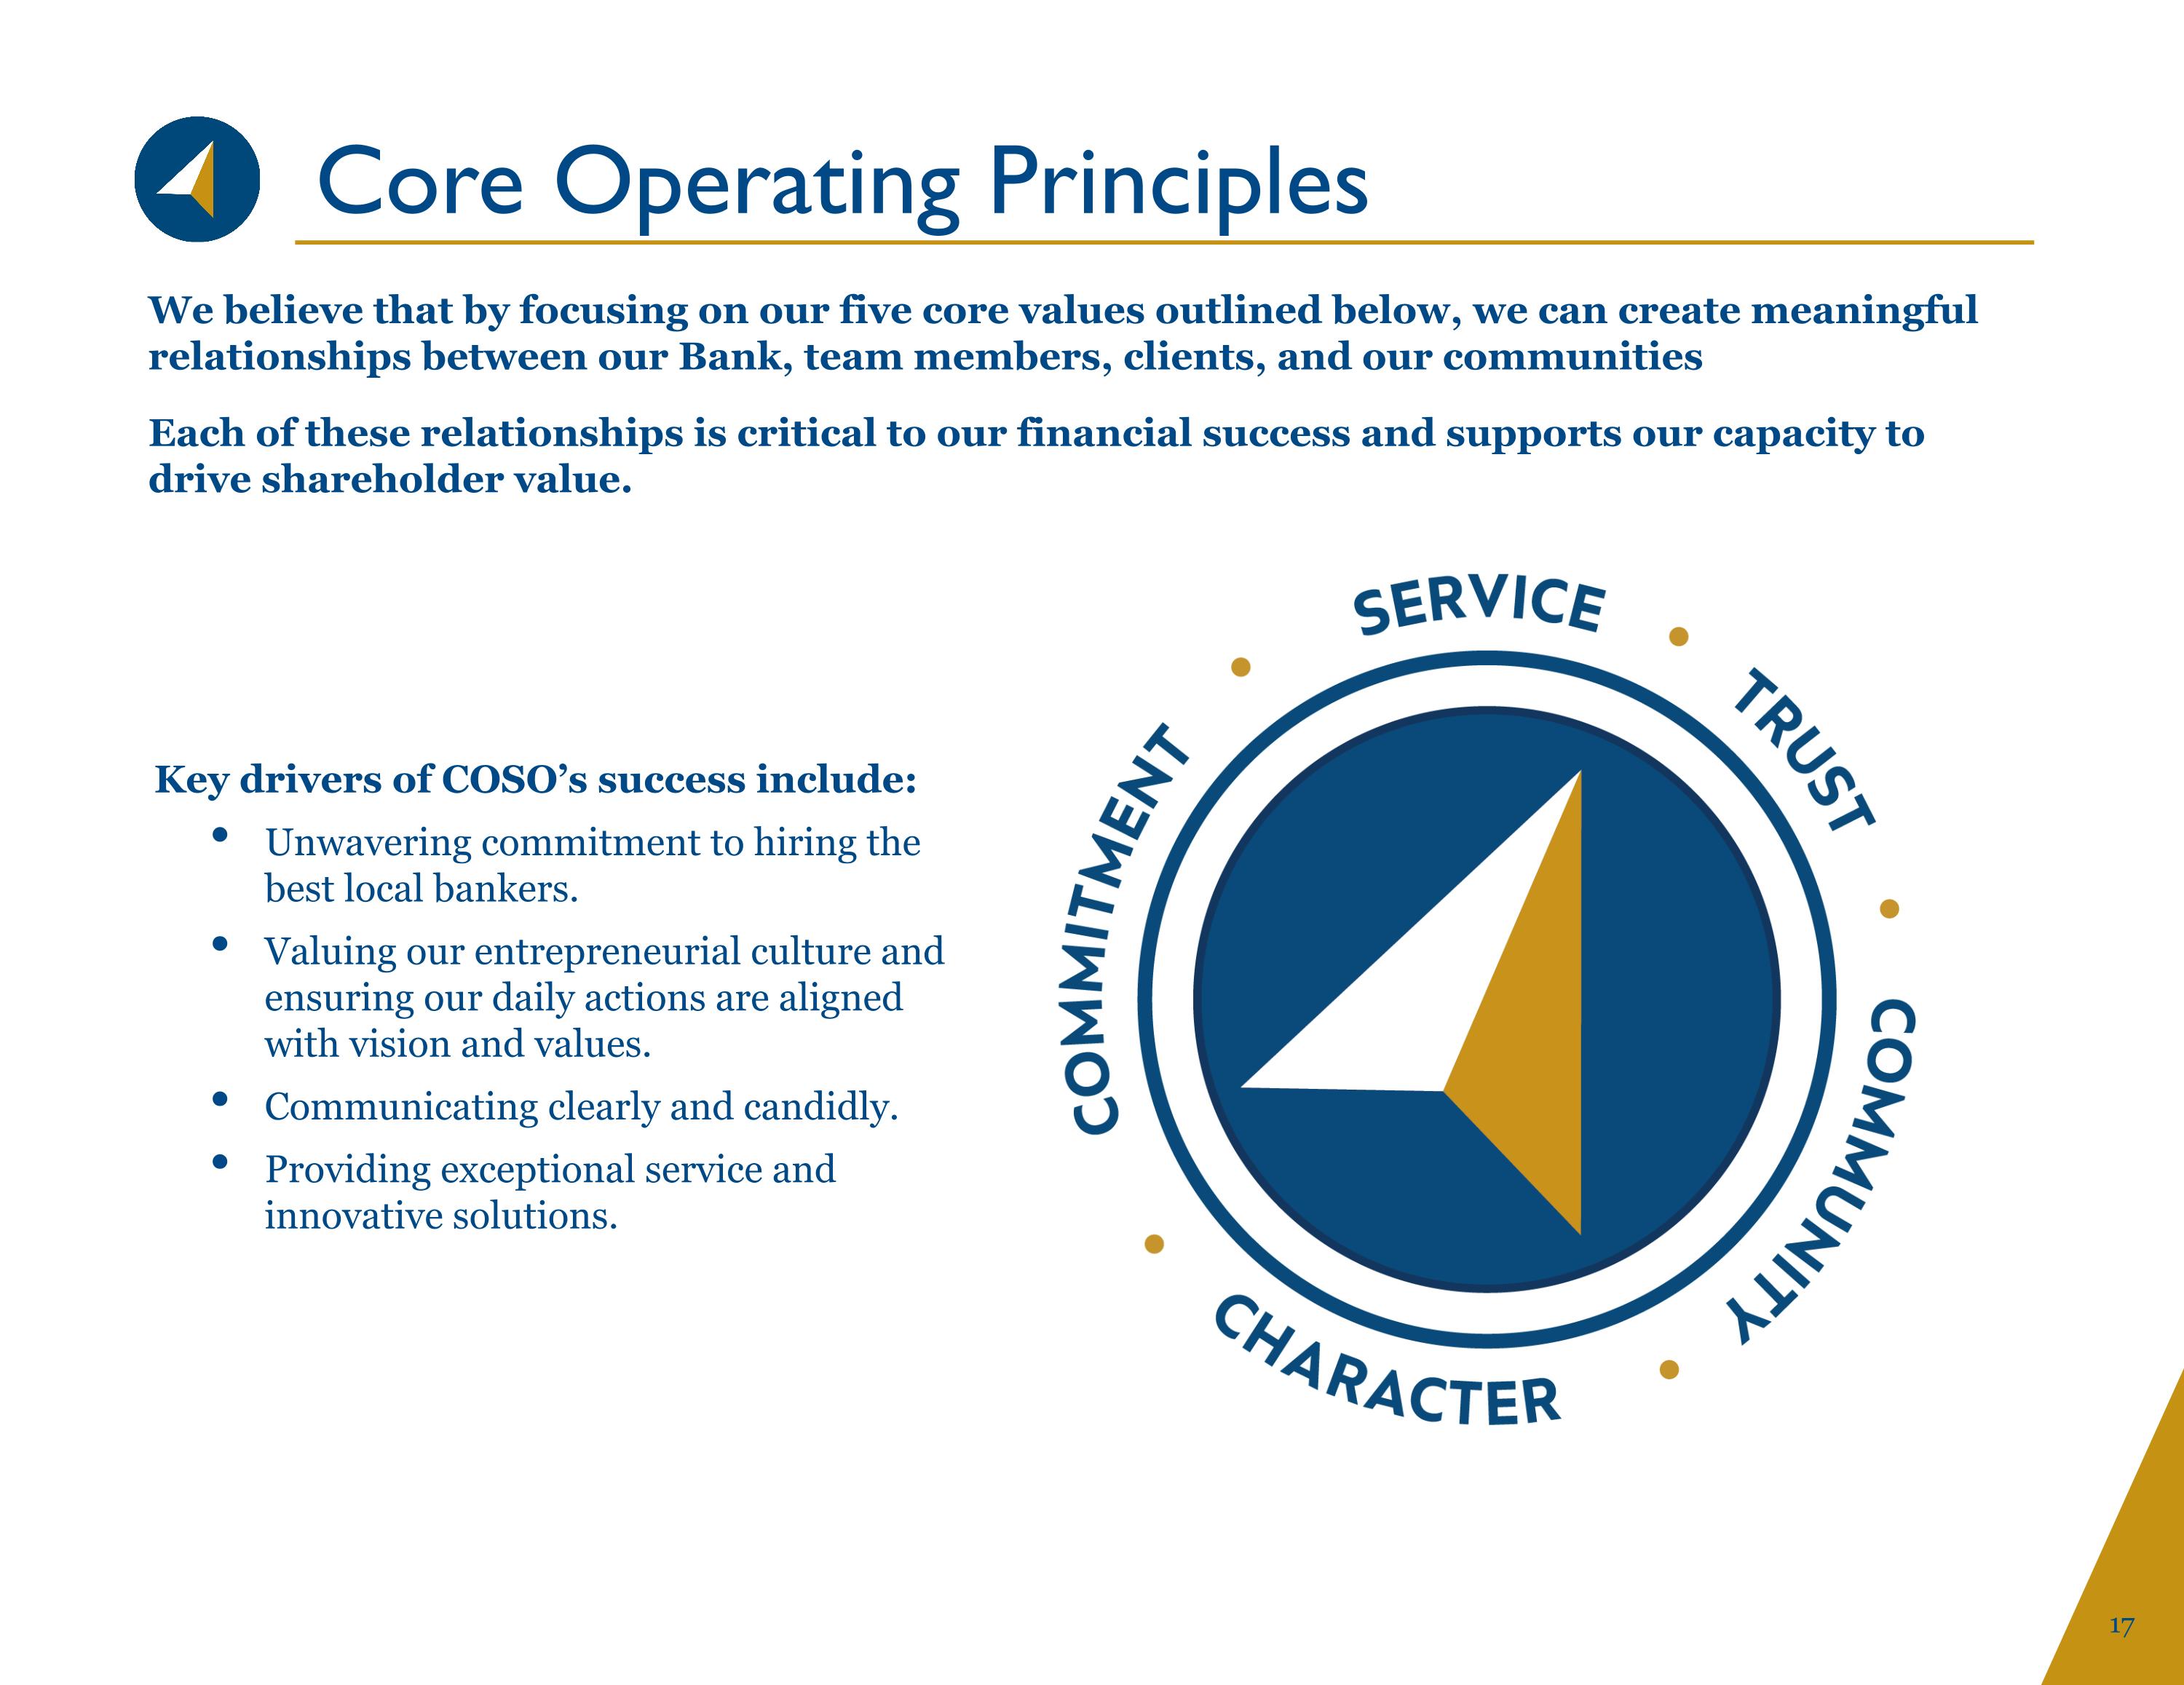
Core Operating Principles We believe that by focusing on our five core values outlined below, we can create meaningful relationships between our Bank, team members, clients, and our communities Each of these relationships is critical to our financial success and supports our capacity to drive shareholder value. Key drivers of COSO’s success include: Unwavering commitment to hiring the best local bankers. Valuing our entrepreneurial culture and ensuring our daily actions are aligned with vision and values. Communicating clearly and candidly. Providing exceptional service and innovative solutions.
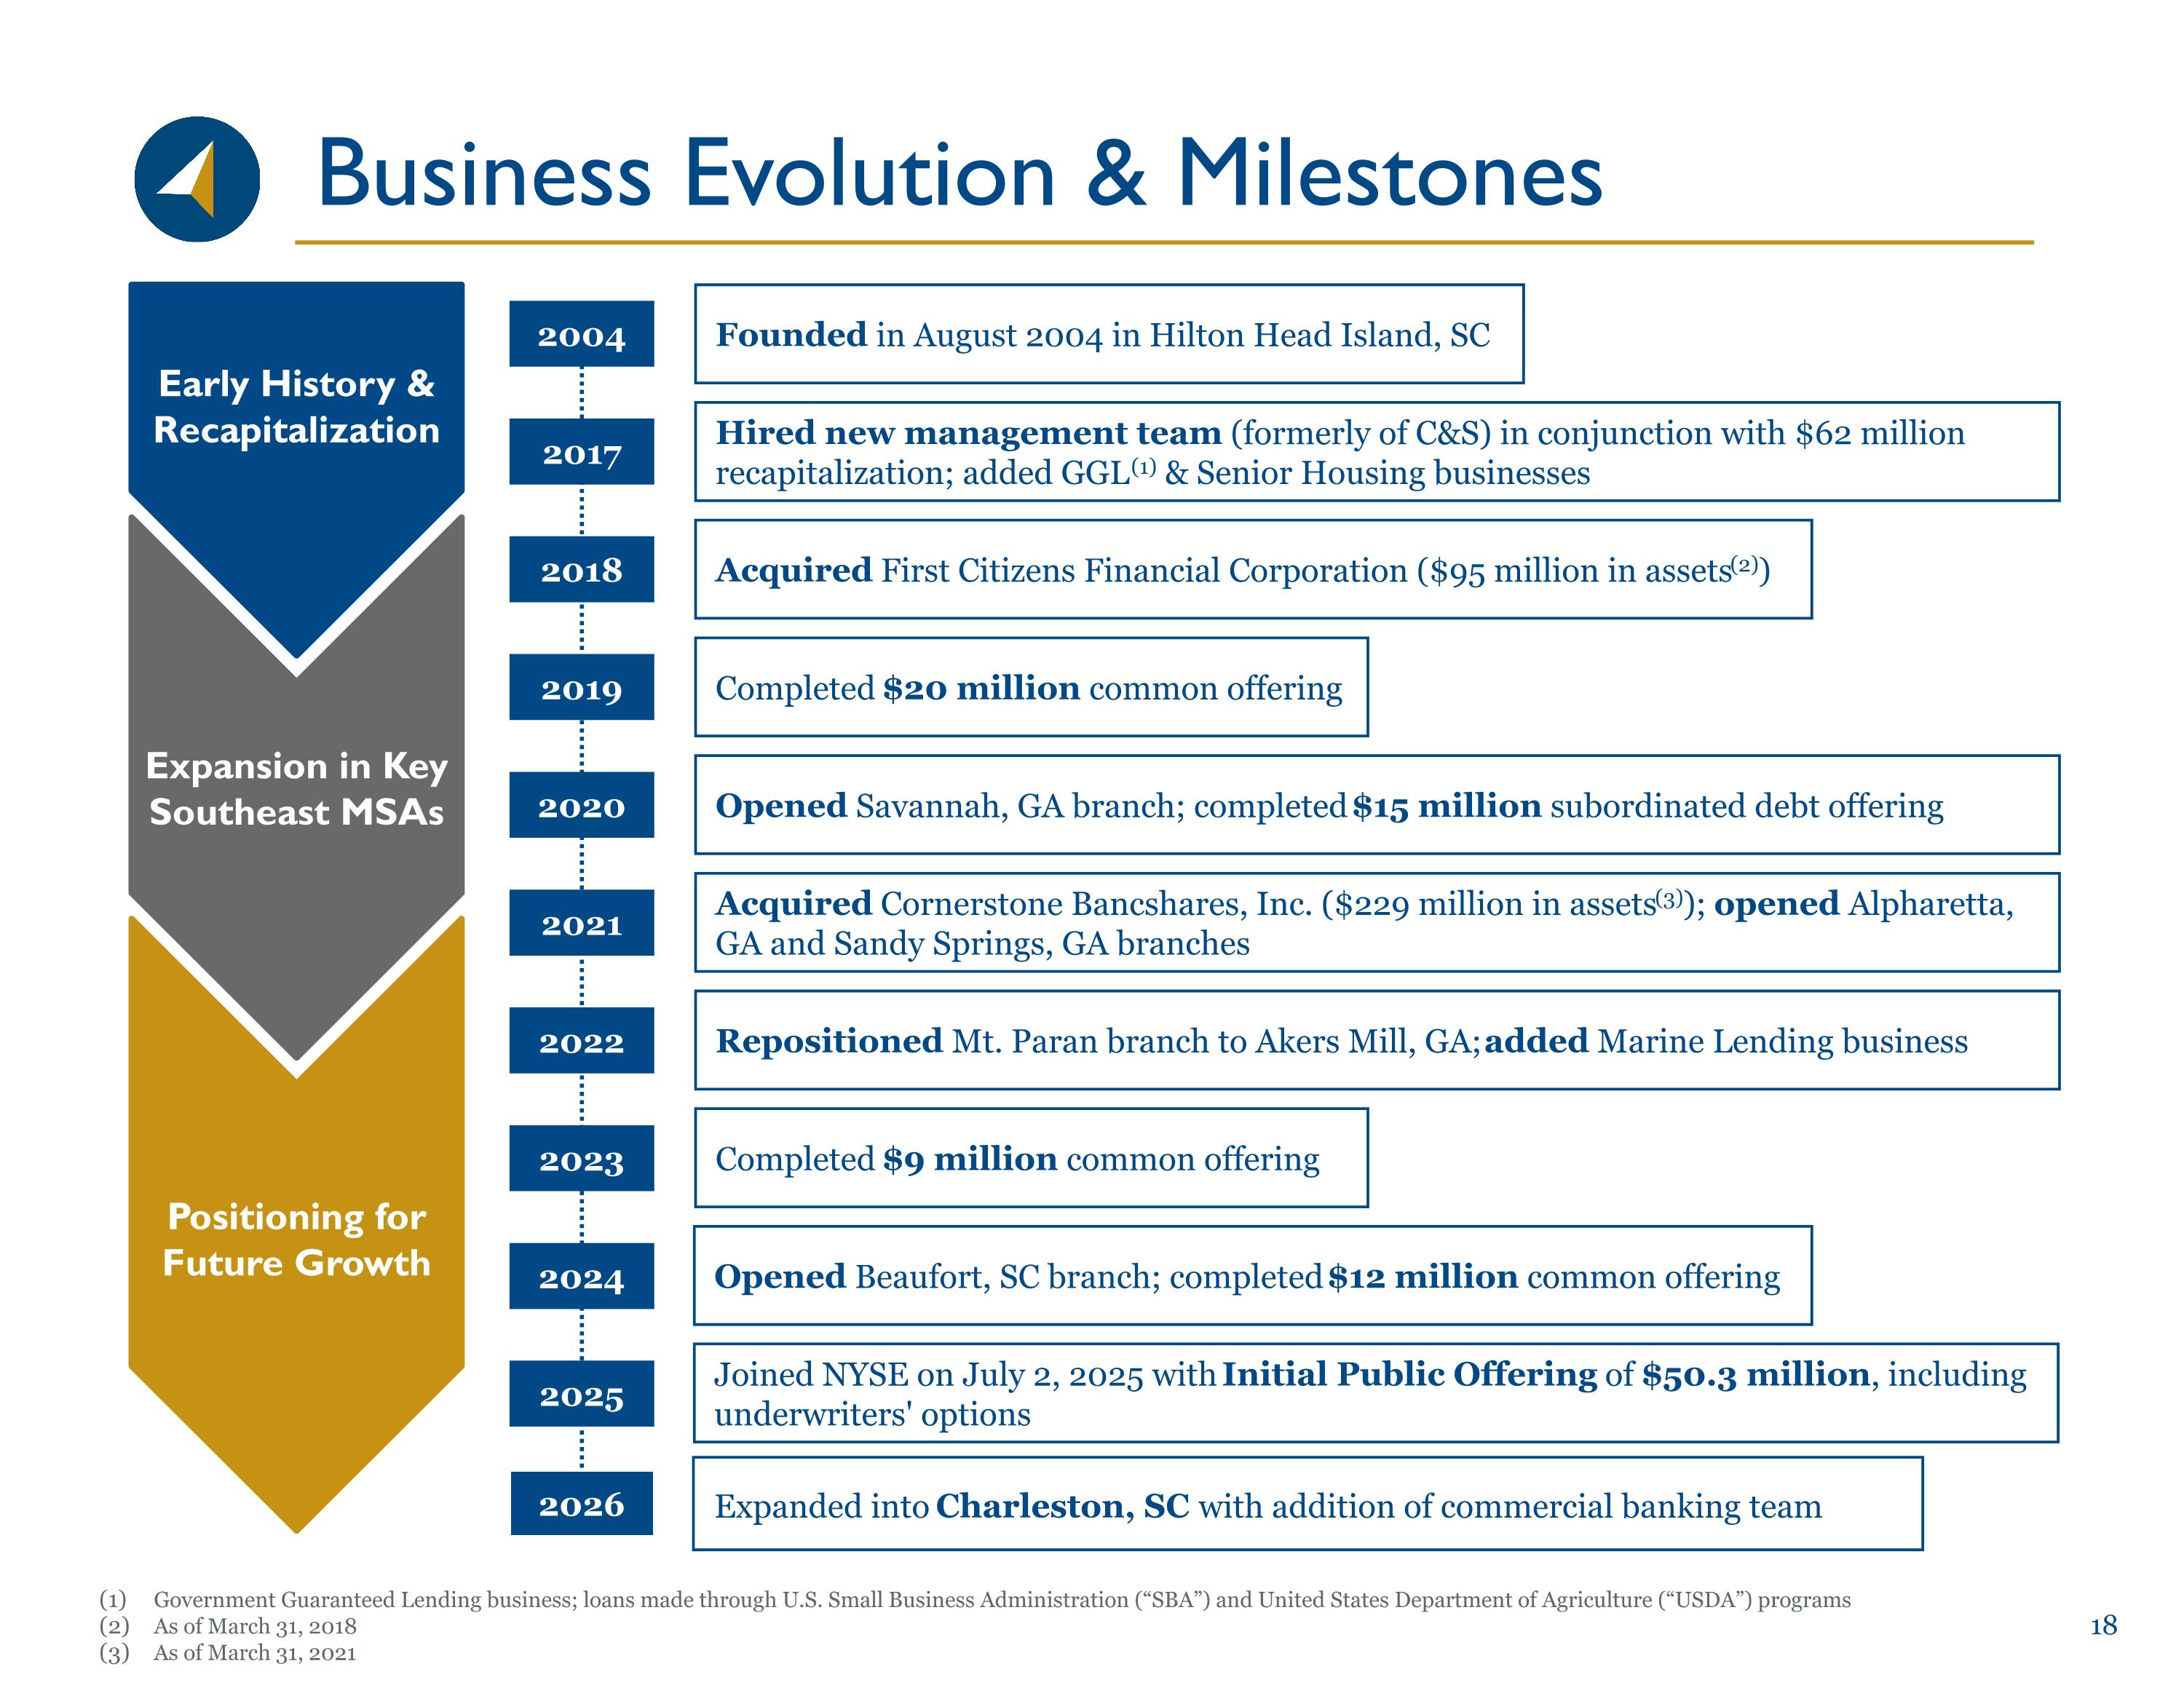
Business Evolution & Milestones Government Guaranteed Lending business; loans made through U.S. Small Business Administration (“SBA”) and United States Department of Agriculture (“USDA”) programs As of March 31, 2018 As of March 31, 2021 Early History & Recapitalization Expansion in Key Southeast MSAs Positioning for Future Growth Founded in August 2004 in Hilton Head Island, SC Opened Savannah, GA branch; completed $15 million subordinated debt offering Hired new management team (formerly of C&S) in conjunction with $62 million recapitalization; added GGL (1) & Senior Housing businesses Acquired First Citizens Financial Corporation ($95 million in assets (2)) Completed $20 million common offering 2004 2017 2018 2019 2020 Acquired Cornerstone Bancshares, Inc. ($229 million in assets (3)); opened Alpharetta, GA and Sandy Springs, GA branches Repositioned Mt. Paran branch to Akers Mill, GA; added Marine Lending business 2021 2022 Completed $9 million common offering 2023 Opened Beaufort, SC branch; completed $12 million common offering 2024 Joined NYSE on July 2, 2025 with Initial Public Offering of $50.3 million, including underwriters' options 2025 2026 Expanded into Charleston, SC with addition of commercial banking team
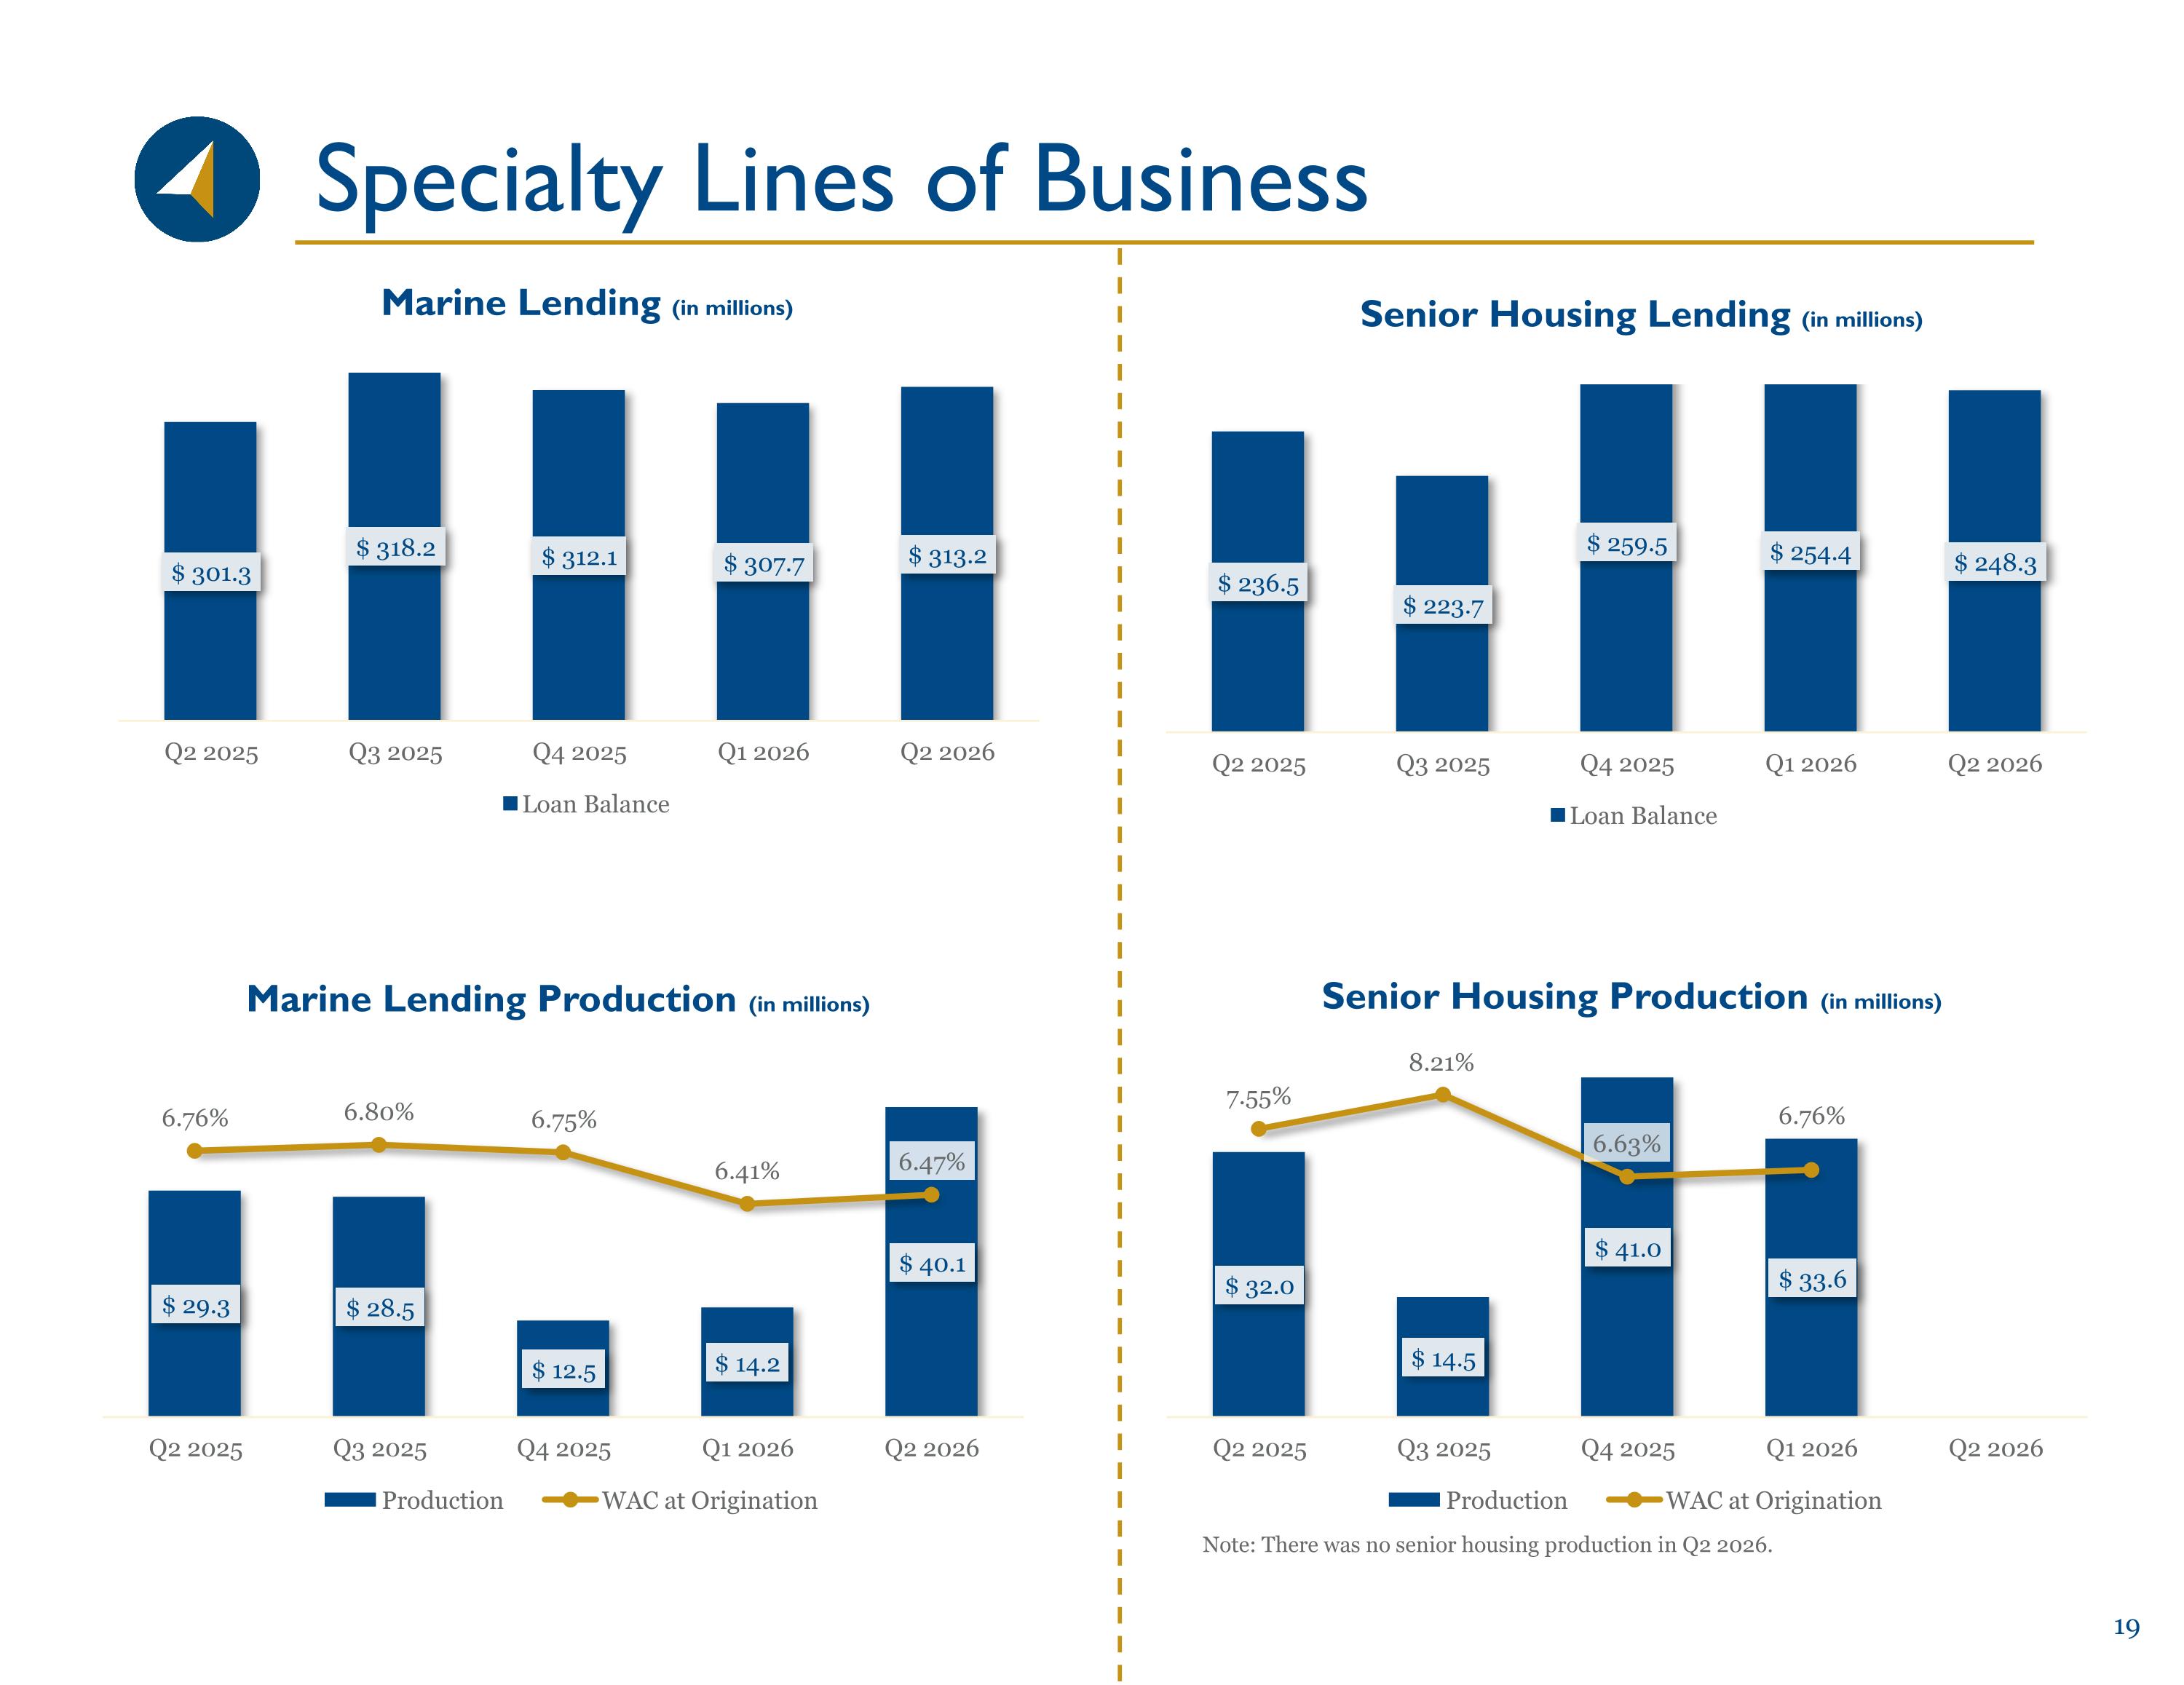
Specialty Lines of Business Note: There was no senior housing production in Q2 2026.
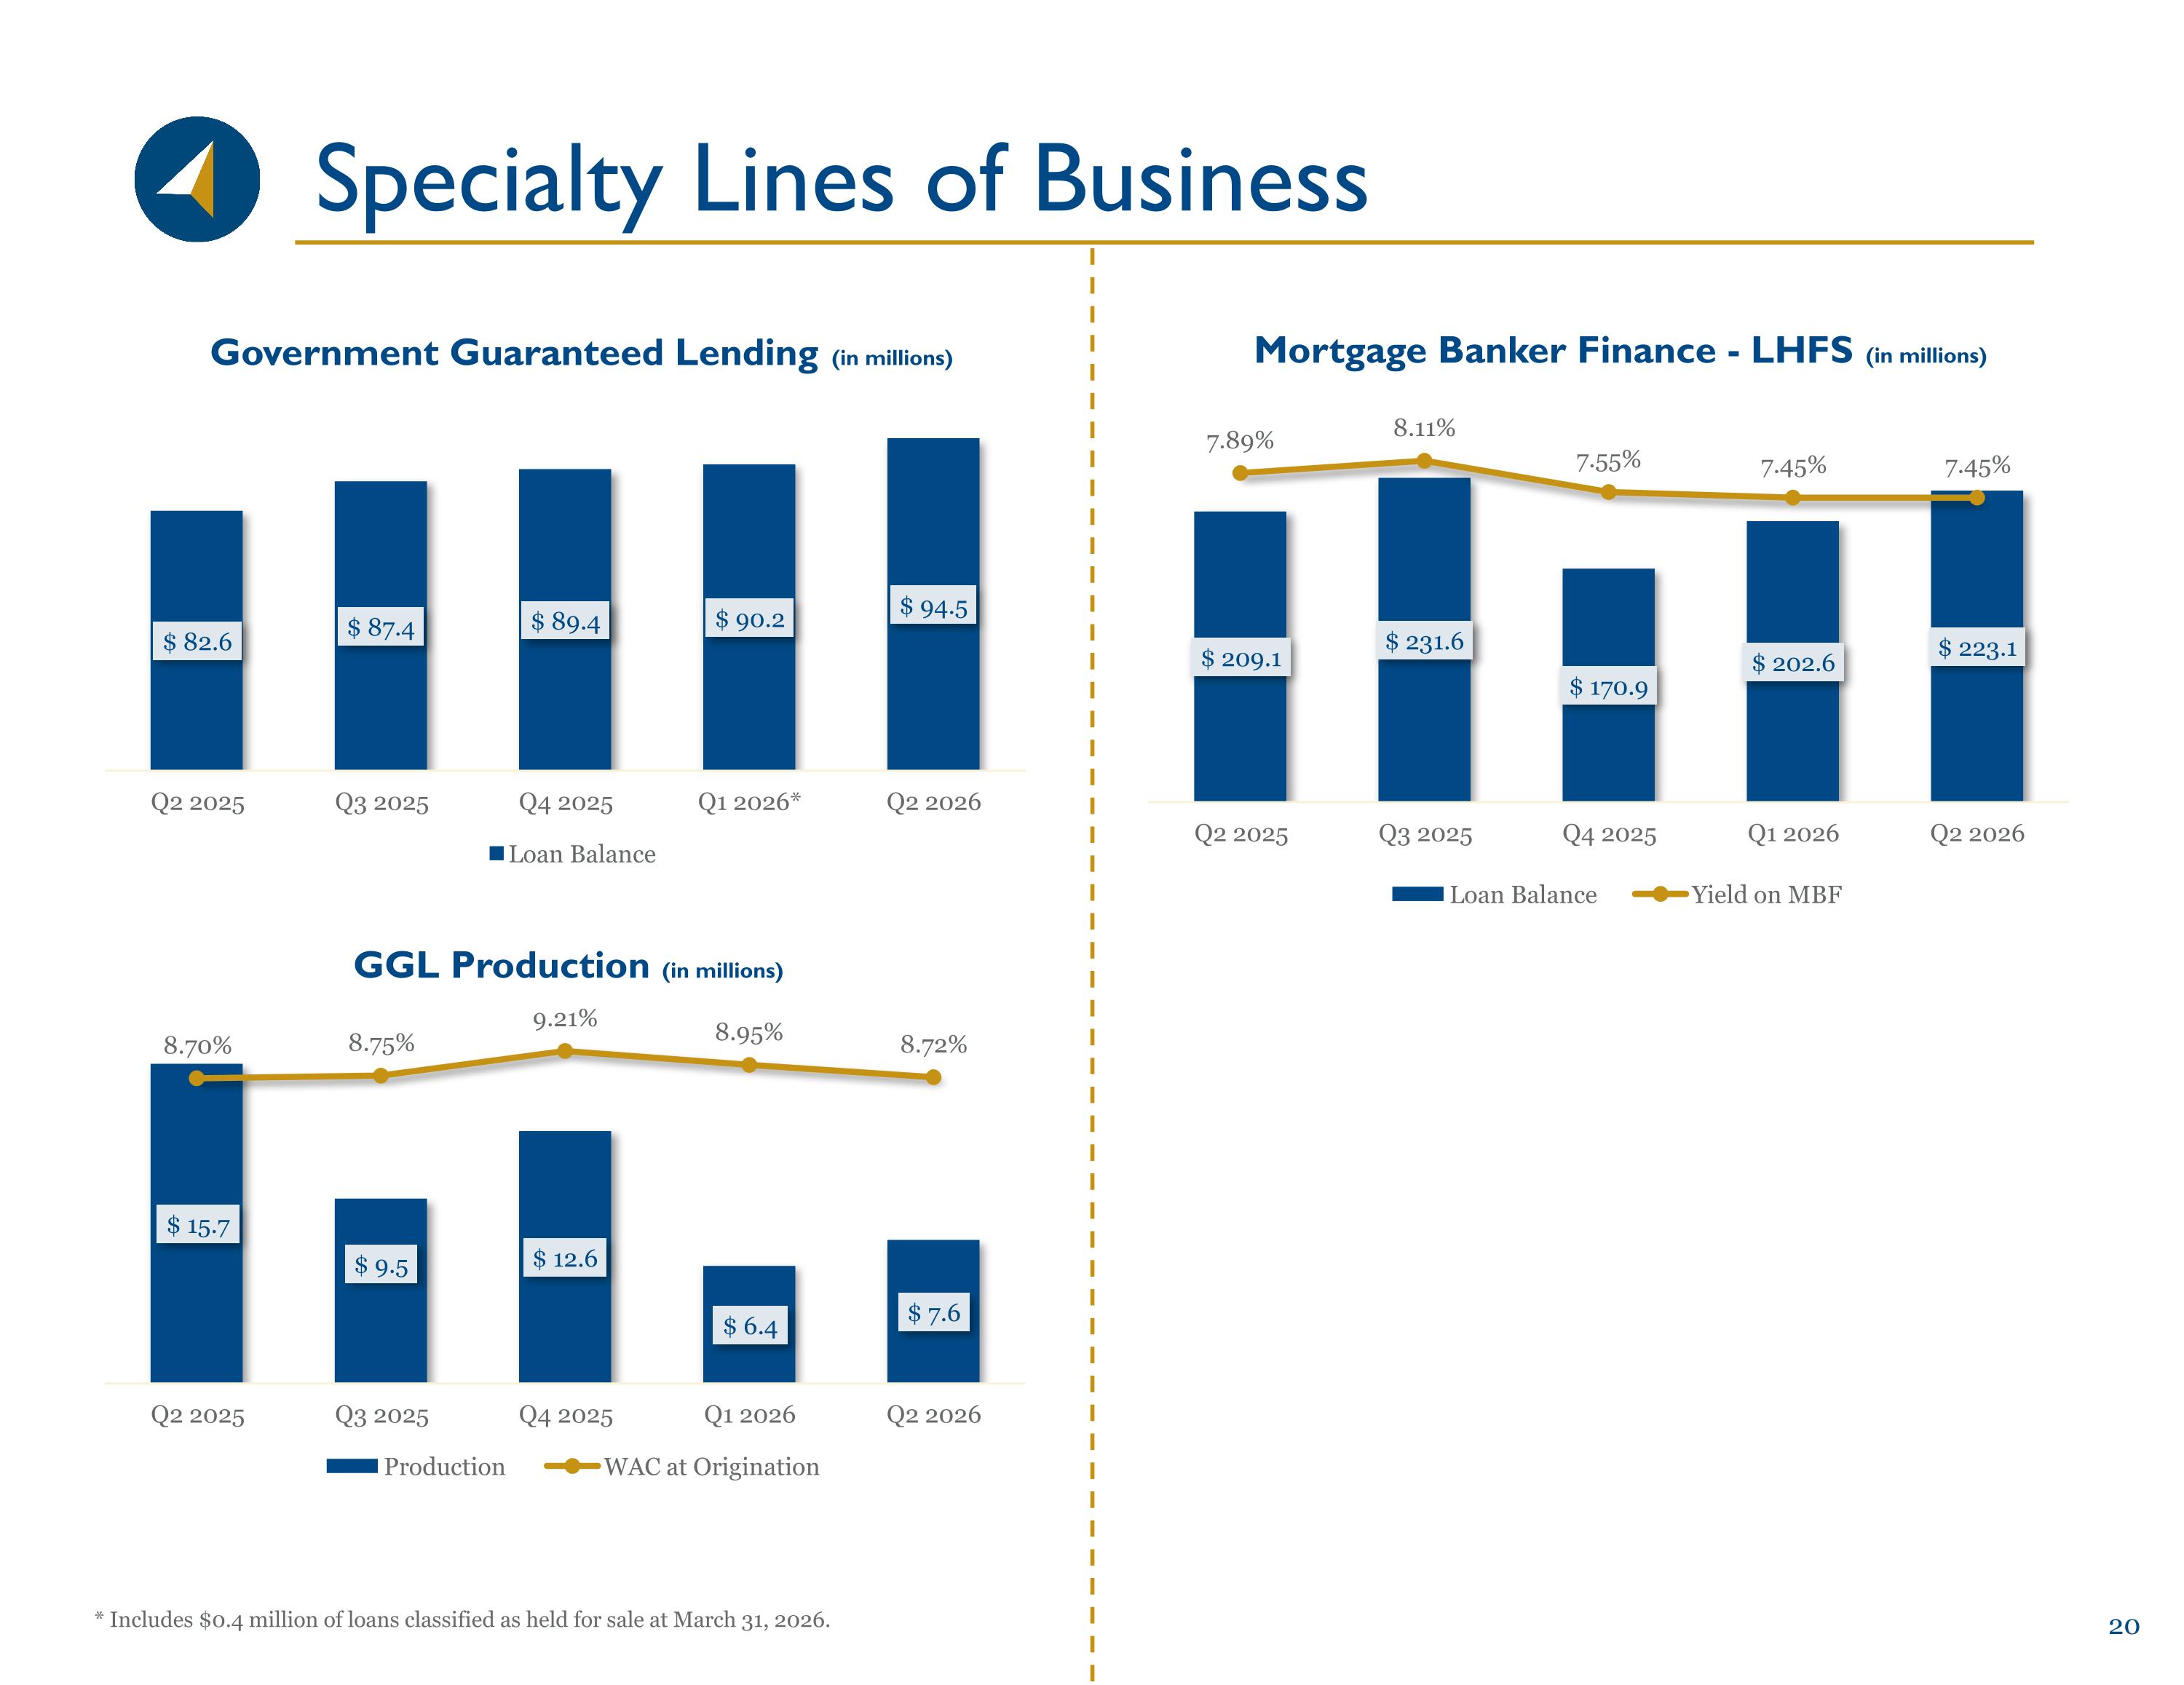
Specialty Lines of Business * Includes $0.4 million of loans classified as held for sale at March 31, 2026.
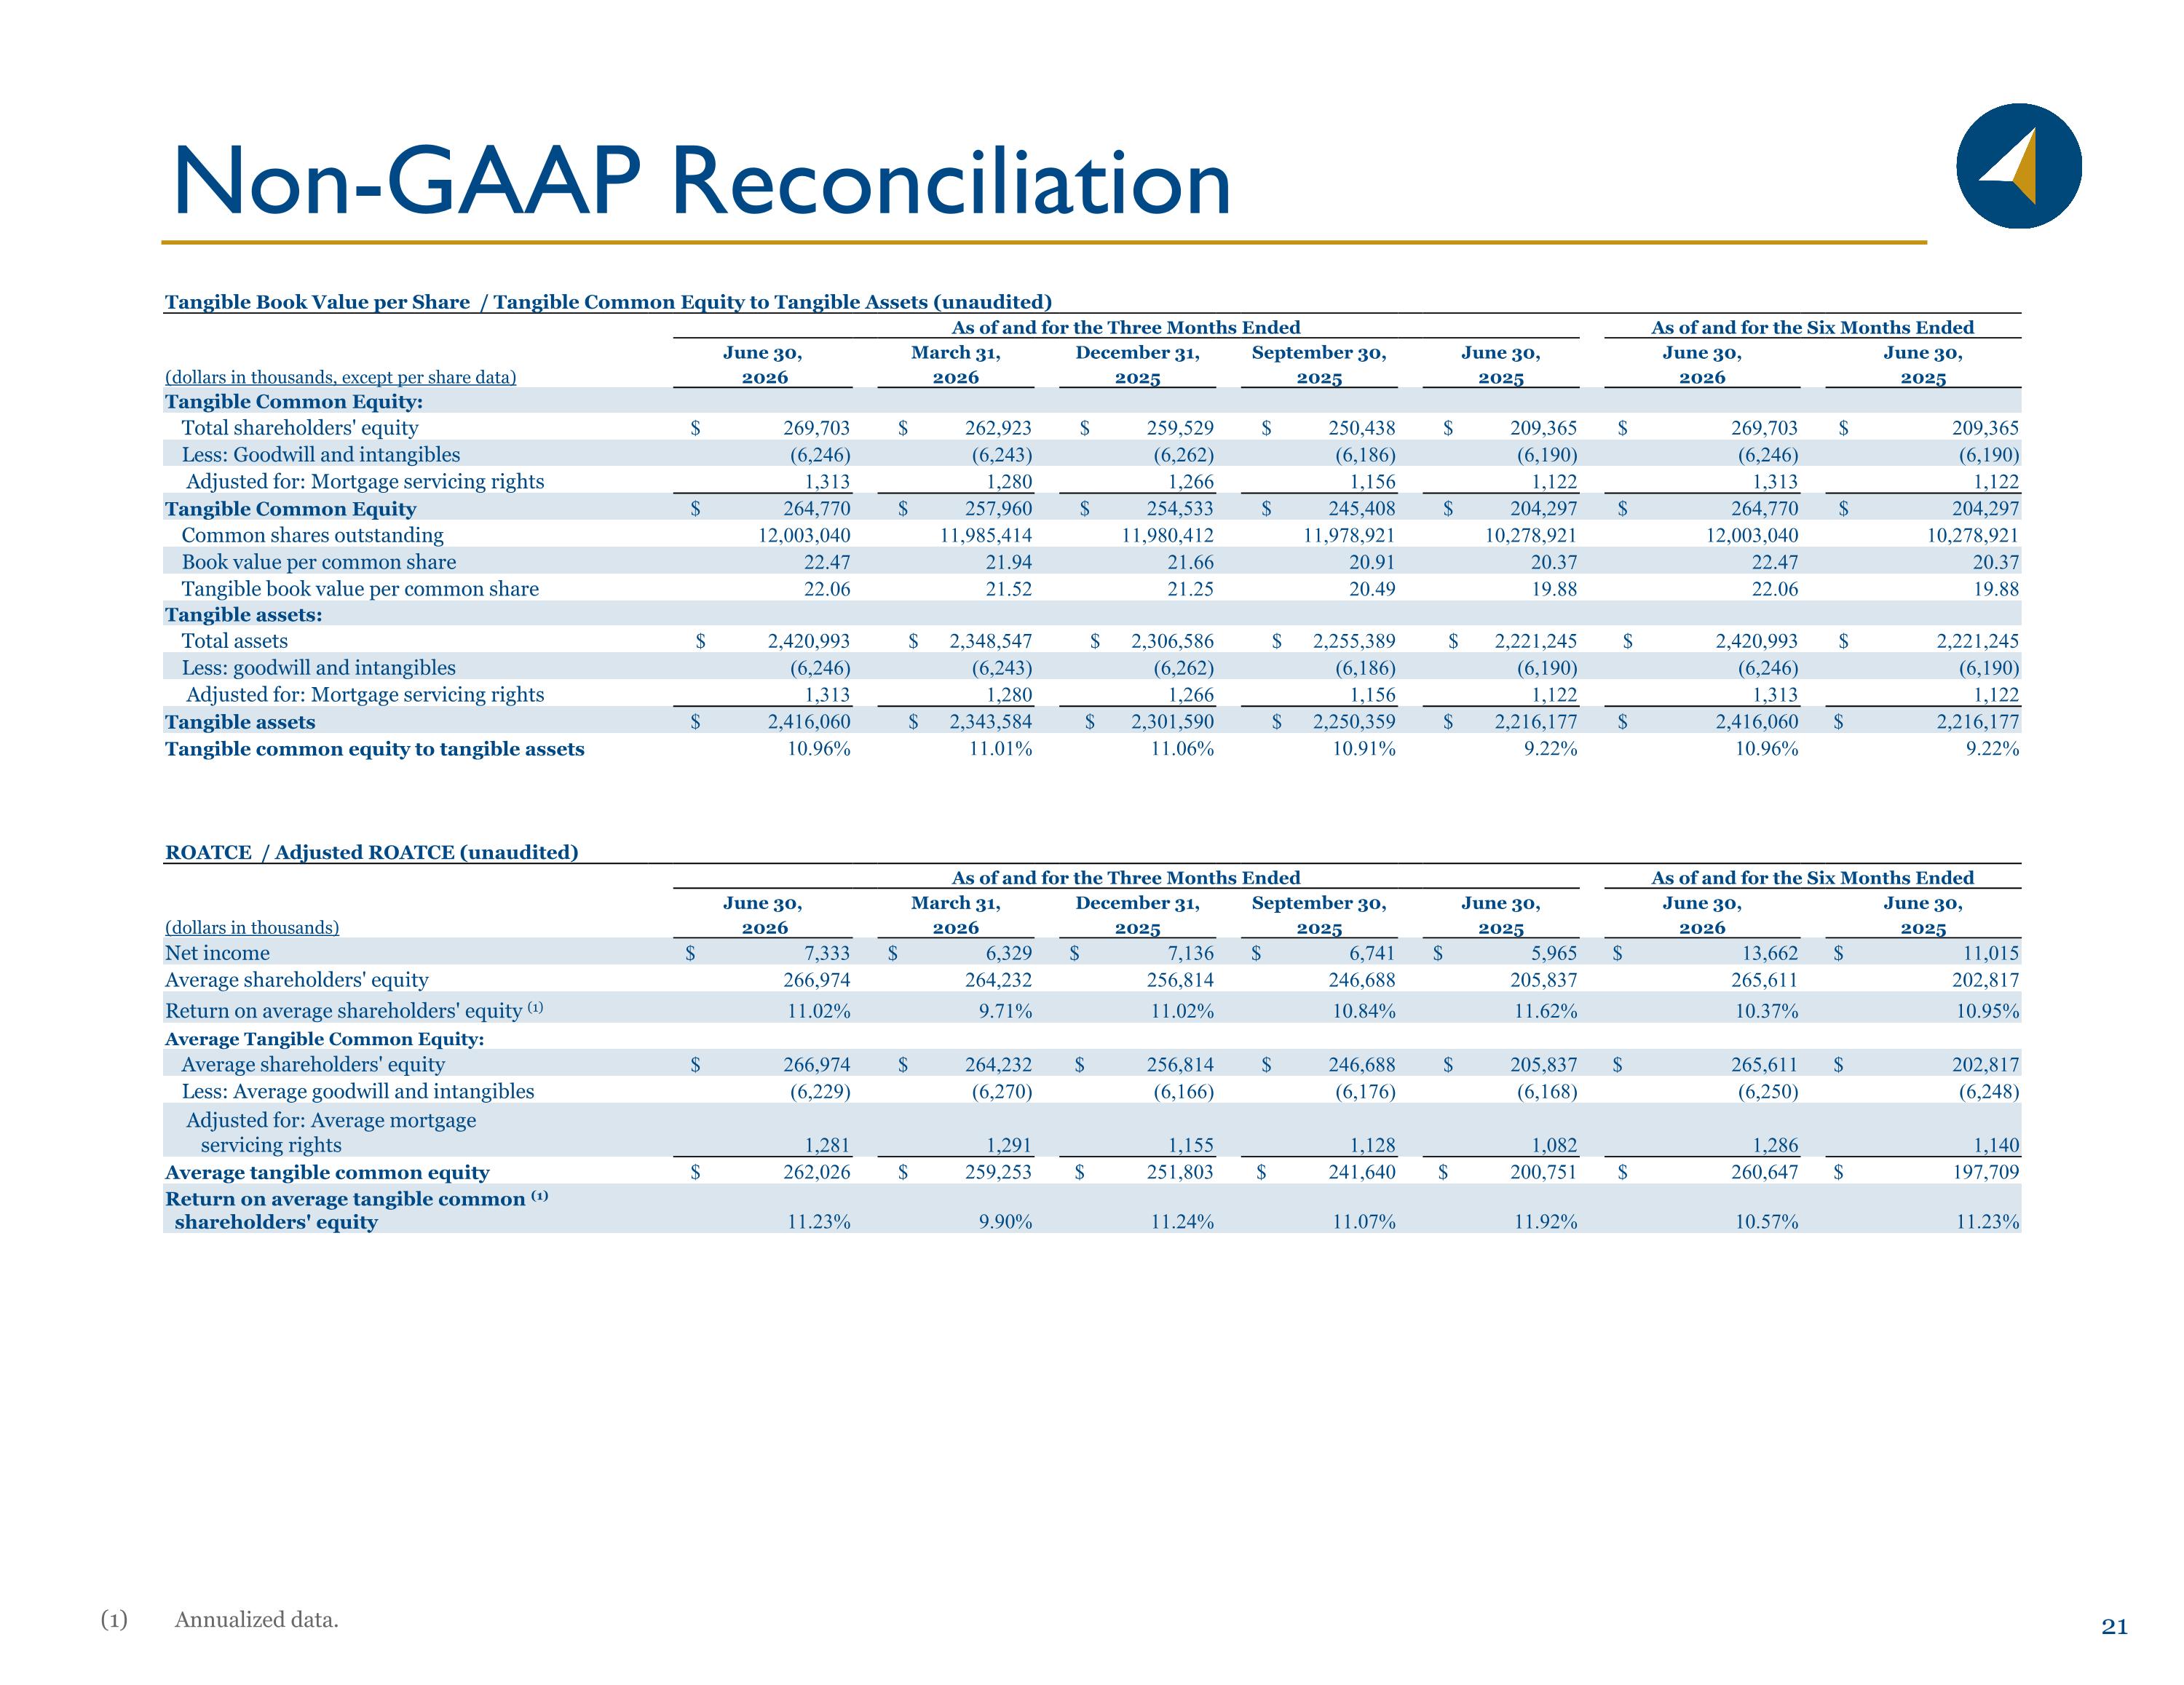
Non-GAAP Reconciliation Annualized data. Tangible Book Value per Share / Tangible Common Equity to Tangible Assets (unaudited) As of and for the Three Months Ended As of and for the Six Months Ended June 30, March 31, December 31, September 30, June 30, June 30, June 30, (dollars in thousands, except per share data) 2026 2026 2025 2025 2025 2026 2025 Tangible Common Equity: Total shareholders' equity $ 269,703 $ 262,923 $ 259,529 $ 250,438 $ 209,365 $ 269,703 $ 209,365 Less: Goodwill and intangibles (6,246) (6,243) (6,262) (6,186) (6,190) (6,246) (6,190) Adjusted for: Mortgage servicing rights 1,313 1,280 1,266 1,156 1,122 1,313 1,122 Tangible Common Equity $ 264,770 $ 257,960 $ 254,533 $ 245,408 $ 204,297 $ 264,770 $ 204,297 Common shares outstanding 12,003,040 11,985,414 11,980,412 11,978,921 10,278,921 12,003,040 10,278,921 Book value per common share 22.47 21.94 21.66 20.91 20.37 22.47 20.37 Tangible book value per common share 22.06 21.52 21.25 20.49 19.88 22.06 19.88 Tangible assets: Total assets $ 2,420,993 $ 2,348,547 $ 2,306,586 $ 2,255,389 $ 2,221,245 $ 2,420,993 $ 2,221,245 Less: goodwill and intangibles (6,246) (6,243) (6,262) (6,186) (6,190) (6,246) (6,190) Adjusted for: Mortgage servicing rights 1,313 1,280 1,266 1,156 1,122 1,313 1,122 Tangible assets $ 2,416,060 $ 2,343,584 $ 2,301,590 $ 2,250,359 $ 2,216,177 $ 2,416,060 $ 2,216,177 Tangible common equity to tangible assets 10.96% 11.01% 11.06% 10.91% 9.22% 10.96% 9.22% ROATCE / Adjusted ROATCE (unaudited) As of and for the Three Months Ended As of and for the Six Months Ended June 30, March 31, December 31, September 30, June 30, June 30, June 30, (dollars in thousands) 2026 2026 2025 2025 2025 2026 2025 Net income $ 7,333 $ 6,329 $ 7,136 $ 6,741 $ 5,965 $ 13,662 $ 11,015 Average shareholders' equity 266,974 264,232 256,814 246,688 205,837 265,611 202,817 Return on average shareholders' equity (1) 11.02% 9.71% 11.02% 10.84% 11.62% 10.37% 10.95% Average Tangible Common Equity: Average shareholders' equity $ 266,974 $ 264,232 $ 256,814 $ 246,688 $ 205,837 $ 265,611 $ 202,817 Less: Average goodwill and intangibles (6,229) (6,270) (6,166) (6,176) (6,168) (6,250) (6,248) Adjusted for: Average mortgage servicing rights 1,281 1,291 1,155 1,128 1,082 1,286 1,140 Average tangible common equity $ 262,026 $ 259,253 $ 251,803 $ 241,640 $ 200,751 $ 260,647 $ 197,709 Return on average tangible common (1) shareholders' equity 11.23% 9.90% 11.24% 11.07% 11.92% 10.57% 11.23%
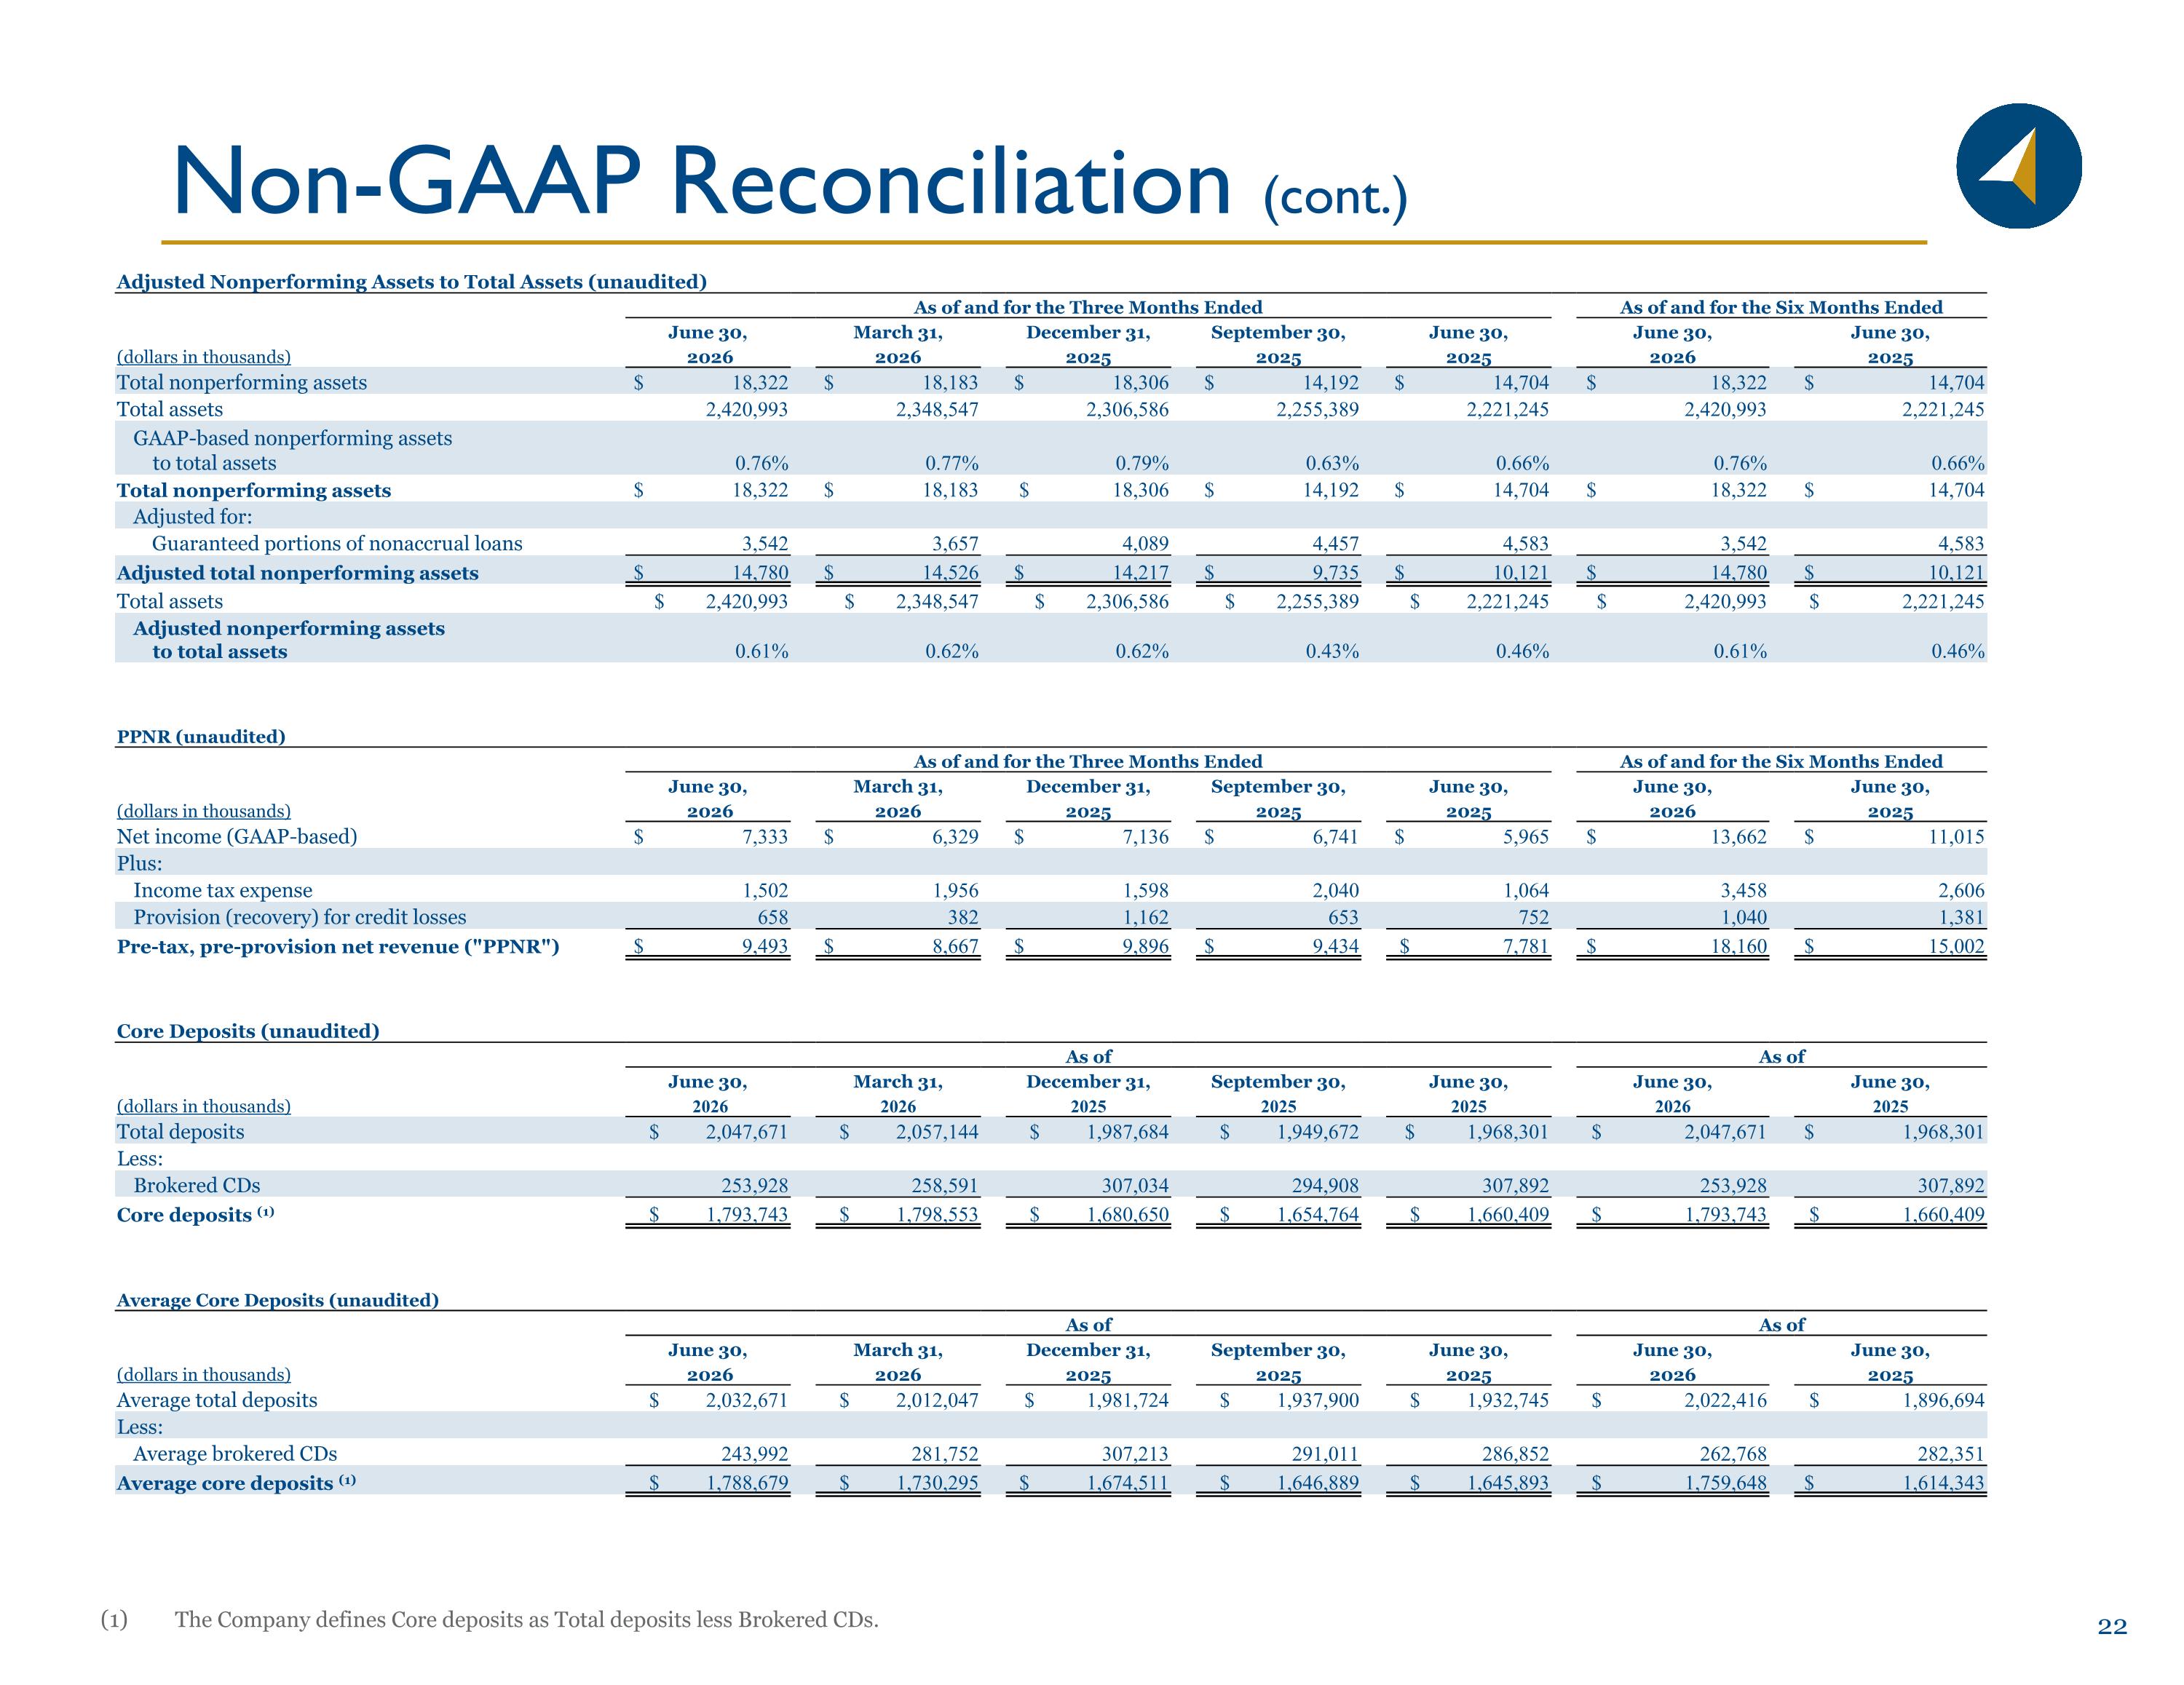
Non-GAAP Reconciliation (cont.) The Company defines Core deposits as Total deposits less Brokered CDs. Adjusted Nonperforming Assets to Total Assets (unaudited) As of and for the Three Months Ended As of and for the Six Months Ended June 30, March 31, December 31, September 30, June 30, June 30, June 30, (dollars in thousands) 2026 2026 2025 2025 2025 2026 2025 Total nonperforming assets $ 18,322 $ 18,183 $ 18,306 $ 14,192 $ 14,704 $ 18,322 $ 14,704 Total assets 2,420,993 2,348,547 2,306,586 2,255,389 2,221,245 2,420,993 2,221,245 GAAP-based nonperforming assets to total assets 0.76% 0.77% 0.79% 0.63% 0.66% 0.76% 0.66% Total nonperforming assets $ 18,322 $ 18,183 $ 18,306 $ 14,192 $ 14,704 $ 18,322 $ 14,704 Adjusted for: Guaranteed portions of nonaccrual loans 3,542 3,657 4,089 4,457 4,583 3,542 4,583 Adjusted total nonperforming assets $ 14,780 $ 14,526 $ 14,217 $ 9,735 $ 10,121 $ 14,780 $ 10,121 Total assets $ 2,420,993 $ 2,348,547 $ 2,306,586 $ 2,255,389 $ 2,221,245 $ 2,420,993 $ 2,221,245 Adjusted nonperforming assets to total assets 0.61% 0.62% 0.62% 0.43% 0.46% 0.61% 0.46% PPNR (unaudited) As of and for the Three Months Ended As of and for the Six Months Ended June 30, March 31, December 31, September 30, June 30, June 30, June 30, (dollars in thousands) 2026 2026 2025 2025 2025 2026 2025 Net income (GAAP-based) $ 7,333 $ 6,329 $ 7,136 $ 6,741 $ 5,965 $ 13,662 $ 11,015 Plus: Income tax expense 1,502 1,956 1,598 2,040 1,064 3,458 2,606 Provision (recovery) for credit losses 658 382 1,162 653 752 1,040 1,381 Pre-tax, pre-provision net revenue ("PPNR") $ 9,493 $ 8,667 $ 9,896 $ 9,434 $ 7,781 $ 18,160 $ 15,002 Core Deposits (unaudited) As of As of June 30, March 31, December 31, September 30, June 30, June 30, June 30, (dollars in thousands) 2026 2026 2025 2025 2025 2026 2025 Total deposits $ 2,047,671 $ 2,057,144 $ 1,987,684 $ 1,949,672 $ 1,968,301 $ 2,047,671 $ 1,968,301 Less: Brokered CDs 253,928 258,591 307,034 294,908 307,892 253,928 307,892 Core deposits (1) $ 1,793,743 $ 1,798,553 $ 1,680,650 $ 1,654,764 $ 1,660,409 $ 1,793,743 $ 1,660,409 Average Core Deposits (unaudited) As of As of June 30, March 31, December 31, September 30, June 30, June 30, June 30, (dollars in thousands) 2026 2026 2025 2025 2025 2026 2025 Average total deposits $ 2,032,671 $ 2,012,047 $ 1,981,724 $ 1,937,900 $ 1,932,745 $ 2,022,416 $ 1,896,694 Less: Average brokered CDs 243,992 281,752 307,213 291,011 286,852 262,768 282,351 Average core deposits (1) $ 1,788,679 $ 1,730,295 $ 1,674,511 $ 1,646,889 $ 1,645,893 $ 1,759,648 $ 1,614,343