
Exhibit 99.67
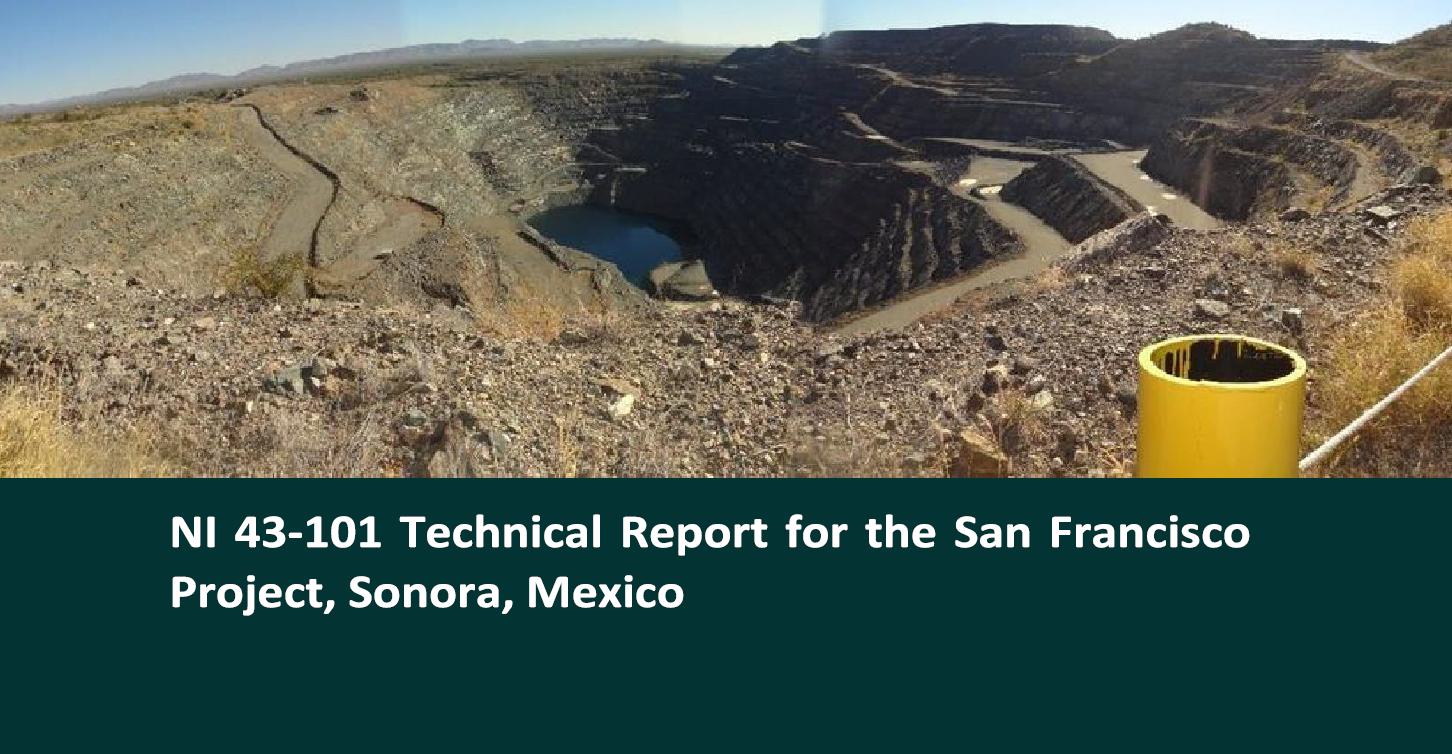
Effective Date: April 30, 2026
Report Date: May 1, 2026
Prepared By:
William J. Lewis, B.Sc., P.Geo.
Richard M. Gowans, P.Eng.
Tudorel Ciuculescu, B.Sc., M.Sc., P. Geo.
 |
Goldgroup Mining Inc. Suite 410 1111 Melville Street Vancouver, B.C. V6E 3V6 Canada |
501 – 212 King Street West, Toronto, Ontario, Canada M5H 1K5
+1 416 362 5135 | www.micon-international.com
 | Page |
Table of Contents
| 1 | SUMMARY | 1 |
| 1.1 | INTRODUCTION | 1 |
| 1.2 | PROPERTY DESCRIPTION, LOCATION AND OWNERSHIP | 2 |
| 1.2.1 | Goldgroup Acquisition | 2 |
| 1.2.2 | Mexican Mining Law | 3 |
| 1.3 | ACCESSIBILITY, CLIMATE, PHYSIOGRAPHY, LOCAL RESOURCES AND INFRASTRUCTURE | 4 |
| 1.4 | HISTORY | 4 |
| 1.5 | GEOLOGICAL SETTING AND MINERALIZATION | 6 |
| 1.6 | EXPLORATION AND DRILLING PROGRAMS | 6 |
| 1.7 | METALLURGICAL TESTWORK | 6 |
| 1.8 | 2026 MINERAL RESOURCE ESTIMATE | 7 |
| 1.8.1 | General Information | 7 |
| 1.8.2 | Database | 7 |
| 1.8.3 | Capping | 7 |
| 1.8.4 | Compositing | 8 |
| 1.8.5 | Specific Gravity | 8 |
| 1.8.6 | Grade Interpolation | 8 |
| 1.8.7 | Classification | 8 |
| 1.8.8 | Resource Pit Optimization and Economic Parameters | 9 |
| 1.8.9 | April 30, 2026 Mineral Resource Estimate Statement | 11 |
| 1.9 | SAN FRANCISCO PROJECT POTENTIAL MINERALIZATION TARGET | 12 |
| 1.10 | CONCLUSIONS AND RECOMMENDATIONS | 13 |
| 1.10.1 | Conclusions | 13 |
| 1.10.2 | Risks and Opportunities | 13 |
| 1.10.3 | Exploration Budget | 14 |
| 1.10.4 | Further Recommendations | 15 |
| 2 | INTRODUCTION | 17 |
| 2.1 | TERMS OF REFERENCE | 17 |
| 2.2 | DISCUSSIONS, MEETINGS, SITE VISITS AND QUALIFIED PERSONS | 18 |
| 2.3 | SOURCES OF INFORMATION | 19 |
| 2.4 | UNITS OF MEASUREMENTS AND ABBREVIATIONS | 19 |
| 3 | RELIANCE ON OTHER EXPERTS | 21 |
| 3.1 | GENERAL DISCUSSION | 21 |
| 4 | PROPERTY DESCRIPTION AND LOCATION | 22 |
| 4.1 | GENERAL | 22 |
| 4.2 | OWNERSHIP AND PROPERTY DESCRIPTION | 23 |
| 4.2.1 | Goldgroup Ownership Information | 23 |
| 4.2.2 | Goldgroup Description of Acquisition Terms of Molimentales | 28 |
| 4.3 | MEXICAN MINING LAW | 29 |
| 4.4 | PERMITTING AND ENVIRONMENTAL | 30 |
| 4.5 | MICON’S QP COMMENTS | 30 |
| San Francisco Project | i | May 1, 2026 |
| Page |
| 5 | ACCESSIBILITY, CLIMATE, LOCAL RESOURCES, INFRASTRUCTURE AND PHYSIOGRAPHY | 31 |
| 5.1 | ACCESSIBILITY | 31 |
| 5.2 | CLIMATE AND PHYSIOGRAPHY | 32 |
| 5.2.1 | Climate | 32 |
| 5.2.2 | Physiography | 32 |
| 5.3 | LOCAL RESOURCES AND INFRASTRUCTURE | 33 |
| 6 | HISTORY | 35 |
| 6.1 | SAN FRANCISCO PROPERTY AND GOLD MINE | 35 |
| 6.1.1 | General History of the San Francisco Property Prior to Timmins Gold Corp (Timmins) Ownership | 35 |
| 6.1.2 | Timmins Gold Corp (Timmins, later Alio Gold Inc. (Alio)) Incorporation and Ownership of the San Francisco Project | 37 |
| 6.1.3 | Magna Gold Corp. (Magna) Incorporation and Ownership of the San Francisco Project | 39 |
| 6.2 | HISTORICAL RESOURCE AND RESERVE ESTIMATES | 40 |
| 6.3 | HISTORICAL PRODUCTION FROM THE SAN FRANCISCO MINE | 40 |
| 6.3.1 | Historical Production | 40 |
| 7 | GEOLOGICAL SETTING AND MINERALIZATION | 45 |
| 7.1 | REGIONAL GEOLOGY | 45 |
| 7.2 | PROPERTY GEOLOGY | 47 |
| 7.2.1 | Geology of the La Chicharra Pit | 49 |
| 7.3 | MINERALIZATION | 50 |
| 7.4 | OTHER PROJECTS WITHIN THE SAN FRANCISCO PROPERTY | 52 |
| 7.4.1 | El Durazno Project | 52 |
| 7.4.2 | Vetatierra Project | 53 |
| 8 | DEPOSIT TYPES | 54 |
| 9 | EXPLORATION | 55 |
| 9.1 | GOLDGROUP EXPLORATION PROGRAM | 55 |
| 10 | DRILLING | 56 |
| 10.1 | GOLDGROUP DRILLING PROGRAM | 56 |
| 10.2 | 2022 MAGNA DRILLING PROGRAM | 56 |
| 10.2.1 | 2022 Drilling Results | 59 |
| 10.3 | MICON QP COMMENTS | 67 |
| 11 | SAMPLE PREPARATION, ANALYSES AND SECURITY | 69 |
| 11.1 | GOLDGROUP SAMPLE PREPARATION, ANALYSIS AND SECURITY | 69 |
| 11.2 | QUALITY ASSURANCE/QUALITY CONTROL PROGRAM UNTIL AUGUST, 2020 | 69 |
| 11.2.1 | Alio Sample Preparation, Analysis and Security Programs | 69 |
| 11.2.2 | Alio Sample Collection and Transportation | 72 |
| 11.2.3 | Alio General QA/QC Procedures | 74 |
| 11.2.4 | Preparation Laboratories | 77 |
| 11.3 | 2010 TO 2011, QA/QC PROGRAM RESULTS | 84 |
| San Francisco Project | ii | May 1, 2026 |
| Page |
| 11.3.1 | July 2010 to June 2011 QA/QC Program Results | 84 |
| 11.4 | JULY, 2011 TO JUNE, 2013, QA/QC PROGRAM RESULTS | 88 |
| 11.4.1 | Check Sampling | 88 |
| 11.4.2 | Standard Reference Material Samples | 89 |
| 11.4.3 | Blanks | 90 |
| 11.4.4 | Duplicates | 90 |
| 11.4.5 | General Comments Regarding the July, 2011 to June, 2013 QA/QC program | 91 |
| 11.5 | RESULTS OF THE JANUARY, 2014 TO DECEMBER, 2015, QA/QC PROGRAM | 91 |
| 11.5.1 | Screen Metallic Assaying | 91 |
| 11.6 | RESULTS OF THE AUGUST 2016 TO MARCH 2017 QA/QC PROGRAM | 94 |
| 11.6.1 | Standard Reference Material | 94 |
| 11.6.2 | Duplicates | 100 |
| 11.6.3 | Blank Samples | 101 |
| 11.7 | 2017 AND 2018 DRILLING PROGRAM QA/QC | 104 |
| 11.7.1 | August to December, 2017 Drilling Program QA/QC | 104 |
| 11.7.2 | 2018 Drilling Program QA/QC | 104 |
| 11.8 | MICON QP COMMENTS 2020 | 108 |
| 11.9 | MAGNA QA/QC PROGRAM AUGUST, 2020 TO OCTOBER, 2022 | 108 |
| 12 | DATA VERIFICATION | 115 |
| 12.1 | SITE VISIT | 115 |
| 12.2 | MICON QP VERIFICATION OF THE MINERAL RESOURCE ESTIMATE DATABASE | 115 |
| 12.3 | MICON QP COMMENTS | 117 |
| 13 | MINERAL PROCESSING AND METALLURGICAL TESTING | 118 |
| 13.1 | HISTORICAL METALLURGICAL TESTWORK (PRE-2012) | 119 |
| 13.2 | 2012 TESTWORK BY METCON | 119 |
| 13.3 | ON-SITE INTERNAL TESTWORK | 121 |
| 13.3.1 | Discussion of On-Site Column Leach Test Results | 121 |
| 13.4 | MICON QP COMMENTS AND CONCLUSIONS | 124 |
| 14 | MINERAL RESOURCE ESTIMATES | 125 |
| 14.1 | INTRODUCTION | 125 |
| 14.2 | CIM MINERAL RESOURCE DEFINITIONS AND CLASSIFICATIONS | 125 |
| 14.3 | CIM ESTIMATION OF MINERAL RESOURCES BEST PRACTICES GUIDELINES | 127 |
| 14.4 | APRIL 30, 2026 MINERAL RESOURCE ESTIMATE STATEMENT | 127 |
| 14.5 | MINERAL RESOURCE ESTIMATION PROCEDURES | 129 |
| 14.5.1 | Database | 129 |
| 14.5.2 | Capping | 129 |
| 14.5.3 | Compositing | 129 |
| 14.5.4 | Block Models | 132 |
| 14.5.5 | Mineralized Outlines | 133 |
| 14.5.6 | Block Model Rock Domains | 133 |
| 14.5.7 | Specific Gravity | 133 |
| 14.5.8 | Grade Interpolation | 134 |
| 14.5.9 | Mineral Resource Classification | 135 |
| 14.5.10 | Block Model Validation | 136 |
| San Francisco Project | iii | May 1, 2026 |
| Page |
| 14.5.11 | Resource Pit Optimization and Economic Parameters | 138 |
| 14.5.12 | Mineral Resource Statement | 140 |
| 14.6 | SAN FRANCISCO PROJECT SENSITIVITY ANALYSIS | 141 |
| 14.7 | SAN FRANCISCO PROJECT POTENTIAL RESOURCES | 146 |
| 15 | MINERAL RESERVE ESTIMATES | 147 |
| 16 | MINING METHODS | 147 |
| 17 | RECOVERY METHODS | 147 |
| 18 | PROJECT INFRASTRUCTURE | 147 |
| 19 | MARKET STUDIES AND CONTRACTS | 147 |
| 20 | ENVIRONMENTAL STUDIES, PERMITTING AND SOCIAL OR COMMUNITY IMPACT | 147 |
| 21 | CAPITAL AND OPERATING COSTS | 147 |
| 22 | ECONOMIC ANALYSIS | 147 |
| 23 | ADJACENT PROPERTIES | 148 |
| 24 | OTHER RELEVANT DATA AND INFORMATION | 149 |
| 24.1 | MINING METHODS | 149 |
| 24.1.1 | Mining Production to Date | 149 |
| 24.1.2 | Open Pit Mine Design | 149 |
| 24.1.3 | Waste Rock Management | 152 |
| 24.2 | OPEN PIT MINE OPERATIONS | 153 |
| 24.3 | UNDERGROUND OPERATIONS | 154 |
| 24.4 | RECOVERY METHODS | 154 |
| 24.4.1 | Processing Description | 154 |
| 24.5 | PROJECT INFRASTRUCTURE | 156 |
| 24.5.1 | Offices, Workshops and Stores | 156 |
| 24.5.2 | Electrical Power Supply | 156 |
| 24.5.3 | Water Supply | 157 |
| 24.6 | ENVIRONMENTAL STUDIES, PERMITTING AND SOCIAL OR COMMUNITY IMPACT | 158 |
| 24.6.1 | Environmental Conditions | 158 |
| 25 | INTERPRETATION AND CONCLUSIONS | 160 |
| 25.1 | OVERVIEW | 160 |
| 25.2 | 2026 MINERAL RESOURCE ESTIMATE | 160 |
| 25.2.1 | General Information | 160 |
| 25.2.2 | Database | 161 |
| 25.2.3 | Capping | 161 |
| 25.2.4 | Compositing | 161 |
| 25.2.5 | Specific Gravity | 161 |
| 25.2.6 | Grade Interpolation | 161 |
| San Francisco Project | iv | May 1, 2026 |
| Page |
| 25.2.7 | Classification | 162 |
| 25.2.8 | Resource Pit Optimization and Economic Parameters | 162 |
| 25.2.9 | April 30, 2026 Mineral Resource Estimate Statement | 164 |
| 25.3 | SAN FRANCISCO PROJECT POTENTIAL MINERALIZATION TARGET | 165 |
| 25.4 | CONCLUSIONS | 167 |
| 25.5 | RISKS AND OPPORTUNITIES AT THE SAN FRANCISCO PROJECT | 167 |
| 26 | RECOMMENDATIONS | 169 |
| 26.1 | EXPLORATION BUDGET | 169 |
| 26.2 | FURTHER RECOMMENDATIONS | 170 |
| 27 | REFERENCES | 171 |
| 27.1 | TECHNICAL REPORTS, PAPERS AND OTHER SOURCES | 171 |
| 27.2 | INTERNET SOURCES | 177 |
| 28 | DATE AND SIGNATURE PAGE | 178 |
| 29 | CERTIFICATES OF AUTHORS (QUALIFIED PERSONS) | 179 |
APPENDICES
| APPENDIX 1: GLOSSARY OF MINING TERMS | End of report |
| San Francisco Project | v | May 1, 2026 |
| Page |
List of Tables
| Table 1.1 Pit Optimization Parameters* for the April 30, 2026, Mineral Resource Estimate for the San Francisco and La Chicharra Deposits | 9 |
| Table 1.2 Pit Optimization Parameters for the April 30, 2026, Mineral Resource Estimate for the North Pit Deposit | 10 |
| Table 1.3 Mineral Resource Estimate for the San Francisco Project as of April 30, 2026 | 11 |
| Table 1.4 Summary of the Estimated Range for the Potential Mineralization in the El Llano Exploration Target Area | 12 |
| Table 1.5 Risks and Opportunities at the San Francisco Project | 13 |
| Table 1.6 Estimated Budget for the 2026 Infill and Exploration Drilling Program at the San Francisco Mine | 14 |
| Table 2.1 Micon’s Qualified Persons, Areas of Responsibility and Site Visits | 18 |
| Table 2.2 Units and Abbreviations | 20 |
| Table 4.1 San Francisco Project, Summary of Mineral Concessions (with Fees for 2026 noted) | 24 |
| Table 4.2 San Francisco Project, Summary of the Regional Mineral Concessions (with Fees for 2026 Noted) | 25 |
| Table 6.1 San Francisco Project, Geomaque Annual Production 1996 to 2002 | 41 |
| Table 6.2 San Francisco Project, Timmins/Alio Annual Production from April, 2010 to the End of December, 2019 (by Quarter) | 41 |
| Table 6.3 San Francisco Project, Timmins/Alio Annual Ore Stockpiled and Processed from April, 2010 to the End of December, 2019 (by Quarter) | 43 |
| Table 6.4 San Francisco Project, Magna’s Annual Production from 2020 to June, 2023 | 44 |
| Table 10.1 Collar Locations for the First Quarter 2022 North Mineralized Zone Drill Holes at the San Francisco Mine | 57 |
| Table 10.2 Collar Locations for the First Quarter 2022 Phase 8 (Conglomerate) Drill Holes at the San Francisco Mine | 58 |
| Table 10.3 Summary Significant Results for the Drilling on the North Mineralized Zone at the San Francisco Project | 60 |
| Table 10.4 Summary Significant Results for the Drilling on the Phase 8 North-Northeast Extension (Conglomerate) at the San Francisco Project | 65 |
| San Francisco Project | vi | May 1, 2026 |
| Page |
| Table 11.1 Standard Reference Material Samples used During the Drilling Programs | 76 |
| Table 11.2 ALS Method Code and Description for Alio Sample Preparation | 82 |
| Table 11.3 ALS Method Code and Description for Alio Sample Preparation | 82 |
| Table 11.4 Summary of the Au-AA23 and Au-AA24 Fire Assay Fusion, AAS Finish Assay Details | 83 |
| Table 11.5 Summary of the ALS Ag-GRA21, Ag-GRA22, Au-GRA21 and Au GRA22 Precious Metals Gravimetric Analysis Methods | 84 |
| Table 11.6 Comparison of the Original Assays with the ALS-Chemex Check Assays, 2010 to 2011 Drilling Program | 84 |
| Table 11.7 Summary of Inspectorate Assaying versus the Standard Reference Material | 86 |
| Table 11.8 San Francisco Gold Project, Summary of Blank Assay Data for the 2010 to 2011 Drill Program | 86 |
| Table 11.9 Summary of Results for the Duplicate Samples, July, 2010 to June, 2011 Drill Program | 87 |
| Table 11.10 Comparison of the Original Assays with the ALS-Chemex, Inspectorate and SGS Check Assays, 2011 to 2013 Drill Program | 88 |
| Table 11.11 Summary of SRMs Used to Check Inspectorate, ALS and Skyline Assaying | 89 |
| Table 11.12 San Francisco Gold Project, Summary of Blank Assay Data for the 2011 to 2013 Drill Program | 90 |
| Table 11.13 Summary of Results for the Duplicate Samples, July, 2011 to June, 2013 Drill Program | 91 |
| Table 11.14 Summary of Standard Material Reference Samples Used at Check Inspectorate and ALS Minerals | 95 |
| Table 11.15 Summary of the Analysis Information for Standard Reference Sample OXC-145 | 104 |
| Table 11.16 Summary of the Analysis Information for Standard Reference Sample OXD-144 | 105 |
| Table 11.17 Summary of the Analysis Information for Standard Reference Sample OXG-124 | 106 |
| Table 13.1 Summary of Results from the PRA Column Leach Tests | 119 |
| Table 13.2 Summary of Column Leach Test Results, Crush Size P80 9.5 mm, 127 Days Leach Time | 120 |
| Table 13.3 Summary of Column Leach Test Results, Crush Size P80 6.3 mm, 127 Days Leach Time | 120 |
| Table 13.4 Summary of Alio’s 2015 Internal Metallurgical Testwork Results | 122 |
| Table 13.5 Summary of Alio’s 2017 Internal Metallurgical Testwork | 123 |
| San Francisco Project | vii | May 1, 2026 |
| Page |
| Table 14.1 Mineral Resource Estimate for the San Francisco Project as of April 30, 2026 | 127 |
| Table 14.2 Applied Grade Capping on 3 m Composites for the San Francisco Resource Model by Rock Type | 131 |
| Table 14.3 Applied Grade Capping on 3 m Composites for the La Chicharra Resource Model by Resource Area | 131 |
| Table 14.4 3-D Block Model Limits and Dimensions | 132 |
| Table 14.5 Rock Domain Code and Specific Gravity for the San Francisco and La Chicharra Pit | 133 |
| Table 14.6 Applied Search Parameters for Ordinary Kriging Grade Interpolation for the San Francisco Pit | 134 |
| Table 14.7 Applied Search Parameters for Ordinary Kriging Grade Interpolation for the La Chicharra Pit | 135 |
| Table 14.8 San Francisco and La Chicharra 3 m Composites vs. Block Model Averages | 136 |
| Table 14.9 Pit Optimization Parameters* for the updated April 30, 2026 Mineral Resource Estimate for the San Francisco and La Chicharra Deposits | 139 |
| Table 14.10 Pit Optimization Parameters for the April 30, 2026 Mineral Resource Estimate for the North Pit Deposit | 140 |
| Table 14.11 Sensitivity Analysis Tabulation for the San Francisco Pit | 141 |
| Table 14.12 Sensitivity Analysis Tabulation for the La Chicharra Pit | 142 |
| Table 14.13 Sensitivity Analysis Tabulation for the North Pit | 142 |
| Table 14.14 Sensitivity Analysis Tabulation for the San Francisco All Pits Combined | 143 |
| Table 14.15 Summary of the Estimated Range for the Potential Mineralization in the El Llano Exploration Target Area | 146 |
| Table 24.1 Summary of the Leach Pad Phases Based Upon the Permits Acquired for the San Francisco Mine | 155 |
| Table 24.2 Summary of the Installed Transformer Capacity | 157 |
| Table 25.1 Pit Optimization Parameters* for the April 30, 2026, Mineral Resource Estimate for the San Francisco and La Chicharra Deposits | 163 |
| Table 25.2 Pit Optimization Parameters for the April 30, 2026 Mineral Resource Estimate for the North Pit Deposit | 164 |
| Table 25.3 Mineral Resource Estimate for the San Francisco Project as of April 30, 2026 | 164 |
| San Francisco Project | viii | May 1, 2026 |
| Page |
| Table 25.4 Summary of the Estimated Range for the Potential Mineralization in the El Llano Exploration Target Area | 166 |
| Table 25.5 Risks and Opportunities at the San Francisco Project | 167 |
| Table 26.1 Estimated Budget for the 2026 Infill and Exploration Drilling Program at the San Francisco Mine | 169 |
| San Francisco Project | ix | May 1, 2026 |
| Page |
| List of Figures | |
| Figure 4.1 San Francisco Project Location Map | 22 |
| Figure 4.2 San Francisco Property (Concessions) Map | 26 |
| Figure 4.3 San Francisco Project Regional Mineral Concessions Map | 27 |
| Figure 5.1 San Francisco Mine as Viewed from Highway 15 Driving South from Santa An | 31 |
| Figure 5.2 View of the Sonora Desert Surrounding the Property | 32 |
| Figure 5.3 View of a Water Well Located on the San Francisco Project | 33 |
| Figure 5.4 San Francisco Pit, December, 2025 | 34 |
| Figure 5.5 La Chicharra Pit, December, 2025 | 34 |
| Figure 6.1 Location of One of the Rotary Drill Sites Located to Southeast of the Main Pit | 35 |
| Figure 6.2 View of the San Francisco Gold Mine with Estación Llano in the Background (Looking Northeast) | 36 |
| Figure 6.3 Extraction of Gravel from the Original Leach Pads for Construction Use | 38 |
| Figure 7.1 Regional Geology of the San Francisco Project | 46 |
| Figure 7.2 San Francisco and La Chicharra Minesite Geology Map | 48 |
| Figure 7.3 La Chicharra Pit Looking Southeast showing the Lineament (Pit in 2005) | 50 |
| Figure 10.1 Map of the 2022 Drilling in the Area to the North of the San Francisco Pit | 56 |
| Figure 10.2 Cross-Section of the San Francisco Pit showing some of the 2022 Drilling Results | 60 |
| Figure 11.1 Specimen Trays for Drill Hole TF-1566 | 70 |
| Figure 11.2 Reverse Circulation Sample Collection | 72 |
| Figure 11.3 Fragment of Basalt used for Blank Sample | 75 |
| Figure 11.4 Blank Sample Bag ready to be Inserted into the Sample Sequence | 76 |
| Figure 11.5 Oven for Drying Samples in the Preparation Facilities | 79 |
| Figure 11.6 Combo Boyd/RSD Boyd Crusher with Single Split | 80 |
| Figure 11.7 Drill Hole VT14-005 Showing a Location with Visible Gold in the Core | 92 |
| San Francisco Project | x | May 1, 2026 |
| Page |
| Figure 11.8 Summary and Graph Showing the Assays Results for the Five Samples | 93 |
| Figure 11.9 Summary and Graph Showing the Gold Variation in the Five Pairs of Samples Rejects vs Field Duplicates | 93 |
| Figure 11.10 Summary and Graph Showing the Gold Variation in the Samples Screen Metallics vs Fire Assays | 94 |
| Figure 11.11 Precision Plot – Gold in Reference Standard CDN-GS-2M for the San Francisco Pit In-Fill Drilling | 95 |
| Figure 11.12 Precision Plot – Gold in Reference Standard OXH-97 for the San Francisco Pit In-Fill Drilling | 96 |
| Figure 11.13 Precision Plot – Gold in Reference Standard CDN-GS-P7H for the San Francisco Pit In-Fill Drilling | 96 |
| Figure 11.14 Precision Plot – Gold in Reference Standard OXC-109 for the San Francisco Pit In-Fill Drilling | 97 |
| Figure 11.15 Precision Plot – Gold in Reference Standard OXE-101 for the San Francisco Pit In-Fill Drilling | 97 |
| Figure 11.16 Precision Plot – Gold in Reference Standard OXF-105 for the San Francisco Pit In-Fill Drilling | 98 |
| Figure 11.17 Precision Plot – Gold in Reference Standard OXJ-95 for the San Francisco Pit In-Fill Drilling | 98 |
| Figure 11.18 Precision Plot – Gold in Reference Standard OXC-109 for the N and NW La Chicharra Drilling | 99 |
| Figure 11.19 Precision Plot – Gold in Reference Standard CDN-GS-7PH for the N and NW La Chicharra Drilling | 99 |
| Figure 11.20 Results for the Duplicate Samples Plotted as a Relative Error Diagram for the San Francisco Pit, August, 2016 to March, 2017 Drill Program | 100 |
| Figure 11.21 Results for the Duplicate Samples Plotted as a Relative Error Diagram for the North and Northwest La Chicharra Pits, August, 2016 to March, 2017 Drill Program | 101 |
| Figure 11.22 Plot of Blank Assay Data from the Bureau Veritas Laboratory for the 2016 to 2017 Drill Program at San Francisco Pit | 102 |
| Figure 11.23 Plot of Blank Assay Data from the ALS Minerals Laboratory for the 2016 to 2017 Drill Program at San Francisco Pit | 102 |
| San Francisco Project | xi | May 1, 2026 |
| Page |
| Figure 11.24 Plot of Blank Assay Data from the Bureau Veritas Laboratory for the 2016 to 2017 Drill Program at N & NW Chicharra Pit | 103 |
| Figure 11.25 Plot of Blank Assay Data from the ALS Minerals Laboratory for the 2016 to 2017 Drill Program at N & NW Chicharra Pit | 103 |
| Figure 11.26 Plot for the Analysis Information for Standard Reference Sample OXC-145 | 105 |
| Figure 11.27 Plot for the Analysis Information for Standard Reference Sample OXD-144 | 106 |
| Figure 11.28 Plot for the Analysis Information for Standard Reference Sample OXG-124 | 107 |
| Figure 11.29 Plot of the Duplicate Sample Analysis for the 2018 Drilling Program | 108 |
| Figure 11.30 Mine Laboratory - Fine and Coarse Blank Assay Results for 2020-2022 Drilling Campaigns | 110 |
| Figure 11.31 2022 Certified Reference Material Gold Assay Results for Rocklabs OxC109 and OxD144 | 111 |
| Figure 11.32 2022 Certified Reference Material Gold Assay Results for Rocklabs OxC109 and OxD155 | 112 |
| Figure 11.33 2022 Certified Reference Material Gold Assay Results for OREAS 501d and OREAS 502c | 113 |
| Figure 11.34 Mine Laboratory - Field Sample Duplicate Assay Results for the 2020 to 2022 Drilling Campaigns | 114 |
| Figure 12.1 December, 2025, San Francisco Project Site Visit GPS Track | 116 |
| Figure 13.1 Historical Cumulative Plant Gold Recoveries2010 to 2017 | 121 |
| Figure 14.1 Plan View of the Drill Hole Collars at the San Francisco Mine | 130 |
| Figure 14.2 3-D Profile of the Topography and the Drill Holes at the San Francisco and La Chicharra Pits | 130 |
| Figure 14.3 3-D Profile of the Topography and the Drill Holes at the San Francisco and North Pit | 131 |
| Figure 14.4 3-D View of the Topography and Interpreted Mineralized Constraints at the San Francisco and La Chicharra Deposits | 132 |
| Figure 14.5 San Francisco Block Model Swath Plot | 137 |
| Figure 14.6 La Chicharra Block Model Swath Plot | 137 |
| Figure 14.7 North Pit Block Model Swath Plot | 138 |
| Figure 14.8 Sensitivity Analysis Graph for the San Francisco Pit | 144 |
| Figure 14.9 Sensitivity Analysis Graph for the La Chicharra Pit | 144 |
| San Francisco Project | xii | May 1, 2026 |
| Page |
| Figure 14.10 Sensitivity Analysis Graph for the North Pit | 145 |
| Figure 14.11 Sensitivity Analysis Graph for the San Francisco Project All Pits Combined | 145 |
| Figure 14.12 El LIano Exploration Target Area | 146 |
| Figure 24.1 Pit Wall Angle Measurements: San Francisco Pit | 150 |
| Figure 24.2 Pit Wall Angle Measurements: La Chicharra Pit | 150 |
| Figure 24.3 Piezometer (PFP-01A) Installed to Monitor Water Flow Surrounding the Pit | 152 |
| Figure 24.4 Relationship between the San Francisco and La Chicharra Pits, Leach Pads, Waste Piles and Other Infrastructure 2017-Present | 153 |
| Figure 24.5 Fresh Water Distribution Network at the San Francisco Mine | 158 |
| Figure 25.1 El LIano Exploration Target Area | 166 |
| San Francisco Project | xiii | May 1, 2026 |
| Goldgroup Mining Inc. |
1 SUMMARY
| 1.1 | Introduction |
Micon International Limited (Micon) has been retained by Goldgroup Mining Inc. (Goldgroup) to prepare an updated Mineral Resource Estimate (MRE) for the San Francisco Project (San Francisco Project or the Project) located in the State of Sonora, Mexico. Goldgroup has also requested that Micon compile and disclose the results of the updated MRE in a National Instrument 43-101 (NI 43-101) Standards of Disclosure for Mineral Projects Technical Report.
Neither Micon nor its QPs have had, does have, nor have previously had any material interest in Goldgroup or related entities. The relationship with Goldgroup and related entities is solely a professional association between the client and the independent consultant. This report is prepared in return for fees based upon agreed commercial rates and the payment of these fees is in no way contingent on the results of this report.
This report includes technical information which requires subsequent calculations or estimates to derive sub-totals, totals and weighted averages. Such calculations or estimations inherently involve a degree of rounding and consequently introduce a margin of error. Where these occur, neither Micon nor its QPs consider them to be material.
The conclusions and recommendations in this report reflect the authors’ best independent judgment in light of the information available to them at the time of writing. The authors and Micon reserve the right, but will not be obliged, to revise this report and conclusions if additional information becomes known to them subsequent to the date of this report. Use of this report acknowledges acceptance of the foregoing conditions.
This report is intended to be used by Goldgroup subject to the terms and conditions of its agreement with Micon. That agreement permits Goldgroup to file this report as a Technical Report with the Canadian Securities Administrators pursuant to provincial securities legislation or with the SEC in the United States. Except for the purposes legislated under provincial securities laws, any other use of this report, by any third party, is at that party’s sole risk.
The descriptions of geology, mineralization and exploration used in this report are taken from reports prepared by various organizations and companies or their contracted consultants, as well as from various government and academic publications. The conclusions of this report are based in part on data available in published and unpublished reports supplied by the companies which have conducted exploration on the property, and information supplied by Goldgroup. The information provided to Goldgroup was supplied by reputable companies. Micon’s QPs have no reason to doubt its validity and has used the information where it has been verified through its own review and discussions.
Micon is pleased to acknowledge the helpfulcooperationof Goldgroup management andconsulting field staff, all of whom have made any and all data requested available and have responded openly and helpfully to all questions, queries and requests for material.
| San Francisco Project | 1 | May 1, 2026 |
| Goldgroup Mining Inc. |
| 1.2 | Property Description, Location and Ownership |
The San Francisco property is situated in the north central portion of the state of Sonora, Mexico, approximately 150 kilometres (km) north of the state capital, Hermosillo. In this Technical Report, the term San Francisco Project refers to the area within the exploitation or mining concessions controlled by Molimentales del Noroeste S.A. de C.V, (Molimentales) while the term San Francisco property (the property) refers to the entire land package (mineral exploitation and exploration concessions).
Molimentales is a 100% owned subsidiary of Goldgroup subject to final TSX Venture Exchange (TSXV) approval.
The San Francisco Project is comprised of two previously mined open pits (San Francisco and La Chicharra), together with heap leach processing facilities and associated infrastructure located close to the San Francisco pit. The San Francisco Project leach pads are no longer producing, no mining is being conducted, and the Project is on care and maintenance.
| 1.2.1 | Goldgroup Acquisition |
| 1.2.1.1 | Goldgroup Description of Acquisition Terms of Molimentales |
Subject to the final approval of the TSX Venture Exchange (the “TSXV”), Goldgroup Mining Inc. (“Goldgroup or the Company”) has acquired all of the issued and outstanding Series “A” shares in the fixed capital and all the issued and outstanding Series “B” shares in the variable capital (collectively the “Molimentales Shares”) of Molimentales del Noroeste, S.A. de C.V. (“Molimentales”) through a Concurso Mercantil process (restructuring proceeding equivalent to Chapter 11 in the United States). Goldgroup received approval from the Second District Court for Commercial Bankruptcy Matters (the “Mexican Court”) to the plan of arrangement (the “Plan of Arrangement”) the Company filed with the Mexican Court under the Concurso Mercantil process. The judgement issued by the Mexican Court in favour of Goldgroup’s Plan of Arrangement completes the bankruptcy and restructuring of Molimentales. Molimentales’ primary asset is the formerly producing San Francisco Mine and mineral concessions, located in Sonora State, Mexico.
Goldgroup filed a proposal under the Concurso Mercantil process to acquire Molimentales under the Plan of Arrangement with the liquidator (the “Liquidator”) appointed by the Mexican Court to oversee Molimentales’ bankruptcy proceedings. The Plan of Arrangement was approved by over 50% of the recognized creditors of Molimentales as required under Mexican law, recommended by the Liquidator and subsequently filed with the Mexican Court for approval. The Mexican Court approved the Plan of Arrangement by judgement issued effective December 23rd, 2025. The acquisition of Molimentales will be subject to Goldgroup satisfying all the conditions of the Concurso, including paying all creditors under the Plan of Arrangement, all outstanding taxes and concession fees due to the Mexican government, as well as receiving final approval from the TSXV. With the Plan of Arrangement and together with the settlement of outstanding liabilities owed to the Mexican Government in order to maintain the San Francisco Mine in good standing, transfer of ownership of Molimentales and the San Francisco Mine and its associated assets, including mining concessions, processing plants, and all related infrastructure, to Goldgroup, will occur free and clear of all liens and liabilities. except for a 1% NSR on each of the following mining concessions: San Francisco, Patricia, Norma, La Pima, Dulce, and San Judas, and a 2% net smelter return (“NSR”) royalty on gold produced from the San Francisco Mine and surrounding mining concessions.
| San Francisco Project | 2 | May 1, 2026 |
| Goldgroup Mining Inc. |
Prior to the filing of the Plan of Arrangement, Goldgroup acquired 60.24% of the debts owed to certain major creditors (the “Major Creditors”) as recognized by the Mexican Court for US$ 8,971,000 of which US$ 7,554,000 has been paid to date and the balance of US$ 1,417,000 will be paid to complete the acquisition. Under the terms of the Plan of Arrangement Goldgroup has agreed to pay US$ 2,566,098 in three equal instalments of US$ 855,366 each in December 2026, 2027 and 2028 to the remaining creditors holding 39.76% of the recognized debt in addition to all outstanding mining concession fees (including penalties and interest), taxes, fees owed to the National Water Commission, and certain expenses related to the Concurso proceedings all currently estimated at MX$ 140M (approximately US$ 8.0M). Some of the payments described above are facilitated through Goldgroup acquiring the Molimentales Shares by paying the owners of the Molimentales Shares MX$ 100,000 and capitalizing Molimentales with MX$ 99.9M for a total of MX$ 100M.
| 1.2.1.2 | Net Smelter Return Royalties |
The following describes the renegotiated terms for the 1% NSR formerly held by Sandstorm, now held by Royal Gold.
The Company’s San Francisco mining Project has the following obligations owed to SA Targeted Investing Corp., a subsidiary of Royal Gold Inc. (“Royal Gold”):
(i) Gold Delivery: Commencing 5 business days after restart of operations, and every month thereafter, Molimentales shall deliver 75 gold ounces per month for 20 months.
(ii) Net Smelter Royalty: the Company will pay to Royal Gold a 1% NSR on each of the following mining concessions: San Francisco, Patricia, Norma, La Pima, Dulce, and San Judas. The NSR will commence once the Gold Delivery obligation is complete.
| 1.2.2 | Mexican Mining Law |
When the Mexican mining law was amended in 2006, all mineral concessions granted by the Dirección General de Minas (DGM) became simple mining concessions and there was no longer a distinction between mineral exploration or exploitation concessions. A second change to the mining law resulted in all mining concessions being granted for a period of 50 years, provided that the concessions remained in good standing. As part of the second change, all former exploration concessions which were previously granted for a period of 6 years became eligible for the 50-year term.
On May 08, 2023, an amendment to the Mining Law was published in which, among other modifications, the 50-year term of mining concessions was reduced to a 30-year term renewable for two additional 25-year terms. This validity applies only to new concessions granted after the amendment, so the term of current mining concessions shall not be reduced. This amendment was challenged before the Supreme Court, and, if declared unconstitutional, the term of mining concessions shall remain as previously referred.
For any concession to remain valid, the bi-annual fees must be paid, and a report has to be filed during the month of May of each year which covers the work conducted during the preceding year.
| San Francisco Project | 3 | May 1, 2026 |
| Goldgroup Mining Inc. |
Concessions are extendable, provided that the application is made within the last two years and no later than one year prior to the expiry of the initial term. To obtain such extension, the bi-annual fee and work requirements must be in good standing, and necessary permits to conduct mining activities must be held. The bi-annual fee paid to the Mexican government for mining concessions of the San Francisco Project in 2025 amounted to approximately US$ 553,777 dollars; this amount is expected to increase slightly during 2026 to US$ 641,510.
All mineral concessions must have their boundaries orientated astronomically north-south and east-west and the lengths of the sides must be one hundred metres or multiples thereof, except where these conditions cannot be satisfied because they border on other mineral concessions. The locations of the concessions are determined on the basis of a fixed point on the land, called the starting point, which is either linked to the perimeter of the concession or located thereupon. Prior to being granted a concession, the company must present a topographic survey to the DGM within 60 days of staking. Once this is completed the DGM will usually grant the concession.
| 1.3 | Accessibility, Climate, Physiography, Local Resources and Infrastructure |
The Project is located in the Arizona-Sonora Desert in the northern portion of the Mexican state of Sonora, 2 km west of the town of Estación Llano (Estación), approximately 150 km north of Hermosillo and 120 km south of the United States/Mexico border city of Nogales along Highway 15 (Pan American highway). The closest accommodations are in Santa Ana, a small city located 21 km to the north on Highway 15.
The climate at the Project site ranges from semi-arid to arid. The average ambient temperature is 21°C, with minimum and maximum temperatures of -5ºC and 50ºC, respectively. The average annual rainfall for the area is 330 mm with an upper extreme of 880 mm. The desert vegetation surrounding the San Francisco mine is composed of low-lying scrub, thickets and various types of cacti, with the vegetation type classified as Sarrocaulus Thicket.
Physiographically, the San Francisco property is situated within the southern Basin and Range Province, characterized by elongate, northwest-trending ranges separated by wide alluvial valleys. The San Francisco mine is located in a relatively flat area of the desert with the elevations ranging between 700 and 750 m above sea level.
| 1.4 | History |
After conducting exploration on the Project between 1983 and 1992, Compania Fresnillo S.A. de C.V. (Fresnillo) sold the property in 1992 to Geomaque Explorations Ltd. (Geomaque). After conducting further exploration, Geomaque decided to bring the Project into production in 1995. Due to economic conditions, mining ceased and the operation entered into the leach-only mode in November, 2000. In May, 2002, the last gold pour was conducted; the plant was mothballed, and clean-up activities at the mine site began.
In 2003, Geomaque sought and received shareholder approval to amalgamate the corporation under a new Canadian company, Defiance Mining Corporation (Defiance). On November 24, 2003, Defiance sold its Mexican subsidiaries (Geomaque de Mexico and Mina San Francisco), which held the San Francisco gold mine, to the Astiazaran family of Sonora and their private company.
| San Francisco Project | 4 | May 1, 2026 |
| Goldgroup Mining Inc. |
Since June, 2006, the Astiazaran family and their company Desarrollos Prodesa S.A. de C.V. have been extracting sand and gravel intermittently from both the waste dumps and the original leach pads for use in highway construction and other construction projects.
Timmins Gold Corp. (Timmins) acquired an option to earn an interest in the property in early 2005, whereupon it conducted a review of the available data and started a reverse circulation drilling program in August and September, 2005. This was followed by a second drilling program comprised of both reverse circulation and diamond drilling in 2006, based on the results of the 2005 drilling program.
From 2007 to 2009, concurrent with the completion of a feasibility study to re-start mining operations, Timmins conducted in-fill and confirmation drilling on the San Francisco and La Chicharra deposits. Commercial production commenced in 2010. Between 2010 and June 2013, Timmins completed an intensive reverse circulation and core drilling program in and around the two open pits, which further delineated the mineralization along strike and down dip. The mineralization remains open, particularly to the southeast of the San Francisco pit and in newly identified zones to the north, where additional in-fill drilling is required to better define the continuity and grade.
In 2017, Timmins changed its name to Alio Gold Inc. (Alio). In 2019, Magna acquired the San Francisco mine from Alio. Magna completed its acquisition of the San Francisco Project from Alio on May 6, 2020.
On March 3, 2023, Magna together with its direct and indirect subsidiaries, announced that it had filed a Notice of Intention to Make a Proposal (the "NOI") under the Bankruptcy and Insolvency Act (Canada) which will provide creditor protection while Magna restructured its affairs. KSV Restructuring Inc. was appointed as proposal trustee under the NOI to monitor Magna's operations and restructuring. The effect of the NOI is an initial and immediate stay of proceedings in favour of Magna Gold for 30 days, which stay can be extended by court order.
In coordination with the NOI, Magna's indirect subsidiary, Molimentales filed an application for restructuring (solicitud de concurso mercantil en fase de concurso) and provisional creditor protection (medidas cautelares) (the Insolvency Application) before the Second District Court for Insolvency Matters located in Mexico City, Mexico (Juzgado Segundo de Distrito en Materia de Concursos Mercantiles con Residencia en la Ciudad de México y Jurisdicción en toda la República Mexicana; the "Concurso Court") under the Mercantile Insolvency Act (Ley de Concursos Mercantiles). Molimentales is the owner and operator of the Company's San Francisco Mine. The initial ruling in connection with the Insolvency Application was issued by the Concurso Court on March 3, 2023 and certain pre-emptive protections were granted in favour of Molimentales including, inter alia, a suspension of all enforcement proceedings against the assets or rights of Molimentales.
As a result of the bankruptcy, the TSX Venture Exchange (TSXV) advised Magna that the trading of Magna's common shares would be transferred to the NEX Board of the TSXV effective at the opening of the market on March 8, 2023.
In the proceedings of bankruptcy 8/2023, filed by Molimentales del Noroeste, Sociedad Anonima de Capital Variable, on April 5, 2024, a judgment was issued declaring the merchant Molimentales del Noroeste, Sociedad Anonima de Capital Variable, to be outright bankrupt.
| San Francisco Project | 5 | May 1, 2026 |
| Goldgroup Mining Inc. |
Effective Dec 24, 2024, Magna Gold Corp. was delisted from the NEX for failure to maintain exchange requirements; however, its shares had been suspended prior to delisting.
As of December, 2025, no mining is being conducted at the San Francisco mine and previous care and maintenance activities resulted in a complete safe shut down of the heap leach activities.
| 1.5 | Geological Setting and Mineralization |
The San Francisco Project is a gold occurrence with trace to small amounts of other metallic minerals. The gold occurs in granitic gneiss and the deposit contains principally free gold and occasionally electrum. The mineralogy, the possibility of associated tourmaline, the style of mineralization and fluid inclusion studies suggest that the San Francisco deposits may be of mesothermal origin.
The San Francisco deposits are roughly tabular with multiple phases of gold mineralization. The deposits strike 60º to 65º west, dip to the northeast, range in thickness from 4 to 50 metres (m), extend over 1,500 m along strike and are open ended. Another deposit, the La Chicharra zone, was mined by Geomaque, as a separate pit.
| 1.6 | Exploration and Drilling Programs |
As Goldgroup, has just acquired Molimentales there has been no recent exploration or drilling programs conducted as of the date of this Technical Report.
| 1.7 | Metallurgical Testwork |
The San Francisco Project has been periodically in production since 2010. When operating, the Project recovered gold from the mineralization mined from the San Francisco and La Chicharra deposits by using conventional crushing and heap leach technologies. Mineralized material was crushed using two crushing and screen circuits, with a combined crushing operating capacity of 22,000 t/d.
Testwork programs have been completed by a number of independent laboratories as well as on-site when the Project was operating. The samples used for the tests are considered by the QP to be representative of the different types of mineralization found at the San Francisco and La Chicharra mineral deposits. The testwork completed to date and operating experience between 2010 to 2020 have not highlighted any deleterious elements or minerals that would have a material negative effect on economic extraction.
The results from on-site historical metallurgical testwork programs undertaken between 2015 and 2017 compared reasonably well with the average gold extraction achieved when operating, which was approximately 65%. However, column leach testwork completed at an independent laboratory in 2012 suggested potentially higher gold leach extractions of above 70% for both San Francisco and La Chicharra mineralization, respectively.
| San Francisco Project | 6 | May 1, 2026 |
| Goldgroup Mining Inc. |
| 1.8 | 2026 Mineral Resource Estimate |
| 1.8.1 | General Information |
The resource estimate for this report is partly based on revising the previous work completed by Magna and Micon for the 2020 Mineral Resource Estimate and completing a new Mineral Resource Estimate for the North Pit area based upon drilling completed by Magna. The Mineral Resource Estimates reported for the San Francisco and La Chicharra deposits are supported by Magna block models and have been depleted to reflect the mining completed by Magna before the mine closure. The resources reported in the North Pit are supported by a 2026 block model developed by Micon. The resource estimate is compliant with the current CIM standards and definitions as specified by NI 43-101 and supersedes all previous mineral resource estimates for the San Francisco Project. The effective date of the current mineral resource estimate is April 30, 2026.
Since the previous 2022 report on the San Francisco Project, drilling campaigns in 2020, 2021, and 2022 resulted in 206 additional drill holes totalling 27,269 m added to the drill hole database. The drilling was focused primarily in the northern and eastern parts of San Francisco deposit.
The 2020 mineral resource estimate for the San Francisco and La Chicharra pits used a gold price of US$ 1,500. The current 2026 mineral resource estimate is based on the 2020 block model and uses an adjusted gold price of US$ 3,500 per ounce for the San Francisco and La Chicharra mineral resource estimates. For the North Pit a gold price of US $3,500 was used, while the costs were maintained the same as for San Francisco and La Chicharra.
The resource block models are based on 5 m by 5 m by 6 m high blocks. The coordinate limits of the previous model were retained for this current work. The topography was updated to reflect the mined surface as of November 17, 2022. The undisturbed pre-mining topographic surfaces are also available in the model.
Mineralized lenses were manually interpreted, based on the data available in the database. These were used to constrain the gold grade estimation and assign density values.
| 1.8.2 | Database |
The database of the San Francisco and La Chicharra deposits consists of 4,862 drill holes with 457,328 sample intervals, mostly 1.5 m in length, of a total database of 719,247 m of drilling for the entire property, including exploration drilling outside the San Francisco and La Chicharra pits. The current database includes 285 new holes drilled from 2020 to 2022, for a total of 33,596.5 m of drilling.
Approximately 12% of the sampling intervals are greater than or equal to 2 m length, about 85% of the intervals are between 1.5 and 2.0 m in length, and about 3% are less than 1.5 m in length. In the case of duplicate samples, the original sample was used in the database.
| 1.8.3 | Capping |
High-grade outlier assays were capped at different gold grades, according to the domains within the San Francisco and La Chicharra pits.
| San Francisco Project | 7 | May 1, 2026 |
| Goldgroup Mining Inc. |
For the North Pit deposit, assays were capped at 4 g/t Au for mineralization domains and 0.7g/t Au for wall rock. Capping was applied on 7 samples in the mineralization domains and three samples in the wall rock.
| 1.8.4 | Compositing |
The assay database was composited to 3-m regular down-hole lengths, which is half the block height of 6 m. Assays were length-weighted for each composite. The relatively short composite length was chosen to unsmooth the resultant block grade distribution and provide a better match between the interpolated block grades and the underlying assay data.
| 1.8.5 | Specific Gravity |
A total of 68 specific gravity determinations were made, covering all rock domains. Results range from a high of 2.84 g/cm3 to a low of 2.61 g/cm3, with an arithmetic mean of 2.76 g/cm3.
| 1.8.6 | Grade Interpolation |
At San Francisco and La Chicharra, all blocks in the model were interpolated using the Ordinary Kriging method. The parameters were derived from the variographic analysis and applied to the different domains and zones accordingly.
For the resource estimate in the San Francisco deposit, the interpolation process was relaxed to allow multiple domains to inform blocks on each interpolation run, because the remaining resources are predominantly gabbro (Rock Code 11).
For North Pit, block grades were estimated using the Inverse Distance cubed (ID3) method, in a single pass. In mineralization domains, with relatively thin, vein geometry, a spherical search with 120 m radius was used for sample selection. A minimum of two samples and maximum of 12 samples were used to inform a block, with a maximum of two samples per hole. In the surrounding wall rock domain, grade was estimated the ID3 estimation method, using a search ellipse with radii of 120 m by 120 m by 30 m, oriented along the dip of the mineralization (dip 18°, dip azimuth 25°, pitch 100°). A sample search strategy with minimum of two samples and maximum of 12 samples was used to inform a block, with a maximum of two samples per hole.
| 1.8.7 | Classification |
Mineralized zones in the San Francisco Project have been classified as a mineral resource according to the CIM definitions. The mineralized zones display good geologic continuity, as demonstrated by the drill results.
The categorization criteria applied to the San Francisco and La Chicharra deposits resource estimates are as follows:
| · | Blocks within 20 m of a sample are considered measured, based upon a pass finding 3 drill holes with a maximum of 2 samples per hole. |
| San Francisco Project | 8 | May 1, 2026 |
| Goldgroup Mining Inc. |
| · | Blocks between 20 m and 40 m from a sample are considered indicated, based upon a pass finding 2 drill holes with a maximum of 2 samples per hole. |
| · | Any blocks further than 40 m from a sample are considered inferred. |
For the North Pit, blocks in areas with a drill hole spacing of 50 m or less were considered for classification into Indicated category. Estimated blocks within 25 m from a drillhole and informed by at least two drill holes were initially selected, then a wireframe was manually modelled to retain contiguous patches of blocks where the conditions were met. The blocks retained inside the classification wireframe were classified in the Indicated category. The remaining estimated blocks were classified in the Inferred category.
| 1.8.8 | Resource Pit Optimization and Economic Parameters |
For the 2020 Magna block models, pit optimization studies were run in order to estimate the resources. The gold price used for estimating 2020 mineral resources was US$ 1,500 per ounce. This procedure was used to satisfy the criterion that resources must have reasonable prospects of eventual economic extraction. For the San Francisco and La Chicharra pit areas the 2026 update comprised reviewing the models and material mined up to the point Molimentales ceased operations and it was decided to modify the 2020 parameters by adjusting costs with inflation, and change the gold price to US
$3,500/oz. An updated open pit resource shell was generated and used for mineral resource reporting. Micon’s QPs recommend that Goldgroup updates the San Francisco and La Chicharra models to incorporate the latest geological information available.
The parameters used in the pit optimization are summarized in Table 1.1. The input operating parameters were derived from actual operating costs incurred during the San Francisco Project’s production period and escalated to 2026 US dollars using standard inflation indices
Pit bench heights were set at 6 m (the block height used in the model), and slope angles were based on average overall slope angle of 50° and a minimum operating width of 20 m]
For the North Pit deposit, a pit optimization exercise was conducted, using a gold price of US$ 3,500 per ounce. This procedure was used to satisfy the criterion that resources must have reasonable prospects of eventual economic extraction. The parameters used in the pit optimization are summarized in Table 1.2. The costs inputs used were based on operating costs from 2020, but adjusted US dollar to 2026 inflationary indices Same pit slope parameters as used for the San Francisco pit were assumed for the North Pit.
Table 1.1
Pit Optimization Parameters* for the April 30, 2026, Mineral Resource Estimate for the San Francisco and La Chicharra Deposits
| Area | Costs | ||
| San Francisco Model | Description | Units | Amount |
| Waste mining cost OP | US$/t | 2.69 | |
| Ore mining cost OP | US$/t | 2.69 | |
| Process cost | US$/t | 5.1 | |
| San Francisco Project | 9 | May 1, 2026 |
| Goldgroup Mining Inc. |
| Area | Costs | ||
| G & A cost | US$/t | 1.0 | |
| Gold price | US$/oz | 3,500 | |
| Rock Densities and Recoveries | |||
| Name/code | Density | Recovery % | |
| Diorite (2) | 2.72 | 54.50 | |
| Gneiss (4) | 2.75 | 71.10 | |
| Granite (5) | 2.76 | 76.00 | |
| Schist (6) | 2.75 | 74.40 | |
| Lamprophyre Dike (8) | 2.76 | 54.50 | |
| Pegmatite (10) | 2.85 | 74.40 | |
| Gabbro (11) | 2.81 | 63.80 | |
| Conglomerate (12) | 2.00 | 64.50 | |
| General Recovery | 64.00 | ||
| La Chicharra Model | Costs | ||
| Description | Units | Amount | |
| Waste mining cost | US$/t | 2.69 | |
| Ore mining cost | US$/t | 2.69 | |
| Process cost | US$/t | 5.1 | |
| G & A cost | US$/t | 1.0 | |
| Gold price | US$/oz | 3,500 | |
| Rock Densities and Recoveries | |||
| Name/code | Density | Recovery % | |
| All Rock (100-500) | 2.9 | 78.00 | |
| General Recovery | 78.00 | ||
*Pit optimization parameters for metal prices and costs have been updated from those used in the August, 2020 Technical Report.
Table 1.2
Pit Optimization Parameters for the April 30, 2026, Mineral Resource Estimate for the North Pit Deposit
| Area | Costs | ||
| North Pit Model | Description | Units | Amount |
| Waste mining cost OP | US$/t | 2.69 | |
| Ore mining cost OP | US$/t | 2.69 | |
| Process cost | US$/t | 5.1 | |
| G & A cost | US$/t | 1.0 | |
| Gold price | US$/oz | 3,500 | |
| Rock Densities and Recoveries | |||
| Name/code | Density | Recovery % | |
| Diorite | 2.72 | 54.50 | |
| Gneiss | 2.75 | 71.10 | |
| Granite | 2.76 | 76.00 | |
| Schist | 2.75 | 74.40 | |
| Lamprophyre Dike | 2.76 | 54.50 | |
| Pegmatite | 2.85 | 74.40 | |
| San Francisco Project | 10 | May 1, 2026 |
| Goldgroup Mining Inc. |
| Gabbro | 2.81 | 63.80 | |
| Conglomerate | 2.00 | 64.50 | |
| General Recovery | 67.00 | ||
As can be seen from Table 1.1, not only do the various rock codes have a different density, but the metallurgical recovery varies with the rock code as well.
| 1.8.9 | April 30, 2026 Mineral Resource Estimate Statement |
The Mineral Resource Estimates which have an effective date of April 30, 2026 are presented in Table 1.3.
Table 1.3
Mineral Resource Estimate for the San Francisco Project as of April 30, 2026
| Area | Cut-off (Au g/t) | Category | K tonnes | Au (g/t) | Gold (K oz) |
| San Francisco Mine OP | 0.09 | Measured | 41,024 | 0.38 | 498.9 |
| Indicated | 38,299 | 0.37 | 456.8 | ||
| Measured and Indicated | 79,323 | 0.37 | 955.7 | ||
| Inferred | 7,464 | 0.39 | 93.3 | ||
| La Chicharra Mine OP | 0.07 | Measured | 7,241 | 0.36 | 82.8 |
| Indicated | 13,892 | 0.32 | 143.8 | ||
| Measured and Indicated | 21,132 | 0.33 | 226.6 | ||
| Inferred | 1,040 | 0.37 | 12.4 | ||
| North Pit Mine OP | 0.08 | Measured | |||
| Indicated | 4,630 | 0.30 | 44.3 | ||
| Measured and Indicated | 4,630 | 0.30 | 44.3 | ||
| Inferred | 8,764 | 0.26 | 72.7 | ||
| Total Resources | Measured | 48,265 | 0.37 | 581.7 | |
| Indicated | 56,821 | 0.35 | 644.9 | ||
| Measured and Indicated | 105,086 | 0.36 | 1,226.6 | ||
| Inferred | 17,268 | 0.32 | 178.4 |
Notes:
| 1. | The effective date of this MRE is April 30, 2026. | |
| 2. | Messrs. William Lewis, P.Geo. and Tudorel Ciuculescu, P.Geo. from Micon International Limited are the Qualified Persons (QPs) responsible for this MRE. | |
| 3. | The MRE has been classified in the Measured, Indicated, and Inferred categories. | |
| 4. | The calculated gold break-even cut-off grade is 0.12 g/t Au for San Francisco Mine, 0.10 g/t Au for La Chicharra Mine, and 0.12 g/t Au for North Pit Mine. Marginal cut-off grade is 0.09 g/t Au for San Francisco Mine, 0.07 g/t Au for La Chicharra Mine, and 0.08 g/t Au for North Pit Mine. | |
| 5. | The mineral resources are constrained by resource shells based on the break-even cut-off grade and reported at the marginal cut-off grade. | |
| 6. | The SG values vary between 2.0 g/cm3 and 2.85 g/cm3 depending on lithology. | |
| 7. | The MRE used economic assumptions for open pit mining. The following economic parameters were used for generating cut-off grades: for San Francisco and La Chicharra a gold price of US$3,500/oz, recovery from 54.5% to 74.4% (64% average recovery), open pit mining cost of US$2.69/t, processing costs of US$5.1/t, general and administration cost of US$1.0/t; for North Pit a gold price of US$3,500/oz, recovery from 54.5% to 73% (67% average recovery), open pit mining cost of US$2.69/t, processing costs of US$5.1/t, general and administration cost of US$1.0/t. |
| San Francisco Project | 11 | May 1, 2026 |
| Goldgroup Mining Inc. |
| 8. | The open pits used average slope angles of 50° and royalty of 1.5%. | |
| 9. | The block models are orthogonal and have a parent block size of 5 m x 5 m x 6 m. | |
| 10. | The mineral resources described above have been prepared in accordance with the current Canadian Institute of Mining, Metallurgy and Petroleum Standards and Practices. | |
| 11. | Numbers have been rounded to the nearest thousand tonnes and nearest hundred ounces. Differences may occur in totals due to rounding. | |
| 12. | Mineral Resources are not Mineral Reserves as they do not have demonstrated economic viability. The quantity and grade of reported Inferred Mineral Resources are uncertain in nature and there has been insufficient exploration; however, it is reasonably expected that a significant portion of Inferred Mineral Resources could be upgraded into Indicated Mineral Resources with further exploration. | |
| 13. | Micon’s QPs have not identified any environmental, permitting, legal, title, taxation, socio-economic, marketing or political issues which would adversely affect the mineral resources estimated above. |
| 1.9 | San Francisco Project Potential Mineralization Target |
Scattered exploration drilling east of the San Francisco Pit, in what has been termed the El LIano exploration target area, has indicated that the mineralization identified and mined in the pit could potentially continue to the east towards Mexican State Highway 15 (Pan American Highway) which links Hermosillo to Nogales in the American Mexican border.
While the drilling at this time is too widely spaced to infer continuity between the individual mineralized intersections identified in the drill holes, the general intersections are similar to those mined in the San Francisco Pit and generally lie in the easterly strike direction of mineralization located in the San Francisco Pit. Therefore, Micon’s QPs believe that the El Llano exploration target area has the potential to host a mineralized zone similar to that found in the San Francisco Pit.
Table 1.4 summarizes Micon’s QP estimated range for the potential mineralization in the El Llano exploration target area.
Table 1.4
Summary of the Estimated Range for the Potential Mineralization in the El Llano Exploration Target Area
| Area | Potential Mineral Target Range* | |||||
| Lower Target Range | Higher Target Range | |||||
| Tonnage
(Mt) |
Grade (Au |
Ounces Gold |
Tonnage
(Mt) |
Grade (Au |
Ounces Gold | |
| El Llano Exploration Target Area | 40 | 0.61 | 788 | 78 | 0.38 | 960 |
*Notes:
| 1. | The estimated potential is based upon the widespread drilling in the El Llano Exploration Target Area east of the existing San Francisco Pit which could host the eastern extension of the mineralization found in the pit. |
| 2. | The potential quantity and grade are conceptual in nature, and there has been insufficient exploration to define a mineral resource and that it is uncertain if further exploration will result in the target being delineated as a mineral resource. |
| San Francisco Project | 12 | May 1, 2026 |
| Goldgroup Mining Inc. |
| 1.10 | Conclusions and Recommendations |
| 1.10.1 | Conclusions |
Goldgroup is in the process of acquiring Molimentales which holds the mining concessions for the San Francisco Project. While a large amount of mineralization has been extracted from the San Francisco and La Chicharra pits since mining first began at the site, it still contains economic mineralization as well as the potential to discover further mineralization nearly equal to that already extracted. Micon’s QPs recommend that Goldgroup proceeds with a thorough review of the information within the Project database and an exploration program to further define the extent of the remaining mineralization at the San Francisco Project once it has completed acquisition.
| 1.10.2 | Risks and Opportunities |
Table 1.5 identifies some of the significant internal risks, potential impacts and possible risk mitigation measures that could affect the economic outcome of the Project. This excludes the external risks that apply to all mining projects (e.g., changes in metal prices, exchange rates, availability of investment capital, change in government regulations, etc.). Significant opportunities that could improve the economics, timing and permitting of the Project are also identified in this table. Further information and evaluation are required before these opportunities can be included in the project economics.
Table 1.5
Risks and Opportunities at the San Francisco Project
| Risk | Potential Impact | Possible Risk Mitigation |
| Mineral Resources Compositing of Assays for Entire Drill Hole | Potential of smearing grade and effect interpretation of mineralized zones on the edges of wire framed mineralized bodies. | Change to conducting assay compositing only within mineralization wireframe intercepts as this may lead to higher average grades and improve the interpretation results for the San Francisco and La Chicharra pits. |
| Mineral Resource Continuity | Widely spaced drilling in some areas which need further infill drilling in expansion or inferred areas. | Continue infill drilling to upgrade a larger proportion of the inferred mineral resources to indicated and measured resources. |
| Proximity to the Town of Estación Llano | Possibility that the portions of the population does not accept the continuation of the mining project | Maintain a pro-active and transparent strategy to identify all stakeholders and maintain a communication plan. The main stakeholders have been identified, and their needs/concerns understood. Continue to organize information sessions, publish information on the mining project, and meet with host communities. |
| Difficulty in attracting experienced professionals | Maintenance of the Project to attract and retain experienced professionals | The early search for professionals will help identify and attract critical people. It may be necessary to provide accommodation for key people (not included in project costs). |
| Some of the samples in the North pit area lack duplicate assay repeatability | Potential for a portion of the North Pit resources to be overestimated or | The use of screen metallic assays on some material is recommended, as well as conducting some mineralogical studies in order to understand why some of the samples exhibit poor repeatability. |
| San Francisco Project | 13 | May 1, 2026 |
| Goldgroup Mining Inc. |
| underestimated with respect to the grade. | ||
| Opportunities | Explanation | Potential Benefit |
| Mineral Resource Interpretation | Current wireframes may inflate or deflate the extent of the mineralization. | Change interpretation practices from an extruded flat polygonal model to full 3D wireframes to better define the mineralization. |
| Historical core and sample availability | There is the potential to relog existing drill core to incorporate additional geological information into the existing database. | Relogging of core allows for increased information added to the database and further defines the extent of the mineralization. Historical pulps and rejects allow for potential re-assaying and confirmation of historical work. |
| Surface mapping and sampling programs | Potential to identify additional zones or deposits of mineralization. | Adding to the overall mineral potential of the Project and potentially adds exploration and economic value to the Project. |
| Surface definition diamond drilling | Potential to upgrade inferred resources to the indicated category | Adding indicated resources increases the economic value of the mining Project. |
| Surface exploration drilling | Potential to identify additional inferred resources | Adding inferred resources increases the economic value of the mining Project. |
| 1.10.3 | Exploration Budget |
To assess the nature of the additional mineralization at the San Francisco Project, Goldgroup will undertake a drilling program in the area identified as the North Pit. In order to develop this pit which will be on the northeast side of the main San Francisco pit portions of the original infrastructure will need to be removed such as the Truck maintenance shop, office facilities and potentially even a portion of the ADR Plant 1. To assess the economic nature of the North Pit further, Goldgroup has designed a reverse circulation drill program comprised of both infill and exploration holes at specific sites in and around potential location of the North Pit. Goldgroup plans to upgrade a portion of the indicated mineral resources to the measured resources category and to further confirm the mineralized bodies within Phases 9A and 9B of current mine plan of the San Francisco pit. The program is based on the previous drilling information obtained by Alio and Magna. The 2026 drill program consists of a total of 10,000 m of RC drilling and 10,000 m of core drilling.
Table 1.6 summarizes the estimated budget for the 2026 infill and exploration drilling programs located in the projected area of the North Pit at the San Francisco Project.
Table 1.6
Estimated Budget for the 2026 Infill and Exploration Drilling Program at the San Francisco Mine
| Description | Unit | No. Units |
Unit
Cost US $ |
Total
Cost US $ |
| Geology and Exploration | ||||
| Project Management | Month | 6 | 6,000 | 36,000 |
| Exploration Management SF Mine | Month | 6 | 4,500 | 27,000 |
| Geologist (Salaries and Consulting Fees) | Month | 6 | 7,500 | 45,000 |
| San Francisco Project | 14 | May 1, 2026 |
| Goldgroup Mining Inc. |
| Description | Unit | No. Units |
Unit
Cost US $ |
Total
Cost US $ |
| Field Hands | Month | 6 | 11,000 | 66,000 |
| Camp, Foods and Accommodation | Month | 6 | 2,500 | 15,000 |
| Exploration Supplies (bags, duplicates, CRMs, core boxes, etc.) | Lump | 2 | 5,000 | 10,000 |
| Reverse Circulation Drilling * | metre | 10,000 | 70 | 700,000 |
| Core Drilling | metre | 10,000 | 120 | 1,200,000 |
| Equipment for core cutting | Rent or Purchase |
|||
| Assaying for Gold (External, Prep and Assay) | Samples | 17,333 | 35 | 606,667 |
| Engineering and Feasibility (Micon) | Consultants | 1 | 50,000 | 50,000 |
| Metallurgical Tests North Pit | Consultants | 1 | 50,000 | 50,000 |
| Drafting, Reporting, Reproduction, Maps | Lump | 1 | 2,500 | 2,500 |
| Software Leapfrog | Year | 1 | 25,000 | 25,000 |
| ArcGis PRO Licence | Year | 2 | 1,000 | 2,000 |
| Vehicle Renting | Four | 3 | 2,400 | 7,200 |
| Gasoline and Maintenance | Lump | 3 | 2,400 | 7,200 |
| Travel Expenses | - | |||
| Safety Equipment | Lump | 12 | 100 | 1,200 |
| Social Security and Labour Related Taxes | Estimated | 10% | 147,000 | 14,700 |
| Total Exploration and Administration | 2,865,467 |
Note: *The unit cost of the RC drilling varies from $56 to $78 dollars per metre, included transportation, additives, rent of a gyro or reflex survey tool, etc., in agreement with three quotations.
Table from Micon International Limited.
Micon’s QPs have reviewed the exploration budgets for the area of the North Pit and the currents pits at the San Francisco Project and recommends that Goldgroup proceed with the budget, subject to funding and other operational changes that may arise.
Given the prospective nature of the property, it is the opinion of Micon’s QPs, that the San Francisco Project and surrounding property merits further exploration with the objective of identifying additional mineralized zones with the potential to extend Project life.
| 1.10.4 | Further Recommendations |
Micon agrees with the general direction of Goldgroup’s exploration and development program for the property and makes the following additional recommendations:
| 1. | Goldgroup will need to improve the mineralization wireframes for San Francisco and La Chicharra Pits from being a series of extruded flat polygons to full 3D wireframes which would better define the mineralization boundaries. This will also increase the accuracy of the block modelling interpretation as further drill holes are added to the models since current modelling programs are unable to use the existing format. |
| 2. | Goldgroup needs to conduct the assay compositing for both San Francisco and La Chicharra within the mineralization wireframe intercepts, instead of compositing the entire hole from collar to toe; this will potentially lead to higher average grades within the mineralization wireframes and improve the interpolation results. |
| San Francisco Project | 15 | May 1, 2026 |
| Goldgroup Mining Inc. |
| 3. | Goldgroup should continue the practice of ongoing column leach testwork on-site, using samples that represent future planned mining areas and potential new mineral resources identified during exploration. The data gleaned from this work will improve the understanding of the various mineralization types and help optimize the recovery of gold. This testwork should be completed on material from the area of the North Pit prior to undertaking a mineral resource for this area. |
| 4. | Goldgroup should plan an extensive exploration campaign on the San Francisco Project to identify potential secondary sources of mineralization which can be added to the mineral inventory of the Project. |
| San Francisco Project | 16 | May 1, 2026 |
| Goldgroup Mining Inc. |
2 INTRODUCTION
| 2.1 | Terms of Reference |
Micon International Limited (Micon) has been retained by Goldgroup Mining Inc. (Goldgroup) to prepare an updated Mineral Resource Estimate (MRE) for the San Francisco Project (San Francisco Project or the Project) located in the State of Sonora, Mexico. Goldgroup has also requested that Micon compile and disclose the results of the updated MRE in a National Instrument 43-101 (NI 43-101) Standards of Disclosure for Mineral Projects Technical Report.
Neither Micon nor its QPs have had, does have, nor have previously had any material interest in Goldgroup or related entities. The relationship with Goldgroup and related entities is solely a professional association between the client and the independent consultant. This report is prepared in return for fees based upon agreed commercial rates and the payment of these fees is in no way contingent on the results of this report.
This report includes technical information which requires subsequent calculations or estimates to derive sub-totals, totals and weighted averages. Such calculations or estimations inherently involve a degree of rounding and consequently introduce a margin of error. Where these occur, neither Micon nor its QPs consider them to be material.
The conclusions and recommendations in this report reflect the authors’ best independent judgment in light of the information available to them at the time of writing. The authors and Micon reserve the right, but will not be obliged, to revise this report and conclusions if additional information becomes known to them subsequent to the date of this report. Use of this report acknowledges acceptance of the foregoing conditions.
This report is intended to be used by Goldgroup subject to the terms and conditions of its agreement with Micon. That agreement permits Goldgroupto file this report as a Technical Report with the Canadian Securities Administrators pursuant to provincial securities legislation or with the SEC in the United States. Except for the purposes legislated under provincial securities laws, any other use of this report, by any third party, is at that party’s sole risk.
The descriptions of geology, mineralization and exploration used in this report are taken from reports prepared by various organizations and companies or their contracted consultants, as well as from various government and academic publications. The conclusions of this report are based in part on data available in published and unpublished reports supplied by the companies which have conducted exploration on the property, and information supplied by Goldgroup. The information provided to Goldgroup was supplied by reputable companies. Micon’s QPs have no reason to doubt its validity and has used the information where it has been verified through its own review and discussions.
Micon is pleased to acknowledge the helpfulcooperationof Goldgroup management andconsulting field staff, all of whom have made any and all data requested available and responded openly and helpfully to all questions, queries and requests for material.
| San Francisco Project | 17 | May 1, 2026 |
| Goldgroup Mining Inc. |
| 2.2 | Discussions, Meetings, Site Visits and Qualified Persons |
Micon’s latest site visit to the San Francisco Project was conducted between December 8, 2025 and December 10, 2025 with one full day (December 9, 2025) on site verifying drill collars for the North Pit location, visiting the San Francisco and La Chicharra Pits, visiting the latest heap leach pile and siting in discussions with Goldgroup contractors and personnel discussing the Project. The site visit was conducted by Messers. William Lewis and Tudorel Ciuculescu, both of whom are Principal Geologists with Micon, based in Toronto, Canada.
During the site visit, a number of drill hole collars for the North zone were inspected (Figure 12.1). The San Francisco and La Chicharra pits and the heap leach pads were visited, as well as other areas of infrastructure. GPS readings taken at the drill hole collars inspected and those recorded at various infrastructure item were in good agreement with the elements contained in the database provided by Goldgroup.
No samples were taken during the site visit as the San Francisco Mine has a well-documented history of production, as well as, Micon QPs having verified the mineralization during multiple site visits between 2005 and 2020.
Mr. Lewis has conducted site visits in relation to nearly all of the previous Technical Reports that Micon has written for the San Francisco Project. These reports spanned the original acquisition by Timmins Gold Corp. (later Alio Gold Inc.) and early exploration through to, and including, the production phase of the Project. Site visits in conjunction with Technical Reports were conducted in 2005, 2007, 2008, 2009, 2010, 2011, 2013, 2016 (two visits), 2017 and the current 2025 Technical Report.
During the site visit a number of drill hole collars for the north zone were inspected, the San Francisco and La Chicharra pits were visited, and various other areas of infrastructure were visited.
A number of discussions were held with Goldgroup personnel during the review of the San Francisco Project and in all cases all information requests were handled expeditiously and in no cases was information not provided to the Micon QPs.
The QPs responsible for the preparation of this report and their areas of responsibility and sites visits are noted in Table 2.1.
Table 2.1
Micon’s Qualified Persons, Areas of Responsibility and Site Visits
| Qualified Person | Title | Area of Responsibility | Site Visits |
| William J. Lewis, P.Geo. | Principal Geologist | Sections 1.1 to 1.6, 1.9, 1.10, 2 to 11, 12.3, 14.6, 24,25.1, 25.3 to 25.5, 26 and 27 | 2005, 2007, 2008, 2009, 2010, 2011, 2013, 2016 (two visits), 2017, and December 8, 2025 to December 10, 2025 |
| Tudorel Ciuculescu, P.Geo. | Principal Geologist | Sections 1.8, 12.1, 12.2, 14.1 to 14.5, 25.2 | December 8, 2025 to December 10, 2025 |
| San Francisco Project | 18 | May 1, 2026 |
| Goldgroup Mining Inc. |
| Qualified Person | Title | Area of Responsibility | Site Visits |
| Richard Gowans, P.Eng. | Principal Metallurgist | Sections 1.7 and 13 | None |
| NI 43-101 Sections not applicable to this report | 15,16,17,18,19,20,21 and 22 | ||
| 2.3 | Sources of Information |
The review of the San Francisco Project was based on published material researched by Micon, as well as data, professional opinions and unpublished material submitted by the professional staff of Goldgroup or its consultants. Much of these data came from Technical Reports prepared by the previous owners.
The descriptions of geology, mineralization and exploration used in this report are taken from reports prepared by various organizations and companies or their contracted consultants, as well as from various government and academic publications. The conclusions of this report are based in part on data available in published and unpublished reports supplied by the companies which have conducted exploration on the property, and information supplied by Goldgroup. The information provided to Goldgroup was supplied by reputable companies. Micon has no reason to doubt its validity and has used the information where it has been verified through its own review and discussions.
Some of the figures and tables for this report were reproduced or derived from historical reports written on the property by various individuals and/or supplied to Micon by Goldgroup. Most of the photographs were taken by Mr. Lewis during his previous and current site visits. In the cases where photographs, figures or tables were supplied by other individuals or extracted from previous Technical Reports, they are referenced below the inserted item.
Section 27 contains the reference material accessed to compile this Technical Report, including previous Technical Report on the San Francisco Project by previous operators.
| 2.4 | Units of Measurements and Abbreviations |
All currency amounts are stated in US dollars (US$) or Mexican pesos (MXN $), as specified, with costs and commodity prices typically expressed in US dollars. Quantities are generally stated in metric units, the standard Canadian and international practice, including metric tons (tonnes, t) and kilograms (kg) for weight, kilometres (km) or metres (m) for distance, hectares (ha) for area, grams (g) and grams per metric tonne (g/t) for gold and silver grades (g/t Au, g/t Ag). Wherever applicable, Imperial units have been converted to Système International d’Unités (SI) units for reporting consistency. Precious metal grades may be expressed in parts per million (ppm) or parts per billion (ppb) and their quantities may also be reported in troy ounces (ounces, oz), a common practice in the mining industry. A list of abbreviations is provided in Table 2.1. Appendix 1 contains a glossary of mining and other related terms.
| San Francisco Project | 19 | May 1, 2026 |
| Goldgroup Mining Inc. |
Table 2.2
Units and Abbreviations
| Name | Abbreviation | Name | Abbreviation |
| Accurassay Laboratories | Accurassay | McCelland Laboratories Inc. | McCelland |
| Acme Analytical Laboratories Ltd. | ACME | METCON Research Inc. | METCON |
| Adsorption/desorption/reactivation | ADR | Metre(s) | m |
| All-in sustaining costs | AISC | Mexican peso | MXN |
| Alio Gold Inc. | Alio | Micon International Limited | Micon |
| ALS-Chemex Laboratories | ALS-Chemex | Million (e.g. million tonnes, million ounces, million years) |
M (Mt, Moz, Ma) |
| Canadian Institute of Mining, Metallurgy and Petroleum | CIM | Milligram(s) | mg |
| Canadian National Instrument 43-101 | NI 43-101 | Millimetre(s) | mm |
| Canadian Securities Administrators | CSA | Molimentales del Noroeste de S.A. de C.V. | Molimentales |
| Centimetre(s) | cm | North American Datum | NAD |
| Certified Professional Geologist | CPG | Net present value, at discount rate of 5%/y | NPV, NPV8 |
| Chartered Engineer | CEng | Net smelter return | NSR |
| Compania Fresnillo S.A. de C.V. | Fresnillo | Not available/applicable | n.a. |
| Defiance Mining Corporation | Defiance | Ounces (troy)/ounces per year | oz, oz/y |
| Degree(s), Degrees Celsius | o ,oC | Parts per billion, part per million | ppb, ppm |
| Digital elevation model | DEM | Percent(age) | % |
| Dirección General de Minas | DGM | Professional Engineer | P.Eng. |
| Discounted cash flow | DCF | Quality Assurance/Quality Control | QA/QC |
| Diversified Drilling, S.A. de C.V. | Diversified | Qualified Person | QP |
| Electronic Data Gathering, Analysis and Retrieval | EDGAR | Run of mine | ROM |
| Secretaría del Trabajo y Previsión Social | STPS | ||
| Explotaciones Mineras Del Noroeste S.A. de C.V. | Explotaciones Mineras | Servicios Industriales Peñoles, S.A. de C.V. | Peñoles |
| Geomaque de Mexico, S.A. de C.V. | Geomaque de Mexico | SGS Mineral Services | SGS |
| Geomaque Explorations Inc. | Geomaque | Sol & Adobe Ingenieros Asociados S.A. de C.V. | Sol & Adobe. |
| Golder Associates Ltd. | Golder Associates | Specific gravity | SG |
| Grams per metric tonne | g/t | Square kilometre(s) | km2 |
| Hectare(s) | ha | System for Electronic Document Analysis and Retrieval | SEDAR |
| Hour | h | Three-dimensional | 3-D |
| Inch(es) | in | Timmins Gold Corp. | Timmins or TMM |
| Independent Mining Consultants, Inc. | IMC | Timmins Goldcorp Mexico, S.A. de C.V. | Timmins |
| Inductively Coupled Plasma – Emission Spectrometry | ICP-ES | Tonne (metric)/tonnes per day, tonnes per hour | t, t/d, t/h |
| Internal diameter | ID | Tonne-kilometre | t-km |
| Internal rate of return | IRR | Tonnes per cubic metre | t/m3 |
| Impuesto al Valor Agregado (or VAT) | IVA | TSL Laboratories Inc. | TSL |
| Kappes, Cassiday and Associates | Kappes Cassiday | United States Dollar(s) | US$ |
| Kilogram(s) | kg | US gallons per minute | USgpm |
| Kilometre(s) | km | US Securities and Exchange Commission | SEC |
| Life-of-mine | LOM | Universal Transverse Mercator | UTM |
| Litre(s) | L | Value Added Tax (or IVA) | VAT or IVA |
| Magna Gold Corp. | Magna | Year | y |
| San Francisco Project | 20 | May 1, 2026 |
| Goldgroup Mining Inc. |
3 RELIANCE ON OTHER EXPERTS
| 3.1 | General Discussion |
In this report, discussions regarding royalties, permitting, taxation, bullion sales agreements and environmental matters are based on material provided by Goldgroup during discussions. Micon’s QPs are not qualified to comment on such matters and has relied on the representations and email documentation provided by Goldgroup for such discussions.
All data used in this report were originally provided by Goldgroup. Micon’s QPs has reviewed and analysed this data and has drawn its own conclusions therefrom, augmented by its direct field examinations during the 2005, 2006, 2007, 2010, 2011, 2013, 2016 (2), 2017 and 2025 site visits.
Micon offers no legal opinion as to the validity of the title to the mineral concessions claimed by Goldgroup and its wholly owned Mexican subsidiaries and has relied on information provided by them.
| San Francisco Project | 21 | May 1, 2026 |
| Goldgroup Mining Inc. |
4 PROPERTY DESCRIPTION AND LOCATION
| 4.1 | General |
The San Francisco property is located in the north central portion of the Mexican state of Sonora, which borders on the American state of Arizona, and is approximately 150 km north of the city of Hermosillo, the capital of Sonora. The latitude and longitude for the Project site are approximately 30°21’13” N, 111°06’52” W. The UTM coordinates are 3,357,802 N, 489,017 E and the datum used was NAD 27 Mexico. The Project is located 2 km west of the town of Estación Llano and is accessed via Mexican State Highway 15 (Pan American highway) from Hermosillo.
The term San Francisco Project refers to the area related to the exploitation concessions controlled by Alio, while the term San Francisco property refers to the entire land package (mineral exploitation and exploration concessions) under Goldgroup’s control. The location of the San Francisco property is shown in Figure 4.1.
Figure 4.1
San Francisco Project Location Map
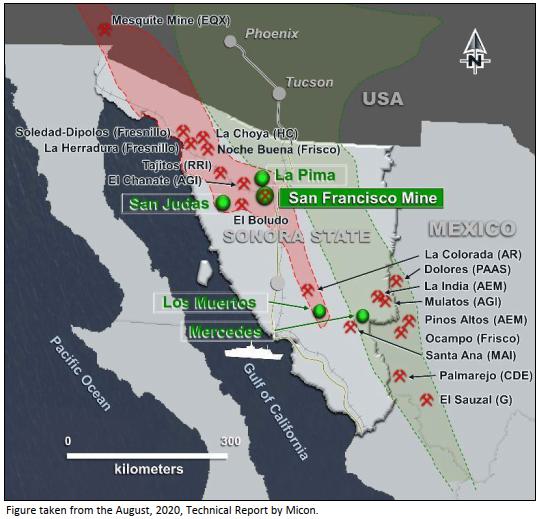
| San Francisco Project | 22 | May 1, 2026 |
| Goldgroup Mining Inc. |
| 4.2 | Ownership and Property Description |
| 4.2.1 | Goldgroup Ownership Information |
Goldgroup advises that it holds the San Francisco Project, which consists of 13 mining concessions, through its indirect wholly owned subsidiary Molimentales. All the concessions are contiguous, and each varies in size for a total property area of 46,931.91hectares (ha). In late 2005, the original Timmins II concession was subdivided into two concessions (Timmins II Fraccion Sur and Pima), as part of separate exploration strategies for the original Timmins II concession. All concessions are subject to a bi-annual fee and the filing of reports in May of each year covering the work accomplished on the property between January and December of the preceding year. The fee rates are estimated in US dollars based on the rates published in the “Diario Oficial de la Federacion (DOF)” as of February 28, 2026.
The size of the primary mineral concessions is approximately 33,647.72 ha, which are believed to contain the most prospective geology and mineralized targets upon which to base further exploration. A further block of regional exploration concessions totalling 13,284.19 ha are believed to contain further mineralized targets which need further exploration.
The information for the thirteen concessions is summarized in Table 4.1. A map of the mineral concessions for the San Francisco property is provided in Figure 4.2.
In 2006, a temporary occupancy agreement was signed with an agrarian community (an Ejido) in Mexico called Los Chinos, whereby Molimentales del Noroeste de S.A. de C.V. (Molimentales) was granted access privileges to 674 ha, the use of the Ejido’s roads, as well as being able to perform all exploration work on the area covered by the agreement.
During August and September, 2009, Molimentales acquired the 800 ha of surface land on which the San Francisco mine is located, by means of five purchase agreements covering all of the Ejido Jesus Garcia Heroe de Nacozari’s five former parcels that together form the 800 ha.
In September, 2011, Molimentales acquired 732 ha from Ejido Los Chinos, which was originally part of the exploration agreement signed in 2006. Therefore, Monumentales owns the surface rights to the area covered by the San Francisco mine and infrastructure.
Other parties control two mineral concessions which are contained within the area of the mineral concessions owned by Molimentales but neither of these concessions impacts the main area of the San Francisco Project. On February 23, 2011, an additional 95,000 ha of claims were staked along the highly prospective Sonora-Mojave Megashear structural province in northern Sonora with additional claims staked in subsequent years. In 2015 and 2016, the regional concessions were reduced with only ground that was deemed significant to future exploration kept. The information regarding the regional mineral concessions staked is summarized in Table 4.2. A map of the regional concessions is provided in Figure 4.3.
On July 6, 2011, Molimentales acquired (through a straight purchase) a 10-ha mineral concession called La Mexicana by paying the vendor, Mr. Agustin Albelais, a buy-out price of US$ 250,000. The La Mexicana mineral concession was the last area in the metamorphic package that did not belong to the Project.
| San Francisco Project | 23 | May 1, 2026 |
| Goldgroup Mining Inc. |
Table 4.1
San Francisco Project, Summary of Mineral Concessions (with Fees for 2026 noted)
| Mineral Concession Name | Title Number |
Owner | Location (UTM Nad 27 Mex) |
Mineral
Concession Type |
Area (hectares)1 |
Location Date | Expiry Date | Bi-Annual Fee (US$)2,3 |
| San Francisco | 198971 |
Molimentales del Noroeste, S.A de C.V. |
488,675.174 E 3,359,396.801 N | Mining Concession | 48.0000 | February 11, 1994 | February 10, 2044 | 650 |
| San Francisco Dos | 209618 |
Molimentales del Noroeste, S.A de C.V. |
488,675.174 E 3,359,396.801 N | Mining Concession | 315.6709 | August 3, 1999 | August. 2, 2049 | 4,273 |
| San Francisco Cuatro | 219301 |
Molimentales del Noroeste, S.A de C.V. |
488,675.174 E 3,359,396.801 N | Mining Concession | 5,189.7041 | February 25, 2003 | February 25, 2053 | 70,244 |
| Llano II | 197203 |
Molimentales del Noroeste, S.A. de C.V. |
483,652.702 E 3,356,290.081 N | Mining Concession | 500.0000 |
December 19, 1991 |
December 18, 2041 | 6,768 |
| Llano III | 197202 |
Molimentales del Noroeste, S.A de C.V. |
483,652.702 E 3,356,290.081 N | Mining Concession | 500.0000 |
December 19, 1991 |
December 18, 2041 | 6,768 |
| Llano IV | 222787 |
Molimentales del Noroeste, S.A. de C.V. |
488,675.174 E 3,359,396.801 N | Mining Concession | 500.0000 | August 31, 2004 | August 30, 2054 | 6,768 |
| Llano V | 222788 |
Molimentales del Noroeste, S.A. de C.V. |
483,652.702 E 3,356,290.081 N | Mining Concession | 500.0000 | August 31, 2004 | August 30, 2054 | 6,768 |
| Timmins | 226519 |
Molimentales del Noroeste, S.A. de C.V. |
488,675.174 E 3,359,396.801 N | Mining Concession | 337.0000 | January 24, 2006 | January 23, 2056 | 4,683 |
| Timmins III Fraccion 1 | 227237 |
Molimentales del Noroeste, S.A. de C.V. |
481,529.246 E 3,371,837.280 N | Mining Concession | 346.0004 | May 26, 2006 | May 25, 2056 | 4,683 |
| Timmins III Fraccion 2 | 227238 |
Molimentales del Noroeste, S.A. de C.V. |
481,529.246 E 3,371,837.280 N | Mining Concession | 54.2835 | May 26, 2006 | May 25, 2056 | 735 |
| Timmins II Fraccion Sur1 | 228260 |
Molimentales del Noroeste, S.A. de C.V. |
488,675.174 E 3,359,396.801 N | Mining Concession | 20,370.0604 | March 14, 2006 | March 13, 2056 | 275,715 |
| Pima Reduccion1 | 244788 |
Molimentales del Noroeste, S.A. de C.V. |
486,058.775 E 3,375,493.728 N | Mining Concession | 4,977.0000 | January 19, 2016 | March 13, 2056 | 76,365 |
| La Mexicana | 191137 |
Molimentales del Noroeste, SA de CV |
487,910,487 E 3’363,995.686 N | Mining Concession | 10.0000 | April, 29, 1991 | April 28, 2041 | 135 |
| Total: | - | - | - | - | 33,647.72 | - | - | 455,431.78 |
Table provided by Goldgroup Mining Inc.
Notes:
1 The Timmins II claim, originally staked with a surface of 39,403.0000 ha, was titled by the Direccion General de Minas (DGM) with a surface of 36,142.0604 ha after surveying was completed. In 2008, due to a change in exploration strategy, the Timmins II claim was divided into two claims, Timmins II Fraccion Sur and Pima. In 2015, the surface area of the Pima claim was reduced from 15,772 ha to 4,997 ha The Timmins II claim, originally staked with a surface of 39,403.0000 ha, was titled by the Direccion General de Minas (DGM) with a surface of 36,142.0604 ha after surveying was completed. In 2008, due to a change in exploration strategy, the Timmins II claim was divided into two claims, Timmins II Fraccion Sur and Pima. In 2015, the surface area of the Pima claim was reduced from 15,772 ha to 4,997 ha.
2 Fees are estimated in US dollars based on the rates published in the “Diario Oficial de la Federación (DOF)”. The exchange rate used is 19 pesos = 1 US Dollar.
3 The table includes payment for both semesters of 2025.
| San Francisco Project | 24 | May 1, 2026 |
| Goldgroup Mining Inc. |
Table 4.2
San Francisco Project, Summary of the Regional Mineral Concessions (with Fees for 2026 Noted)
| Mineral Concession Name | Title Number |
Owner | Location (UTM Nad 27 Mex) |
Mineral
Concession Type |
Area (hectares) |
Location Date | Expiry Date | Bi-Annual Fee (US$)1,2 |
| Norma Reduccion | 229257 | Molimentales del Noroeste, S.A de C.V. | 452,096,625 E 3,365,740.855 N | Mining Concession | 4,989.0250 | March 28, 2007 | March 27, 2057 | 67,528 |
| Patricia | 229241 | Molimentales del Noroeste, S.A de C.V. | 423,787.078 E 3,333,878.085 N | Mining Concession | 3,539.4141 | March 27, 2007 | March 26, 2057 | 47,907 |
| Los Carlos | 227334 | Molimentales del Noroeste, S.A de C.V. | 423,787.078 E 3,333,878.085 N | Mining Concession | 9.0000 | March 5, 2002 | March 4, 2052 | 122 |
| Los Carlos 2 | 215707 | Molimentales del Noroeste, S.A de C.V. | 423,787.078 E 3,333,878.085 N | Mining Concession | 93.3800 | March 4, 2002 | March 5, 2052 | 1,264 |
| Los Carlos 3 | 225423 | Molimentales del Noroeste, S.A de C.V. | 423,787.078 E 3,333,878.085 N | Mining Concession | 177.6907 | September 6, 2005 | September 5, 2055 | 2,405 |
| Dulce | 228428 | Molimentales del Noroeste, S.A de C.V. | 472,205,063 E 3,348,823,297N | Mining Concession | 150.0000 | November 22, 2006 | November 21, 2056 | 2,030 |
| Dulce I | 240007 | Molimentales del Noroeste, S.A de C.V. | 503,058.158 E 3’384,863.624 N | Mining Concession | 4,325.6836 | March 29, 2012 | March 28, 2062 | 58,550 |
| Total: | - | - | - | - | 13,284.1934 | - | 179,806 |
Table provided by Goldgroup Mining Inc.
Notes:
1 Fees are estimated in US dollars based on the rates published in the “Diario Oficial de la Federación (DOF)”. The exchange rate used is 19 pesos = 1 US Dollar.
2 The table includes payment for both semesters of 2025.
| San Francisco Project | 25 | May 1, 2026 |
| Goldgroup Mining Inc. |
Figure 4.2
San Francisco Property (Concessions) Map
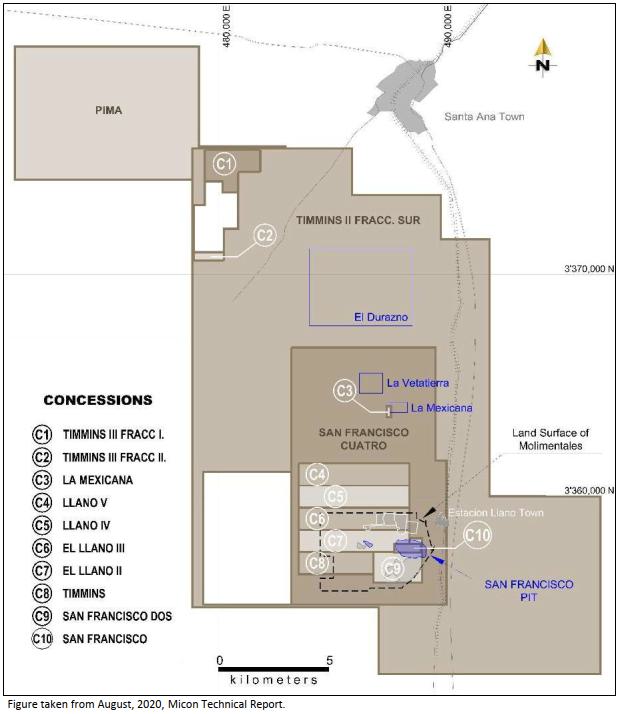
| San Francisco Project | 26 | May 1, 2026 |
| Goldgroup Mining Inc. |
Figure 4.3
San Francisco Project Regional Mineral Concessions Map
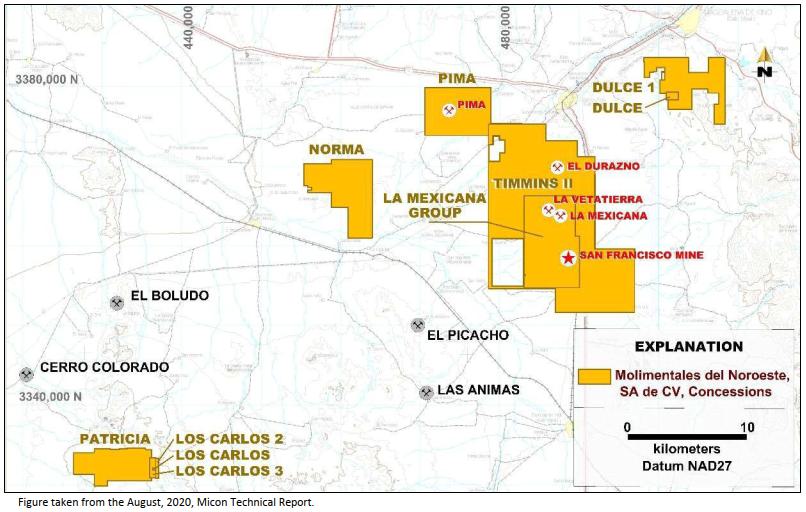
| San Francisco Project | 27 | May 1, 2026 |
| Goldgroup Mining Inc. |
Molimentales has completed the process of converting the 674 hectares contracted from the Los Chinos Ejido into private property. The 674 ha was purchased by Molimentales, in 2011, and the final public instrument documenting the purchase was issued on February 9, 2015.
Since completing the purchase of the 674 ha from the Los Chinos Ejido, Molimentales has not undertaken any further land purchases and believes no further purchases are necessary at this time.
A full history of the Ownership and development of the San Francisco Project is provided for in Section 6 of this Technical Report.
| 4.2.2 | Goldgroup Description of Acquisition Terms of Molimentales |
Subject to the final approval of the TSX Venture Exchange (the “TSXV”), Goldgroup Mining Inc. (“Goldgroup or the Company”) has acquired all of the issued and outstanding Series “A” shares in the fixed capital and all the issued and outstanding Series “B” shares in the variable capital (collectively the “Molimentales Shares”) of Molimentales del Noroeste, S.A. de C.V. (“Molimentales”) through a Concurso Mercantil process (restructuring proceeding equivalent to Chapter 11 in the United States). Goldgroup received approval from the Second District Court for Commercial Bankruptcy Matters (the “Mexican Court”) to the plan of arrangement (the “Plan of Arrangement”) the Company filed with the Mexican Court under the Concurso Mercantil process. The judgement issued by the Mexican Court in favour of Goldgroup’s Plan of Arrangement completes the bankruptcy and restructuring of Molimentales. Molimentales’ primary asset is the formerly producing San Francisco Mine, located in Sonora State, Mexico.
Goldgroup filed a proposal under the Concurso Mercantil process to acquire Molimentales under the Plan of Arrangement with the liquidator (the “Liquidator”) appointed by the Mexican Court to oversee Molimentales’ bankruptcy proceedings. The Plan of Arrangement was approved by over 50% of the recognized creditors of Molimentales as required under Mexican law, recommended by the Liquidator and subsequently filed with the Mexican Court for approval. The Mexican Court approved the Plan of Arrangement by judgement issued effective December 23rd, 2025. The acquisition of Molimentales will be subject to Goldgroup satisfying all the conditions of the Concurso, including paying all creditors under the Plan of Arrangement, all outstanding taxes and concession fees due to the Mexican government, as well as receiving final approval from the TSXV. With the Plan of Arrangement and together with the settlement of outstanding liabilities owed to the Mexican Government in order to maintain the San Francisco Mine in good standing, transfer of ownership of Molimentales and the San Francisco Mine and its associated assets, including mining concessions, processing plants, and all related infrastructure, to Goldgroup, will occur free and clear of all liens and liabilities. except for a 1% NSR on each of the following mining concessions: San Francisco, Patricia, Norma, La Pima, Dulce, and San Judas, and a 2% net smelter return (“NSR”) royalty on gold produced from the San Francisco Mine and surrounding mining concessions.
Prior to the filing of the Plan of Arrangement, Goldgroup acquired 60.24% of the debts owed to certain major creditors (the “Major Creditors”) as recognized by the Mexican Court for US$8,971,000 of which US$7,554,000 has been paid to date and the balance of US$1,417,000 will be paid to complete the acquisition. Under the terms of the Plan of Arrangement Goldgroup has agreed to pay US$2,566,098 in three equal instalments of US $855,366 each in December 2026, 2027 and 2028 to the remaining creditors holding 39.76% of the recognized debt in addition to all outstanding mining concession fees (including penalties and interest), taxes, fees owed to the National Water Commission, and certain expenses related to the Concurso proceedings all currently estimated at MX$140M (approximately US$8.0M). Some of the payments described above are facilitated through the Company acquiring the Molimentales Shares by paying the owners of the Molimentales Shares MX$100,000 and capitalizing Molimentales with MX$99.9M for a total of MX$100M.
| San Francisco Project | 28 | May 1, 2026 |
| Goldgroup Mining Inc. |
| 4.2.2.1 | Net Smelter Return Royalties |
The following describes the renegotiated terms for the 1% NSR formerly held by Sandstorm, now held by Royal Gold.
The Company’s San Francisco mining Project has the following obligations owed to SA Targeted Investing Corp., a subsidiary of Royal Gold Inc. (“Royal Gold”):
(i) Gold Delivery: Commencing 5 business days after restart of operations, and every month thereafter, Molimentales shall deliver 75 gold ounces per month for 20 months.
(ii) Net Smelter Royalty: the Company will pay to Royal Gold a 1% NSR on each of the following mining concessions: San Francisco, Patricia, Norma, La Pima, Dulce, and San Judas. The NSR will commence once the Gold Delivery obligation is complete.
| 4.3 | Mexican Mining Law |
When the Mexican mining law was amended in 2006, all mineral concessions granted by the Dirección General de Minas (DGM) became simple mining concessions and there was no longer a distinction between mineral exploration or exploitation concessions. A second change to the mining law resulted in all mining concessions being granted for a period of 50 years, provided that the concessions remained in good standing. As part of the second change, all former exploration concessions which were previously granted for a period of 6 years became eligible for the 50-year term.
On May 08, 2023, an amendment to the Mining Law was published in which, among other modifications, the 50-year term of mining concessions was reduced to a 30-year term renewable for two additional 25-year terms. This validity applies only to new concessions granted after the amendment, so the term of current mining concessions shall not be reduced. This amendment was challenged before the Supreme Court, and, if declared unconstitutional, the term of mining concessions shall remain as previously referred.
For any concession to remain valid, the bi-annual fees must be paid, and a report has to be filed during the month of May of each year which covers the work conducted during the preceding year. Concessions are extendable, provided that the application is made within the last two years and no later than one year prior to the expiry of the initial term. To obtain such extension, the bi-annual fee and work requirements must be in good standing, and necessary permits to conduct mining activities must be held. The bi-annual fee paid to the Mexican government for mining concessions of the San Francisco Project in 2025 amounted to approximately US$553,777 dollars; this amount is expected to increase slightly during 2026 to US$641,510.
| San Francisco Project | 29 | May 1, 2026 |
| Goldgroup Mining Inc. |
All mineral concessions must have their boundaries orientated astronomically north-south and east-west and the lengths of the sides must be one hundred metres or multiples thereof, except where these conditions cannot be satisfied because they border on other mineral concessions. The locations of the concessions are determined on the basis of a fixed point on the land, called the starting point, which is either linked to the perimeter of the concession or located thereupon. Prior to being granted a concession, the company must present a topographic survey to the DGM within 60 days of staking. Once this is completed the DGM will usually grant the concession.
| 4.4 | Permitting and Environmental |
Since the San Francisco Project is located on a number of concessions upon which mining has previously been conducted, all exploration work continues to be covered by the environmental permitting already in place and no further notice is required to be given to any division of the Mexican government. The specific environmental permitting of the San Francisco mine site was obtained in December, 2007, via an environmental assessment, and it is valid for the duration of the seven mining concessions that comprise the mine, provided that Molimentales keeps the permitting in good standing. Water for any drilling programs at the San Francisco Project is obtained from the on-site water wells.
| 4.5 | Micon’s QP Comments |
The San Francisco Project is sufficiently large enough to continue supporting year-round mining operations as well as further expansion.
| San Francisco Project | 30 | May 1, 2026 |
| Goldgroup Mining Inc. |
5 ACCESSIBILITY, CLIMATE, LOCAL RESOURCES, INFRASTRUCTURE AND PHYSIOGRAPHY
| 5.1 | Accessibility |
The San Francisco property is readily accessible from Hermosillo, the state capital of Sonora, via Mexican State Highway 15 (Pan American Highway). The property is 150 km north of Hermosillo and is 120 km south of the United States/Mexico border city of Nogales, also on Highway 15. The San Francisco mine site is 2 km west of the town of Estación Llano. The major population centre for the region is Magdalena de Kino (Magdalena) to the north, with a population of over 50,000 inhabitants. Figure 5.1 is a view of the San Francisco mine from Highway 15 driving south towards Hermosillo.
Figure 5.1
San Francisco Mine as Viewed from Highway 15 Driving South from Santa An
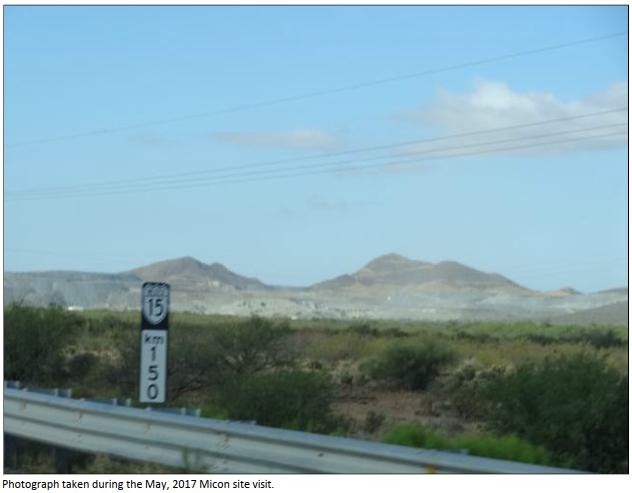
The mineral concessions are located approximately due west and north of Estación Llano, with the closest accommodations being in Santa Ana, a small city located to the north on Highway 15.
| San Francisco Project | 31 | May 1, 2026 |
| Goldgroup Mining Inc. |
| 5.2 | Climate and Physiography |
| 5.2.1 | Climate |
The Project is located in the Arizona-Sonora desert in the northern portion of the Mexican state of Sonora. The climate at the Project site ranges from semi-arid to arid. The average ambient temperature is 21°C, with minimum and maximum temperatures of -5ºC and 50ºC, respectively. The average annual rainfall for the area is 330 mm, with an upper extreme of 880 mm.
The wet season or desert monsoon season is between July and September and heavy rainfall can hamper exploration at times. Exploration and operations can be conducted on a year-round basis.
| 5.2.2 | Physiography |
The San Francisco property is situated within the southern Basin and Range physiographic province, which is characterized by elongate, northwest-trending ranges separated by wide alluvial valleys. The San Francisco mine is located in a relatively flat area of the desert with the topography ranging between 700 and 750 m above sea level.
The desert vegetation surrounding the San Francisco mine is composed of low-lying scrub, thickets and various types of cacti, with the vegetation type classified as Sarrocaulus Thicket. The state of Sonora is well known for its mining and cattle industries, although US manufacturing firms have moved into the larger centres as a result of the North American Free Trade Agreement (NAFTA). See Figure 5.2 for a view of the desert surrounding the San Francisco Project, between the distant hills, as viewed driving south towards the Project from the community of Santa Ana.
Figure 5.2
View of the Sonora Desert Surrounding the Property
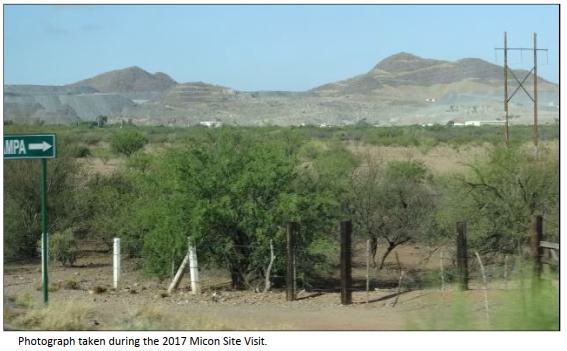
| San Francisco Project | 32 | May 1, 2026 |
| Goldgroup Mining Inc. |
| 5.3 | Local Resources and Infrastructure |
Guarded gates are maintained across the access road to the mine and immediate Project area. Exploration can be conducted throughout the year, with the desert monsoon season occurring between July and September. Materials needed to supply the mine are transported by either truck (utilizing Mexican State Highway 15) or by rail (utilizing the Ferrocarril del Pacifico railway), both of which pass through the community of Estación Llano.
Goldgroup owns the surface rights at the San Francisco mine granted by the DGM for the duration of the exploitation concessions. In the case of an exploration concession, the holder is granted temporary occupancy for the creation of land easements needed to carry out exploration for the duration of the mineral concession. In order to commence mining, the holder of the concession is required to negotiate the surface rights with the legal holder of these rights or to acquire the surface rights through a temporary expropriation. The current surface rights are more than adequate to cover the infrastructure, mining and stockpile areas needed for the life of the Project.
Water for the drilling programs is available from three wells located on the mine site. The water table in the area of the mine is approximately 25 m below the surface. A typical water well is shown in Figure 5.3.
Figure 5.3
View of a Water Well Located on the San Francisco Project
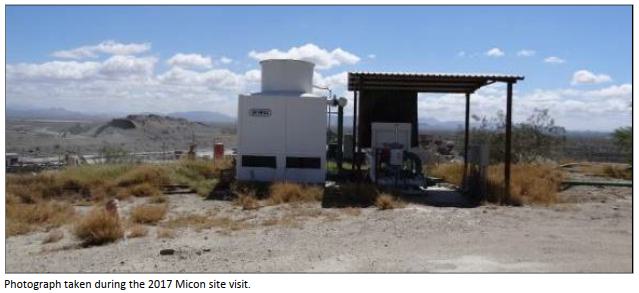
Figures 5.4 and 5.5 shows the current state of the San Francisco and La Chicharra Pits as of the December, 2025 site visit.
| San Francisco Project | 33 | May 1, 2026 |
| Goldgroup Mining Inc. |
Figure 5.4
San Francisco Pit, December, 2025
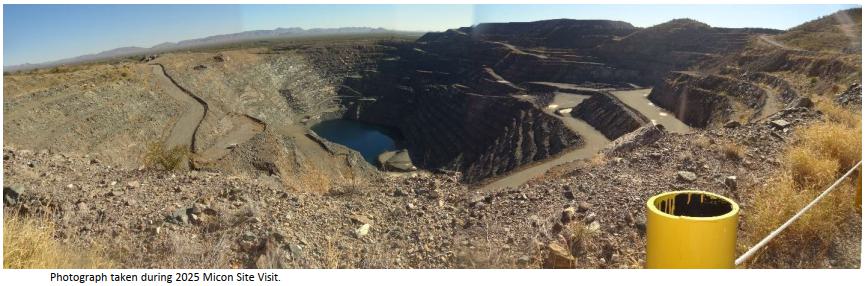
Figure 5.5
La Chicharra Pit, December, 2025
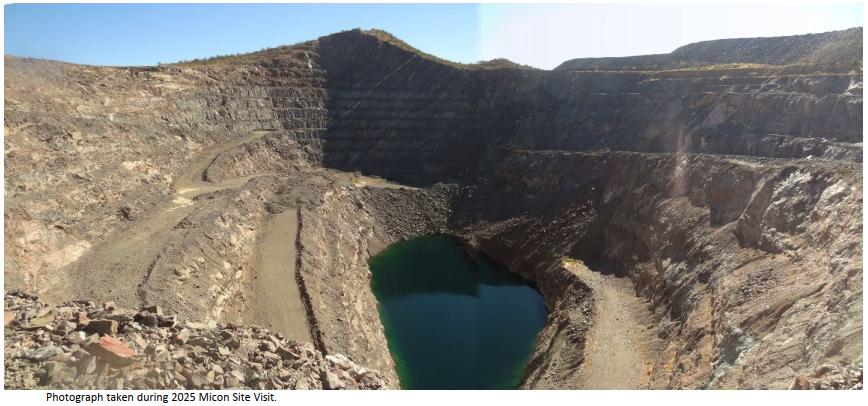
| San Francisco Project | 34 | May 1, 2026 |
| Goldgroup Mining Inc. |
6 HISTORY
| 6.1 | San Francisco Property and Gold Mine |
| 6.1.1 | General History of the San Francisco Property Prior to Timmins Gold Corp (Timmins) Ownership |
The San Francisco mine is a heap leach operation which was in production originally between 1995 and 2002. However, during the last two years of operation, gold was being recovered from the leach pads only, with no mining being conducted from the San Francisco and La Chicharra open pits.
Placer mining and small-scale underground mining began in the San Francisco mine area during the early 1940s. This limited work drew Fresnillo to the area in 1983. In 1985, three diamond drill holes and 30 conventional percussion drill holes were completed on the property. The results of these drill holes were encouraging enough to warrant additional diamond drilling during 1986. In 1987, 540 m of underground development was conducted, including a decline and a number of drifts and crosscuts. The decline was completed to the 685 m elevation above sea level, where numerous 1.8 by 1.5 m drifts and crosscuts were developed. Fresnillo drilled 10 diamond drill holes and 25 reverse circulation drill holes in 1988, and an additional 226 reverse circulation holes in 1989. Metallurgical testing and an induced polarization survey were also completed in 1989. In 1990 and 1991, Fresnillo completed an additional 108 reverse circulation drill holes. See Figure 6.1 for an example of one of the rotary drill site locations southeast of the main pit.
Figure 6.1
Location of One of the Rotary Drill Sites Located to Southeast of the Main Pit
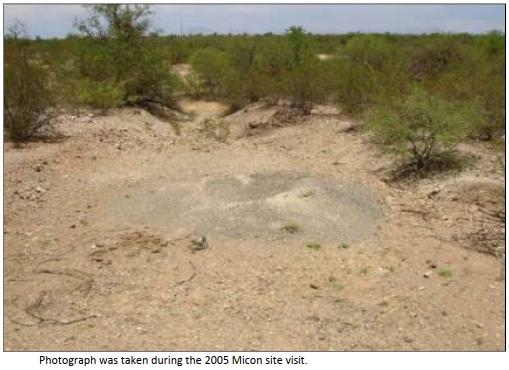
| San Francisco Project | 35 | May 1, 2026 |
| Goldgroup Mining Inc. |
Fresnillo decided to sell the property in 1992, at which time it was acquired by Geomaque. As part of the Geomaque purchase, Fresnillo retained a 3% NSR royalty and the option to re-acquire a 50% interest by paying Geomaque twice the amount which it had expended. Geomaque completed a feasibility study in 1993 and drilled a further 69 reverse circulation drill holes in 1994. Geomaque acquired the NSR royalty and option back from Fresnillo in 1995 for US$ 4,700,000.
Geomaque conducted its activities in Mexico through its subsidiaries, Geomaque de Mexico, S.A. de C.V. (Geomaque de Mexico) and Mina San Francisco, S.A. de C.V. (Mina San Francisco).
Geomaque began construction of the San Francisco mine in 1995, with production beginning late in that year. Production began at the rate of 3,000 t/d of ore or 30,000 oz/y of gold. As a result of the discovery of additional reserves, an expansion of the mining fleet, crushing system and gold recovery plant was undertaken in an effort to increase production to 10,000 t/d of ore. Due to the prevailing market conditions in February, 2000, Geomaque announced a revised mine plan whereby higher-grade ore with a lower stripping ratio would be mined from the San Francisco pit and the La Chicharra deposit, which is located west of the San Francisco pit.
The San Francisco area contained the El Manto, the San Francisco, the En Medio and the El Polvorin deposits. All of these deposits were later incorporated into the main San Francisco pit. The La Chicharra zone was mined during the last two years of production as a second pit.
Mining ended and the operation entered into a leach-only mode in November, 2000. In May, 2002, the last gold pour was conducted, the plant was mothballed, and clean-up activities at the mine site began. See Figure 6.2 for a photographic overview of the San Francisco pit and leach pad taken from a hill to the southwest of the mine site prior to the current phase of production. Much of the foreground now is within the limits of the pit.
Figure 6.2
View of the San Francisco Gold Mine with Estación Llano in the Background (Looking Northeast)
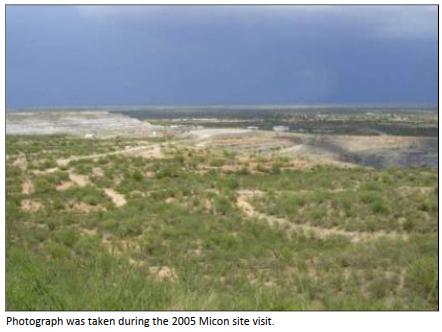
| San Francisco Project | 36 | May 1, 2026 |
| Goldgroup Mining Inc. |
In 2001, to settle debts related to lease arrangements of construction equipment to Geomaque de Mexico, Butler Machinery Co. (Butler) accepted a payment of US$ 500,000, the proceeds in excess of US$ 500,000 on the sale of certain equipment from the San Francisco mine and a 1% net smelter return (NSR) royalty on any future gold production from the unmined resources in the main pit of the San Francisco mine. No present value was ascribed to the rights at the time of the agreement. Micon was advised by Timmins that the agreement between Geomaque and Butler had ended and that it has received an opinion that the property was transferred to Molimentales free of any royalties. It was the opinion of Timmin’s solicitors that Timmins had free and clear title to the equipment on the property and no obligations to pay any NSR royalties.
Geomaque signed a Surface Rights Agreement with a group of rights holders (the Ejido Jesus Garcia Heroe De Nacozari (Ejido Jesus Garcia)). Based on a letter agreement dated July 7, 1999, the Ejido Jesus Garcia agreed to transfer to Geomaque a surface area of 800 ha, for a total consideration of US$ 1,000,000, of which US$ 75,000 was due and payable on signing of the agreement. The letter agreement and its efficacy were the subject of litigation between Geomaque and the Ejido Jesus Garcia, whereby Geomaque sought to have the agreement declared void, its deposit returned and other remedies, and the Ejido Jesus Garcia sought to have the agreement held effective and sought, inter alia, the payment of the balance of the purchase price and other relief.
In the summer of 2003, Geomaque sought and received shareholder approval to amalgamate the corporation under a new Canadian company, Defiance Mining Corporation (Defiance).
On November 24, 2003, Defiance sold its Mexican subsidiaries, Geomaque de Mexico and Mina San Francisco, to the Astiazaran family and their private Mexican company for a total consideration of US$ 235,000. The Mexican subsidiaries held the San Francisco gold mine and the sale relieved Defiance of long-term liabilities totalling US$ 1,900,000, including a US$ 925,000 surface rights purchase obligation, approximately US$ 760,000 in reclamation provisions and other payables totalling US$ 263,000. The litigation of the surface rights between the Ejido Jesus Garcia and Geomaque de Mexico was settled in favour of Geomaque de Mexico on January 20, 2005. Geomaque de Mexico was granted by the DGM the temporary occupation of surface rights at the San Francisco mine for the duration of the exploitation concessions.
Since June, 2006, the Astiazaran family and their company, Desarrollos Prodesa S.A. de C.V. (Prodesa) have retained ownership of the waste dumps and the original leach pads and have been extracting sand and gravel intermittently for use in highway construction and other construction projects. Figure 6.3 is a view of gravel extraction from the original leach pads at the San Francisco mine site in 2005. The reprocessing and extraction of sand and gravel material has continued from the original leach pads and was ongoing during the 2013, 2016 and 2017 site visits.
| 6.1.2 | Timmins Gold Corp (Timmins, later Alio Gold Inc. (Alio)) Incorporation and Ownership of the San Francisco Project |
Timmins Gold Corp. (Timmins) was incorporated on March 17, 2005 under the Business Corporations Act ( British Columbia) and changed its name to Alio Gold Inc. on May 12, 2017. Timmins originally acquired the exploitation concessions covering the San Francisco Project through its wholly owned Mexican subsidiary, via an option agreement with Geomaque de Mexico on April 18, 2005. That option agreement was subsequently superseded by an acquisition agreement. Initially, Timmins had the option to earn a 50% interest in the exploitation concessions by spending US$ 2,500,000 on exploration and development over a two-year period and, after Timmins had earned its interest, the property would be operated as a joint venture, with Timmins as the operator.
| San Francisco Project | 37 | May 1, 2026 |
| Goldgroup Mining Inc. |
Figure 6.3
Extraction of Gravel from the Original Leach Pads for Construction Use
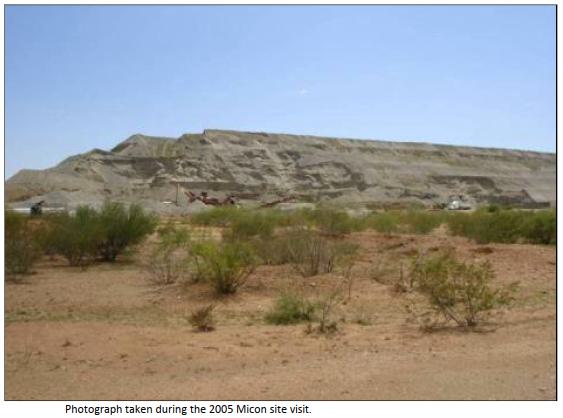
In a press release dated March 19, 2007, Timmins announced that it had entered into an agreement to acquire a 100% interest in Molimentales, a company specifically formed to own 100% of the past producing San Francisco mine. On October 29, 2007, Timmins announced that it had paid the full and final US$ 2.5 million to complete the acquisition of the San Francisco mine.
In April, 2010, Timmins announced that the San Francisco mine had entered back into production.
On March 23, 2011, Timmins announced that its common shares were, as of that date, listed for trading on the Toronto Stock Exchange (TSX) and delisted from the TSX Venture Exchange (TSX-V).
On November 1, 2011, Timmins announced that its common shares would be listed for trading on the NYSE Amex under the ticker symbol TGD as of November 4, 2011. It also noted that the shares would continue to trade on TSX.
On May 12, 2017, Timmins announced that its shareholders had approved its name change from Timmins Gold Corp. to Alio Gold Inc.
| San Francisco Project | 38 | May 1, 2026 |
| Goldgroup Mining Inc. |
During 2019, Alio ceased processing material from the open pits and concentrated on processing material from the stockpiles.
| 6.1.3 | Magna Gold Corp. (Magna) Incorporation and Ownership of the San Francisco Project |
On March 6, 2020, Magna announced that it has entered into a definitive purchase agreement with Timmins Gold Corp Mexico S.A. de C.V. (Timmins), a wholly owned subsidiary of Alio Gold Inc. (Alio), to acquire the San Francisco mine. Under the terms of the definitive purchase agreement, Magna acquired 100% of Alio’s indirect wholly owned subsidiary Molimentales del Noroeste, S.A. de C.V., which owns a 100% interest in the San Francisco mine and the surrounding mineral concessions.
On May 6, 2020, Magna announced that it had closed the acquisition of the San Francisco mine pursuant to a definitive share purchase agreement dated March 5, 2020, as amended April 24, 2020, between Timmins, a wholly owned subsidiary of Alio, and itself.
On June 29, 2021, Magna announced it had achieved full-scale and steady state commercial production at the San Francisco Mine. Commercial production was achieved on June 1, 2021.
On March 3, 2023, Magna together with its direct and indirect subsidiaries, announced that it had filed a Notice of Intention to Make a Proposal (the "NOI") under the Bankruptcy and Insolvency Act (Canada) which will provide creditor protection while Magna restructured its affairs. KSV Restructuring Inc. was appointed as proposal trustee under the NOI to monitor Magna's operations and restructuring. The effect of the NOI is an initial and immediate stay of proceedings in favour of Magna Gold for 30 days, which stay can be extended by court order.
In coordination with the NOI, Magna's indirect subsidiary, Molimentales filed an application for restructuring (solicitud de concurso mercantil en fase de concurso) and provisional creditor protection (medidas cautelares) (the Insolvency Application) before the Second District Court for Insolvency Matters located in Mexico City, Mexico (Juzgado Segundo de Distrito en Materia de Concursos Mercantiles con Residencia en la Ciudad de México y Jurisdicción en toda la República Mexicana; the "Concurso Court") under the Mercantile Insolvency Act (Ley de Concursos Mercantiles). Molimentales is the owner and operator of the Company's San Francisco Mine. The initial ruling in connection with the Insolvency Application was issued by the Concurso Court on March 3, 2023 and certain pre-emptive protections were granted in favour of Molimentales including, inter alia, a suspension of all enforcement proceedings against the assets or rights of Molimentales.
As a result of the bankruptcy, the TSX Venture Exchange (TSXV) advised Magna that the trading of Magna's common shares would be transferred to the NEX Board of the TSXV effective at the opening of the market on March 8, 2023.
In the proceedings of bankruptcy 8/2023, filed by Molimentales del Noroeste, Sociedad Anonima de Capital Variable, on April 5, 2024, a judgment was issued declaring the merchant Molimentales del Noroeste, Sociedad Anonima de Capital Variable, to be outright bankrupt.
Effective Dec 24, 2024, Magna Gold Corp. was delisted from the NEX for failure to maintain exchange requirements; however, its shares had been suspended prior to delisting.
| San Francisco Project | 39 | May 1, 2026 |
| Goldgroup Mining Inc. |
On December 24, 2025 Goldgroup announced that “subject to the final approval of the TSX Venture Exchange (the “TSXV”), it has acquired all of the issued and outstanding Series “A” shares in the fixed capital and all the issued and outstanding Series “B” shares in the variable capital (collectively the “Molimentales Shares”) of Molimentales del Noroeste, S.A. de C.V. (“Molimentales”) through a Concurso Mercantil process (restructuring proceeding equivalent to Chapter 11 in the United States). Goldgroup received approval from the Second District Court for Commercial Bankruptcy Matters (the “Mexican Court”) to the plan of arrangement (the “Plan of Arrangement”) the Company filed with the Mexican Court under the Concurso Mercantil process. The judgement issued by the Mexican Court in favour of Goldgroup’s Plan of Arrangement completes the bankruptcy and restructuring of Molimentales. Molimentales’ primary asset is the formerly producing San Francisco Mine and mineral concessions, located in Sonora State, Mexico.
As of December, 2025, no mining is being conducted at the San Francisco mine and previous care and maintenance activities resulted in a complete safe shut down of the heap leach activities.
| 6.2 | Historical Resource and Reserve Estimates |
Historical mineral resource and reserve estimates for the San Francisco Project date back to the 1990s; however, all of these historical mineral resource and reserve estimates have been superseded by the mineral resource estimate contained in Section 14 of this Technical Report. Since all the historical mineral resource and reserve estimates have been superseded by the current mineral resource estimate contained in Section 14 of this report, they will not be discussed further in this report.
| 6.3 | Historical Production from the San Francisco Mine |
| 6.3.1 | Historical Production |
| 6.3.1.1 | Historical Production from 1996 to 2002 (Geomaque) |
Historical production occurred at the San Francisco gold mine between 1996 and 2002. Production was conducted using open pit mining methods, with gold recovered by heap leaching. During this production phase, the San Francisco mine extracted 13,490,184 t at a grade of 1.13 g/t gold for a total of 488,680 contained ounces of gold (Table 6.1). A total of 300,281 oz gold and 96,149 oz of silver were recovered, with the gold recovery estimated to be 61.4%.
| 6.3.1.2 | Historical Production from April, 2010 to 2019 (Timmins/Alio) |
The San Francisco mine resumed commercial production in April, 2010. Table 6.2 summarizes production from April, 2010 to the end of 2019, by quarter. Ore of lower grade was stockpiled for processing at the end of the mine life. Alio reports that, at the end of March, 2016, a total of 8.121 Mt at an average grade of 0.260 g/t gold had been placed on the low-grade stockpile since 2010, as shown in Table 6.3. As the end of December, 2019, Alio had processed from the stockpiles a total of 7.406 Mt at an average grade of 0.224 g/t gold.
| San Francisco Project | 40 | May 1, 2026 |
| Goldgroup Mining Inc. |
Table 6.1
San Francisco Project, Geomaque Annual Production 1996 to 2002
| Year | Dry
Crush on Pads (t) |
Grade (g/t) |
Ounces on Pad |
Gold/Silver
Ounces Doré |
Gold
Ounces Doré |
Gold Recovered (%) |
| 1996 | 1,735,550 | 1.32 | 73,655 | 46,787 | 36,127 | 49.0 |
| 1997 | 2,288,662 | 1.12 | 82,412 | 75,847 | 54,519 | 66.2 |
| 1998 | 3.074,902 | 1.05 | 103,803 | 86,940 | 58,808 | 56.7 |
| 1999 | 3,010,639 | 1.14 | 110,345 | 98,726 | 64,371 | 58.3 |
| 2000 | 3,380,431 | 1.09 | 118,465 | 104,953 | 69,100 | 58.3 |
| 2001 | 17,092 | |||||
| 2002 | 264 | |||||
| Total | 13,490,184 | 1.13 | 488,680 | 300,281 | 61.4 |
Note: 301,893 tonnes of mineral and 975,900 tonnes of waste rock were mined in 1995.
Table taken from the 2006 San Francisco Scoping Study by Sol & Adobe Ingenieros Asociados S.A. de C.V.
Table 6.2
San Francisco Project, Timmins/Alio Annual Production from April, 2010 to the End of December, 2019 (by Quarter)
| Year | Quarter | Total
Ore Extracted (dry tonnes) |
Avg
Grade Extracted (g/t Gold) |
Total
Gold Extracted (oz Au) |
ROM extracted |
Avg
Grade Extracted (g/t Gold) |
Waste
Mined (dry tonnes) |
Strip Ratio (w:o) |
Processed
Ore (dry tonnes) |
Avg
(g/t Gold) |
Gold
Placed on Leach Pad (oz Au) |
Gold
Sold (oz Au) |
Days
in Quarter |
Average
Ore Mined (tonnes/day) |
Average
Ore Processed (tonnes/day) |
Total
Mined (tonnes/day) |
| 2010 | April – June | 989,146 | 0.768 | 24,427 | 0 | 0 | 4,057,842 | 4.10 | 905,296 | 0.718 | 20,904 | 10,375 | 91 | 10,870 | 9,948 | 55,461 |
| July – September | 1,110,169 | 0.862 | 30,756 | 0 | 0.000 | 3,630,021 | 3.27 | 1,090,768 | 0.817 | 28,667 | 15,685 | 92 | 12,067 | 11,856 | 51,524 | |
| October - December | 1,271,281 | 0.947 | 38,712 | 0 | 0.000 | 4,498,925 | 3.54 | 1,208,677 | 0.939 | 36,483 | 20,030 | 92 | 13,818 | 13,138 | 62,720 | |
| 2011 | January – March | 1,624,297 | 0.721 | 37,656 | 0 | 0.000 | 4,701,677 | 2.90 | 1,207,339 | 0.895 | 34,743 | 17,020 | 90 | 18,048 | 13,415 | 70,289 |
| April – June | 1,648,231 | 0.762 | 40,370 | 0 | 0.000 | 4,239,137 | 2.57 | 1,239,075 | 0.859 | 34,235 | 16,676 | 91 | 18,112 | 13,616 | 64,696 | |
| July – September | 2,030,276 | 0.650 | 42,429 | 0 | 0.000 | 5,097,292 | 2.51 | 1,364,290 | 0.804 | 35,282 | 17,287 | 92 | 22,068 | 14,829 | 77,474 | |
| October - December | 2,097,621 | 0.582 | 39,282 | 0 | 0.000 | 4,160,488 | 1.98 | 1,327,299 | 0.778 | 33,195 | 21,524 | 92 | 22,800 | 14,427 | 68,023 | |
| 2012 | January – March | 2,092,389 | 0.593 | 39,864 | 0 | 0.000 | 3,879,662 | 1.85 | 1,255,477 | 0.772 | 31,150 | 21,532 | 91 | 22,993 | 13,796 | 65,627 |
| April – June | 2,098,087 | 0.656 | 44,274 | 0 | 0.000 | 4,342,495 | 2.07 | 1,347,112 | 0.901 | 39,028 | 23,203 | 91 | 23,056 | 14,803 | 70,776 | |
| July – September | 2,266,504 | 0.646 | 47,090 | 0 | 0.000 | 4,210,428 | 1.86 | 1,420,414 | 0.887 | 40,490 | 25,154 | 92 | 24,636 | 15,439 | 70,401 | |
| October - December | 1,867,512 | 0.707 | 42,439 | 0 | 0.000 | 5,295,383 | 2.84 | 1,493,623 | 0.819 | 39,339 | 24,556 | 92 | 20,299 | 16,235 | 77,858 | |
| 2013 | January – March | 2,113,611 | 0.712 | 48,383 | 0 | 0.000 | 6,375,048 | 3.02 | 1,787,262 | 0.825 | 47,434 | 28,328 | 90 | 23,485 | 19,858 | 94,318 |
| April – June | 2,233,783 | 0.702 | 50,394 | 0 | 0.000 | 6,235,920 | 2.79 | 1,848,832 | 0.814 | 48,380 | 28,024 | 91 | 24,547 | 20,317 | 93,074 | |
| July – September | 2,110,667 | 0.684 | 46,425 | 0 | 0.000 | 5,441,889 | 2.58 | 1,815,709 | 0.771 | 45,016 | 29,139 | 92 | 22,942 | 19,736 | 82,093 | |
| October – December | 2,284,242 | 0.737 | 54,118 | 0 | 0.000 | 5,307,526 | 2.32 | 2,014,968 | 0.872 | 56,504 | 34,166 | 92 | 24,829 | 21,902 | 82,519 | |
| 2014 | January – March | 2,373,603 | 0.727 | 55,477 | 0 | 0.000 | 5,520,468 | 2.33 | 2,122,650 | 0.760 | 51,838 | 35,413 | 90 | 26,373 | 23,585 | 87,712 |
| April – June | 2,461,018 | 0.625 | 49,467 | 0 | 0.000 | 5,810,088 | 2.36 | 2,184,316 | 0.650 | 45,616 | 32,932 | 91 | 27,044 | 24,003 | 90,891 | |
| July – September | 2,017,523 | 0.561 | 36,359 | 0 | 0.000 | 6,208,303 | 3.08 | 2,213,740 | 0.504 | 35,889 | 26,675 | 92 | 21,930 | 24,062 | 89,411 | |
| October – December | 1,944,436 | 0.650 | 40,656 | 0 | 0.000 | 6,417,044 | 3.30 | 2,101,873 | 0.563 | 38,078 | 25,007 | 92 | 21,135 | 22,846 | 90,886 | |
| 2015 | January – March | 2,086,331 | 0.563 | 37,779 | 0 | 0.000 | 5,997,897 | 2.88 | 2,074,788 | 0.532 | 35,469 | 24,155 | 90 | 23,181 | 23,053 | 89,825 |
| April – June | 2,118,215 | 0.565 | 38,476 | 0 | 0.000 | 7,151,798 | 3.38 | 2,252,591 | 0.527 | 38,176 | 22,869 | 91 | 23,277 | 24,754 | 101,868 | |
| July – September | 1,962,879 | 0.548 | 34,601 | 0 | 0.000 | 7,000,474 | 3.57 | 2,200,292 | 0.510 | 36,072 | 23,387 | 92 | 21,336 | 23,916 | 97,428 | |
| October – December | 1,712,867 | 0.486 | 26,788 | 0 | 0.000 | 6,857,052 | 4.00 | 1,921,060 | 0.458 | 28,314 | 22,787 | 92 | 18,618 | 20,881 | 93,151 | |
| 2016 | January – March | 1,999,320 | 0.620 | 39,840 | 0 | 0.000 | 4,708,661 | 2.36 | 2,003,712 | 0.622 | 40,038 | 25,121 | 91 | 21,971 | 22,019 | 73,714 |
| April – June | 1,848,675 | 0.604 | 35,892 | 0 | 0.000 | 3,729,153 | 2.02 | 1,939,567 | 0.604 | 37,640 | 25,863 | 91 | 20,315 | 21,314 | 61,295 | |
| July – September | 1,745,081 | 0.604 | 33,901 | 0 | 0.000 | 3,724,904 | 2.14 | 1,791,399 | 0.610 | 35,135 | 24,053 | 92 | 18,968 | 19,472 | 59,456 | |
| October - December | 1,864,407 | 0.486 | 29,123 | 0 | 0.000 | 2,365,312 | 1.27 | 1,917,965 | 0.482 | 29,703 | 25,287 | 92 | 20,265 | 20,847 | 45,975 | |
| 2017 | January – March | 1,942,117 | 0.485 | 30,255 | 0 | 0.000 | 3,241,871 | 1.67 | 1,963,307 | 0.475 | 29,996 | 26,048 | 90 | 21,579 | 21,815 | 57,600 |
| April – June | 1,651,256 | 0.523 | 27,779 | 0 | 0.000 | 4,300,791 | 2.61 | 1,933,253 | 0.466 | 28,958 | 22,012 | 91 | 18,146 | 21,245 | 65,407 | |
| July – September | 1,645,607 | 0.468 | 24,750 | 0 | 0.000 | 5,184,524 | 3.15 | 1,916,332 | 0.400 | 24,616 | 19,428 | 92 | 17,887 | 20,830 | 74,241 | |
| October - December | 1,709,950 | 0.533 | 29,326 | 53,311 | 0.193 | 6,232,422 | 3.65 | 1,777,461 | 0.449 | 25,632 | 16,069 | 92 | 18,586 | 19,320 | 86,330 | |
| 2018 | January – March | 1,725,744 | 0.481 | 26,683 | 1,100,860 | 0.168 | 5,810,318 | 3.37 | 1,714,564 | 0.416 | 22,960 | 16,860 | 90 | 19,175 | 19,051 | 83,734 |
| April – June | 1,620,935 | 0.433 | 22,574 | 543,376 | 0.171 | 4,038,721 | 2.49 | 1,617,158 | 0.463 | 24,086 | 13,534 | 91 | 17,812 | 17,771 | 62,194 | |
| July – September | 1,539,587 | 0.481 | 23,816 | 117,788 | 0.141 | 1,984,781 | 1.29 | 1,602,613 | 0.481 | 24,770 | 10,857 | 92 | 16,735 | 17,420 | 38,308 | |
| October - December | 1,159,962 | 0.478 | 17,838 | 0 | 0.000 | 3,618,151 | 3.12 | 1,576,781 | 0.418 | 21,168 | 10,136 | 92 | 12,608 | 17,139 | 51,936 | |
| 2019 | January – March | 0 | 0.000 | 0 | 0 | 0.000 | 0 | 0.00 | 1,619,443 | 0.274 | 14,290 | 10,876 | 90 | 0 | 17,994 | 0 |
| April – June | 0 | 0.000 | 0 | 0 | 0.000 | 0 | 0.00 | 1,744,165 | 0.274 | 15,349 | 10,204 | 91 | 0 | 19,167 | 0 | |
| July – September | 0 | 0.000 | 0 | 0 | 0.000 | 0 | 0.00 | 1,607,925 | 0.248 | 12,809 | 8,167 | 92 | 0 | 17,477 | 0 | |
| October - December | 0 | 0.000 | 0 | 0 | 0.000 | 0 | 0.00 | 1,183,727 | 0.228 | 8,665 | 7,097 | 92 | 0 | 12,867 | 0 | |
| Total | 64,967,330 | 0.617 | 1,287,999 | 1,815,336 | 0.168 | 171,376,466 | 2.64 | 66,306,823 | 0.599 | 1,276,118 | 817,534 | 3,562 | 20,321 | 18,615 | 73,927 |
| San Francisco Project | 41 | May 1, 2026 |
| Goldgroup Mining Inc. |
Table extracted from the August, 2020, Technical Report by Micon.
NOTES:
| · | Alio's management team decided to process ROM ore by the end of 2017. The record of this ore is not reflected in the above table. Approximately 1.8 Mt were processed in this manner. | |
| · | From Q4, 2018 till Q4, 2019, the low-grade ore stockpiled was processed and placed on pads. | |
| · | Total Ore Extracted columns take into account the low-grade ore sent to stockpile. | |
| · | Total Processed Ore columns include the low-grade ore rehandled and processed. These figures do not reflect the ROM ore extracted and placed over pads. |
| San Francisco Project | 42 | May 1, 2026 |
| Goldgroup Mining Inc. |
Table 6.3
San Francisco Project, Timmins/Alio Annual Ore Stockpiled and Processed from April, 2010 to the End of December, 2019 (by Quarter)
| Year | Quarter | Low-Grade Stockpile (Dry Tonnes) | Average Grade (g/t Gold) | Gold Oz Stockpiled | Low-Grade Processed (Dry tonnes) | Average Grade (g/t Gold) | Ounces LG Processed (oz Au) |
| 2010 | April – June | 77,828 | 0.366 | 916 | 0 | 0.000 | 0 |
| July - September | 24,324 | 0.344 | 269 | 0 | 0.000 | 0 | |
| October - December | 48,730 | 0.320 | 501 | 0 | 0.000 | 0 | |
| 2011 | January - March | 395,254 | 0.258 | 3,283 | 0 | 0.000 | 0 |
| April – June | 379,778 | 0.276 | 3,371 | 0 | 0.000 | 0 | |
| July - September | 671,185 | 0.276 | 5,960 | 0 | 0.000 | 0 | |
| October - December | 812,586 | 0.274 | 7,160 | 0 | 0.000 | 0 | |
| 2012 | January - March | 804,585 | 0.271 | 7,001 | 0 | 0.000 | 0 |
| April – June | 791,775 | 0.252 | 6,414 | 0 | 0.000 | 0 | |
| July - September | 842,973 | 0.229 | 6,197 | 0 | 0.000 | 0 | |
| October - December | 526,800 | 0.265 | 4,487 | 0 | 0.000 | 0 | |
| 2013 | January - March | 399,784 | 0.261 | 3,354 | 0 | 0.000 | 0 |
| April – June | 456,950 | 0.248 | 3,645 | 0 | 0.000 | 0 | |
| July – September | 445,603 | 0.255 | 3,660 | 0 | 0.000 | 0 | |
| October - December | 349,338 | 0.253 | 2,839 | 0 | 0.000 | 0 | |
| 2014 | January - March | 288,021 | 0.259 | 2,396 | 0 | 0.000 | 0 |
| April – June | 399,075 | 0.245 | 3,140 | 124,606 | 0.286 | 1,147 | |
| July – September | 67,598 | 0.245 | 533 | 148,021 | 0.282 | 1,344 | |
| October - December | 158,625 | 0.225 | 1,146 | 260,406 | 0.291 | 2,435 | |
| 2015 | January - March | 112,206 | 0.257 | 927 | 0 | 0.000 | 0 |
| April – June | 47,446 | 0.283 | 432 | 45,106 | 0.259 | 376 | |
| July – September | 16,030 | 0.409 | 211 | 20,055 | 0.259 | 167 | |
| October - December | 968 | 0.328 | 10 | 0 | 0.000 | 0 | |
| 2016 | January - March | 3,966 | 0.244 | 31 | 0 | 0.000 | 0 |
| April – June | 0 | 0.000 | 0 | 0 | 0.000 | 0 | |
| July - September | 0 | 0.000 | 0 | 0 | 0.000 | 0 | |
| October - December | 0 | 0.000 | 0 | 0 | 0.000 | 0 | |
| 2017 | January - March | 0 | 0.000 | 0 | 0 | 0.000 | 0 |
| April – June | 0 | 0.000 | 0 | 129,525 | 0.250 | 1,041 | |
| July - September | 0 | 0.000 | 0 | 130,063 | 0.250 | 1,045 | |
| October - December | 0 | 0.000 | 0 | 13,100 | 0.250 | 105 | |
| 2018 | January - March | 0 | 0.000 | 0 | 0 | 0.000 | 0 |
| April – June | 0 | 0.000 | 0 | 0 | 0.000 | 0 | |
| July - September | 0 | 0.000 | 0 | 38,082 | 0.250 | 306 | |
| October - December | 0 | 0.000 | 0 | 341,788 | 0.242 | 2,657 | |
| 2019 | January - March | 0 | 0.000 | 0 | 1,619,443 | 0.218 | 11,335 |
| April – June | 0 | 0.000 | 0 | 1,744,165 | 0.217 | 12,157 | |
| July - September | 0 | 0.000 | 0 | 1,607,925 | 0.214 | 11,040 | |
| October - December | 0 | 0.000 | 0 | 1,183,727 | 0.212 | 8,073 | |
| Total | 8,121,427 | 0.260 | 67,883 | 7,406,012 | 0.224 | 53,230 |
Table extracted from the August, 2020, Technical Report by Micon.
| San Francisco Project | 43 | May 1, 2026 |
| Goldgroup Mining Inc. |
During July, 2011, Alio expanded the crushing system to 15,000 t/d. In December, 2012, a new crushing circuit was installed to provide an additional capacity of 5,000 t/d. In August, 2013, the second crushing circuit was expanded by 2,000 t/d. The processing rate at the time of the 2017 Micon Technical Report was 22,000 t/d and had been operating at this rate since the 2013 Micon Technical Report was released. During 2019, Alio ceased processing material from the open pits and concentrated on processing material from the stockpiles. When Magna acquired the Project in 2020 the operation was on residual leach.
| 6.3.1.3 | Historical Production from 2020 to June, 2023 (Magna) |
On May 6, 2020, Magna announced that it had closed the acquisition of the San Francisco mine pursuant to a definitive share purchase agreement between Timmins, a wholly owned subsidiary of Alio, and itself.
On June 29, 2021, Magna announced it had achieved full-scale and steady state commercial production at the San Francisco Mine. Commercial production was achieved on June 1, 2021.
On March 3, 2023, Magna together with its direct and indirect subsidiaries, announced that it had filed a Notice of Intention to Make a Proposal under the Bankruptcy and Insolvency Act (Canada) which provided creditor protection while Magna restructured its affairs.
Table 6.4 summarizes production by Magna from 2020 to June, 2023.
Table 6.4
San Francisco Project, Magna’s Annual Production from 2020 to June, 2023
| Year | Total
Material Deposited (t) |
Ounces
Gold (oz Au) |
Gold
Ounces Deposited (oz Au) |
Percent
Recovery by Rock Type (%) |
Recoverable Gold Ounces (oz Au) |
Produced
Gold Ounces (oz Au) |
| 2020 | 1,728,296 | 0.338 | 18,770 | 67.82 | 13,151 | 26,310 |
| 2021 | 5,536,786 | 0.450 | 80,145 | 70.36 | 58,473 | 56,100 |
| 2022 | 4,286,629 | 0.334 | 46,021 | 65.51 | 30,146 | 36,944 |
| 2023* | 4,031 | |||||
| Total: | 11,551,711 | 144,936 | 101,770 | 123,384 |
*Note: From Leach Pads.
Table by Micon, December, 2025.
| San Francisco Project | 44 | May 1, 2026 |
| Goldgroup Mining Inc. |
7 GEOLOGICAL SETTING AND MINERALIZATION
| 7.1 | Regional Geology |
The following descriptions of the regional geology were extracted from Prenn (1995):
“The San Francisco property is situated in a belt of metamorphic rocks that hosts numerous gold occurrences along the trace of the Mojave-Sonora megashear, which trends southeast from south-central California into Sonora. The megashear is a left-lateral transform fault which became active during the Jurassic period and exhibits up to 800 km of displacement. Deformation along the megashear occurred along with metamorphism (Calmus et al, 1992) and since the formation of the megashear the area has been subjected to both tectonic compressional and tensional forces.”
“The following description is extracted from Silberman (1992). The northwest-trending range-front faults and numerous low-angle shear zones related to thrust or detachment faults are the most common structures. The Mojave-Sonora megashear as defined by Silver and Anderson (1974) is a regional northwest-trending feature. It separates the Precambrian basement rocks of slightly differing ages. The Jurassic rocks which occupy the zone are strongly deformed along low-angle thrust faults and the associated sedimentary rocks are tightly folded. The south-western boundary of the megashear appears to be a major fault that juxtaposes Precambrian basement rocks against the Jurassic magmatic terrane (Anderson and Silver, 1979). Up to 800 km of left lateral movement has been proposed for this shear after the Middle Jurassic period. Others (Jaques et al., 1989) have suggested that the megashear is a Cretaceous thrust front reactivated as a middle Tertiary detachment. The metamorphism in the area has been postulated to have occurred with the megashear or the magmatic activity of the Middle to Late Jurassic periods (Tosdal et al, 1989). However, others propose a close relationship between deformation and the closing of the marginal basin after its subduction below the volcanic arc, or the result of Late Cretaceous or Tertiary compression associated with uplift and low-grade metamorphism (De Jong et al, 1988). Calmus (1992) believes it is unquestionable that a Cretaceous-Tertiary (Larimide) tectonic event occurred but that it is superimposed upon older Nevada and Lower Cretaceous compressional and extensional phases. Many of the Sonoran gold deposits are located at or near the Mojave-Sonora megashear.”
The Basin and Range province, which extends into Sonora from the United States, is characterized by northwest-trending valleys and ranges. Paleozoic rocks, including quartzite and limestone, overlie the Precambrian locally. The valleys are covered and in-filled by recent gravels. See Figure 7.1 for the regional geology map of the San Francisco mine area and location of the San Francisco and La Chicharra pits.
| San Francisco Project | 45 | May 1, 2026 |
| Goldgroup Mining Inc. |
Figure 7.1
Regional Geology of the San Francisco Project
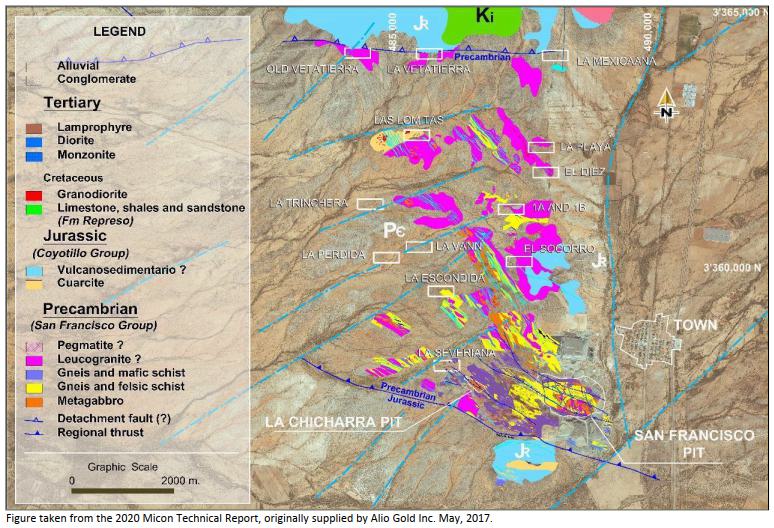
| San Francisco Project | 46 | May 1, 2026 |
| Goldgroup Mining Inc. |
| 7.2 | Property Geology |
The San Francisco Project lies in a portion of the Mojave-Sonora megashear belt characterized by the presence of Precambrian to Tertiary age rocks represented by different grades of deformation and metamorphism as evidenced in the field by imbricate tectonic laminates. The rocks principally involved in the process of deformation and associated with the gold mineralization in the region are of Precambrian, Jurassic and Cretaceous age.
The oldest rocks within the property are a package of metamorphic rocks which include banded quartz-feldspathic gneiss and augen gneiss, green schist, amphibolite gneiss and some amphibolite and marble lenses (Calmus et al., 1992). All metamorphic rocks exhibit foliation which generally varies in strike direction from between 30° to 72° west and dips to the northeast from 24° to 68°. See Figure 7.2 for a geological map of the San Francisco and La Chicharra mine site.
The metamorphic rocks are intruded by a Tertiary igneous package, which includes leucocratic granite with visible feldspar and quartz, and is porphyritic to gneissic in texture. It appears that the granite was emplaced along low angle northwest-southeast shear zones in the system which developed between an older gabbro and the metamorphic sequence. This is the reason that in some places the granite bodies appear as stratiform lenses that vary in width from centimetres to more than 40 m and are subparallel to the foliation. It is seen, however, that the emplacement of leucocratic granite also favours the N30°W fault system, causing the granite to take an elongated form, principally in direction N60°W, but with extensions along the N30°W system.
Besides the gabbro and the granite, dikes of different composition, including diorite, andesite, monzonite and lamprophyre, intrude the metamorphic sequence. In addition, lenses of pegmatite associated with the schist have been mapped, emplaced along the foliation planes, occasionally forming lenses within the gabbro and within the gneiss and on the border of the leucocratic granite bodies. All of the rocks described above form the San Francisco unit, which is the most important unit for exploration, with the leucocratic granite being especially significant because it is the primary host rock for gold mineralization.
Mapping of isolated outcrops and their geological interpretation demonstrates that the San Francisco unit is extensive within the property, covering a surface area of approximately 100 km2. The unit hosts at least 15 gold occurrences which are considered to be favourable exploration targets, in addition to the known San Francisco and La Chicharra gold deposits.
In the north and south, the San Francisco unit is in contact with the Coyotillo unit which is a weakly metamorphosed package of sandstone, quartzite, phyllite, conglomerate, volcanics and limestones of Jurassic age.
The granitic gneiss containing the mineralization at the San Francisco Project is intensely fractured with a total of five fracture sets having been identified, although there are only two primary sets. One of the primary sets strikes 36˚ to 60˚ east and dips northwest 70˚ to 90˚, while the other strikes 64˚ to 73˚ west and dips northeast 46˚ to 66˚. The regional fracture sets are generally parallel to major faults and perpendicular to foliation planes.
| San Francisco Project | 47 | May 1, 2026 |
| Goldgroup Mining Inc. |
Figure 7.2
San Francisco and La Chicharra Minesite Geology Map
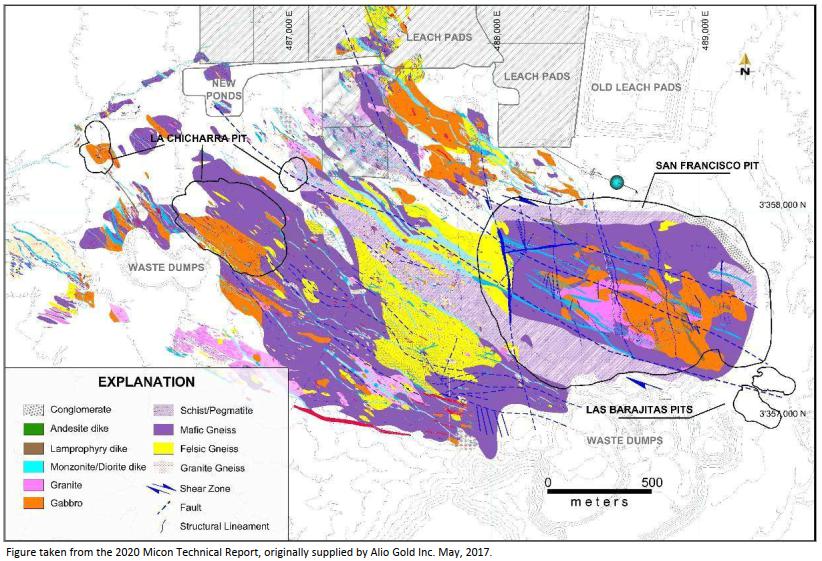
| San Francisco Project | 48 | May 1, 2026 |
| Goldgroup Mining Inc. |
The main vein systems in the region strike 50˚ to 80˚ west with dips ranging from northeast to southwest. These vein systems are the San Francisco, La Playa, El Diez, La Chicharra, and several systems in the La Mexicana area, Area 1B and La Escondida. A secondary system of veins includes the La Trinchera, Casa de Piedra, unnamed veins in portions of Area 1B and the La Mexicana veins which strike 60˚ to 80˚ east and dip northwest to southeast. Although the age relation between the two systems is unknown, it is believed that the northeast system is probably later stage.
The metamorphic foliation in the San Francisco deposit primarily strikes 78˚ west and dips to the northeast at 68˚. Regionally the foliation is variable, generally ranging from east-west to 60˚ west with varying dips to the northeast.
The original bedding is recognized in the metavolcanic-sedimentary rocks to the south at Cerro La Bajarita and is variable with strikes ranging from 70˚ to 80˚ west and dips to the north. The sedimentary beds of the Represo Formation in the northern portion of the property strike 60˚ to 70˚ west and dip to the northeast.
Dikes of intermediate composition in the Project area strike predominantly 63˚ west and dip to the northeast at 58˚. Several dikes are intruded along planes of foliation, and others cut foliation of the metamorphic units. In the Sierra La Vetatierra mountains in the northern portion of the Project, dikes strike 60˚ to the east, dip to the northwest, and represent a later system of fractures.
Metamorphic folds, including isoclinal, open symmetrical and kink folds, have been described, but no systematic description of folds has been found in the literature.
| 7.2.1 | Geology of the La Chicharra Pit |
The La Chicharra pit is located 2 km west of the San Francisco pit. Discovered by Geomaque in the late 1990’s, it is estimated that approximately 37,000 oz of gold were extracted and processed during Geomaque’s last year of operations.
The discovery of this deposit was the consequence of exploration programs comprised of magnetic ground surveys and soil geochemistry, using both conventional soil sampling and mobile metal ion (MMI) techniques. In both cases, samples returned very high values for the main mineralized zone in an area of low magnetics. Trenches were excavated to conduct chip sampling which confirmed the presence of gold mineralization in the bedrock and drilling delineated a deposit with a resource of 60,000 to 70,000 oz of gold.
The geology of the La Chicharra deposit, although it is hosted in the San Francisco group, differs from the geology found in the San Francisco pit (Figure 7.2). While the geology consists of quartz-feldspar gneiss, pegmatite, schist, granite and gabbro, the mineralization is hosted principally in gabbro. The gabbro has a very sheared appearance, almost like a breccia, comprised of large fragments with lenses of pegmatite between the fragments. Due to the shearing process, the blocks of gabbro are highly fractured, and the fractures are filled with quartz veins and veinlets. The gold mineralization is hosted by the pegmatite lenses and in the veins and veinlets within the gabbro. The limits of the mineralized gabbro are very well delineated by the shear zones, at both the hanging wall and footwall. This geological control allowed for better operational planning during the exploitation by Geomaque.
| San Francisco Project | 49 | May 1, 2026 |
| Goldgroup Mining Inc. |
The gabbro at La Chicharra is different from the gabbro bodies at the San Francisco mine, as it contains no magnetic minerals which are generally produced by the destruction of the original minerals contained within the gabbro during the tectonic and mineralization processes. As well, due to strong shearing, the minerals are oxidized. The gabbro is a tabular body dipping to the northeast at approximately 30 to 40° and striking approximately 60° west, with the mineralization potentially open both along strike and down dip.
Alio completed a program of core drilling seeking the extension of mineralization down dip and along strike and confirming continuity for the first 150 m from the northern limit of the pit, with the mineralization open in the northwest direction towards La Severiana.
Structurally, all of the metamorphic and igneous interpretation is based on the High-Resolution Airborne Magnetics which indicate a regional lineament varying in direction from 60° to 30° to the west. The gold deposits are located in the southern portion on each side of this main lineament and are related to the extension faulting of the system west-northwest and west-east. Other grassroots gold targets are located along this lineament, related to quartz veins with gold mineralization emplaced along the shear zones of the system to the west-northwest and east-west.
Figure 7.3 is a view of the La Chicharra pit looking towards the southwest and showing the lineament.
Figure 7.3
La Chicharra Pit Looking Southeast showing the Lineament (Pit in 2005)
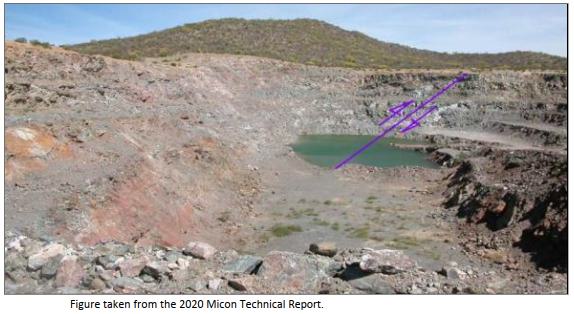
| 7.3 | Mineralization |
The San Francisco property is located within the Sierra Madre Occidental metallogenic province which extends along western Mexico from the state of Sonora, south to the state of Jalisco. In the state of Sonora, the most important metal produced in the Sierra Madre province is copper, with the Cananea porphyry copper deposit being the most well-known. Gold and silver projects are next in importance and are hosted mainly in sedimentary rocks and brecciated volcanic domes.
| San Francisco Project | 50 | May 1, 2026 |
| Goldgroup Mining Inc. |
At the San Francisco Project, gold occurs principally as free gold and occasionally as electrum. Gold is found, in decreasing abundance, with goethite after pyrite, with pyrite and, to a much lesser extent, with quartz, galena and petzite (Ag3AuTe2). Although it is clear that the gold was deposited at the same time as the sulphides, the paragenetic relationships are not well understood. There is the possibility that some secondary remobilization may have occurred as evidenced by minor amounts of gold occurring in irregular forms along with or on top of drusy quartz (Prenn, 1995).
The gold occurs in a granitic gneiss and the presence of pyrite (or goethite after pyrite) may be an indication of gold. Stockwork quartz veinlets, some with tourmaline, also exist in the mineralized zone. However, the presence of quartz, even with tourmaline, is not necessarily an indication of the presence of gold. Quartz veinlets with tourmaline but without gold mineralization were found hundreds of metres away from the San Francisco deposit. Alvarez (in Prenn, 1995) suggested that some tourmaline was part of the mineralizing system but could be distinguished from the tourmaline found elsewhere.
The relationship between the quartz and tourmaline at the Project is not well understood, though at least one event is closely related to the gold mineralization. Calmus (1992) and Perez (1992) described the gold as being in quartz, acicular tourmaline, and albite veins and breccias. It was noted (Perez, 1992) that two types of tourmaline exist: schorl and dravite, but these are difficult to distinguish. There is some suggestion that a more greenish tourmaline is associated with the San Francisco zone while the black tourmaline (schorl) is generally barren of gold. If this can be verified, it could become a valuable exploration tool for the region. Horner (in Prenn, 1995) also noted the possibility of two or more types of tourmaline in the cobbles sampled in the stream beds. Horner believes that only one set of the tourmaline veins is associated with the gold and suggests that bismuth is also associated with one tourmaline quartz vein event.
Other metallic minerals associated with the deposit include trace to small amounts of chalcopyrite, galena, sphalerite, covelite, bornite, argentite-acanthite and pyrrhotite. Trace amounts of molybdenite and wulfenite have also been reported. Metal mineralization is low, with copper reaching into the hundreds of ppm, arsenic reaching about 100 ppm, and antimony rarely over 10 ppm. Petzite was recognized but tellurium values rarely reached 10 ppm. The mineral relationships, the possibility of associated tourmaline, and the style of mineralization suggest that the San Francisco deposit might be of mesothermal origin (see Prenn, 1995 for discussion). Others have suggested the same genesis based on these and other factors, including fluid inclusion studies (in Prenn, 1995).
The San Francisco deposits are roughly tabular with multiple phases of gold mineralization. The deposits strike 60˚ west to 65˚ west, dip to the northeast, range in thickness from 4 to 50 m, extend over 1,500 m along strike and are open ended. The San Francisco deposits consisted of the El Manto, the San Francisco, the En Medio and the El Polvorin deposits. All of these deposits were later incorporated into the main San Francisco pit. The El Manto deposit (north pit), to the north of the San Francisco (main pit), is tabular, strikes 65˚ west, dips relatively shallowly to the northeast, and ranges in thickness from 5 to 35 m. The En Medio (in the main pit north of San Francisco) strikes 60˚ west, dips to the northeast and varies in thickness from 4 to 20 m. The El Polvorin (west pit) is a northwest extension of the San Francisco mineralization which strikes 65˚ west, dips moderately to the northeast and ranges in thickness from 4 to 20 m.
Alteration related to the mineralization consists of negligible to locally intense sericitization, course-grained pyritization and rare local silicification. This alteration forms a halo extending a few metres from the mineral deposits but may also be absent. Supergene alteration consisting of oxidation of pyrite to goethite is common. Additionally, there is supergene alteration of feldspar to kaolin and sericite.
| San Francisco Project | 51 | May 1, 2026 |
| Goldgroup Mining Inc. |
Analysis by Geomaque of 110 samples in seven mineralized zones showed a silver/gold ratio of less than 1 to 10, with very low values of zinc, copper, molybdenum, bismuth, antimony and mercury. Lead is occasionally high, but not above 1%, while gold shows a good correlation locally with arsenic and lead. However, none of the other elements is a good indicator for gold.
| 7.4 | Other Projects within the San Francisco Property |
| 7.4.1 | El Durazno Project |
El Durazno is located approximately 12 km north of San Francisco mine. The geology is dominated by the El Claro granitoid intrusion and sediments of the El Represo Formation. The El Claro intrusion is large mass of medium to fine biotite granodiorite intruded by series of monzonite, biotite granite, andesites, diorite and lamprophyre dikes trending northwest. The large mass of biotite granodiorite was dated by Poulsen et. al., (2008) using U-Pb in zircon giving an age of 66.0 ± 2.0 Ma.
The biotite granodiorite is cross-cut by multiple major high angle platy foliate structures trending to the northwest which contain quartz-tourmaline with minor sulphides and gold mineralization. The intrusive-hosted foliate structures can vary in thickness from a quarter metre to several metres. The structures are preferentially altered and mineralized, carrying sericite (greisen), pyrite, quartz and tourmaline. Where the structures are located, it is common to find signs of past prospecting, and they are geochemically anomalous in gold, silver, lead, tellurium, molybdenum and bismuth.
The main structural feature is the El Durazno fault which lies at the contact between the sedimentary rocks and biotite granodiorite. The foliated N60°W shear zones are more likely evidence of faulting along the east margin of the intrusive, although foliated shear zones have been found all around the intrusion in lesser abundance.
Mineralized areas usually occur as quartz veins relatively near the contacts of the El Claro intrusive and more often within the intrusive. The mineralogy of the veins is primarily quartz-tourmaline with a low sulphur content of less than 0.5%. Closer to the contact with the sediments, a number of quartz-sericite (greisen) veins in the more central parts of the intrusive have been identified. Structurally there are four groups of veins and veinlets within the granitoid El Claro:
| 1. | One group of veins belongs to the thicker quartz-tourmaline veins in the area which occasionally reach widths greater than 1 metre, have a general N55°W trend and dip to the northeast similar to the monzonitic, diorite, lamprophyre and andesitic dikes. These veins are associated with ductile shear zones. The mineral lineation observed in the granite foliation plane has a strike of N50°W and the tourmaline crystals strike N52°W, indicating that emplacement of this first generation of veins is contemporary with the ductile deformation. |
| 2. | The second group of veins have thicknesses of less than half a metre, with a general strike of N40° to 50°E, and are also located in areas with ductile shear zones occurring mainly at the area known as El Pinto. |
| San Francisco Project | 52 | May 1, 2026 |
| Goldgroup Mining Inc. |
| 3. | The third group of veins apparently are emplaced in a ductile-brittle deformation environment, developing sheeted veins with thicknesses less than one centimetre within the intrusive. The general trend of the sheeted veins is N15° to 25°W. |
| 4. | The fourth, poorly represented group of veins strike N65° to 80°E, are located primarily in the central part of the El Claro intrusive and are characterized by quartz-sericite (greisen)-pyrite, with a general trend of N60°W. This last type of veins is very poor in gold with local values up to 0.1 g/t Au, but with high anomalous values of tungsten and molybdenum. |
The contact between the granite and Cretaceous sediments is characterized by the development of an alteration zone of quartz-epidote-chlorite-garnet skarn and locally forms low-grade metamorphism of the hornfels type. Although quartz-gold-bearing veins are not very common in sediments, they occur locally in conjunction with a high content of sulphides.
| 7.4.2 | Vetatierra Project |
The Vetatierra Project is located approximately 8 km north of the San Francisco mine. It is a very early-stage exploration project, and its geology is dominated by detrital sediments of the El Represo Formation, intruded by small stocks of fine grained dioritic intrusions and diorite dikes. A sequence of fine-grained sandstones, shales, medium bedded conglomerates and locally lenticular limestones commonly trend east-west and dip to the north. These represent the majority of the rock types at the Vetatierra Project. This sequence is intruded by a diorite stock that covers an area of 600 m by 200 m, oriented to the northeast. Both sequences are cut by a series of dioritic dikes oriented NE 50° to 80° in strike direction. Locally, the contacts between the sediments and diorite intrusion develop an alteration halo, forming low-grade metamorphic rocks as hornfels or slate types.
The sediments are cut by multiple, major high angle platy foliated structures, with a preferential northeast trend, at the southwestern portion of the Project. The sediments host foliated structures that vary in thickness from a quarter metre to several metres which have been interpreted as shear zones. Low-angle brecciated faults have been interpreted to be located on the south side of this area. This has been interpreted as a possible structural contact between the San Francisco Precambrian rocks and the Cretaceous sediments of the Represo Formation.
The sequence of sediments and diorite stock has been cut by a number of quartz-tourmaline and quartz veins trending east-northeast, which occur within the diorite stock and all the surrounding areas. At least 3 groups of veins have been noted:
| 1. | A group of low angle quartz-tourmaline veins trending west-northwest to east northeast, dipping to the north and varying in thickness from a centimetre to over a metre. |
| 2. | A group of high angle quartz-tourmaline veins and veinlets, trending northwest and dipping to north. |
| 3. | A group of veinlets with less than 1 cm thickness and trending northwest but dipping to the south. |
The diorite intrusion appears to be the most favourable rock to host the gold bearing quartz-tourmaline veins in the Project area, due the better reactivity and competency of the rock. West of the diorite stock, a series of conglomerate lenses outcrop which show a strong silicification and oxidation, with local quartz veinlets. The conglomerate covers an area of 300 m by 150 m.
| San Francisco Project | 53 | May 1, 2026 |
| Goldgroup Mining Inc. |
8 DEPOSIT TYPES
At the San Francisco Project, prior operators were targeting large volume, low-grade disseminated gold deposits contained within leucocratic granite, granite-gneiss and gneiss and schist horizons. Leucocratic granite and gneiss are the main rocks hosting the gold mineralization.
The gold mineralization occurs in a series of west-northwest to east-northeast trending quartz-tourmaline veins and veinlets that lie sub-parallel to the local lithology and foliation trends, dipping to the southwest, within the more brittle rocks such as the leucocratic granite and more felsic lithologies within the Precambrian sequence. Extensive studies of the veins and alteration describe the mineralization as mesothermal/orogenic in style, but with a potential link to magmatic fluids and an intrusive source (Calmus et al., 1992; Luna and Gastelum, 1992; Perez Segura, 1992; Perez Segura et al., 1996; Perez Segura, 2008; Albinson, 1997; Poulsen and Mortensen, 2008).
Micon’s QP has conducted a number of discussions with personnel working at the San Francisco Project during its prior site visits to the mine and in Hermosillo and notes that the exploration programs at the San Francisco Project were planned and executed on the basis of the deposit models discussed above. Micon’s QP has also observed the various stages of the drilling programs during a number of site visits at the San Francisco Project since 2005 and notes that those programs were always been conducted according to the deposit model which has been proposed for the Project.
Goldgroup will continue to target the same or similar mineralization at the San Francisco Project that the previous operators exploited.
| San Francisco Project | 54 | May 1, 2026 |
| Goldgroup Mining Inc. |
9 EXPLORATION
| 9.1 | Goldgroup Exploration Program |
Goldgroup has recently acquired the San Francisco Project and once it has completed its review of the previous exploration programs and results Goldgroup will outline its own exploration program for the San Francisco Project.
| San Francisco Project | 55 | May 1, 2026 |
| Goldgroup Mining Inc. |
10 DRILLING
| 10.1 | Goldgroup Drilling Program |
Goldgroup has recently acquired the San Francisco Project and once it has completed its review of the previous drilling programs and results, Goldgroup will outline its own drilling program for the San Francisco Project.
| 10.2 | 2022 Magna Drilling Program |
Between March, 2020 and April, 2022, 285 reverse circulation (RC) holes were drilled totalling 33,596.51 m. The drilling included 56 holes totalling 7,083.54 m on the north target and 28 holes totalling 2,374.34 m were drilled in Phase 8 (north-northeast extension, conglomerate) of the San Francisco Pit. The drilling program generated 7,178 chip samples which were assayed in the laboratory at the San Francisco mine with the assay methodology comprised of a 50 g fire assay and an AA finish.
Figure 10.1 shows the distribution of the RC drilling which occurred in 2022 north of the San Francisco pit.
Figure 10.1
Map of the 2022 Drilling in the Area to the North of the San Francisco Pit
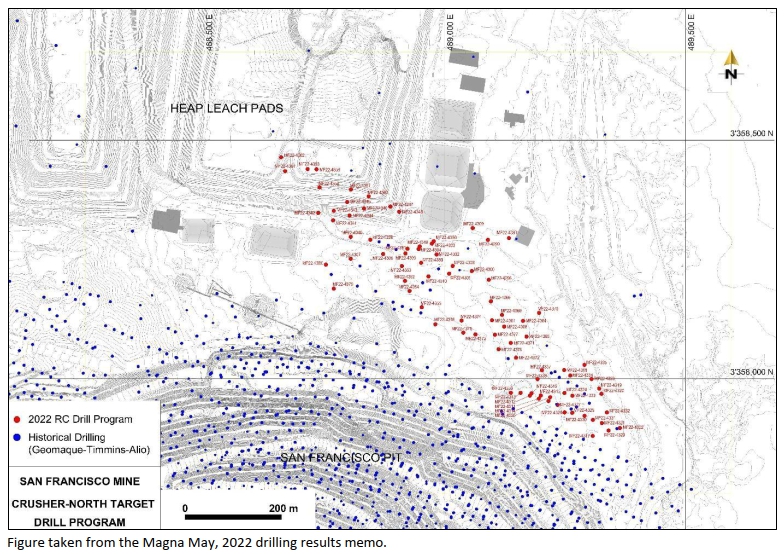
| San Francisco Project | 56 | May 1, 2026 |
 | Goldgroup Mining Inc. |
Table 10.1 summarizes the collar locations of the first quarter 2022 north mineralized zone drill holes.
Table 10.1
Collar Locations for the First Quarter 2022 North Mineralized Zone Drill Holes at the San Francisco Mine
| Hole ID | Co-Ordinates Datum NAD 27 | Azimuth
(°) |
Dip (°) | Section | Depth/
Length (m) | ||
| East | North | Elevation (m) | |||||
| MF22-4298 | 489,091.69 | 3,358,207.54 | 702.88 | 205 | -70 | 680W | 135.64 |
| MF22-4299 | 489,090.04 | 3,358,291.19 | 702.89 | 205 | -70 | 720W | 201.17 |
| MF22-4300 | 489,056.68 | 3,358,225.77 | 703.12 | 205 | -70 | 720W | 134.11 |
| MF22-4301 | 489,009.58 | 3,358,220.46 | 703.66 | 205 | -70 | 760W | 121.92 |
| MF22-4302 | 488,983.73 | 3,358,260.73 | 703.77 | 205 | -70 | 800W | 103.63 |
| MF22-4303 | 488,973.70 | 3,358,283.42 | 703.76 | 205 | -70 | 820W | 126.49 |
| MF22-4304 | 488,946.25 | 3,358,271.93 | 704.31 | 205 | -70 | 840W | 150.88 |
| MF22-4305 | 488,920.44 | 3,358,263.48 | 704.62 | 205 | -70 | 860W | 120.40 |
| MF22-4306 | 488,872.71 | 3,358,261.43 | 705.48 | 205 | -70 | 900W | 153.92 |
| MF22-4307 | 488,805.56 | 3,358,251.51 | 706.60 | 205 | -60 | 960W | 202.69 |
| MF22-4308 | 488,016.92 | 3,358,236.61 | 703.81 | 205 | -70 | 760W | 112.78 |
| MF22-4309 | 488,058.60 | 3,358,315.90 | 703.09 | 205 | -70 | 760W | 207.26 |
| MF22-4310 | 488,966.75 | 3,358,214.38 | 704.61 | 205 | -70 | 780W | 150.88 |
| MF22-4339 | 488,846.15 | 3,358,291.47 | 707.36 | 205 | -70 | 940W | 100.58 |
| MF22-4340 | 488,805.47 | 3,358,297.37 | 709.71 | 205 | -70 | 980W | 105.16 |
| MF22-4341 | 488,768.80 | 3,358,332.158 | 711.10 | 205 | -70 | 1020W | 100.58 |
| MF22-4342 | 488,738.12 | 3,358,347.59 | 711.83 | 205 | -70 | 1060W | 105.16 |
| MF22-4343 | 488,759.07 | 3,358,359.00 | 711.16 | 205 | -70 | 1040W | 111.25 |
| MF22-4344 | 488,802.94 | 3,358,342.35 | 707.74 | 205 | -70 | 1000W | 123.44 |
| MF22-4345 | 488,798.11 | 3,358,370.65 | 707.55 | 205 | -70 | 1020W | 153.92 |
| MF22-4346 | 488,832.98 | 3,358,356.90 | 706.70 | 205 | -70 | 980W | 150.88 |
| MF22-4347 | 488,887.56 | 3,358,360.85 | 706.32 | 205 | -70 | 940W | 170.69 |
| MF22-4348 | 488,905.82 | 3,358,350.13 | 706.13 | 205 | -70 | 900W | 153.92 |
| MF22-4349 | 488,947.52 | 3,358,275.94 | 704.40 | 25 | -60 | 840W | 245.36 |
| MF22-4350 | 488,977.67 | 3,358,288.08 | 703.93 | 25 | -60 | 820W | 251.46 |
| MF22-4351 | 488,923.33 | 3,358,272.60 | 704.86 | 25 | -60 | 860W | 240.79 |
| MF22-4352 | 488,918.02 | 3,358,205.07 | 705.15 | 205 | -70 | 840W | 153.92 |
| MF22-4353 | 488,911.61 | 3,358,236.35 | 704.54 | 205 | -70 | 860W | 91.44 |
| MF22-4354 | 488,927.51 | 3,358,184.00 | 705.49 | 205 | -70 | 820W | 80.77 |
| MF22-4355 | 488,952.81 | 3,358,150.09 | 706.59 | 205 | -70 | 780W | 153.92 |
| MF22-4356 | 488,951.58 | 3,358,243.17 | 704.22 | 205 | -70 | 820W | 120.40 |
| MF22-4357 | 488,806.04 | 3,358,396.65 | 707.55 | 205 | -70 | 1020W | 132.59 |
| MF22-4358 | 488,740.53 | 3,358,399.09 | 708.45 | 205 | -70 | 1060W | 83.82 |
| MF22-4359 | 488,734.44 | 3,358,438.97 | 708.54 | 205 | -70 | 1100W | 141.73 |
| MF22-4360 | 488,842.74 | 3,358,382.29 | 706.53 | 205 | -70 | 980W | 129.54 |
| MF22-4361 | 488,669.34 | 3,358,435.20 | 712.93 | 205 | -70 | 1160W | 105.16 |
| MF22-4362 | 488,660.98 | 3,358,464.14 | 713.38 | 205 | -70 | 1080W | 147.83 |
| MF22-4363 | 488,716.03 | 3,358,439.40 | 711.70 | 205 | -70 | 1120W | 131.06 |
| MF22-4364 | 489,162.95 | 3,358,121.25 | 702.89 | 205 | -70 | 580W | 111.25 |
| MF22-4365 | 489,170.11 | 3,358,088.52 | 702.92 | 205 | -70 | 560W | 80.77 |
| San Francisco Project | 57 | May 1, 2026 |
| Goldgroup Mining Inc. |
| Hole ID | Co-Ordinates Datum NAD 27 | Azimuth (°) |
Dip (°) | Section | Depth/
Length (m) | ||
| East | North | Elevation (m) | |||||
| MF22-4366 | 489,096.27 | 3,358,162.33 | 703.74 | 205 | -70 | 660W | 111.25 |
| MF22-4367 | 489,098.62 | 3,358,122.69 | 704.26 | 205 | -70 | 640W | 80.77 |
| MF22-4368 | 489,123.76 | 3,358,109.40 | 703.40 | 205 | -70 | 600W | 92.96 |
| MF22-4369 | 489,119.42 | 3,358,134.12 | 703.68 | 205 | -70 | 620W | 100.58 |
| MF22-4370 | 489,196.10 | 3,358,138.17 | 702.56 | 205 | -70 | 560W | 121.92 |
| MF22-4371 | 489,137.59 | 3,358,075.18 | 704.25 | 205 | -70 | 580W | 60.96 |
| MF22-4372 | 489,148.41 | 3,358,044.28 | 703.73 | 205 | -70 | 560W | 41.15 |
| MF22-4373 | 489,064.33 | 3,358,092.96 | 705.91 | 205 | -70 | 660W | 60.96 |
| MF22-4374 | 489,035.38 | 3,358,122.03 | 705.93 | 205 | -70 | 700W | 60.96 |
| MF22-4375 | 489,039.04 | 3,358,096.74 | 706.29 | 205 | -70 | 680W | 41.15 |
| MF22-4376 | 488,980.57 | 3,358,114.19 | 706.70 | 205 | -70 | 740W | 41.15 |
| MF22-4377 | 489,104.74 | 3,358,092.43 | 704.53 | 205 | -70 | 620W | 60.96 |
| MF22-4378 | 489,112.28 | 3,358,062.06 | 704.92 | 205 | -70 | 600W | 41.15 |
| MF22-4379 | 488,770.28 | 3,358,189.00 | 708.78 | 205 | -55 | 960W | 201.17 |
| MF22-4380 | 488,753.91 | 3,358,239.20 | 708.08 | 205 | -60 | 1000W | 201.17 |
| MF22-4381 | 489,134.06 | 3,358,293.17 | 702.89 | 205 | -70 | 680W | 166.12 |
Table taken from the Magna May, 2022 drilling results memo.
Table 10.2 summarizes the collar locations of the first quarter 2022 Phase 8 drill holes.
Table 10.2
Collar Locations for the First Quarter 2022 Phase 8 (Conglomerate) Drill Holes at the San Francisco Mine
| Hole ID | Co-Ordinates Datum NAD 27 | Azimuth
(°) |
Dip (°) | Section | Depth/
Length (m) | ||
| East | North | Elevation (m) | |||||
| MF22-4311 | 489,195.74 | 3,357,958.33 | 703.75 | 205 | -50 | 480W | 50.29 |
| MF22-4312 | 489,177.18 | 3,357,964.68 | 704.13 | 205 | -50 | 500W | 71.10 |
| MF22-4313 | 489,157.88 | 3,357,970.56 | 704.44 | 205 | -50 | 520W | 71.63 |
| MF22-4314 | 489,219.20 | 3,357,961.28 | 703.21 | 205 | -70 | 460W | 62.48 |
| MF22-4315 | 489,199.74 | 3,357,964.94 | 703.42 | 205 | -70 | 480W | 62.48 |
| MF22-4316 | 489,180.65 | 3,357,969.65 | 704.13 | 205 | -70 | 500W | 76.20 |
| MF22-4317 | 489,307.44 | 3,357,880.29 | 701.66 | 205 | -50 | 360W | 275.84 |
| MF22-4318 | 489,248.41 | 3,358,018.40 | 702.07 | 205 | -70 | 460W | 106.68 |
| MF22-4319 | 489,320.82 | 3,357,979.74 | 700.70 | 205 | -70 | 380W | 80.77 |
| MF22-4320 | 489,325.74 | 3,357,968.53 | 700.88 | 205 | -70 | 360W | 92.96 |
| MF22-4321 | 489,326.56 | 3,357,907.22 | 701.33 | 205 | -70 | 340W | 80.77 |
| MF22-4322 | 489,363.85 | 3,357,896.88 | 701.08 | 205 | -70 | 300W | 92.96 |
| MF22-4323 | 489,304.96 | 3,357,999.47 | 700.58 | 205 | -70 | 400W | 80.77 |
| MF22-4324 | 489,248.83 | 3,357,970.35 | 702.44 | 205 | -70 | 440W | 62.48 |
| MF22-4325 | 489,264.96 | 3,357,928.56 | 702.64 | 205 | -50 | 400W | 80.77 |
| MF22-4326 | 489,253.28 | 3,357,937.10 | 702.56 | 205 | -50 | 420W | 80.77 |
| MF22-4327 | 489,234.50 | 3,357,945.50 | 703.06 | 205 | -50 | 440W | 100.58 |
| MF22-4328 | 489,215.73 | 3,357,953.43 | 703.26 | 205 | -50 | 460W | 68.58 |
| MF22-4329 | 489,340.45 | 3,357,891.66 | 701.19 | 205 | -70 | 320W | 80.77 |
| San Francisco Project | 58 | May 1, 2026 |
| Goldgroup Mining Inc. |
| Hole ID | Co-Ordinates Datum NAD 27 | Azimuth
(°) |
Dip (°) | Section | Depth/
Length (m) | ||
| East | North | Elevation (m) | |||||
| MF22-4330 | 489,290.58 | 3,357,922.49 | 701.98 | 205 | -60 | 380W | 105.16 |
| MF22-4331 | 489,307.89 | 3,357,913.82 | 701.77 | 205 | -70 | 360W | 70.10 |
| MF22-4332 | 489,337.00 | 3,357,929.62 | 701.30 | 205 | -70 | 320W | 80.77 |
| MF22-4333 | 489,265.26 | 3,357,964.58 | 701.85 | 205 | -70 | 420W | 80.77 |
| MF22-4334 | 489,261.01 | 3,358,007.02 | 701.82 | 205 | -70 | 440W | 50.29 |
| MF22-4335 | 489,290.18 | 3,358,029.19 | 700.90 | 205 | -70 | 420W | 80.70 |
| MF22-4336 | 489,137.75 | 3,357,970.70 | 704.73 | 205 | -70 | 540W | 60.96 |
| MF22-4337 | 489,202.27 | 3,358,017.98 | 703.00 | 205 | -70 | 500W | 80.77 |
| MF22-4338 | 489,192.97 | 3,357,999.30 | 703.19 | 205 | -70 | 500W | 86.87 |
Table taken from the Magna May, 2022 drilling results memo.
| 10.2.1 | 2022 Drilling Results |
Magna noted in its 2022 memo that further infill drilling would be required to follow up on the positive results obtained and that further drilling would be needed to extend the drilling to the immediate northwest and southeast and within the area of the crushing circuit.
The intersected lithological column is comprised of a polymictic conglomerate formed primarily of poor rounded fragments of granite, felsic and mafic gneiss with some pegmatite and quartz veinlets, all included in a clayey matrix which is sometimes cemented. It appears that the granite has sericite alteration with the gneiss showing propylitic alteration.
Underneath the conglomerate is a sequence containing, granite, gneiss, several types of dikes (dioritic, monzonite, pegmatite and diorite) and a dark coloured dike or sill of gabbro.
The mineralization was recognized in a lamprophyre dike that intrudes at the hanging-wall a highly oxidized failed granite and at the footwall a silicified gneiss, with sericite-propylitic alteration and a poor sulphide content. The granite-gneiss pair contain medium to high grade gold mineralization.
Figure 10.2 is a cross-section showing the main interpretation derived from the 2022 drill intersections. The drilling demonstrated that while there are some waste areas from the surface down to a depth of 200 to 250 m below surface there are also mineralized zones indicating the mineralization continues into the down dip projection comprising phase 9 push back of the pit. However, additional drilling will also be required.
Within the conglomerate it is almost normal to find gold values in the order of 0.10 g/t gold o 0.20 g/t gold. However, during the 2022 the drill campaign several holes intersected higher gold values, with examples being drill hole MF22-4317 which intersected 6.06 m of 0.324 g/t gold; 12.19 m containing 3.097 g/t gold and 9.14 m grading 0.495 g/t gold and drill hole MF22-4360 with 7.62 m of 1.114 g/t gold and 6 m containing 1.353 g/t gold.
Tables 10.3 summarizes significant results for the drilling on the North Mineralized Zone at the San Francisco Project. Figure 10.4 summarizes significant results for the drilling on the Phase 8 north-northeast extension (conglomerate) at the San Francisco Project.
| San Francisco Project | 59 | May 1, 2026 |
| Goldgroup Mining Inc. |
Figure 10.2
Cross-Section of the San Francisco Pit showing some of the 2022 Drilling Results
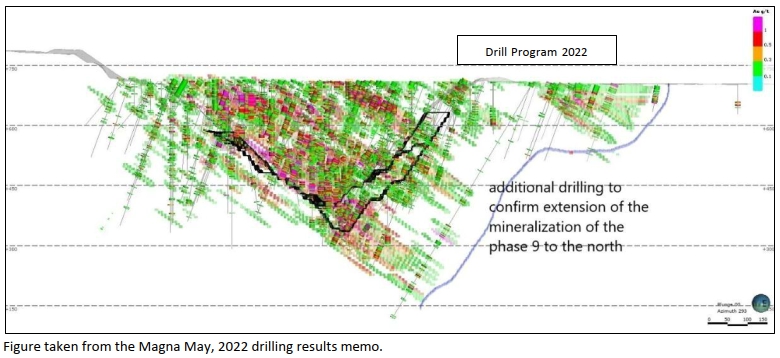
Table 10.3
Summary Significant Results for the Drilling on the North Mineralized Zone at the San Francisco Project
| Hole ID | Depth/Length (m) |
Dip (°) | Azimuth (°) |
Significative Mineral Interceptions | |||
| From (m) | To (m) | Width (m) | Gold
Assay (g/t) | ||||
| MF22-4298 | 135.64 | -70° | 205° | 15.24 | 21.34 | 6.10 | 0.510 |
| Include | 19.81 | 21.34 | 1.53 | 1.337 | |||
| And | 48.77 | 50.29 | 1.52 | 0.214 | |||
| And | 57.91 | 59.44 | 1.53 | 1.069 | |||
| And | 77.72 | 82.3 | 4.58 | 0.220 | |||
| MF22-4299 | 201.17 | -70° | 205° | 0.00 | 36.58 | 36.58 | 0.200 |
| include | 0.00 | 7.62 | 7.62 | 0.321 | |||
| And | 53.34 | 54.86 | 1.52 | 0.439 | |||
| And | 60.96 | 68.58 | 7.62 | 0.364 | |||
| And | 137.16 | 143.26 | 6.10 | 0.453 | |||
| MF22-4300 | 134.11 | -70° | 205° | 19.81 | 25.91 | 6.10 | 0.591 |
| Include | 21.34 | 22.86 | 1.52 | 1.941 | |||
| And | 36.58 | 48.77 | 12.19 | 1.500 | |||
| Include | 42.67 | 48.77 | 6.10 | 2.763 | |||
| Include | 42.67 | 44.20 | 1.53 | 10.000 | |||
| And | 67.05 | 74.68 | 7.63 | 0.350 | |||
| Include | 67.06 | 68.58 | 1.52 | 0.725 | |||
| Include | 71.63 | 73.15 | 1.52 | 0.636 | |||
| And | 77.72 | 92.96 | 15.24 | 1.170 | |||
| San Francisco Project | 60 | May 1, 2026 |
| Goldgroup Mining Inc. |
| Hole ID | Depth/Length
(m) |
Dip (°) | Azimuth
(°) |
Significative Mineral Interceptions | |||
| From (m) | To (m) | Width (m) | Gold Assay (g/t) | ||||
| Include | 79.25 | 80.77 | 1.52 | 1.304 | |||
| Include | 83.82 | 89.92 | 6.10 | 2.275 | |||
| MF22-4301 | 121.92 | -70° | 205° | 42.67 | 44.20 | 1.53 | 0.804 |
| And | 51.82 | 54.86 | 3.04 | 2.699 | |||
| Include | 51.82 | 53.34 | 1.52 | 4.486 | |||
| And | 62.48 | 74.68 | 12.20 | 0.286 | |||
| MF22-4304 | 13.72 | 16.76 | 3.04 | 1.885 | |||
| And | 24.38 | 36.58 | 12.20 | 0.418 | |||
| Include | 150.88 | -70° | 205° | 33.53 | 35.05 | 1.52 | 2.321 |
| And | 44.20 | 59.44 | 15.24 | 0.315 | |||
| And | 62.48 | 73.15 | 10.67 | 0.234 | |||
| Include | 71.63 | 73.15 | 1.52 | 0.878 | |||
| MF22-4305 | 120.4 | -70° | 205° | 16.76 | 18.29 | 1.53 | 0.538 |
| And | 27.43 | 42.67 | 15.24 | 1.160 | |||
| Include | 35.05 | 42.67 | 7.62 | 1.905 | |||
| Include | 35.05 | 36.58 | 1.53 | 2.513 | |||
| Include | 39.62 | 41.15 | 1.53 | 4.966 | |||
| Include | 41.15 | 42.67 | 1.52 | 1.644 | |||
| And | 53.34 | 56.39 | 3.05 | 0.789 | |||
| Include | 53.34 | 54.86 | 1.52 | 1.432 | |||
| And | 62.48 | 64.01 | 1.52 | 0.607 | |||
| MF22-4306 | 153.92 | -70° | 205° | 9.14 | 10.67 | 1.53 | 0.208 |
| And | 28.96 | 32.04 | 3.08 | 0.289 | |||
| MF22-4307 | 202.69 | -60° | 205° | 35.05 | 36.58 | 1.52 | 0.632 |
| And | 39.62 | 42.67 | 3.05 | 0.583 | |||
| And | 97.54 | 100.58 | 3.05 | 0.357 | |||
| And | 141.73 | 143.26 | 1.52 | 0.253 | |||
| MF22-4308 | 112.78 | -70° | 205° | 0.00 | 3.05 | 3.05 | 0.260 |
| And | 4.57 | 9.14 | 4.57 | 0.236 | |||
| And | 12.19 | 13.72 | 1.52 | 0.674 | |||
| And | 48.77 | 51.82 | 3.05 | 1.040 | |||
| And | 54.86 | 56.39 | 1.52 | 0.496 | |||
| And | 76.20 | 77.72 | 1.52 | 0.249 | |||
| And | 79.25 | 83.82 | 4.57 | 0.640 | |||
| Include | 80.77 | 82.30 | 1.52 | 0.867 | |||
| Include | 82.30 | 83.82 | 1.52 | 0.837 | |||
| MF22-4309 | 207.26 | -70° | 205° | 0.00 | 6.10 | 6.10 | 2.134 |
| And | 10.67 | 13.72 | 3.05 | 0.396 | |||
| And | 18.29 | 19.81 | 1.52 | 0.243 | |||
| San Francisco Project | 61 | May 1, 2026 |
| Goldgroup Mining Inc. |
| Hole ID | Depth/Length (m) |
Dip (°) | Azimuth
(°) |
Significative Mineral Interceptions | |||
| From (m) | To (m) | Width (m) | Gold
Assay (g/t) | ||||
| And | 21.34 | 22.86 | 1.52 | 0.225 | |||
| And | 32.00 | 33.53 | 1.52 | 0.357 | |||
| And | 36.58 | 42.67 | 6.09 | 0.884 | |||
| And | 38.10 | 39.62 | 1.52 | 1.798 | |||
| And | 48.77 | 50.29 | 1.52 | 0.543 | |||
| And | 54.86 | 56.39 | 1.52 | 0.249 | |||
| And | 59.44 | 62.48 | 3.04 | 0.365 | |||
| And | 65.53 | 68.58 | 3.05 | 0.505 | |||
| And | 71.63 | 73.15 | 1.52 | 0.411 | |||
| And | 118.87 | 121.92 | 3.05 | 0.317 | |||
| And | 126.49 | 128.02 | 1.52 | 0.207 | |||
| And | 129.54 | 131.06 | 1.52 | 0.771 | |||
| And | 176.78 | 178.31 | 1.52 | 0.366 | |||
| MF22-4310 | 150.88 | -70° | 205° | 0.00 | 21.34 | 21.34 | 0.230 |
| Include | 0.00 | 7.62 | 7.62 | 0.320 | |||
| Include | 9.14 | 10.67 | 1.53 | 0.287 | |||
| Include | 13.72 | 16.76 | 3.05 | 0.229 | |||
| Include | 19.81 | 21.34 | 1.52 | 0.220 | |||
| And | 28.96 | 30.48 | 1.52 | 0.241 | |||
| And | 33.53 | 35.05 | 1.52 | 0.315 | |||
| And | 39.62 | 48.77 | 9.15 | 0.470 | |||
| Include | 39.62 | 42.67 | 3.05 | 0.980 | |||
| And | 45.72 | 48.77 | 3.05 | 0.332 | |||
| And | 53.34 | 54.86 | 1.52 | 0.213 | |||
| MF22-4339 | 4.57 | 6.10 | 1.53 | 0.255 | |||
| And | 12.19 | 21.34 | 9.15 | 0.325 | |||
| Include | 100.58 | -70° | 205° | 16.76 | 18.29 | 1.53 | 0.948 |
| And | 27.43 | 36.57 | 9.14 | 0.436 | |||
| Include | 32.00 | 33.53 | 1.52 | 1.104 | |||
| And | 99.06 | 100.58 | 1.52 | 0.909 | |||
| MF22-4340 | 105.16 | -70° | 205° | 0.00 | 6.10 | 6.10 | 0.562 |
| And | 13.72 | 16.76 | 3.04 | 0.369 | |||
| MF22-4341 | 100.58 | -70° | 205° | 47.24 | 51.82 | 4.58 | 1.056 |
| Include | 48.77 | 50.29 | 1.52 | 2.373 | |||
| MF22-4342 | 105.16 | -70° | 205° | 0.00 | 4.57 | 4.57 | 0.358 |
| and | 9.14 | 10.67 | 1.53 | 0.844 | |||
| and | 48.77 | 50.29 | 1.53 | 0.359 | |||
| and | 62.48 | 64.01 | 1.52 | 0.618 | |||
| MF22-4343 | 111.25 | -70° | 205° | 0.00 | 6.10 | 6.10 | 0.759 |
| San Francisco Project | 62 | May 1, 2026 |
| Goldgroup Mining Inc. |
| Hole ID | Depth/Length (m) |
Dip (°) | Azimuth (°) |
Significative Mineral Interceptions | |||
| From (m) | To (m) | Width (m) | Gold Assay (g/t) | ||||
| and | 79.25 | 82.30 | 3.05 | 0.559 | |||
| MF22-4344 | 123.44 | -70° | 205° | 3.05 | 6.09 | 3.05 | 0.258 |
| and | 16.76 | 19.81 | 3.05 | 0.581 | |||
| MF22-4346 | 150.88 | -70° | 205° | 0.00 | 4.57 | 4.57 | 0.273 |
| and | 28.96 | 32.00 | 3.05 | 0.560 | |||
| Include | 28.96 | 30.48 | 1.52 | 1.012 | |||
| and | 39.64 | 41.15 | 3.05 | 0.233 | |||
| MF22-4347 | 170.69 | -70° | 205° | 4.57 | 12.19 | 7.62 | 0.343 |
| MA22-4348 | 153.92 | -70° | 205° | 1.52 | 3.05 | 1.53 | 0.369 |
| and | 4.57 | 6.10 | 1.53 | 0.523 | |||
| and | 12.19 | 13.72 | 1.53 | 0.309 | |||
| and | 54.86 | 57.91 | 3.05 | 0.408 | |||
| MF22-4349 | 245.36 | -60° | 25° | 12.19 | 13.72 | 1.53 | 0.238 |
| and | 36.58 | 38.10 | 1.52 | 0.240 | |||
| and | 76.20 | 77.74 | 1.54 | 0.467 | |||
| and | 114.30 | 115.82 | 1.52 | 1.536 | |||
| and | 124.96 | 126.49 | 1.52 | 0.791 | |||
| and | 155.45 | 156.97 | 1.52 | 2.258 | |||
| and | 233.17 | 234.70 | 1.52 | 0.485 | |||
| MF22-4350 | 251.46 | -60° | 25° | 1.52 | 4.57 | 3.05 | 0.290 |
| and | 35.05 | 36.58 | 1.52 | 0.268 | |||
| and | 39.62 | 41.15 | 1.52 | 0.260 | |||
| and | 77.72 | 86.87 | 9.14 | 0.471 | |||
| MF22-4351 | 240.79 | -60° | 25° | 47.24 | 56.39 | 9.15 | 0.399 |
| and | 65.53 | 67.06 | 1.53 | 0.406 | |||
| and | 185.93 | 187.45 | 1.52 | 0.314 | |||
| MF22-4352 | 153.92 | -70° | 205° | 10.67 | 12.19 | 1.52 | 0.881 |
| and | 15.24 | 27.43 | 12.19 | 0.258 | |||
| MF22-4353 | 91.44 | -70° | 205° | 0.00 | 3.05 | 3.05 | 0.630 |
| Include | 0.00 | 1.52 | 1.52 | 1.040 | |||
| and | 10.67 | 12.19 | 1.52 | 0.500 | |||
| and | 42.97 | 44.20 | 1.22 | 0.528 | |||
| MF22-4354 | 80.77 | -70° | 205° | 1.52 | 3.05 | 1.53 | 1.750 |
| MF22-4356 | 120.40 | -70° | 205° | 0.00 | 6.10 | 6.10 | 0.266 |
| and | 27.43 | 30.48 | 3.05 | 0.533 | |||
| and | 33.53 | 36.58 | 3.05 | 0.432 | |||
| and | 45.72 | 48.77 | 3.05 | 0.432 | |||
| MF22-4357 | 132.59 | -70° | 205° | 0.00 | 6.10 | 6.10 | 0.280 |
| and | 41.15 | 42.67 | 1.52 | 0.208 | |||
| San Francisco Project | 63 | May 1, 2026 |
| Goldgroup Mining Inc. |
| Hole ID | Depth/Length (m) |
Dip (°) | Azimuth
(°) |
Significative Mineral Interceptions | |||
| From (m) | To (m) | Width (m) | Gold
Assay (g/t) | ||||
| and | 51.82 | 53.34 | 1.52 | 0.223 | |||
| MF22-4359 | 141.73 | -70° | 205° | 18.29 | 21.34 | 3.05 | 0.351 |
| and | 132.59 | 134.11 | 1.52 | 0.406 | |||
| MF22-4360 | 129.54 | -70° | 205° | 0.00 | 6.10 | 6.10 | 0.466 |
| Include | 3.05 | 4.57 | 1.52 | 1.320 | |||
| and | 16.76 | 24.38 | 7.62 | 1.114 | |||
| Include | 19.81 | 22.86 | 3.05 | 2.330 | |||
| and | 36.58 | 42.67 | 6.09 | 1.353 | |||
| Include | 38.10 | 41.15 | 3.05 | 2.565 | |||
| MF22-4361 | 105.16 | -70° | 205° | 0.00 | 6.10 | 6.10 | 0.300 |
| include | 1.52 | 3.05 | 1.53 | 0.657 | |||
| MF22-4362 | 147.83 | -70° | 205° | 0.00 | 6.10 | 6.10 | 0.460 |
| Include | 4.57 | 6.10 | 1.53 | 1.395 | |||
| MF22-4363 | 131.06 | -70° | 205° | 0.00 | 6.10 | 6.10 | 1.050 |
| and | 9.14 | 10.67 | 1.53 | 0.298 | |||
| MF22-4366 | 111.25 | -70° | 205° | 27.43 | 30.48 | 3.05 | 0.205 |
| and | 51.82 | 54.86 | 3.04 | 0.785 | |||
| and | 77.72 | 80.77 | 3.05 | 0.344 | |||
| MF22-4367 | 80.77 | -70° | 205° | 0.00 | 1.52 | 1.52 | 0.250 |
| and | 13.72 | 15.24 | 1.52 | 0.373 | |||
| MF22-4369 | 100.58 | -70° | 205° | 9.14 | 10.67 | 1.53 | 0.790 |
| and | 30.48 | 36.58 | 6.10 | 1.016 | |||
| Include | 35.05 | 36.58 | 1.53 | 3.144 | |||
| MF22-4370 | 121.92 | -70° | 205° | 0.00 | 4.57 | 4.57 | 0.406 |
| and | 15.24 | 22.86 | 7.62 | 0.223 | |||
| and | 44.20 | 47.24 | 3.04 | 0.536 | |||
| and | 54.86 | 59.44 | 4.58 | 0.200 | |||
| and | 102.11 | 111.25 | 9.14 | 1.835 | |||
| Include | 102.11 | 103.63 | 1.52 | 8.098 | |||
| Include | 106.68 | 108.20 | 1.52 | 1.628 | |||
| MF22-4371 | 60.96 | -70° | 205° | 0.00 | 3.05 | 3.05 | 0.247 |
| MF22-4375 | 41.15 | -70° | 205° | 15.24 | 21.34 | 6.10 | 0.723 |
| Include | 19.81 | 21.34 | 1.53 | 2.433 | |||
| MF22-4376 | 41.15 | -70° | 205° | 0.00 | 3.00 | 3.00 | 1.212 |
| and | 10.67 | 12.19 | 1.52 | 0.221 | |||
| and | 39.62 | 41.15 | 1.53 | 1.400 | |||
| MF22-4379 | 201.17 | -55° | 205° | 0.00 | 3.05 | 3.05 | 0.291 |
| and | 9.14 | 18.29 | 9.15 | 0.584 | |||
| Include | 16.76 | 18.29 | 1.53 | 1.493 | |||
| San Francisco Project | 64 | May 1, 2026 |
| Goldgroup Mining Inc. |
| Hole ID | Depth/Length (m) |
Dip (°) | Azimuth (°) |
Significative Mineral Interceptions | |||
| From (m) | To (m) | Width (m) | Gold
Assay (g/t) | ||||
| MF22-4380 | 201.17 | -60° | 205° | 0.00 | 6.10 | 6.10 | 0.439 |
| and | 80.77 | 86.87 | 6.10 | 1.341 | |||
| Include | 85.34 | 86.87 | 1.52 | 3.704 | |||
| MF22-4381 | 166.12 | -70° | 205° | 15.24 | 16.76 | 1.52 | 1.117 |
| and | 32.00 | 33.53 | 1.53 | 1.018 | |||
| and | 42.67 | 44.20 | 1.53 | 0.683 | |||
| and | 94.49 | 100.58 | 6.09 | 0.558 | |||
| Include | 97.54 | 99.06 | 1.52 | 1.627 | |||
| and | 146.30 | 147.83 | 1.53 | 0.846 | |||
| and | 164.59 | 166.12 | 1.53 | 0.508 | |||
Table taken from the Magna May, 2022 drilling results memo.
Table 10.4
Summary Significant Results for the Drilling on the Phase 8 North-Northeast Extension (Conglomerate) at the San Francisco Project
| Hole ID | Depth/Length
(m) |
Dip (°) | Azimuth (°) |
Significative Mineral Interceptions | ||||
| From (m) | To (m) | Width (m) | Gold
Assay (g/t) | |||||
| MF22-4311 | 50.29 | -50° | 205° | 9.140 | 10.670 | 1.53 | 0.620 | |
| And | 21.340 | 24.380 | 3.04 | 0.371 | ||||
| MF22-4313 | 71.63 | -50° | 205° | 0.000 | 1.520 | 1.52 | 0.335 | |
| And | 9.140 | 10.670 | 1.53 | 0.721 | ||||
| MF22-4314 | 62.48 | -70° | 205° | 7.620 | 9.140 | 1.52 | 1.266 | |
| And | 19.810 | 21.340 | 1.53 | 0.513 | ||||
| MF22-4316 | 76.20 | -70° | 205° | 12.190 | 15.240 | 3.05 | 0.213 | |
| And | 18.290 | 19.810 | 1.52 | 0.307 | ||||
| MF22-4317 | 275.84 | -50° | 205° | 0.000 | 1.520 | 1.52 | 0.252 | |
| And | 18.290 | 21.340 | 3.05 | 0.488 | ||||
| And | 30.480 | 33.530 | 3.05 | 0.248 | ||||
| And | 35.050 | 38.100 | 3.05 | 0.334 | ||||
| And | 48.768 | 50.292 | 1.52 | 0.290 | ||||
| And | 53.340 | 54.864 | 1.52 | 0.608 | ||||
| And | 62.484 | 64.008 | 1.52 | 3.848 | ||||
| And | 88.392 | 94.448 | 6.06 | 0.324 | ||||
| Include | 91.440 | 92.964 | 1.52 | 0.688 | ||||
| And | 153.924 | 166.116 | 12.19 | 3.097 | ||||
| Include | 155.448 | 156.972 | 1.52 | 1.568 | ||||
| San Francisco Project | 65 | May 1, 2026 |
| Goldgroup Mining Inc. |
| Hole ID | Depth/Length (m) |
Dip (°) | Azimuth
(°) |
Significative Mineral Interceptions | |||
| From (m) | To (m) | Width (m) | Gold
Assay (g/t) | ||||
| Include | 161.544 | 164.594 | 3.05 | 11.106 | |||
| And | 205.740 | 207.264 | 1.52 | 0.626 | |||
| And | 220.980 | 230.124 | 9.14 | 0.495 | |||
| Include | 222.504 | 224.028 | 1.52 | 1.435 | |||
| And | 257.556 | 259.080 | 1.52 | 0.973 | |||
| Include | 257.556 | 259.080 | 1.52 | 1.722 | |||
| MF22-4318 | 106.68 | -70° | 205° | 6.100 | 7.620 | 1.52 | 0.310 |
| 16.760 | 18.290 | 1.53 | 0.245 | ||||
| 22.860 | 24.380 | 1.52 | 0.987 | ||||
| MF22-4319 | 80.77 | -70° | 205° | 12.190 | 13.720 | 1.53 | 0.274 |
| And | 18.290 | 19.810 | 1.52 | 0.219 | |||
| MF22-4320 | 92.96 | -70° | 205° | 3.050 | 4.570 | 1.52 | 0.428 |
| And | 16.760 | 18.290 | 1.53 | 0.524 | |||
| MF22-4321 | 80.77 | -70° | 205° | 0.000 | 1.520 | 1.52 | 0.529 |
| And | 12.190 | 16.760 | 4.57 | 0.300 | |||
| And | 25.910 | 27.430 | 1.52 | 0.235 | |||
| And | 28.960 | 30.480 | 1.52 | 0.229 | |||
| And | 38.100 | 39.620 | 1.52 | 0.250 | |||
| MF22-4322 | 92.96 | -70° | 205° | 0.000 | 1.520 | 1.52 | 0.446 |
| And | 9.140 | 10.670 | 1.53 | 0.214 | |||
| And | 12.190 | 15.240 | 3.05 | 0.203 | |||
| And | 41.150 | 54.864 | 13.71 | 0.858 | |||
| Include | 44.200 | 45.720 | 1.52 | 5.292 | |||
| MF22-4323 | 80.77 | -70° | 205° | 3.050 | 4.570 | 1.52 | 0.270 |
| And | 10.670 | 12.190 | 1.52 | 0.586 | |||
| And | 18.290 | 22.860 | 4.57 | 0.560 | |||
| Include | 21.340 | 22.860 | 1.52 | 1.211 | |||
| MF22-4324 | 62.48 | -70° | 205° | 4.570 | 6.100 | 1.53 | 0.557 |
| And | 13.720 | 16.760 | 3.04 | 0.226 | |||
| And | 19.810 | 21.340 | 1.53 | 0.540 | |||
| MF22-4325 | 80.77 | -50° | 205° | 12.190 | 18.290 | 6.10 | 0.280 |
| And | 27.430 | 28.960 | 1.53 | 0.536 | |||
| MF22-4326 | 80.77 | -50° | 205° | 4.570 | 6.100 | 1.53 | 1.520 |
| And | 15.240 | 16.760 | 1.52 | 0.638 | |||
| MF22-4328 | 68.58 | -50° | 205° | 7.620 | 9.140 | 1.52 | 0.294 |
| And | 10.670 | 12.190 | 1.52 | 0.223 | |||
| And | 13.720 | 15.240 | 1.52 | 0.200 | |||
| And | 19.810 | 24.380 | 4.57 | 0.411 | |||
| MF22-4329 | 80.77 | -70° | 205° | 4.570 | 6.100 | 1.53 | 0.326 |
| San Francisco Project | 66 | May 1, 2026 |
| Goldgroup Mining Inc. |
| Hole ID | Depth/Length
(m) |
Dip (°) | Azimuth
(°) |
Significative Mineral Interceptions | |||
| From (m) | To (m) | Width (m) | Gold
Assay (g/t) | ||||
| And | 24.380 | 25.910 | 1.53 | 0.217 | |||
| And | 41.150 | 45.720 | 4.57 | 0.265 | |||
| MF22-4330 | 105.16 | -60° | 205° | 0.000 | 1.520 | 1.52 | 0.522 |
| And | 15.240 | 16.760 | 1.52 | 0.402 | |||
| And | 25.910 | 27.430 | 1.52 | 0.211 | |||
| And | 35.052 | 36.576 | 1.52 | 0.376 | |||
| MF22-4332 | 80.77 | -70° | 205° | 35.050 | 42.670 | 7.62 | 0.332 |
| MF22-4333 | 80.77 | -70° | 205° | 3.050 | 4.570 | 1.52 | 0.303 |
| And | 16.760 | 18.290 | 1.53 | 0.204 | |||
| MF22-4335 | 80.77 | -70° | 205° | 16.760 | 18.290 | 1.53 | 0.496 |
| And | 28.956 | 30.480 | 1.52 | 0.378 | |||
| MF22-4337 | 80.77 | -70° | -205° | 6.100 | 7.620 | 1.52 | 0.241 |
| And | 13.720 | 15.240 | 1.52 | 0.262 | |||
| And | 16.760 | 18.290 | 1.53 | 0.228 | |||
| MF22-4338 | 86.87 | -70° | 205° | 9.140 | 10.670 | 1.53 | 0.205 |
| And | 13.720 | 15.240 | 1.52 | 0.287 | |||
| And | 16.760 | 21.340 | 4.58 | 0.616 | |||
| Include | 18.290 | 19.810 | 1.52 | 1.410 | |||
Table taken from the Magna May, 2022 drilling results memo.
For Table 10.3 and Table 10.4 the reader should note that the true width for each intersection has not been determined as the true width of the economic mineralization depends on the angle that the drill hole intersects the mineralization, the current parameters used to determine the economic cut-off grade, and the 3D model interpretation of the shear zones and mineralization. The true width of the mineralization can therefore change over time and the true width of the mineralization for each interval is linked to the current block model and the parameters used to determine the MRE. The true width of the mineralized interval does not necessarily represent to overall true width of the mineral deposit as a whole.
| 10.3 | Micon QP Comments |
The 2022 drilling program successfully identified mineralization in both the Phase 8 to Phase 9 portions of the San Francisco Pit and the North Pit area at the San Francisco Project. The 2022 drilling to expand the known extent of the potential economic mineralization and should allow Goldgroup to undertake further economic studies on the San Francisco Project.
Successive companies through their drilling programs have continued to define the extent of the known mineral deposits at the San Francisco Project and Micon’s QPs believe that Goldgroup will continue to be successful in this regard with its systematic drilling campaigns.
| San Francisco Project | 67 | May 1, 2026 |
| Goldgroup Mining Inc. |
The various exploration teams at the San Francisco Project have historically followed the CIM Mineral Exploration Best Practice Guidelines (the Exploration Guidelines). Therefore, geological information has been collected following standard industry procedures and practices and therefore, can be used as the basis for mineral resource estimation purposes.
Micon’s QPs believe that Goldgroup will continue to follow CIM best practices regarding exploration programs at the San Francisco Project.
| San Francisco Project | 68 | May 1, 2026 |
| Goldgroup Mining Inc. |
11 SAMPLE PREPARATION, ANALYSES AND SECURITY
| 11.1 | Goldgroup Sample Preparation, Analysis and Security |
Goldgroup has recently acquired the San Francisco Project and once it has completed its review of the previous work and results, Goldgroup will outline its own sample preparation, analysis and security protocols for exploration and drilling programs for the Project.
| 11.2 | Quality Assurance/Quality Control Program until August, 2020 |
Information contained in this Section, referring to sampling procedures and assay results for the period up to August 2020. This information was extracted from the August 28, 2020, Pre-Feasibility Study completed by Micon for Magna. More recent work performed by Magna is also presented in this section.
| 11.2.1 | Alio Sample Preparation, Analysis and Security Programs |
Alio, through its Mexican subsidiary, conducted its initial exploration drilling program on the Project in August and September, 2005, and instituted sampling procedures which have been discussed in the 2005, 2007, 2008, 2010, 2011, 2013 and 2016 Technical Reports that were filed on SEDAR. Only minor in-fill drilling has been conducted since the previous February, 2016, Technical Report was issued and this Section reproduces the sample preparation, analyses and security discussion contained in that report.
During the January, 2014 to December, 2015, drilling programs, Alio continued to use the sampling procedures, analyses and security protocols instituted for the previous reverse circulation and diamond drilling campaigns. Micon reviewed and extensively discussed the sampling procedures during the July, 2013 site visit and was satisfied that these procedures were accurately carried out and in accordance with the best practices in use by the mining industry. Micon also discussed the procedures during the February, 2016 site visit. Micon concludes that the results produced by the procedures were sufficiently reliable to form the basis for a mineral resource estimate.
Alio’s January, 2014 to December, 2015 exploration drilling programs consisted of RAB, RC and core drilling. All drill holes were field logged and sampled as the holes were in progress. During the drilling, and each day that the drilling was completed, the information contained on the hand-written drilling logs (field logs) was transcribed into an Excel® spreadsheet. The Excel® spreadsheet contains the basic drill hole data, individual sample data and assay results, as well as the codes for the lithology, alteration and mineralization. This information was converted to an ASCII file to import it into the database which supports the resource estimates. Geological and mineralization interpretation was conducted based on cross-sections which were produced using an AutoCAD® software package.
The drilling completed in this period was based on an analysis of the results of the exploration programs of previous years and followed up on previous targets or generally attempted to define the potential for secondary deposits north of the San Francisco pit.
| San Francisco Project | 69 | May 1, 2026 |
| Goldgroup Mining Inc. |
| 11.2.1.1 | Reverse Circulation Drilling |
From the RC drilling, a portion of the material generated for each sample interval was retained in a plastic specimen tray created specifically. The samples in specimen trays constitute the primary reference for the hole in much the same way as the core does for diamond drilling. The specimen tray was marked with the drill hole number and each compartment within the tray was marked with both the interval and number for the respective sequential sample it contained. Empty compartments were left for the locations where the blank and standard samples were inserted into the sequential sample stream, and two compartments were identified for duplicate samples. Figure 11.1 shows some of the specimen trays for drill hole TF-1566.
Figure 11.1
Specimen Trays for Drill Hole TF-1566
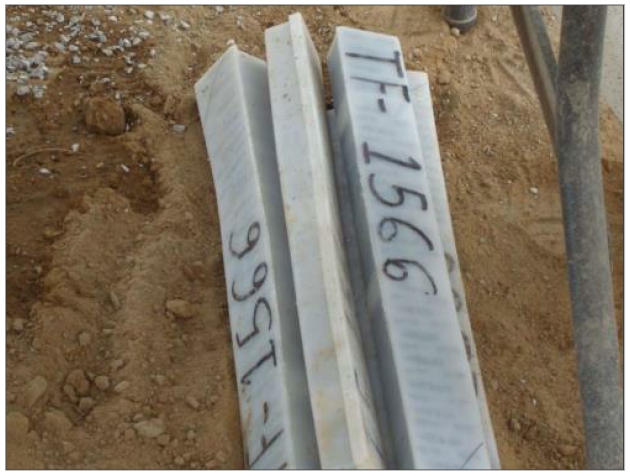
Due to the nature of RC drilling, only rock chip fragments are produced, and these range from a very fine-grained powder up to coarse chips 2 cm in size. Since the stratigraphic contact between the different rock units cannot be identified exactly, the holes were sampled on equal 1.5 m (5 ft) intervals from the collar to the toe of the hole. The sample interval was chosen because it represented two samples per drill rod (3 m or 10 ft). In general, this is considered to be the standard sampling length within the industry.
Samples were taken in the overlying alluvium, as well as within the underlying rock units. The alluvium samples were subject to random assaying, whereas every sample originating from the underlying rock units was assayed. The recovery of the material during the drilling program was excellent, on the order of 90% to 95%, in both near surface sulphide-oxide and lower sulphide zones.
A common feature in the sampling process for RC drilling is that a unique sample tag was inserted into the sample bag with each sample, and each sample bag was marked with its individual sample number. The bags containing the blank and standard samples were added into the sequential numbering system prior to shipment of the samples to the preparation facility. Sample preparation and assaying were performed at the San Francisco mine. Approximately 15% of the samples assayed in the laboratory at the San Francisco mine were checked at an external laboratory. The principal external laboratory was the IPL-Inspectorate laboratory in Vancouver, B.C.
| San Francisco Project | 70 | May 1, 2026 |
| Goldgroup Mining Inc. |
Samples identified as field duplicate samples during the RC drilling were split into two separate sequentially numbered samples during the sampling process at the drill.
| 11.2.1.2 | Core Drilling |
For core drilling, control starts after a run has been completed and the rods are pulled out of the hole. Once the core is removed, it is placed in core boxes. This step in the procedure is completed by the contractor’s personnel, under the supervision of an Alio geologist. Alio and the drill contractors follow generally accepted industry procedures for core placement in the core boxes.
Small wooden tags mark the distance drilled in metres at the end of each run, the depth from and to, and the length drilled and length recovered. The drill rods used by the contractors involved in the core drilling are measured in Imperial units, while the tags placed in the boxes are measured in metric units. The hole number and progressive box number are marked on each filled box by the drill helper and checked by the geologist. Once the core box is filled at the drill site, the box is covered with a lid to protect the core, and the box is sent to the core logging facility for further processing.
For diamond drilling where core is produced, the exact stratigraphic contact between the various different rock units can be identified and these contacts were used as the primary basis for separation of the sample intervals. The maximum sample length within the stratigraphic unit was restricted to approximately 1.0 m or 2.0 m, with no minimum restriction. The maximum sample lengths were in accordance with accepted industry practice. In addition to the stratigraphic restrictions that limit the length of the core interval, the size of the sample may be restricted because of the content or type of mineralization encountered within the drill hole. In general, core recovery for the diamond drill holes at the San Francisco Project was better than 98% and no core loss due to poor drilling methods or procedures was experienced.
A unique sample tag was inserted into the sample bag with each sample, and each sample bag was marked with its individual sample number. The bags containing the blank and standard samples were added into the sequential sample numbering system prior to be being shipped to the assay preparation facilities of Inspectorate or ALS-Chemex. Both of these preparation facilities are located in Hermosillo, although ALS-Chemex sent samples to its facilities in Chihuahua and Zacatecas for preparation, if there was a large backlog of samples waiting to be prepared. During the sampling process, some samples were identified as field duplicates and these were also inserted into the sample stream.
| San Francisco Project | 71 | May 1, 2026 |
| Goldgroup Mining Inc. |
| 11.2.2 | Alio Sample Collection and Transportation |
| 11.2.2.1 | Reverse Circulation Drilling |
The RC drill sampling was conducted by a team of two or three geological assistants, under the close supervision of the Alio staff geologists in charge of the on-site program. The staff geologists were responsible for the integrity of the samples from the time they were taken until they were delivered to the preparation facilities at the San Francisco mine. Figure 11.2 shows collection of a RC sample during the July, 2011 Micon site visit.
Figure 11.2
Reverse Circulation Sample Collection
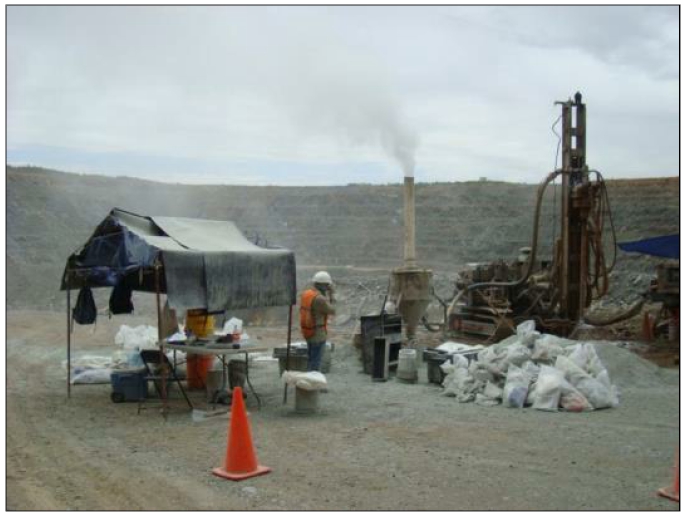
The RC cuttings collected at the drill site were discharged from the drill hole through a hose, into a cyclone where they were collected in a plastic pail. Sampling of the material generated during the RC drilling was conducted at the drill rig using a stainless-steel riffle splitter if the material was dry and a rotary splitter situated below the cyclone if the material was wet. The cyclone and splitters were cleaned between samples, and, in the case of wet samples, the cyclone and splitters were blown out using compressed air and also washed out between each sample using clean water. Using a 12.5 cm drill bit diameter and a sample length of 1.52 m, it is estimated that the original sample weighed 48.3 kg, prior to making allowance for recovery. It is estimated that the average recovery was between 90% and 95%, which would indicate that the mass of the recovered sample varied between 42 and 45 kg.
The method of splitting the samples derived from the RC drilling was as follows:
| 1. | If the sample was dry, the entire sample interval was collected in a bucket and then passed through the riffle splitter where a subsample of 21 to 23 kg was collected. The remaining 21 to 23 kg was rejected. The 21 to 23 kg subsample was subjected to a second split to obtain two samples of 10 to 12 kg (an original and a witness sample). The geologist or an assistant (under supervision) had previously marked the drill hole number and sample number on the plastic sample bags and inserted the sample tag into the sample bag for the original sample. Both bags were closed and sealed at the drill with plastic tie wraps and transported to the camp facilities. |
| San Francisco Project | 72 | May 1, 2026 |
| Goldgroup Mining Inc. |
| 2. | If the sample was wet, it was discharged to a cyclone and then passed through a rotary cone splitter to divide the sample into two equal portions, one of which was automatically rejected. The other portion was collected and simultaneously split into two equal halves by means of a mechanism designed for this purpose and installed in the lower portion of the rotary splitter. The two samples were collected in fabrine (micropore) sample bags to allow retention of the solids and the slow dissipation of the drilling water through the pores in the bags, without sample loss. In all cases, a flocculent was used to settle the solids, including the fine portion, prior to tying the fabrine bag. The outside of each sample bag was marked with the sample’s individual number which corresponded to the number on the sample tag which was inserted into the bag containing the original sample. |
All samples from the RC drilling were prepared at the drill site by the Alio staff geologists and their assistants. Each time that a hole was completed, a truck was dispatched from the drill site to the preparation facilities of the Alio assay laboratory.
For check assays and their preparation, a truck was periodically dispatched to deliver samples to the Hermosillo assay preparation facility of IPL Laboratories and, from January, 2010, to IPL-Inspectorate. Sample bags containing the blank and standard samples were added into the sequential numbering system prior to shipment of samples to the preparation facilities, both at the San Francisco mine and in Hermosillo. Samples selected as duplicates were split into two separate sequentially numbered samples during the sampling process at the drill.
| 11.2.2.2 | RAB Drilling |
The procedures used for the RAB drilling are the same as those used for the RC drilling, with the exception of the length of the sample. In the case of the RAB drilling, the sample length was 2.032 m rather than 1.52 m used for RC drilling. This generated a larger sample weight per sample but did not impact the quality of the sample.
| 11.2.2.3 | Core Drilling |
Geologic descriptions of the core samples, including nature of the sample, length of sample, lithology, alteration and mineralization, were captured on drill log forms. Samples were sealed in cloth bags with drawstring closures with the sample identification tags placed with each sample in the bag. A matching tag was retained in a sample book. Samples were stored on site in a locked warehouse at the exploration camp.
A truck was sent to each drill site to collect the core boxes at regular intervals during the day. The boxes were loaded into the truck and placed in a criss-cross pattern and then secured to the truck by ropes to prevent movement on the short drive back to the on-site core logging facilities.
Once the core boxes arrived at the logging facility, they were laid out in order, the lids were removed and the core washed to remove any grease and dirt which may have entered the boxes. The depth markers were checked by the geologist and the depth “from” and “to” for each box was noted on both the top and the bottom covers of each core box.
| San Francisco Project | 73 | May 1, 2026 |
| Goldgroup Mining Inc. |
The geologist logging the core began by examining the core to ensure it was intact. During the core logging process, the geologist defined the sample contacts and designates the axis along which to cut the core. Special attention was paid to the mineralized zones to ensure that the sample splits were representative. The sample limits were marked on the core, as well as on the side of the core box, and the sample numbers were marked on the core box next to the sample limits. Afterwards, the sample limits were input into an Excel spreadsheet, which recorded the sample number and intervals.
Once the core had been logged and the samples marked, the core boxes were brought to the area where an electric diamond saw had been set up to cut the samples. At the sampling area, two core splitters and their helpers cut the core in half. Once the core had been sawn in half, one half of the core was placed into a plastic sample bag and the other half returned to the core box. The geologist or an assistant had previously marked the sample bags with the sample number and inserted the individual numbered sample tag into the plastic bag. A geologist supervised the core sawing to ensure that the quality of the sampling remains high and that no mistakes were introduced into the system due to sloppy practices. The boxes containing the remaining half core were stacked, with lower numbers at the bottom and the higher numbers at the top and stored on site in a secure core storage facility.
| 11.2.3 | Alio General QA/QC Procedures |
As part of Alio’s QA/QC procedures, a set of samples comprised of a blank sample, a standard reference sample and a field duplicate sample were inserted randomly into the sample sequence. The insertion rate for the blanks, standards and duplicate samples was approximately one each in every 25 samples.
| 11.2.3.1 | Blank Samples |
Since 2005, the blank samples used for the San Francisco drilling program have been obtained from three sources.
During the second semester of 2011, blank samples were used that had been prepared from a tonalite dike that outcrops on the southwestern extension of the San Francisco pit. The rock unit is younger than both the host rock of the gold mineralization and the mineralizing events in the region, at least as far as is known. A geologist working with Alio, and previously for both Geomaque and Fresnillo, considered the material in the dike to be barren and this was verified during the 2005 to 2010 drill programs. However, during the 2011 to 2013 program, anomalous gold values, including economic values, started to appear in this material and a detailed mapping program resulted in the discovery of xenoliths of mineralized rock within the dike. As a result, Alio made the immediate decision to use material from another source, which was selected based upon a regional geological reconnaissance. The regional reconnaissance resulted in the identification of a basalt-andesite occurrence in several areas within a 40 km perimeter around the San Francisco mine. Due to the accessibility of the Norma Project area to the northwest of the mine, a series of outcrops were chosen at the southern end of the Norma concession, from which several samples were taken and assayed by the San Francisco mine laboratory. The results of the assaying revealed gold values either below the detection limits or no gold.
| San Francisco Project | 74 | May 1, 2026 |
| Goldgroup Mining Inc. |
While Alio was waiting for a new blank sample to be generated from its own material, it used blanks purchased from Proveedora de Laboratorios, SA de CV, based in Hermosillo. Alio purchased two types of blanks, a fine and coarse grain blank, with the first one used to check the assaying of the primary laboratory and the second to check the sample preparation in the Alio on-site facilities.
The procedure used to prepare the bags of blanks from the basalt-andesite was the same that the used by Alio for the tonalite. Alio collected 1 tonne lots of the material which were transported to the San Francisco mine, where the material was crushed to -1/8”, followed by homogenization, and then split into 1 kilogram lots. During the drilling campaign, gold values were detected in a specific lot of blank samples. Alio then obtained the sample rejects from the Inspectorate laboratory and re-analysed them in the San Francisco laboratory which confirmed the gold values but noted that the material in the rejects was different from that in the blanks. From the position of the samples in the sampling sequence, and their position with respect to the gold values hosted in the metamorphic sequence crosscut by the drilling, it was concluded that a mistake had been made in the numbering of the samples. The rest of the blank material was promptly rejected, and a new 2-t sample was obtained and sent for preparation to the Sonora preparation laboratory, with Alio specifying the requirements for the preparation.
Figure 11.3 and Figure 11.4 show fragments of rock used for the blank samples and the bags once they had been prepared for insertion in the sampling sequence.
Figure 11.3
Fragment of Basalt used for Blank Sample
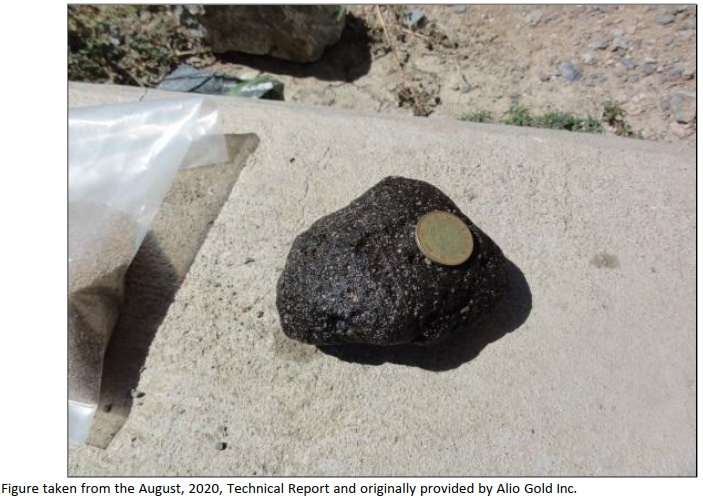
| San Francisco Project | 75 | May 1, 2026 |
| Goldgroup Mining Inc. |
Figure 11.4
Blank Sample Bag ready to be Inserted into the Sample Sequence
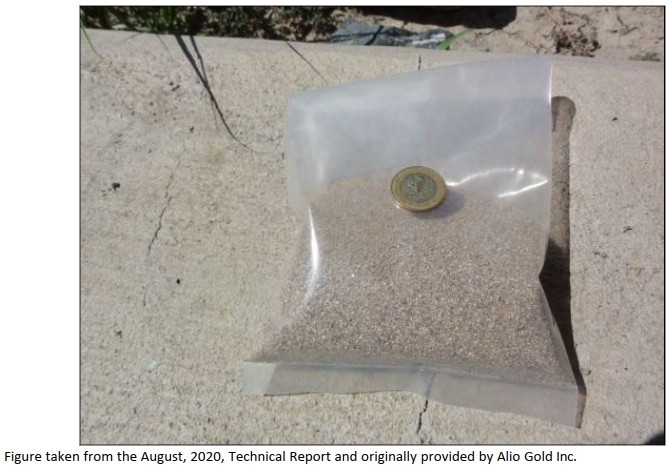
| 11.2.3.2 | Standard Reference Material |
Certified standard reference materials (SRM’s) were submitted with each sample shipment during the course of the drill programs. A total of 27 standard reference samples has been used since 2005, and these are summarized in the Table 11.1. Standard pulps, consisting of 70 to 100 g of material, were randomly inserted into each batch of 25 samples. The 27 standards include low, medium and high gold grades, in relation to the average grade of the known deposits in the area.
Table 11.1
Standard Reference Material Samples used During the Drilling Programs
| Standard | Accepted
Gold Value |
Lower Gold Limit (g/t) |
Upper
Gold Limit (g/t) |
Source | Material | |
| g/t | +/- | |||||
| OXC-88 | 0.203 | 0.003 | 0.183 | 0.223 | RockLabs | Basalt and feldspar with gold |
| OXC-102 | 0.207 | 0.002 | 0.192 | 0.222 | RockLabs | Basalt and feldspar with gold |
| OXC-109 | 0.201 | 0.020 | 0.191 | 0.211 | RockLabs | Basalt and feldspar with gold |
| OXD-87 | 0.417 | 0.004 | 0.391 | 0.443 | RockLabs | Basalt and feldspar with gold |
| OXD-108 | 0.414 | 0.003 | 0.380 | 0.448 | RockLabs | Basalt and feldspar with gold |
| OXE-86 | 0.613 | 0.007 | 0.571 | 0.655 | RockLabs | Basalt and feldspar with gold |
| OXE-101 | 0.607 | 0.005 | 0.566 | 0.648 | RockLabs | Basalt and feldspar with gold |
| OXE-106 | 0.606 | 0.004 | 0.576 | 0.636 | RockLabs | Basalt and feldspar with gold |
| OXF-85 | 0.805 | 0.008 | 0.755 | 0.855 | RockLabs | Feldspars and iron pyrite |
| OXF-100 | 0.804 | 0.006 | 0.764 | 0.844 | RockLabs | Feldspars and iron pyrite |
| San Francisco Project | 76 | May 1, 2026 |
| Goldgroup Mining Inc. |
| OXF-105 | 0.800 | 0.005 | 0.743 | 0.857 | RockLabs | Feldspars and iron pyrite |
| OXG-83 | 1.002 | 0.009 | 0.948 | 1.056 | RockLabs | Basalt and feldspar with gold |
| OXG-84 | 0.920 | 0.010 | 0.850 | 0.994 | RockLabs | Basalt and feldspar with gold |
| OXG-99 | 0.932 | 0.006 | 0.860 | 1.004 | RockLabs | Basalt and feldspar with gold |
| OXH-66 | 1.285 | 0.012 | 1.221 | 1.349 | RockLabs | Basalt and feldspar with gold |
| OXH-82 | 1.278 | 0.010 | 1.224 | 1.332 | RockLabs | Basalt and feldspar with gold |
| OXI-81 | 1.807 | 0.011 | 1.692 | 1.922 | RockLabs | Basalt and feldspar with gold |
| OXH-97 | 1.278 | 0.009 | 1.214 | 1.342 | RockLabs | Basalt and feldspar with gold |
| OXJ-95 | 2.337 | 0.018 | 2.220 | 2.454 | RockLabs | Basalt and feldspar with gold |
| GS-2K | 1.970 | 0,180 | 1.862 | 2.078 | CDN Labs | Blank granitic ore and high gold ore |
| GS-2L | 2.340 | 0.240 | 2.163 | 2.517 | CDN Labs | Blank granitic ore and high gold ore |
| GS-P2A | 0.229 | 0.030 | 0.198 | 0.260 | CDN Labs | Ore of the Carlin style mineralization |
| GS-P3B | 0.409 | 0.042 | 0.378 | 0.440 | CDN Labs | Blank granitic ore and high gold ore |
| GS-P3C | 0.263 | 0.020 | 0.237 | 0.289 | CDN Labs | Blank granitic ore and high gold ore |
| GS-P7E | 0.766 | 0.086 | 0.728 | 0.804 | CDN Labs | Blank granitic ore and high gold ore |
| PGMS-18 | 0.5170 | 0.060 | 0.435 | 0.599 | CDN Labs | Mix material from two ore deposits in the US |
| ME-15 | 1.386 | 0.102 | 1.284 | 1.488 | CDN Labs | Ore from Minera San Javier, Mexico |
Table taken from the August, 2020 Technical Report, and originally provided by Alio Gold Inc.
| 11.2.3.3 | Duplicate Samples |
For the RC drilling, the samples which were identified for duplication (field duplicates) were processed and split in the same way as the regular samples taken on either side of them. In the case of dry samples, the final 21 to 23 kg sample was subjected to a further split in the field, yielding two 10.5 to 11.5 kg samples. Wet samples were dried and then passed through the riffle splitter to obtain a second (duplicate) sample of approximately the same mass as the original. The duplicate samples were given sequential numbers and submitted as two separate samples for the purpose of assaying.
| 11.2.4 | Preparation Laboratories |
| 11.2.4.1 | San Francisco Mine Preparation Facilities |
For the 2010 to 2011 exploration drilling program, only a small number of samples were prepared and assayed by the San Francisco mine laboratory. In August, 2010, Alio decided to send all of the samples from the exploration program for preparation at an external laboratory. Alio did consider building a laboratory at the mine site to analyse the exploration assays, but the costs related to the laboratory, in order to meet the strictest QA/QC requirements, were prohibitive and it was decided to build only the preparation facilities, which were completed and ready to begin operations in November, 2012. This facility at the mine was only capable of preparing up to 350 to 400 pulps per day which, considering the quantity of samples generated by the exploration drilling, meant that a large proportion of the samples were sent to external laboratories for both preparation and assaying. Alio conducted an expansion of the preparation facility, so that it was able to prepare at least 700 samples per day of RC or core drilling.
The equipment in the preparation facilities includes:
| · | Two ovens for drying samples (Grieve TBH550E2 model). |
| San Francisco Project | 77 | May 1, 2026 |
| Goldgroup Mining Inc. |
| · | Two TBH-550 oven trucks. |
| · | Sixteen nickel plated carbon steel shelves. |
| · | One hundred SS rectangular sample pans (Model SC-50). |
| · | Two Combo Boyd/RSD Boyd crushers with single split. |
| · | Two VP-1989 ring and puck pulverizer, Bico 3 phase motor. |
The procedure used at the San Francisco mine for the preparation of samples to be assayed for gold was as follows:
| 1. | The samples received were inspected by the laboratory supervisor or an assigned deputy, to ensure that each was identified and that the original packing was not damaged. All of the samples were placed in the designated reception area. |
| 2. | On the registration form, the user entered the date and time, the work order number assigned by the laboratory, and record the origin of the sample, elements to be analysed, requested assay method, sample type (rock fragments, soil, etc.) and priority of the sample. The registration form was filled out in duplicate. |
| 3. | Once reviewed, the form was then registered with the name and signature of the persons who submitted and received the samples. |
| 4. | All exploration and mine samples were weighed individually, with the weight recorded in the designated notebooks. The samples were then delivered to the sample preparation staff. |
| 5. | All samples received were dried in trays of an adequate size to ensure that they remain free of any contaminating material. |
| 6. | Using a permanent marker, each sample was labelled according to its original identification number. Each sample was poured into a corresponding tray, ensuring that 100% of the sample was contained within the tray, to avoid cross-contamination of samples. Inside each tray was an identification card that matches the original identification label. |
| 7. | Each tray containing a sample was placed in the oven. |
| 8. | Samples with a low moisture content were checked after 60 minutes to see if they had dried. Samples with high moisture content were checked after 3, 6, or 8 hours, at the discretion of the supervisor. Once the samples were completely dry, they were removed from the oven and placed on trolleys for transport. |
| 9. | The initial crushing was done in a jaw crusher, after it had been cleaned with compressed air. A first pass was conducted to reduce the size of the material to 85% passing a ¼ inch mesh. The material was then transferred to another tray that had already been labelled with the original sample number. Once the crushing was completed, the crusher and trays used in the process were cleaned using compressed air, and then the crusher was cleaned using fragments of monzonite dike. This material was monitored by the laboratory periodically to ensure that it was unmineralized. |
| San Francisco Project | 78 | May 1, 2026 |
| Goldgroup Mining Inc. |
| 10. | A second crushing pass was performed using a roll crusher, in order to obtain a product of minus 10 mesh (2 mm). |
| 11. | The minus 10 mesh product was homogenized by rolling on a rectangular blanket, canvas or plastic liner. Once the sample homogenized, it was placed back into the tray to be split in a Jones riffle splitter. |
| 12. | Prior to splitting the sample, the splitter was checked to ensure that it was free of particles that could contaminate the sample. Compressed air was used where necessary to clean the splitter. The sample was then split, with one half being returned to the original sample bag and the other portion being split again. |
| 13. | The sample continued to be split between 3 to 8 times, until a sample of approximately 250 grams was obtained. This sample was then sent to the pulverizer. |
| 14. | Pulverizing was conducted such that 90% of the material was minus 150 mesh. The samples arrived at the pulverizing process in laminated Kraft envelopes, with each one identified according to the sample number and the work order. Once each sample had been pulverized, it was delivered to an external laboratory for assaying. |
Equipment in the sample preparation facilities at the San Francisco mine is shown in Figure 11.5 and Figure 11.6.
Figure 11.5
Oven for Drying Samples in the Preparation Facilities
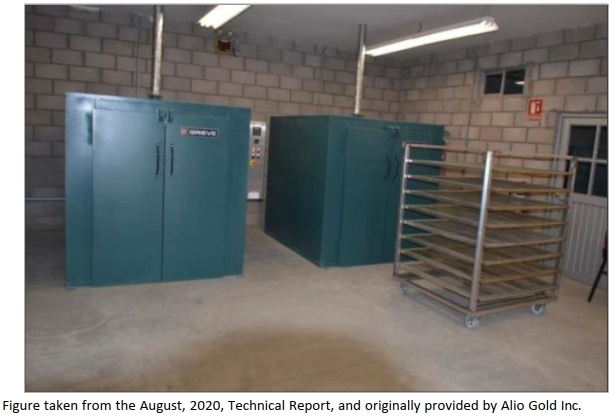
| San Francisco Project | 79 | May 1, 2026 |
| Goldgroup Mining Inc. |
Figure 11.6
Combo Boyd/RSD Boyd Crusher with Single Split
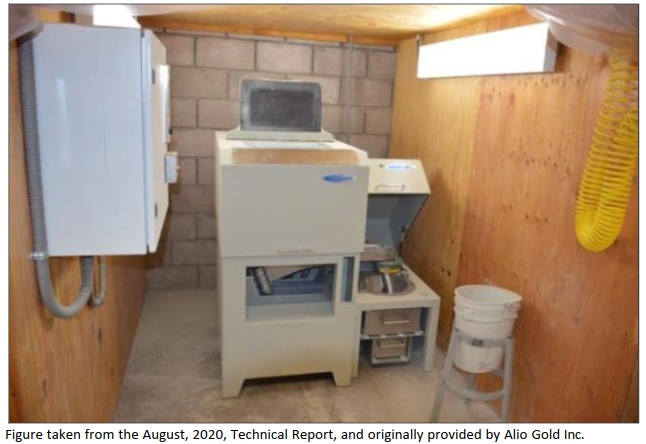
| 11.2.4.2 | Sample Preparation and Analytical Protocols for Services Provided to Alio by Inspectorate |
Samples from the San Francisco mine were picked up periodically by Inspectorate de Mexico, SA de CV. (Inspectorate), a subsidiary of Inspectorate America Corp. (also, Inspectorate). These sample pickup trips were performed by Inspectorate’s wholly owned trucks, driven by full time Inspectorate employees. Samples were picked up at the San Francisco mine.
Alio delivered the samples to Inspectorate personnel in rice sacks marked with the numbers corresponding to the samples in each sack. The samples inside the rice sack were contained in plastic bags marked with the sample number and including a numbered sample tag.
Alio provided proper documentation to Inspectorate’s personnel regarding the samples being picked up, including a list of the samples delivered, the type of samples, the type of analysis requested and the elements for which assays are to be reported.
| 11.2.4.2.1 | Sample Preparation Process for Reverse Circulation Samples |
Samples were driven to Inspectorate’s sample preparation facilities in Hermosillo, Sonora, where they were subjected to the sample preparation process prior to shipment of a representative sub-sample to the analytical laboratories located in Richmond, B.C., Canada or Sparks, Nevada, USA.
| San Francisco Project | 80 | May 1, 2026 |
| Goldgroup Mining Inc. |
| 11.2.4.2.2 | Sample Sorting and Entering Data into the Laboratory Information Management System (LIMS) |
Once the samples were received at Inspectorate’s sample preparation facilities, they were sorted in alpha-numerical or numerical order in the sample layout area. A registration form was completed providing details of the samples received.
When all the samples had been sorted and no extra, missing or duplicate samples were found, the sample registration was accepted by the supervisor and was taken to the administration office where the sample data were entered into the Laboratory Information Management System (LIMS).
| 11.2.4.2.3 | Sample Drying |
Once the samples had been registered, each sample was taken out of its plastic bag and placed in a stainless-steel drying pan which was then positioned in the wheeled drying racks. The drying racks were placed inside a high-capacity drying oven where the samples were fully dried at 100°C.
| 11.2.4.2.4 | Sample Crushing and Splitting |
Once the samples were fully dried, the wheeled racks were taken to the crushing area where the entire sample was crushed by a TM Engineering Terminator Jaw Crusher to 70% minus 10 mesh (2 mm).
A quality control check test was performed to ensure that the crushed sample met the specified size criteria. The test was performed on the first sample crushed at the beginning of a shift and then once every 40 samples thereafter.
Once a sample had been crushed, it was split using a Jones riffle splitter until a 250 g representative sub-sample was obtained.
| 11.2.4.2.5 | Sample Pulverizing |
The entire 250 sub-sample was pulverized by using a Bico VP-1989 VP Pulverizer or LM2 Labtechnics Pulverizer, to 85% passing minus 200 mesh (75 microns).
A quality control check test was performed to ensure that the pulverized samples met the specified size criteria. This test was performed at the same frequency as the crushed sample sizing test.
The pulverized material was split to obtain a 100 g representative sample, which was sent to Inspectorate’s analytical laboratory in Richmond, B.C. or Sparks, Nevada, where it was analysed. The other 150 g split was saved in the warehouse for future checks or returned to the San Francisco mine.
Samples from the San Francisco Project were assayed for gold by fire assay, with atomic absorption finish, on a one assay-tonne sample. The lower and upper detection limits for this method are 5 and 10,000 ppb.
Inspectorate’s Metals and Minerals Inspection and Laboratory Testing Services are certified by BSI Inc. (BSI) annually, in compliance with the ISO 9001:2008 Guidelines for Quality Management.
| San Francisco Project | 81 | May 1, 2026 |
| Goldgroup Mining Inc. |
Inspectorate’s internal QA/QC program is considered to meet normal industry standards for analytical laboratories.
| 11.2.4.3 | Sample Preparation and Analytical Protocols for Services Provided to Alio by ALS |
The following is taken and abbreviated from notes provided to Alio by ALS.
| 11.2.4.3.1 | Logging Procedures |
All samples received at ALS Chemex are furnished with a bar code label attached to the original sample bag. The system will also accept client supplied bar coded labels that are attached to sampling bags in the field. The label is scanned and the weight of the sample is recorded together with additional information such as date, time, equipment used and operator name. The scanning procedure is used for each subsequent activity involving the sample from preparation to analysis, through to storage or disposal of the pulp or reject.
ALS logging (tracking) procedures are summarized in Table 11.2.
Table 11.2
ALS Method Code and Description for Alio Sample Preparation
| Method Code | Description |
| LOG-21 | Log sample in tracking system (Samples received with bar code labels attached). |
| LOG-22 | Log sample in tracking system (Samples received without bar code labels attached). |
Table taken from the August, 2020, Technical Report, and originally provided by Alio Gold Inc.
| 11.2.4.3.2 | Standard Sample Preparation: Dry, Crush, Split and Pulverize |
The sample is logged in the tracking system, weighed, dried and finely crushed to better than 70% passing a 2 mm screen. A split of up to 250 g is taken and pulverized to better than 85% passing a 75-micron screen. ALS states that this method is appropriate for rock chip or core samples. Table 11.3 summarizes ALS methodology codes and descriptions for the preparation methods used for Alio samples.
Table 11.3
ALS Method Code and Description for Alio Sample Preparation
| Method Code | Description |
| LOG-22 | Sample is logged in tracking system, and a bar code label is attached. |
| CRU-31 | Fine crushing of rock chip and drill samples to better than 70% of the sample passing 2 mm. |
| SPL-21 | Split sample using riffle splitter. |
| PUL-31 | A sample split of up to 250 g is pulverized to better than 85% of the sample passing 75 microns. |
Table taken from the August, 2020, Technical Report, and originally provided by Alio Gold Inc.
| 11.2.4.3.3 | Assay Methods |
Au-AA23 & Au-AA24 Fire Assay Fusion, AAS Finish.
| San Francisco Project | 82 | May 1, 2026 |
| Goldgroup Mining Inc. |
| 11.2.4.3.4 | Sample Decomposition |
Fire Assay Fusion (FA-FUS01 & FA-FUS02).
| 11.2.4.3.5 | Analytical Method |
Atomic Absorption Spectroscopy (AAS).
A prepared sample is fused with a mixture of lead oxide, sodium carbonate, borax, silica and other reagents as required, inquarted with 6 mg of gold-free silver and then cupelled to yield a precious metal bead.
The bead is digested in 0.5 mL dilute nitric acid in the microwave oven; 0.5 mL concentrated hydrochloric acid is then added, and the bead is further digested in the microwave at a lower power setting. The digested solution is cooled, diluted to a total volume of 4 mL with de-mineralized water, and analysed by atomic absorption spectroscopy against matrix-matched standards.
Table 11.4 summarizes the ALS laboratory Au-AA23 and Au-AA24 Fire Assay Fusion, AAS Finish assay methods.
Table 11.4
Summary of the Au-AA23 and Au-AA24 Fire Assay Fusion, AAS Finish Assay Details
| Method Code | Element | Symbol | Units | Sample
Weight (g) |
Lower
Limit |
Upper
Limit |
Default
Overlimit Method |
| Au-AA23 | Gold | Au | ppm | 30 | 0.005 | 10.0 | Au-GRA21 |
| Au-AA24 | Gold | Au | ppm | 50 | 0.005 | 10.0 | Au-GRA22 |
Table taken from the August, 2020, Technical Report, and originally provided by Alio Gold Inc.
Ag-GRA21, Ag-GRA22, Au-GRA21 and Au GRA22 Precious Metals Gravimetric Analysis Methods.
| 11.2.4.3.6 | Sample Decomposition |
Fire Assay Fusion (FA FUSAG1, FA FUSAG2, FA FUSGV1 and FA-FUSGV2).
| 11.2.4.3.7 | Assay Method |
Gravimetric.
A prepared sample is fused with a mixture of lead oxide, sodium carbonate, borax, silica and other reagents in order to produce a lead button. The lead button containing the precious metals is cupelled to remove the lead. The remaining gold and silver bead is parted in dilute nitric acid, annealed and weighed as gold. Silver, if requested, is then determined by the difference in weights.
| San Francisco Project | 83 | May 1, 2026 |
| Goldgroup Mining Inc. |
Table 11.5 summarizes the ALS Ag-GRA21, Ag-GRA22, Au-GRA21 and Au GRA22 Precious Metals Gravimetric Analysis Methods.
Table 11.5
Summary of the ALS Ag-GRA21, Ag-GRA22, Au-GRA21 and Au GRA22 Precious Metals Gravimetric Analysis Methods
| Method Code | Element | Symbol | Units | Sample
Weight (g) |
Detection Limit |
Upper
Limit |
| Ag-GRA21 | Silver | Ag | ppm | 30 | 5 | 10,000 |
| Ag-GRA22 | Silver | Ag | ppm | 50 | 5 | 10,000 |
| Au-GRA21 | Gold | Au | ppm | 30 | 0.05 | 1,000 |
| Au-GRA22 | Gold | Au | ppm | 50 | 0.05 | 1,000 |
Table taken from the August, 2020, Technical Report, and originally provided by Alio Gold Inc.
| 11.3 | 2010 to 2011, QA/QC Program Results |
| 11.3.1 | July 2010 to June 2011 QA/QC Program Results |
| 11.3.1.1 | Check Sampling |
A total of 416 sample pulps that were assayed at the Inspectorate facilities in Sparks or Richmond were sent to ALS-Chemex as a check against the assays obtained by Inspectorate. Samples for the check assaying program were selected randomly not only from the mineralized zones but also from the host rock on either side of the mineralized zone. All check samples selected had a grade above or equal to 0.10 ppm gold. This cut-off was established in order to approximate a true representation of the assays that were generating the resources in the block model and to avoid comparing assay results with a zero value or those with very low gold values.
In the first batch of check samples were 37 samples that had been assayed at the San Francisco mine laboratory since.
Table 11.6 indicates that the overall correlation factor between the ALS-Chemex results and the combined San Francisco mine and Inspectorate laboratory assays was sufficient to demonstrate that the original assays conducted by the San Francisco mine and Inspectorate laboratories can be relied upon.
Table 11.6
Comparison of the Original Assays with the ALS-Chemex Check Assays, 2010 to 2011 Drilling Program
| Description | Results |
| Number of Samples | 416 |
| Overall Laboratories (San Francisco mine + Inspectorate) Mean Grade | 1.018 |
| ALS-Chemex Mean Grade | 1.041 |
| Difference Between Means | -0.023 |
| Mean Difference % | -2.20% |
| Correlation Factor | 0.9484 |
Table taken from the August, 2020, Technical Report, and originally provided by Alio Gold Inc.
| San Francisco Project | 84 | May 1, 2026 |
| Goldgroup Mining Inc. |
| 11.3.1.2 | Standard Reference Sampling |
A total of 1,512 SRM samples were submitted to Inspectorate for assaying and comparison with the thirteen SRM values used by Alio. The results are summarized in the Table 11.7.
RockLabs recommends using the standard deviation as the basis for setting control limits and establishing the value of two standard deviations to determine the upper and lower limits of acceptable results. In general, the Inspectorate assays of the SRM samples fell within acceptable limits.
| 11.3.1.3 | Blanks |
Blank samples were inserted into the sample stream at an average of one for every 25 samples submitted to the laboratories used during the 2010 to 2011 exploration drill program. For the period from July, 2010 to June, 2011, a total of 1,956 blank samples were submitted for gold analysis, of which 189 were sent to the San Francisco mine laboratory and the rest, (1,726) were sent to the Inspectorate laboratories in Canada and the USA. Table 11.8 summarizes the results obtained for both laboratories.
A total of 42 out of the 1,915 blank samples (2.1%) returned gold values in excess of 0.1 ppm. These unexpectedly high assays prompted an investigation of the Alio and Inspectorate procedures to determine the cause. It was concluded that the samples were mislabelled, and that they were duplicate samples which contained the wrong sample tags. Alio then revised its sample identification procedures to minimize the risk of mislabelling. Overall, the results for the blank sample analyses obtained by both laboratories were considered satisfactory.
| San Francisco Project | 85 | May 1, 2026 |
| Goldgroup Mining Inc. |
Table 11.7
Summary of Inspectorate Assaying versus the Standard Reference Material
| Standard Type | OXA-71 | OXC-72 | OXC-88 | OXD-87 | OXE-86 | OXE-74 | OXF-65 | OXF-85 | OXG-83 | OXH-82 | OXH-66 | OXK-69 | Total |
| Au grade ppl | 0.085 | 0.205 | 0.203 | 0.417 | 0.613 | 0.615 | 0.805 | 0.805 | 1.002 | 1.278 | 1.285 | 3.583 | |
| Concept | Statistics Parameters | ||||||||||||
| No of samples | 230 | 108 | 135 | 162 | 35 | 79 | 117 | 67 | 151 | 32 | 191 | 21 | 1,328 |
| Min | 0.055 | 0.083 | 0.171 | 0.354 | 0.535 | 0.540 | 0.690 | 0.718 | 0.863 | 1.155 | 1.074 | 2.987 | |
| Max | 0.124 | 0.230 | 0.217 | 0.436 | 0.607 | 0.638 | 0.844 | 0.834 | 1.057 | 1.430 | 1.414 | 3.962 | |
| Average inspect | 0.0848 | 0.2003 | 0.1933 | 0.3950 | 0.5787 | 0.5817 | 0.7649 | 0.7752 | 0.9539 | 1.246 | 1.2169 | 3.4959 | |
| Standard value | 0.085 | 0.205 | 0.203 | 0.417 | 0.613 | 0.615 | 0.805 | 0.805 | 1.002 | 1.278 | 1.285 | 3.583 | |
| Difference absolute | -0.0002 | -0.005 | -0.0097 | -0.0220 | -0.034 | -0.033 | -0.040 | -0.030 | -0.032 | -0.032 | -0.068 | -0.087 | |
| Difference % | -0.256% | -2.353% | -5.012% | -5.581% | -5.935% | -5.725% | -5.24% | -3.841% | -3.355% | -2.60% | -5.592% | -2.493% | -3.866% |
| Mediana | 0.08 | 0.20 | 0.19 | 0.396 | 0.58 | 0.58 | 0.7650 | 0.78 | 0.96 | 1.24 | 1.217 | 3.53 | |
| Variance | 0.000 | 0.0003 | 0.0001 | 0.0002 | 0.0003 | 0.0003 | 0.001 | 0.0005 | 0.0014 | 0.0043 | 0.003 | 0.053 | |
| Standard deviation | 0.011 | 0.017 | 0.009 | 0.0134 | 0.019 | 0.018 | 0.029 | 0.022 | 0.037 | 0.065 | 0.050 | 0.231 | |
Table taken from the August, 2020, Technical Report, and originally provided by Alio Gold Inc.
Table 11.8
San Francisco Gold Project, Summary of Blank Assay Data for the 2010 to 2011 Drill Program
| Details | Laboratory | |
| San Francisco Mine | Inspectorate | |
| Number of Samples | 189 | 1,726 |
| Minimum Gold Value | 0.025 | 0.005 |
| Maximum Gold Value | 0.205 | 0.277 |
| Mean grade (g/t gold) | 0.031 | 0.021 |
| Standard Deviation | 0.0134 | 0.031 |
| Variance | 0.00018 | 0.00094 |
| Samples Above 0.100 ppm gold | 1 | 41 |
| Percentage | 0.53% | 2.38% |
Table taken from the August, 2020, Technical Report, and originally provided by Alio Gold Inc.
| San Francisco Project | 86 | May 1, 2026 |
| Goldgroup Mining Inc. |
| 11.3.1.4 | Duplicates |
A total of 1,513 field duplicate samples were taken in order to verify and control the sampling procedures in the field and check the gold assays in the laboratory. Of these, 210 samples were sent to the mine laboratory, and the remaining 1,303 samples were shipped to Inspectorate.
The duplicate samples were assigned consecutive numbers in the sample numbering sequence, so that the laboratory did not know it was receiving duplicates. These samples were submitted in the same shipment as their matching original samples but were not necessarily placed in the same furnace load as the original sample. The rate of the duplicate sampling was one duplicate for every 25 samples.
Table 11.9 summarizes the results of the comparison between the original and duplicate sample assays.
Table 11.9
Summary of Results for the Duplicate Samples, July, 2010 to June, 2011 Drill Program
| Description | Laboratory | Entire
Drilling Program (g/t gold) | ||||
| San
Francisco Mine (g/t gold) |
Inspectorate (g/t gold) | |||||
| Original | Duplicate | Original | Duplicate | Original | Duplicate | |
| Number of Pairs | 210 | 210 | 1,303 | 1,303 | 1,513 | 1,513 |
| Avg. Grade (g/t gold) | 0.16 | 0.17 | 0.090 | 0.088 | 0.100 | 0.102 |
| Maximum (g/t gold) | 5.92 | 6.20 | 7.384 | 6.752 | 7.384 | 6.752 |
| Minimum (g/t gold) | 0.03 | 0.03 | 0.005 | 0.005 | 0.005 | 0.005 |
| Difference Between Avg. Grades | 0.01 | -0.002 | 0.003 | |||
| Difference % | 8.04% | -1.69% | 2.59% | |||
| Correlation Coefficient | 0.9913 | 0.9321 | 0.9297 | |||
Table taken from the August, 2020, Technical Report, and originally provided by Alio Gold Inc.
It was observed that 87% of the samples included in the duplicate assaying program were below or close to 0.1 g/t gold, which means that differences in assays were generally magnified because of the low gold content of the samples.
| 11.3.1.5 | General QP Comments Regarding the QA/QC program |
Alio subsequently stopped using its assay laboratory at the San Francisco mine to analyse samples and used it only for sample preparation. However, there were still some mine laboratory assays in the QA/QC program. The San Francisco mine laboratory continued to participate in a round-robin assay process through CANMET, which is the Materials Technology Laboratory at Natural Resources Canada, a branch of the Canadian Government.
In terms of overall averages, the blank and duplicate assay results were satisfactory for both the San Francisco mine and Inspectorate laboratories. The error in numbering between 42 blank samples and duplicate samples represents a breakdown in procedure which Alio recognized and corrected. The differences in the duplicate program were generally magnified by being below or close to 0.1 g/t gold due to the low gold content.
| San Francisco Project | 87 | May 1, 2026 |
| Goldgroup Mining Inc. |
In general, Micon QPs found no significant issues with the Alio July, 2010 to June 2011 QA/QC program results and concluded that the assays obtained could be used in a resource estimate for the mine.
| 11.4 | July, 2011 to June, 2013, QA/QC Program Results |
During the period between July, 2011 to June, 2013, over 327,000 m were drilled by core and reverse circulation, but primarily the latter. Throughout this period, the demand for services from assay laboratories remained strong and, due to the long turn-around periods for assay results, Alio used more than one external laboratory to meet its assaying requirements, which averaged more than 10,000 drill samples per month. The laboratories used for assaying were Inspectorate, ALS Minerals (ALS) and, occasionally, Skyline Assayers and Laboratories (Skyline). All of these laboratories are independent.
Skyline is accredited in accordance with the recognized International Standard ISO/IEC 17025:2005. This accreditation demonstrates technical competence for a defined scope and the operation of a laboratory quality management system.
| 11.4.1 | Check Sampling |
A total of 852 sample pulps were selected for check assays, with Inspectorate and ALS being chosen as the primary laboratories. 357 of these sample pulps were assayed at the Inspectorate facilities and a further 495 sample pulps were assayed either by ALS, SGS or Inspectorate as check assays. Samples for the check assaying program were selected randomly, not only from the mineralized zones but also from the host rock on either side of the mineralized zone. All check samples selected had a grade of at least 0.10 ppm gold.
The 852 samples pulps were divided into three batches; two batches of sample pulps from the San Francisco pit drilling and a third batch from the La Chicharra and San Francisco drill programs. Table 11.10 summarizes the results of the check sample comparisons, for each of the three batches.
Table 11.10
Comparison of the Original Assays with the ALS-Chemex, Inspectorate and SGS Check Assays, 2011 to 2013 Drill Program
| Details | San Francisco Mine | Both Pits | All
Primary Lab Assays vs All Check Assays one to one | |
| ALS
vs Inspectorate |
ALS
vs SGSs |
Inspectorate vs ALS | ||
| Number of Samples | 257 | 238 | 357 | 852 |
| Mean Grade of ALS Minerals Assays | 0.850 | 1.801 | 1.122 | 1.266 |
| Mean Grade of the Inspectorate Assays | 0.806 | 1.112 | 1.210 | |
| Mean Grade of the SGS Assays | 1.778 | 0.016 | ||
| Difference Between Means | 0.044 | 0.023 | -0.009 | 1.303% |
| Mean Difference | 5.203% | 1.294% | -0.833% | |
| Correlation Factor | 0.9793 | 0.9534 | 0.9781 | 0.9881 |
Table taken from the August, 2020, Technical Report, and originally provided by Alio Gold Inc.
Table 11.10 indicates that the overall correlation factors between the laboratories used by Alio for the San Francisco mine and La Chicharra check samples were sufficient to demonstrate that the original assays conducted by the laboratories can be relied upon.
| San Francisco Project | 88 | May 1, 2026 |
| Goldgroup Mining Inc. |
| 11.4.2 | Standard Reference Material Samples |
A total of 7,052 SRM samples were submitted to Inspectorate, ALS and Skyline for assaying and comparison with the 27 SRM samples used by Alio. Since there were assay results from three laboratories to be compared against SRMs, the numbers of SRM samples used of each standard and each assay supplier are summarized in Table 11.11.
Table 11.11
Summary of SRMs Used to Check Inspectorate, ALS and Skyline Assaying
| No. | Standard | Number
of Samples for Francisco Pit |
Number
of Samples for Chicharra Pit |
Total
of Samples for the SRM | ||||||
| Insp | ALS | Skyline | Insp | ALS | Skyline | Insp | ALS | Skyline | ||
| 1 | OXH-82 | 17 | 25 | 42 | ||||||
| 2 | OXH-66 | 132 | 109 | 129 | 241 | 129 | ||||
| 3 | OXG-99 | 102 | 59 | 130 | 35 | 232 | 94 | |||
| 4 | OXF-85 | 62 | 84 | 19 | 146 | 19 | ||||
| 5 | OXE-86 | 137 | 10 | 97 | 147 | 97 | ||||
| 6 | OXD-87 | 160 | 50 | 159 | 137 | 5 | 319 | 137 | 55 | |
| 7 | OXC-88 | 357 | 339 | 696 | ||||||
| 8 | OXJ-95 | 128 | 189 | 35 | 126 | 254 | 189 | 35 | ||
| 9 | OXH-97 | 142 | 343 | 114 | 256 | 343 | ||||
| 10 | OXF-105 | 126 | 193 | 6 | 132 | 193 | ||||
| 11 | OXE-101 | 120 | 75 | 58 | 343 | 463 | 75 | |||
| 12 | OXD-108 | 133 | 198 | 6 | 139 | 198 | ||||
| 13 | OXC-102 | 133 | 130 | 54 | 285 | 418 | 130 | |||
| 14 | CDN-GS-P7E | 15 | 60 | 75 | ||||||
| 15 | CDN-GS-2K | 39 | 155 | 194 | ||||||
| 16 | OXG-83 | 127 | 0 | 105 | 127 | 105 | ||||
| 17 | OXI-81 | 115 | 0 | 137 | 115 | 137 | ||||
| 18 | OXG-84 | 26 | 26 | |||||||
| 19 | OXF-100 | 35 | 36 | 67 | 67 | 35 | 36 | |||
| 20 | CDN-PGMS-18 | 37 | 37 | |||||||
| 21 | CDN-ME-15 | 17 | 65 | 65 | 17 | |||||
| 22 | CDN-GSP3C | 61 | 61 | |||||||
| 23 | CDN-GS-P3B | 97 | 97 | |||||||
| 24 | CDN-GS-P2A | 112 | 112 | |||||||
| 25 | CDN-GS-2L | 71 | 71 | |||||||
| 26 | OXE-106 | 192 | 192 | |||||||
| 27 | OXC-109 | 192 | 192 | |||||||
| Gran Total | 2,045 | 1,606 | 250 | 2,487 | 659 | 5 | 4,532 | 2,265 | 255 | |
| 7,052 | ||||||||||
Table taken from the August, 2020, Technical Report, and originally provided by Alio Gold Inc.
Both RockLabs and CDN Laboratories suggest a maximum value of two standard deviations to determine the upper and lower limits of acceptable results. In general, the Inspectorate assays of the SRM samples fell within acceptable limits, although the trend in the Inspectorate assays is that they were below the certified values in most cases. In general, the gold values obtained by Inspectorate were underestimated within a range that varies from 0.256% to 5.935%, and averages 3.742%.
| San Francisco Project | 89 | May 1, 2026 |
| Goldgroup Mining Inc. |
Overall, Micon’s QP considers that the results are of sufficient quality to indicate that the assaying conducted by the various laboratories can be used as the basis of a resource estimate.
| 11.4.3 | Blanks |
During the 2011 to 2013 drilling campaign, 10,578 blank samples were inserted into the sample stream, at an average rate of one blank for every 25 samples. Of these, ten blanks were assayed at the San Francisco mine laboratory, with all returning assay of less than 0.03 g/t gold. The remaining 10,568 were distributed among Inspectorate, ALS and Skyline, yielding the results summarized in Table 11.12.
Table 11.12
San Francisco Gold Project, Summary of Blank Assay Data for the 2011 to 2013 Drill Program
| Details | Laboratory | ||
| ALS | Inspectorate | Skyline | |
| Number of Samples | 4,438 | 5,790 | 340 |
| Minimum Gold Value (g/t) | 0.005 | 0.005 | 0.005 |
| Maximum Gold Value (g/t) | 0.959 | 4.431 | 0.022 |
| Mean grade (g/t gold) | 0.05 | 0.048 | 0.007 |
| Standard Deviation | 0.1301 | 0.231 | 0.003 |
| Variance | 0.0169 | 0.05348 | 0.00001 |
| Samples Above 0.100 g/t gold | 83 | 119 | 0 |
| Percentage | 1.87% | 2.06% | 0% |
Table taken from the August, 2020, Technical Report, and originally provided by Alio Gold Inc.
A total of 119 out of a batch of 5,790 blank samples from the San Francisco Project, assayed by Inspectorate, returned gold values in excess of 0.1 ppm. These represent 2.2% of the total. The unexpected high assays prompted an investigation of the Alio and Inspectorate procedures, to determine the cause. It was concluded that all of the samples were from the rock material that was supposed to be barren, obtained from the vicinity of the Norma Project to the west-northwest of the San Francisco pit. Due to the anomalous gold results, the remaining samples of this material were rejected for use as blank samples.
Overall, the results for the blank sample analyses obtained by all laboratories are considered satisfactory.
| 11.4.4 | Duplicates |
A total of 6,796 field duplicate samples were taken, in order to verify and control the sampling procedures in the field and check the gold assays in the laboratories. The duplicate samples were assigned consecutive numbers in the sample numbering sequence, so that the laboratory did not know it was receiving duplicates. These samples were submitted in the same shipment as their matching original samples, but were not necessarily placed in the same furnace load as the original sample. The rate of the duplicate sampling was one duplicate for every 25 samples.
| San Francisco Project | 90 | May 1, 2026 |
| Goldgroup Mining Inc. |
Table 11.13 summarizes the results of the comparison between the original and duplicate sample assays.
Table 11.13
Summary of Results for the Duplicate Samples, July, 2011 to June, 2013 Drill Program
| Description | Laboratory | |||||
| ALS | Inspectorate | Skyline | ||||
| Original | Duplicate | Original | Duplicate | Original | Duplicate | |
| Number of pairs | 2,473 | 2,473 | 4,032 | 4,032 | 291 | 291 |
| Average Grade (g/t) | 0.188 | 0.194 | 0.076 | 0.079 | 0.049 | 0.048 |
| Maximum (g/t) | 9.260 | 9.310 | 10.617 | 8.871 | 2.981 | 2.583 |
| Minimum (g/t) | 0.005 | 0.005 | 0.005 | 0.005 | 0.004 | 0.004 |
Difference between average grade (g/t) |
-0.006 | -0.002 | 0.001 | |||
| Difference % | -3.33 | -2.81 | 1.76 | |||
| Correlation Coefficient | 0.9463 | 0.9497 | 0.9834 | |||
Table taken from the August, 2020, Technical Report, and originally provided by Alio Gold Inc.
Table 11.13 indicates that the results of the duplicate assaying at the laboratories are satisfactory, with a correlation factor ranging from 0.9463 for ALS to 0.9834 for Skyline. However, it was observed that the majority of the samples included in the duplicate assaying program were of low-grade and the differences in assays are generally magnified because of the low gold content of the samples.
| 11.4.5 | General Comments Regarding the July, 2011 to June, 2013 QA/QC program |
In terms of overall averages, the blank and duplicate assay results were satisfactory for all laboratories used by Alio. The error noted by Alio, where some of the blank samples were found to be mineralized, was corrected and Alio obtained a different local material to be used as blank samples. Alio followed correct procedure in this regard.
Concerning the issue of the SRM samples potentially being underestimated, particularly by the Inspectorate laboratory, Micon’s QP acknowledges that lower grade samples will have any differences amplified. Micon’s QP considers that, in general, the assaying of the SRM samples is of sufficient quality that the original assays can be used for a mineral resource estimation.
| 11.5 | Results of the January, 2014 to December, 2015, QA/QC Program |
Between January, 2014 and December, 2015, in addition to its regular QA/QC programs, Alio added a program of conducting screen metallic samples as part of its assay checks to deal with free gold that it observed at the Vetatierra Project.
| 11.5.1 | Screen Metallic Assaying |
At the Vetatierra Project, part of the gold mineralization appears to be related to finely disseminated and coarse free gold on the quartz-tourmaline±pyrite. As a result, Alio believed it was necessary to conduct assay checks to identify any potential nugget effect in the assay data or if there was the possibility of losing gold during the drilling or RC/core sampling process. Figure 11.7 is a piece of core showing the location of visible gold found within it.
| San Francisco Project | 91 | May 1, 2026 |
| Goldgroup Mining Inc. |
To better understand if there was coarse gold affecting the sample, five rejects samples from the RC drilling were analysed as sample pairs for screen metallics at the Inspectorate laboratory and at the San Francisco mine laboratory. An additional five field duplicate samples of the same interval, as rejects samples (25% of the total sample), were analysed by screen metallics.
Figure 11.7
Drill Hole VT14-005 Showing a Location with Visible Gold in the Core
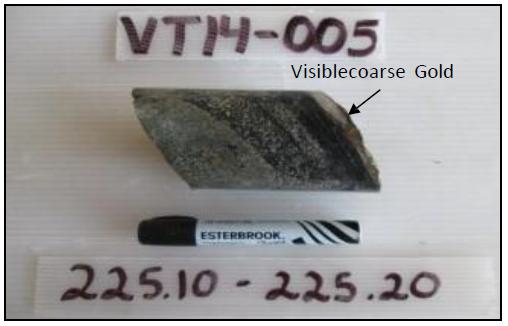
Figure taken from the August, 2020, Technical Report, and originally provided by Alio Gold Inc.
The assay results indicated that fine gold or clustering gold may occur at the Vetatierra Project, giving a variation in the assays results which was either positive or negative depending on whether or not free gold was present (Figure 11.8).
| San Francisco Project | 92 | May 1, 2026 |
| Goldgroup Mining Inc. |
Figure 11.8
Summary and Graph Showing the Assays Results for the Five Samples
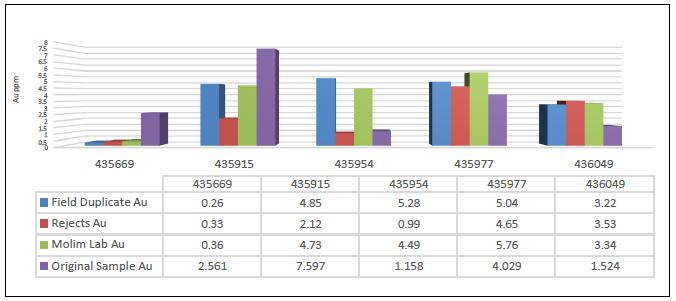
Figure taken from the August, 2020, Technical Report, and originally provided by Alio Gold Inc.
Note that in the sample 435954 the assays results are higher in the original sample sent to the lab than the assay returned from screen metallics.
Five samples were analysed as pairs at Inspectorate laboratory. Three of the samples produced results that were very similar to each other, but two of the samples had a strong variation in the gold results, suggesting that a nugget effect or loss of gold may be present. Figure 11.9 shows the variation in the samples both in a tabular fashion and graphically
Figure 11.9
Summary and Graph Showing the Gold Variation in the Five Pairs of Samples Rejects vs Field Duplicates
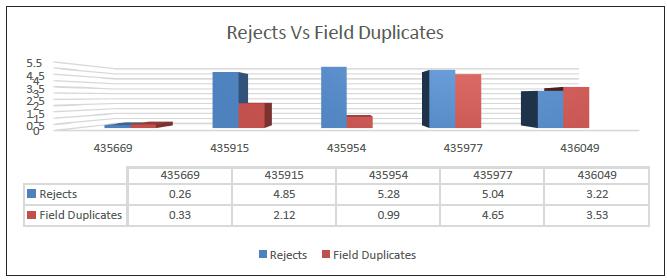
Figure taken from the August, 2020, Technical Report, and originally provided by Alio Gold Inc.
Another 5 samples were analysed to compare the gold assay results from the screen metallics and fire assays with the AA finish (original sample) and, once again, the results were very variable (either positive or negative), suggesting that a nugget effect due to very fine or clustering of gold may occur at the Project (Figure 11.10).
| San Francisco Project | 93 | May 1, 2026 |
| Goldgroup Mining Inc. |
Figure 11.10
Summary and Graph Showing the Gold Variation in the Samples Screen Metallics vs Fire Assays
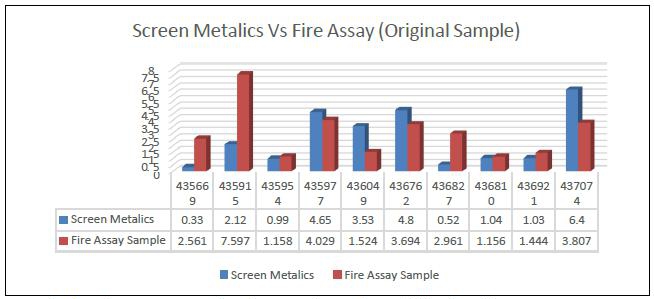
Figure taken from the August, 2020, Technical Report, and originally provided by Alio Gold Inc.
| 11.6 | Results of the August 2016 to March 2017 QA/QC Program |
During the period between August, 2016 to March, 2017, over 13,000 m were drilled by reverse circulation. Samples were primarily prepared at San Francisco mine. Samples were sent to Bureau Veritas Laboratory (Inspectorate) at Hermosillo, Sonora, and smaller number of samples were sent to ALS Minerals for check assays. At Inspectorate, 50 g pulps were analysed by fire assay with an atomic absorption finish (FA430) and samples assaying greater than 10 g/t Au, then re-assayed with gravimetric finish (FA-430). ALS Minerals methodology was the same.
As part of Alio’s QA/QC procedures, a set of samples comprised of a fine-blank sample, a standard reference sample and a field duplicate sample were inserted randomly into the sampling sequence. The insertion rate for the blanks, standards and duplicate samples was approximately one each in every 25 samples.
| 11.6.1 | Standard Reference Material |
A total of 267 standard reference material samples were submitted to Bureau Veritas (Inspectorate) and ALS Minerals for assaying. Table 11.14 summarizes the number of each of the standard reference material samples sent to the two laboratories. The repeatability of standard assays is illustrated in Figure 11.11 through Figure 11.19.
| San Francisco Project | 94 | May 1, 2026 |
| Goldgroup Mining Inc. |
Table 11.14
Summary of Standard Material Reference Samples Used at Check Inspectorate and ALS Minerals
| Number | Standard | Standard
of Samples for Each Laboratory for the San Francisco Pit |
Standard
of Samples for Each Laboratory for the N & NW La Chicharra Pit |
| Inspectorate | ALS Minerals | ||
| 1 | CDN-GS-2M | 34 | |
| 2 | CDN-GS-P7H | 47 | 2 |
| 3 | OXC-109 | 82 | 33 |
| 4 | OXE-101 | 1 | |
| 5 | OXF-105 | 18 | |
| 6 | OXH-97 | 13 | |
| 7 | OXJ-95 | 15 | |
| 8 | OXD-108 | 22 | |
| Grand Total | 210 | 57 | |
Table taken from the August, 2020, Technical Report, and originally provided by Alio Gold Inc.
Figure 11.11
Precision Plot – Gold in Reference Standard CDN-GS-2M for the San Francisco Pit In-Fill Drilling
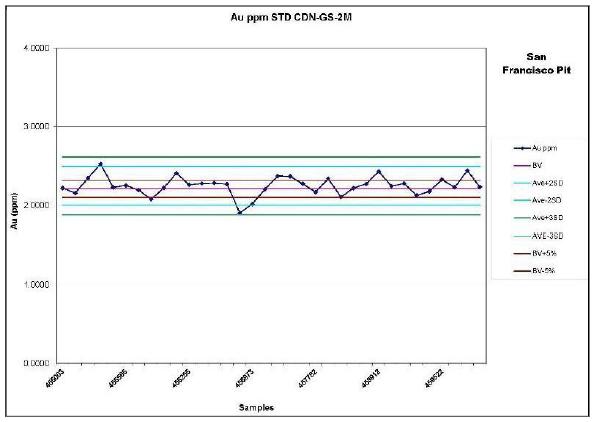
Figure taken from the August, 2020, Technical Report, and originally provided by Alio Gold Inc.
| San Francisco Project | 95 | May 1, 2026 |
| Goldgroup Mining Inc. |
Figure 11.12
Precision Plot – Gold in Reference Standard OXH-97 for the San Francisco Pit In-Fill Drilling
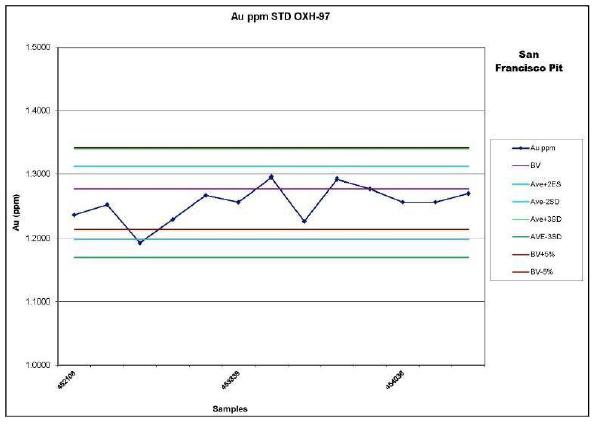
Figure taken from the August, 2020, Technical Report, and originally provided by Alio Gold Inc.
Figure 11.13
Precision Plot – Gold in Reference Standard CDN-GS-P7H for the San Francisco Pit In-Fill Drilling
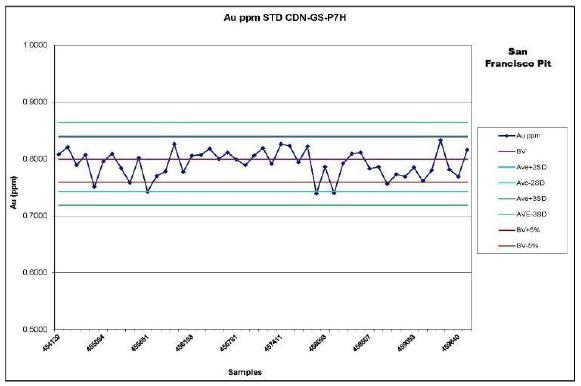
Figure taken from the August, 2020, Technical Report, and originally provided by Alio Gold Inc.
| San Francisco Project | 96 | May 1, 2026 |
| Goldgroup Mining Inc. |
Figure 11.14
Precision Plot – Gold in Reference Standard OXC-109 for the San Francisco Pit In-Fill Drilling
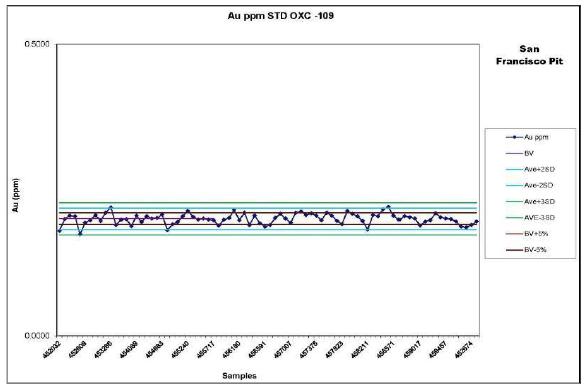
Figure taken from the August, 2020, Technical Report, and originally provided by Alio Gold Inc.
Figure 11.15
Precision Plot – Gold in Reference Standard OXE-101 for the San Francisco Pit In-Fill Drilling
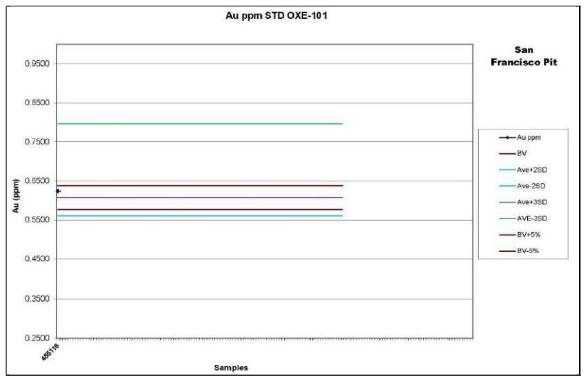
Figure taken from the August, 2020, Technical Report, and originally provided by Alio Gold Inc.
| San Francisco Project | 97 | May 1, 2026 |
| Goldgroup Mining Inc. |
Figure 11.16
Precision Plot – Gold in Reference Standard OXF-105 for the San Francisco Pit In-Fill Drilling
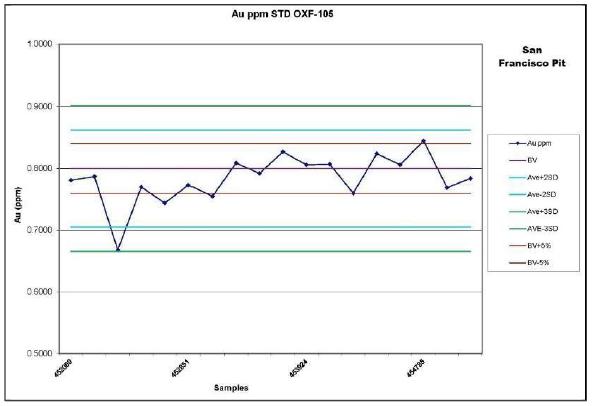
Figure taken from the August, 2020, Technical Report, and originally provided by Alio Gold Inc.
Figure 11.17
Precision Plot – Gold in Reference Standard OXJ-95 for the San Francisco Pit In-Fill Drilling
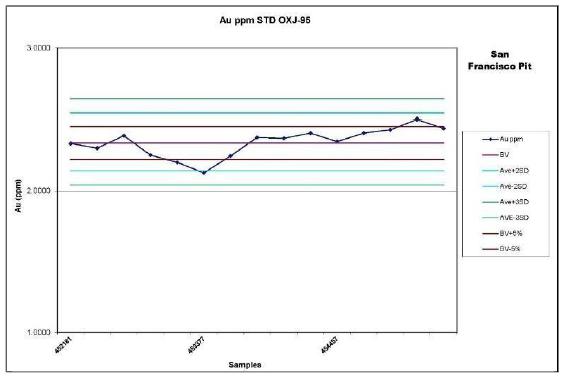
Figure taken from the August, 2020, Technical Report, and originally provided by Alio Gold Inc.
| San Francisco Project | 98 | May 1, 2026 |
| Goldgroup Mining Inc. |
Figure 11.18
Precision Plot – Gold in Reference Standard OXC-109 for the N and NW La Chicharra Drilling
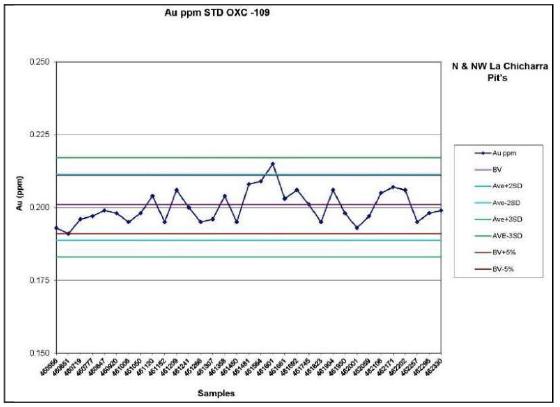
Figure taken from the August, 2020, Technical Report, and originally provided by Alio Gold Inc.
Figure 11.19
Precision Plot – Gold in Reference Standard CDN-GS-7PH for the N and NW La Chicharra Drilling
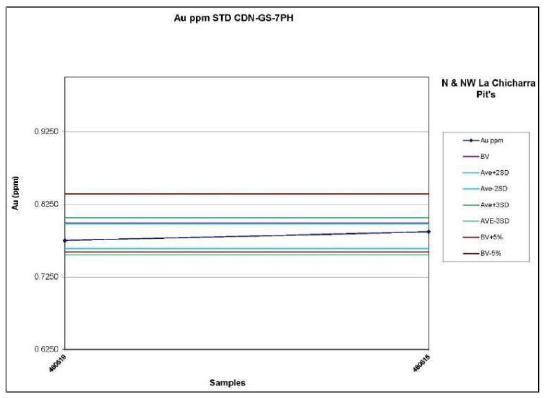
Figure taken from the August, 2020, Technical Report, and originally provided by Alio Gold Inc.
| San Francisco Project | 99 | May 1, 2026 |
| Goldgroup Mining Inc. |
Overall, the assay results of the standard samples are considered satisfactory.
| 11.6.2 | Duplicates |
A total of 244 field duplicate samples were taken, in order to verify and control the sampling procedures in the field and check the gold assays in the laboratories. The rate of the duplicate sampling was one duplicate for every 25 samples.
Figure 11.20 and Figure 11.21 show the results for the duplicate samples, plotted as relative error diagrams, for the San Francisco and for the north and northwest La Chicharra Pits, in the August, 2016 to March, 2017 drill program.
The failed pairs in Figure 11.20 and Figure 11.21 are clearly shown as those points above the error limit line. The appearance of higher failure rate in the San Francisco Pit duplicates versus the La Chicharra duplicates may be in part due to the larger amount of drilling in and around the San Francisco pit versus the La Chicharra pit.
Figure 11.20
Results for the Duplicate Samples Plotted as a Relative Error Diagram for the San Francisco Pit, August, 2016 to March, 2017 Drill Program
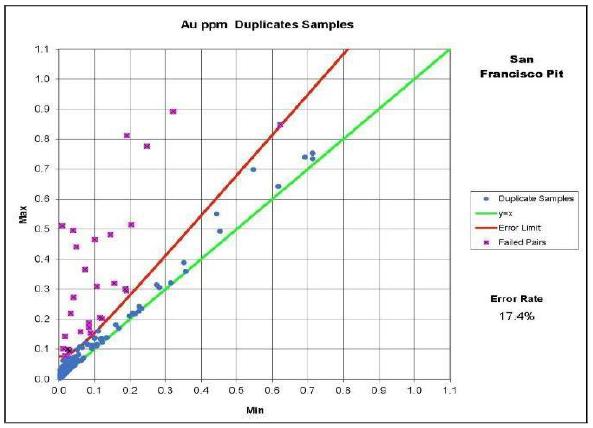
Figure taken from the August, 2020, Technical Report, and originally provided by Alio Gold Inc.
| San Francisco Project | 100 | May 1, 2026 |
| Goldgroup Mining Inc. |
Figure 11.21
Results for the Duplicate Samples Plotted as a Relative Error Diagram for the North and Northwest La Chicharra Pits, August, 2016 to March, 2017 Drill Program
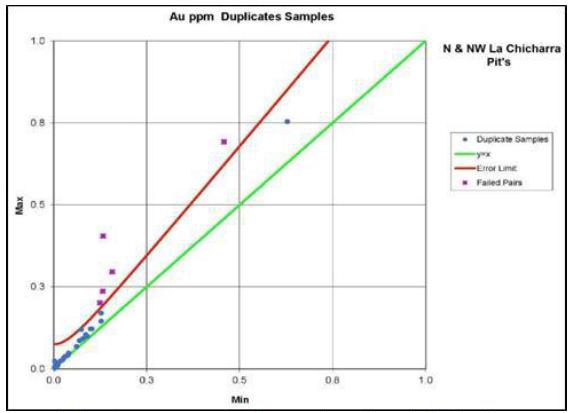
Figure taken from the August, 2020, Technical Report, and originally provided by Alio Gold Inc
| 11.6.3 | Blank Samples |
Blank samples were inserted into the sample stream at an average of one for every 25 samples submitted to the laboratories used during exploration drill program. The blank reference material was prepared by Alio from barren rock (basalt) acquired from the San Francisco property. For the period from August, 2016 to March, 2017, a total of 234 blank samples were submitted for gold analysis, of which 173 were sent to the Bureau Veritas and 61 were sent to the ALS Laboratories in Canada and the USA. Figure 11.22 through Figure 11.25 plot the results obtained for both laboratories.
Overall, the results for the blank sample analyses obtained by both laboratories are considered satisfactory.
| San Francisco Project | 101 | May 1, 2026 |
| Goldgroup Mining Inc. |
Figure 11.22
Plot of Blank Assay Data from the Bureau Veritas Laboratory for the 2016 to 2017 Drill Program at San Francisco Pit
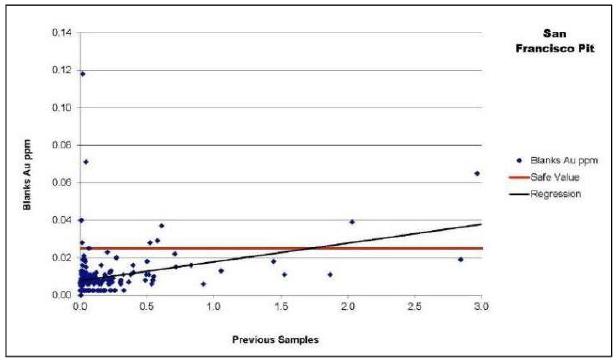
Figure taken from the August, 2020, Technical Report, and originally provided by Alio Gold Inc.
Figure 11.23
Plot of Blank Assay Data from the ALS Minerals Laboratory for the 2016 to 2017 Drill Program at San Francisco Pit
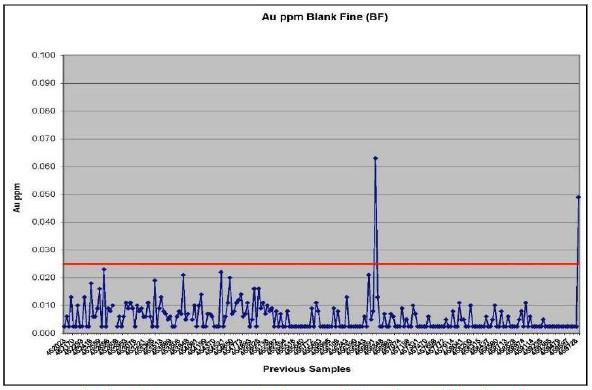
Figure taken from the August, 2020, Technical Report, and originally provided by Alio Gold Inc.
| San Francisco Project | 102 | May 1, 2026 |
| Goldgroup Mining Inc. |
Figure 11.24
Plot of Blank Assay Data from the Bureau Veritas Laboratory for the 2016 to 2017 Drill Program at N & NW Chicharra Pit
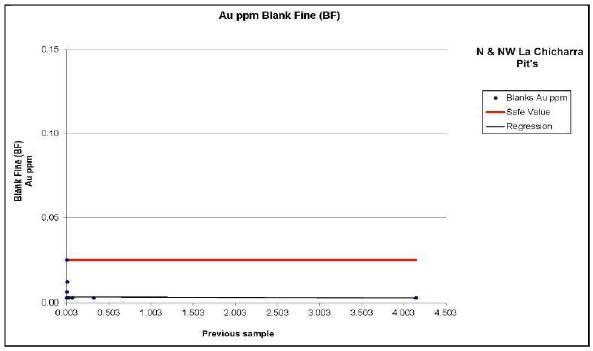
Figure taken from the August, 2020, Technical Report, and originally provided by Alio Gold Inc.
Figure 11.25
Plot of Blank Assay Data from the ALS Minerals Laboratory for the 2016 to 2017 Drill Program at N & NW Chicharra Pit
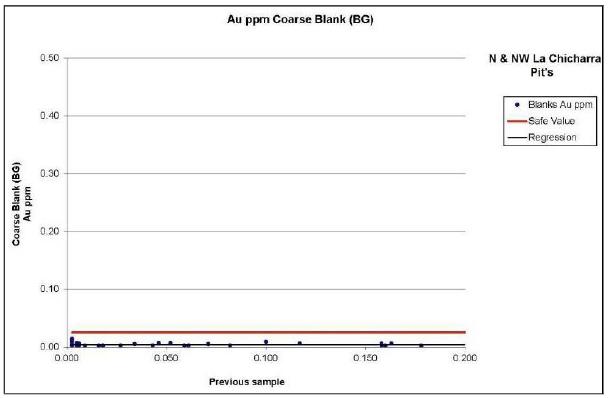
Figure taken from the August, 2020, Technical Report, and originally provided by Alio Gold Inc.
| San Francisco Project | 103 | May 1, 2026 |
| Goldgroup Mining Inc. |
| 11.7 | 2017 and 2018 Drilling Program QA/QC |
| 11.7.1 | August to December, 2017 Drilling Program QA/QC |
For the portion of the 2017 drilling program conducted between August and December, there were no changes to the QA/QC program. Thus, the previous information regarding the 2016-2017 QA/QC program at the San Francisco Project was still valid for the remainder of 2017.
| 11.7.2 | 2018 Drilling Program QA/QC |
For the 2018 drill campaign, all samples were assayed in the laboratory located at the San Francisco Project. Assaying at a mine’s on-site laboratory is common throughout the world and these data are usually used for updating the project data unless major issues have been identified with the use of the on-site analysis.
All drill sample assays were performed using fire assays and cold cyanidation. A total of 5,027 samples were sent for analysis, of which, 333 were control samples with an insertion percentage of 6.6%.
The quality control protocol during in-fill drilling consisted of inserting blanks, duplicates and standards, alternated approximately every 12 samples. The QA/QC results of the control samples were reviewed and Alio believed that the validated information met the requirements to be entered into the San Francisco resource model. A total of 333 control samples were inserted, consisting of 60 fine blanks (18%), 63 coarse blanks (19%), 72 duplicates (22%), 138 standards (41%).
Three different standards from obtained from Rocklabs were used in the 2018 program. The Rocklabs standard reference samples used were:
| · | OXC-145 (0.212 g/t Au). |
| · | OXD-144 (0.417 g/t Au). |
| · | OXG-124 (0.918 g/t Au). |
| 11.7.2.1 | OXC-145 Standard Reference Sample |
Three of the 53 OXC-145 reference samples were considered to be outliers, outside the maximum allowable limits of 3 standard deviations (SD). The three sample outliers represent 5.7% of the total number of samples analysed. Table 11.15 summarizes the information for standard reference sample OXC-145. Figure 11.26 is a plot of the results for standard reference sample OXC-145.
Table 11.15
Summary of the Analysis Information for Standard Reference Sample OXC-145
| Analysis Table | All results | Gross
Outliers Excluded |
User
Outliers Excluded |
Comments |
| Number of results | 53 | 50 | 50 | |
| Average Accuracy: (% Difference of Average from Assigned Value) | 0.2138 | 0.2109 | 0.2109 | |
| Precision: Relative Standard deviation (Robust) | 0.9% | -0.5% | -0.5% | |
| Number of Outlying Results (Outside Process Limits) | 10.1% | 6.1% | 6.1% | Industry Typical |
| 0 | 3 | 3 | ||
| Perecentage of Outlying Results ð | 5.7% | Room for improvement | ||
Table taken from the August, 2020, Technical Report, and originally provided by Alio Gold Inc.
| San Francisco Project | 104 | May 1, 2026 |
| Goldgroup Mining Inc. |
Figure 11.26
Plot for the Analysis Information for Standard Reference Sample OXC-145
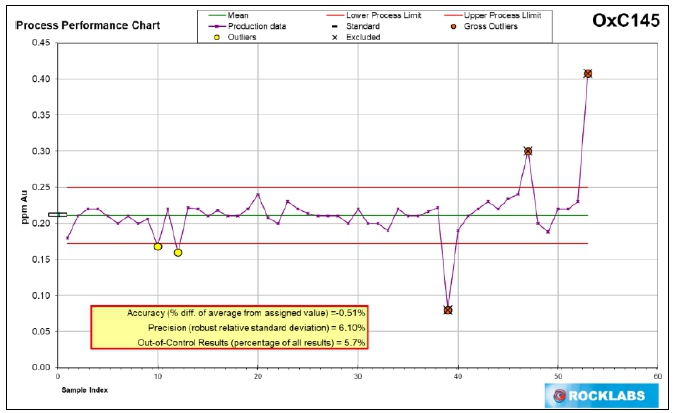
Figure taken from the August, 2020, Technical Report, and originally provided by Alio Gold Inc.
| 11.7.2.2 | OXD-144 Standard Reference Sample |
Two of the 46 OXD-144 reference samples are considered to be outliers, which represents 4.3% of the total samples analysed. Table 11.16 summarizes the information for standard reference sample OXD-144. Figure 11.27 is a plot of the results for standard reference sample OXD-144.
Table 11.16
Summary of the Analysis Information for Standard Reference Sample OXD-144
| Analysis Table | All results | Gross
Outliers Excluded |
User
Outliers Excluded |
Comments |
| Number of results | 46 | 44 | 44 | |
| Average | 0.4305 | 0.4148 | 0.4148 | |
| Accuracy: (% Difference of Average from Assigned Value) | 3.2% | -0.5% | -0.5% | |
| Precision: Relative Standard deviation (Robust) | 10.5% | 4.1% | 4.1% | Good |
| Number of Outlying Results (Outside Process Limits) | 0 | 2 | 2 | |
| Perecentage of Outlying Results ð | 4.3% | Industry typical | ||
Table taken from the August, 2020, Technical Report, and originally provided by Alio Gold Inc.
| San Francisco Project | 105 | May 1, 2026 |
| Goldgroup Mining Inc. |
Figure 11.27
Plot for the Analysis Information for Standard Reference Sample OXD-144
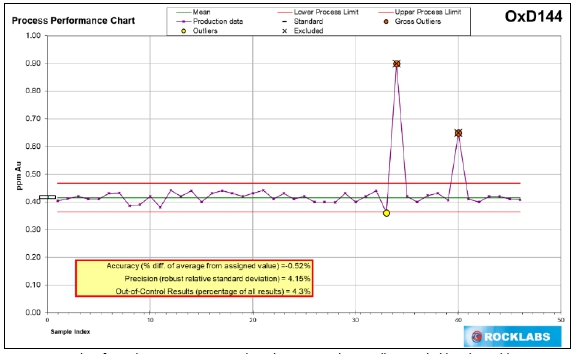
Figure taken from the August, 2020, Technical Report, and originally provided by Alio Gold Inc.
| 11.7.2.3 | OXG-124 Standard Reference Sample |
None of the OXG-124 standard reference samples analysed fell outside of the allowable limits as setout for the standard. Table 11.17 summarizes the information for standard reference sample OXG-124. Figure 11.27 is a plot of the results for standard reference sample OXG-124.
Table 11.17
Summary of the Analysis Information for Standard Reference Sample OXG-124
| Analysis Table | All results | Gross
Outliers Excluded |
User
Outliers Excluded |
Comments |
| Number of results | 39 | 39 | 39 | |
| Average | 0.9065 | 0.9065 | 0.9065 | |
| Accuracy: (% Difference of Average from Assigned Value) | -1.3% | -1.3% | -1.3% | |
| Precision: Relative Standard deviation (Robust) | 3.8% | 3.8% | 3.8% | Good |
| Number of Outlying Results (Outside Process Limits) | 0 | 0 | 0 | |
| Perecentage of Outlying Results ð | 0.0% | Good | ||
Table taken from the August, 2020, Technical Report, and originally provided by Alio Gold Inc.
| San Francisco Project | 106 | May 1, 2026 |
| Goldgroup Mining Inc. |
Figure 11.28
Plot for the Analysis Information for Standard Reference Sample OXG-124
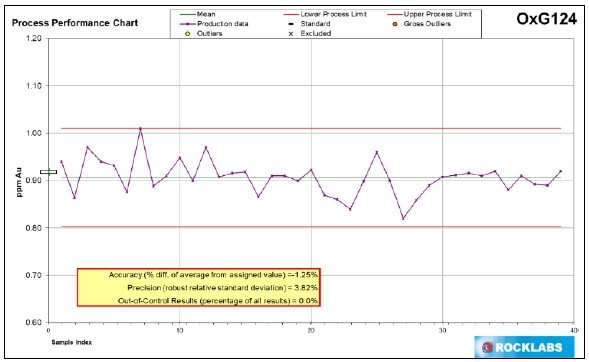
Figure taken from the August, 2020, Technical Report, and originally provided by Alio Gold Inc.
| 11.7.2.4 | Blanks and Duplicates |
The San Francisco Project laboratory has a lower detection limit of 0.03 ppm Au for the fire assay. In the review of the blank assays, a lower limit detection equivalent was used that was five times the lower limit detection of the mine laboratory. Fine and coarse blanks were found to be within the allowed limits.
Coarse duplicates were analysed based on a tolerance of 15%, and an error rate of 18% was observed. In total, 13 out of 72 samples exceeded the allowed margin. Figure 11.29 is a plot of the duplicate sample analysis for the 2018 drilling program.
| San Francisco Project | 107 | May 1, 2026 |
| Goldgroup Mining Inc. |
Figure 11.29
Plot of the Duplicate Sample Analysis for the 2018 Drilling Program
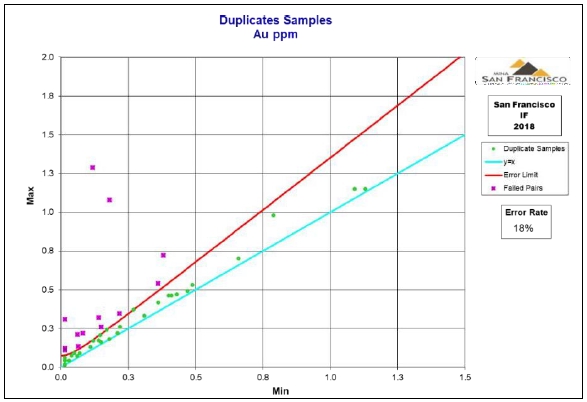
Figure taken from the August, 2020, Technical Report, and originally provided by Alio Gold Inc.
| 11.8 | Micon QP Comments 2020 |
Micon’s QP considered that the QA/QC program that was in place as part of Alio’s procedures was of sufficient quality to be considered as following the best practices guidelines as published by the CIM and that the results were suitable to be used as the basis of its mineral resource estimate for the Project.
Magna continued to use the QA/QC program already in place at the San Francisco Project. However, from time to time, the certified standards will be updated as the older certified standards become unavailable, or as better analogous standards become available.
| 11.9 | Magna QA/QC Program August, 2020 to October, 2022 |
Magma continued using the QA/QC procedures established by Alio. All the drilling campaigns were exclusively RC, with a nominal sampling length of 1.5 m (3 ft). Sampling method and insertion of the QA/QC material in the sample stream are described previously in this section.
Sample preparation was performed at the San Francisco Mine Preparation Facilities, as described earlier in this section. Samples were assayed at Bureau Veritas (Inspectorate) Hermosillo (2020 campaign), and at the mine laboratory located at the San Francisco Project (2020-2022 campaigns), following the protocol described previously in this section
| San Francisco Project | 108 | May 1, 2026 |
| Goldgroup Mining Inc. |
Blank material, both coarse and fine, were inserted regularly in the sample stream. Figure 11.30 shows the assay results for the blank samples sent to the mine laboratory from 2020 to 2022. The coarse blank samples indicate that generally there was little contamination at the assay laboratory. The three fine samples that failed should be investigated further to see if these were true instances of contamination or the result of miss labelling samples. There was a higher instance of apparent failures in the course blank samples, and this will need to be investigated further should Goldgroup restart the mine assay laboratory at some point in the future.
The CRM used in the 2020 to 2022 interval included ROCKLABS’ OxG124 (0.918 ppm), OxC109 (0.201 ppm), OxD144 (0.417 ppm), OxC145 (0.212 ppm), and OxD155 (0.430 ppm), and OREAS’ 501d (2.3 ppm), 502c (0.488 ppm), 504c (1.48 ppm), 601b (2.4 ppm), 602b (2.29 ppm), and 622 (1.4 ppm). Figure 11.31 to Figure 11.33 show the assay results for the CRM samples analysed at the mine laboratory from 2020 to 2022. The general tendency shown by data is a slight bias low compared to the nominal value of the CRMs.
Magna continued inserting field sample duplicates in the sample stream. The occurrence of sample pairs outside the error limit for the samples processed at the mine laboratory for the 2020 to 2022 drilling campaigns was much reduced compared to the results obtained in previous years (Figure 11.34).
Micon’s QPs believe that while the assay laboratory at the San Francisco mine was used to report the assay results for the Project the results can generally be used to support the current mineral resource estimate. Micon’s QPs note that should Goldgroup continue to generate on-site assay results in the future, the assay laboratory will need to participate in annual independent round-robins and should be the subject of annual or bi-annual audits to ensure the quality of the work. The assay laboratory should also be sending at least 10% of pulp and coarse rejects to an independent assay laboratory for independent confirmation of the assay results.
| San Francisco Project | 109 | May 1, 2026 |
| Goldgroup Mining Inc. |
Figure 11.30
Mine Laboratory - Fine and Coarse Blank Assay Results for 2020-2022 Drilling Campaigns
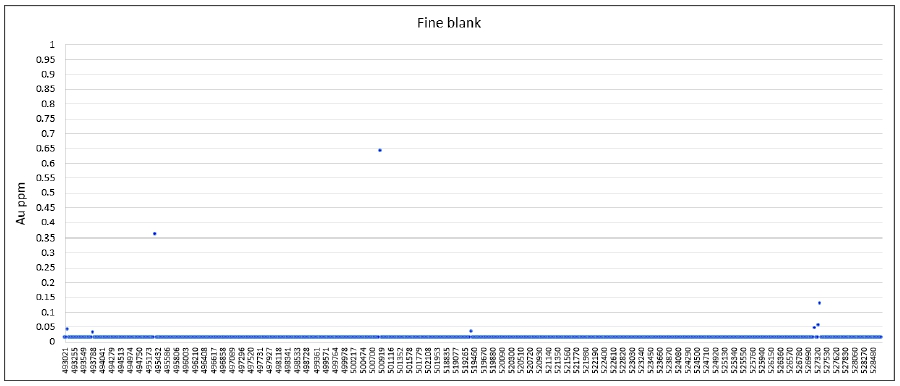
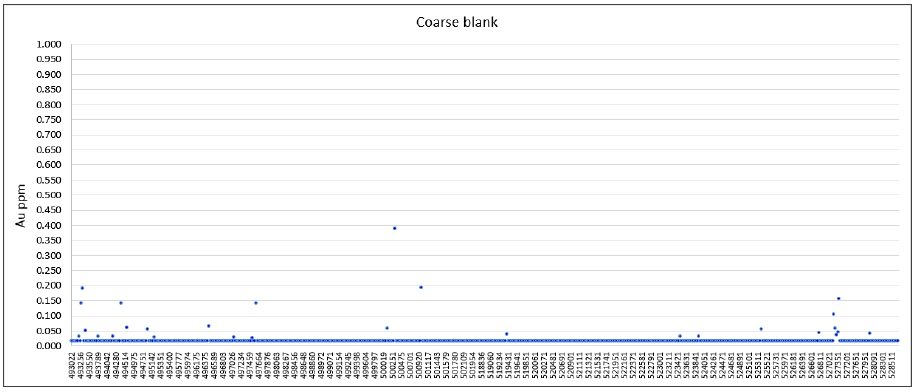
| San Francisco Project | 110 | May 1, 2026 |
| Goldgroup Mining Inc. |
Figure 11.31
2022 Certified Reference Material Gold Assay Results for Rocklabs OxC109 and OxD144
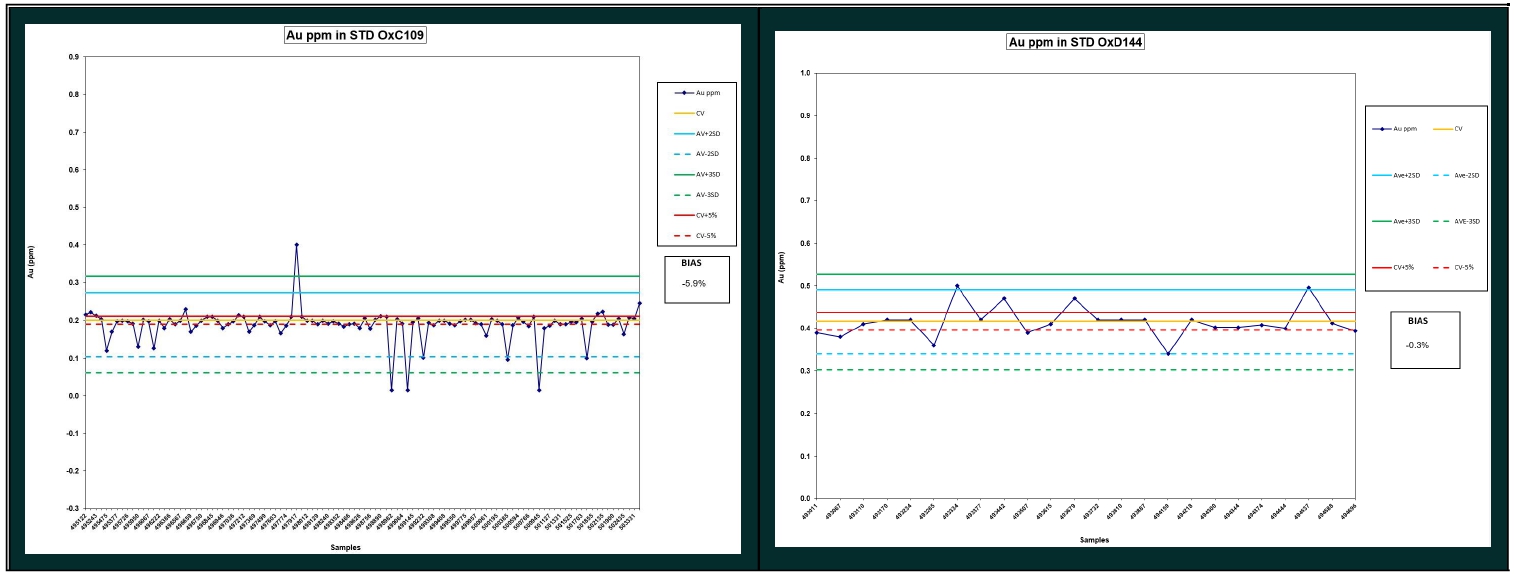
| San Francisco Project | 111 | May 1, 2026 |
| Goldgroup Mining Inc. |
Figure 11.32
2022 Certified Reference Material Gold Assay Results for Rocklabs OxC109 and OxD155
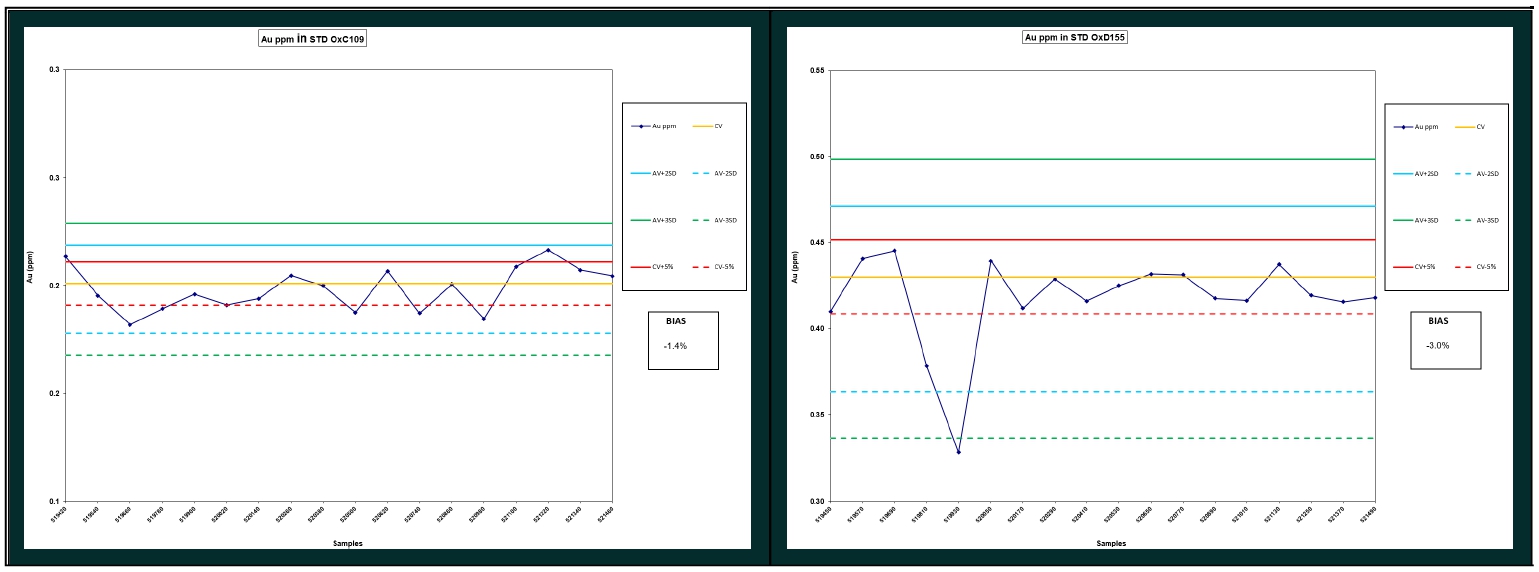
| San Francisco Project | 112 | May 1, 2026 |
| Goldgroup Mining Inc. |
Figure 11.33
2022 Certified Reference Material Gold Assay Results for OREAS 501d and OREAS 502c
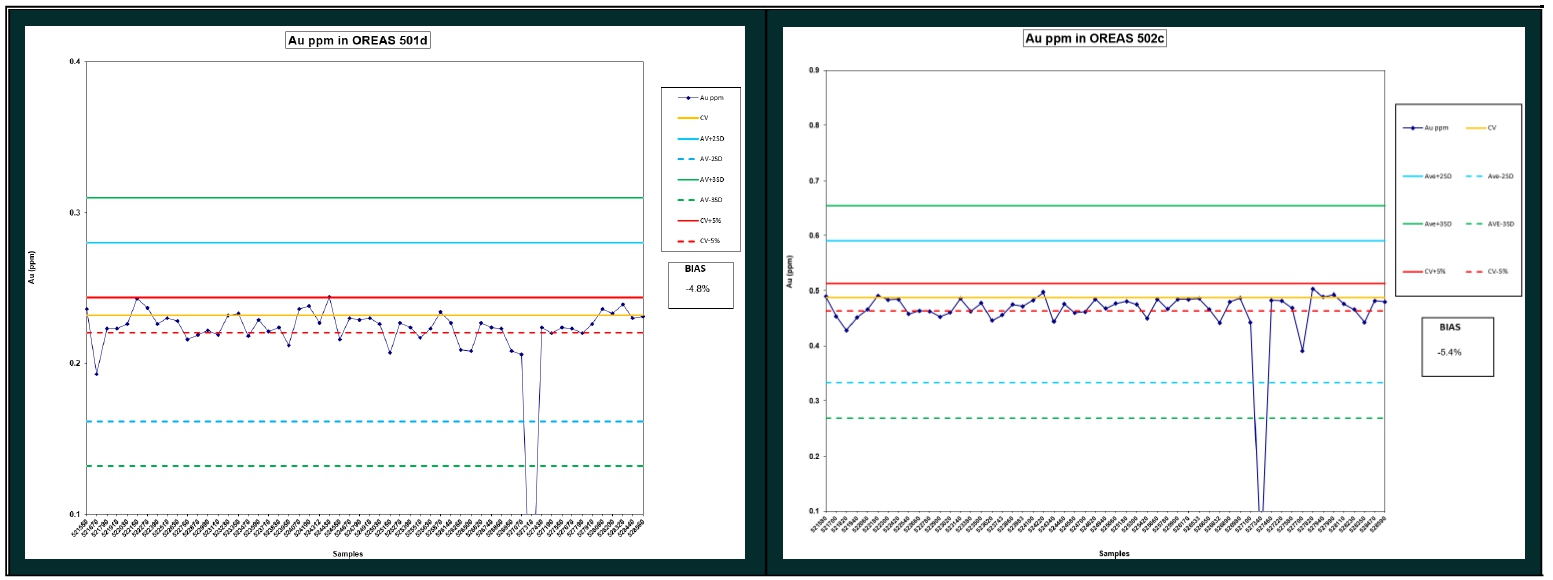
| San Francisco Project | 113 | May 1, 2026 |
| Goldgroup Mining Inc. |
Figure 11.34
Mine Laboratory - Field Sample Duplicate Assay Results for the 2020 to 2022 Drilling Campaigns
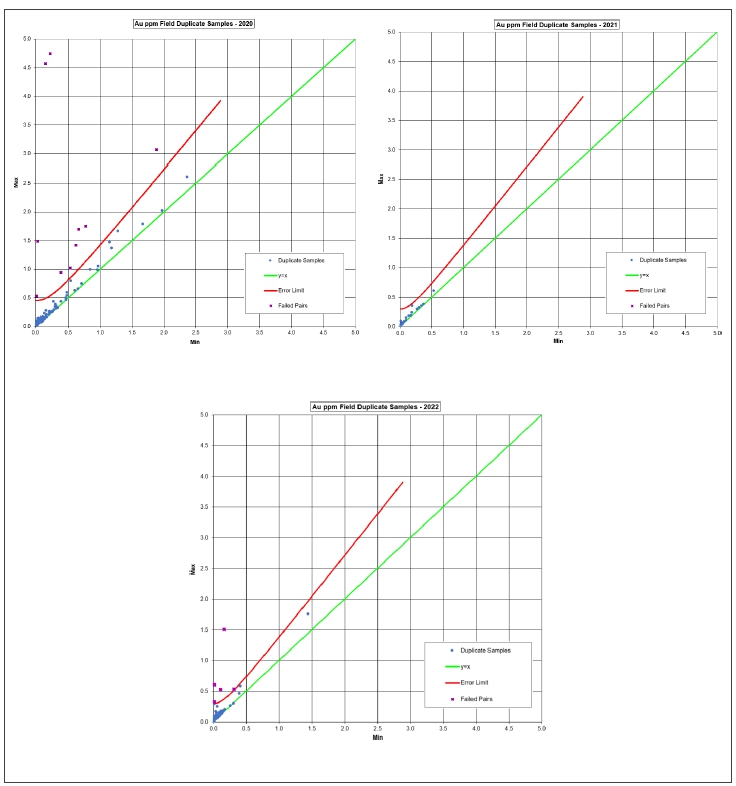
| San Francisco Project | 114 | May 1, 2026 |
| Goldgroup Mining Inc. |
12 DATA VERIFICATION
| 12.1 | Site Visit |
Micon’s latest site visit to the San Francisco Project was conducted between December 8, 2025, and December 10, 2025, with one full day (December 9, 2025) on site verifying drill collars for the North Pit location, visiting the San Francisco and La Chicharra pits, visiting the latest heap leach pile and siting in discussions with Goldgroup contractors and personnel discussing the Project. The site visit was conducted by Messers. William Lewis and Tudorel Ciuculescu, both of whom are Principal Geologists with Micon, based in Toronto, Canada.
During the site visit, a number of drill hole collars for the North zone were inspected (Figure 12.1). The San Francisco and La Chicharra pits and the heap leach pads were visited, as well as other areas of infrastructure. GPS readings taken at the drill hole collars inspected and those recorded at various infrastructure item were in good agreement with the elements contained in the database provided by Goldgroup.
No samples were taken during the site visit as the San Francisco Mine has a well-documented history of production, as well as, Micon QPs having verified the mineralization during multiple site visits between 2005 and 2020.
Mr. Lewis has conducted site visits in relation to nearly all of the previous Technical Reports that Micon has written for the San Francisco Project. These reports spanned the original acquisition by Timmins Gold Corp. (later Alio Gold Inc.) and early exploration through to, and including, the production phase of the Project. Site visits in conjunction with Technical Reports were conducted in 2005, 2007, 2008, 2009, 2010, 2011, 2013, 2016 (two visits), 2017 and the current 2025 Technical Report.
| 12.2 | Micon QP Verification of the Mineral Resource Estimate Database |
Micon’s QPs have previously validated the drilling database for the San Francisco and La Chicharra deposits. The current database includes additional information generated during the drilling campaigns performed since August, 2020. For this resource estimate, Micon concentrated the database verification efforts on the data collected since the previous report.
Micon’s QPs gathered files with laboratory-generated assay certificates from drilling campaigns executed in 2021 and 2022, focusing on drilling in the North Pit area. Data from 112 assay certificates were collected for comparison with the content of the drill hole database. A number of 8,060 sample labels out of 9,805 total assay certificate entries matched the drill hole database. This is consistent with the ratio of field samples to QA/QC material inserted in the sample stream sent to the laboratory. The assay certificate entries that did not matched the drill hole database were plotted for visual inspection. The assay values lined up on consistent levels, corresponding to expected blank and CRM values.
| San Francisco Project | 115 | May 1, 2026 |
| Goldgroup Mining Inc. |
Figure 12.1
December, 2025, San Francisco Project Site Visit GPS Track
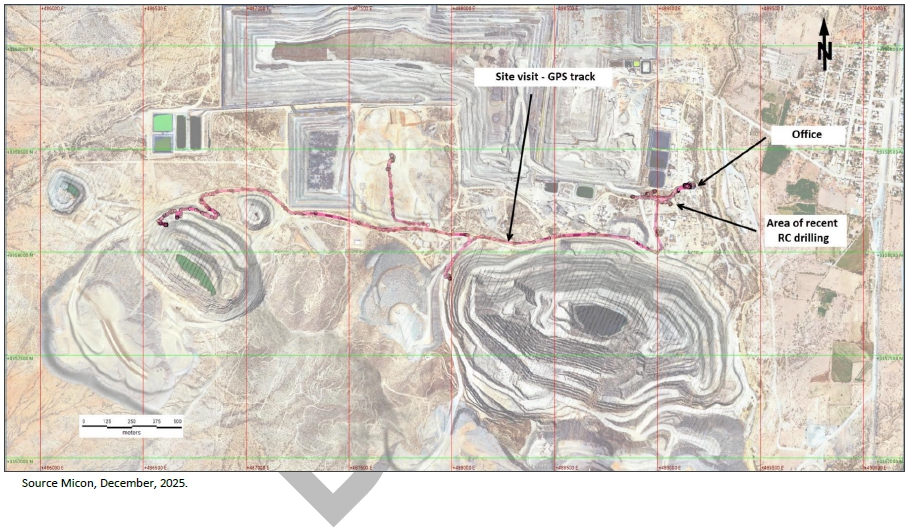
| San Francisco Project | 116 | May 1, 2026 |
| Goldgroup Mining Inc. |
The comparison matched 8,030 gold grade values from the database with assay certificate entries. The remaining 30 entries, all coming from one drill hole, showed minor differences, indicating that they were part of a reassayed sample batch.
For the North Pit resource estimate conducted by Micon’s QPs, only a portion of Magna’s drill hole database was retained, covering the area of interest and the surroundings. The assay certificate data matched 2,746 samples out of the 3,724 total samples in the estimation domain. The number of assays checked represented approximately 73% of the data retained for the North Pit deposit. No errors were identified.
Micon’s QPs noticed that assay results below detection limit were not treated consistently, the database showing either the detection limit value or half of the detection limit. While inconsequential, the accepted industry practice is to use half of the assay method detection limit for results below detection limit.
| 12.3 | Micon QP Comments |
In general, Micon’s QPs review of the material provided by Goldgroup and its discussions with Goldgroup personnel during the site visit and various online meetings found that the data provided were adequate for the purposes of preparing a Technical Report for the Project.
Micon’s QPs have conducted a number of prior data verification reviews of the Project for the previous Technical Reports and, in each case, has found that the data provided were adequate to serve as the basis of the material contained within those reports.
Micon’s QPs believe the data to be of sufficient quality to use in a Technical Report in support of a mineral resource estimation for the San Francisco Project.
| San Francisco Project | 117 | May 1, 2026 |
| Goldgroup Mining Inc. |
13 MINERAL PROCESSING AND METALLURGICAL TESTING
Although currently under care and maintenance, the San Francisco Project has been in production as a conventional gold heap leach operation periodically since 2010.
The current Owner (Goldgroup and its wholly owned subsidiary Molimentales) have not undertaken any metallurgical testwork. However, Alio, a previous property owner who operated the mine between 2010 and 2020, periodically completed metallurgical testwork in order to optimize gold recoveries and to gain a better understanding of the gold leaching characteristics of the mineralization at the San Francisco Project.
The testwork completed by and on behalf of Alio comprised:
| · | Standard column leach tests during 2012 by METCON Research Metallurgical Laboratory (METCON) in Tucson, Arizona using six crushed composite samples representing different types of mineralization identified at the San Francisco and La Chicharra deposits. |
| · | On-site column leach tests using the following types of samples: |
| o | Operating monthly process feed composite. |
| o | Rock type variability samples. |
| o | Metallurgical optimization/research tests using typical plant feed samples. |
| o | Crush size optimization tests using typical plant feed samples. |
Prior to the 2012 testwork by METCON and on-site column tests by Alio during the 2010 to 2020 operating years, the following process development and metallurgical studies were completed using mineralized samples from the San Francisco deposit.
| · | Comminution and hardness characterization tests by Norberg Inc. Minerals Research and Test Centre (before 2006). |
| · | Standard coarse and fine particle bottle roll leach tests and column leach tests using a variety of composite samples by Servicios Industriales Peñoles, S.A. de C.V. (Peñoles) of Monterrey, Mexico, McCelland Laboratories Inc. (McCelland), Kappes, Cassiday and Associates (KCA), both of Sparks, USA and METCON (before 2006). |
| · | Bottle roll and column leaching of four composite samples representing Granite; Gneiss; Pegmatite and Gabbro ore types by PRA of Richmond, B.C (2007) |
All the independent metallurgical laboratories mentioned above are well known respected entities within the mining community with excellent quality control systems.
| San Francisco Project | 118 | May 1, 2026 |
| Goldgroup Mining Inc. |
| 13.1 | Historical Metallurgical Testwork (Pre-2012) |
Almost 50 standard bottle roll tests were undertaken by Peñoles, McCelland, KCA and METCON using a variety of composite samples from San Francisco. Typically, the fine grind tests (around 80% passing 75 microns) gave gold leach extractions of around 90%. The results of over 30 column leach tests also completed by the four laboratories using crush sizes between 9.5 to 51 mm averaged 67% gold extraction after an average leaching duration of 65 days. Average consumption of NaCN was about 0.4 kg/t.
The results of the five 6-m high column tests completed by PRA in 2007 using composite samples crushed to minus 12.5 mm are summarized in Table 13.1.
Table 13.1
Summary of Results from the PRA Column Leach Tests
| Sample Description | Calculated
Head (g/t Gold) |
Days Leach |
Gold % Extraction |
Reagent Consumption (kg/t) | |
| NaCN | Ca(OH)2 | ||||
| Near Surface Granite | 4.22 | 44 | 78.0 | 0.75 | 0.5 |
| Gneiss | 1.60 | 44 | 62.2 | 0.119 | 0.5 |
| Granite Gneiss (Altered) | 0.42 | 40 | 66.6 | 0.119 | 0.5 |
| Pegmatite | 0.74 | 35 | 65.4 | 0.074 | 0.5 |
| Gabbro | 0.69 | 32 | 52.9 | 0.11 | 0.5 |
| 13.2 | 2012 Testwork by METCON |
In November 2012, Alio announced the results from a bulk sample locked column leach testing program on representative mineralized samples from the San Francisco Project. This test program was completed at the METCON Research metallurgical laboratory in Tucson, Arizona.
The cyanide leach column test results indicated an average gold extraction after 127 days of 71.0%, based on a crush size of 80% of the particles passing (P80) 9.5 mm (⅜inch), and 77.1% extraction with a crush size of P80 6.3 mm (¼inch). For La Chicharra samples, the average column test gold extractions for the same leaching period were 78.3% and 80.9%, based on crush sizes of P80 9.5 mm and P80 6.3 mm, respectively. No percolation issues were observed during the column leach tests.
Alio stated, in the November 2012 press release, that it was encouraged by the results from the testing program but that it would continue to use a life-of-mine (LOM) gold recovery of 68.6% in its resource estimations, mine planning and economic analyses. Alio also stated that it believed that the results of the testing program indicated that there was potential to further improve its gold recoveries through optimization of the process.
| 13.2.1.1 | Discussion of the 2012 Test Results |
Six composite samples were tested in the 2012 metallurgical study; five from the San Francisco deposit and one from the La Chicharra deposit. The samples were classified by the following rock types:
| · | La Chicharra. |
| · | San Francisco |
| San Francisco Project | 119 | May 1, 2026 |
| Goldgroup Mining Inc. |
| o | SF – Granite. |
| o | SF – Basic gneiss. |
| o | SF – Gabbro. |
| o | SF – Pegmatite and schist. |
| o | SF – Acid gneiss. |
Table 13.2 and Table 13.3 summarize the final gold extractions for these samples, based on P80 crush sizes of 9.5 and mm 6.3 mm, respectively, and a leach time of 127 days. Two averages are presented in the tables, a simple arithmetic average and a weighted average based on the estimated LOM relative abundance of each rock type within the deposit. The samples were considered a good representation of each of the rock types and style of the mineralization within the deposit as a whole.
Table 13.2
Summary of Column Leach Test Results, Crush Size P80 9.5 mm, 127 Days Leach Time
| Sample Description | Relative
Proportion of the Deposit (%) |
Au
Extraction (%) |
| SF - Granite | 13.0 | 76.58 |
| SF – Basic Gneiss | 26.4 | 71.08 |
| SF - Gabbro | 18.9 | 63.79 |
| SF – Pegmatite and Schist | 12.7 | 74.38 |
| SF – Acid Gneiss | 29.1 | 71.40 |
| Sample average | 100 | 71.45 |
| Weighted average (based on LOM abundances) | 100 | 71.00 |
| La Chicharra | 100 | 78.34 |
Source: August 2020 Micon Technical Report.
Table 13.3
Summary of Column Leach Test Results, Crush Size P80 6.3 mm, 127 Days Leach Time
| Sample Description | Relative
Proportion of the Deposit (%) |
Au
Extraction (%) |
| SF - Granite | 13.0 | 87.89 |
| SF – Basic Gneiss | 26.4 | 74.37 |
| SF - Gabbro | 18.9 | 71.22 |
| SF – Pegmatite and Schist | 12.7 | 79.69 |
| SF – Acid Gneiss | 29.1 | 77.03 |
| Sample average | 100 | 78.04 |
| Weighted average (based on LOM abundances) | 100 | 77.06 |
| La Chicharra | 100 | 80.89 |
Source: August 2020 Micon Technical Report.
The leaching test parameters used for the column leach tests are summarized below:
| · | Sample sizes were approximately 180 kg for each column test. |
| San Francisco Project | 120 | May 1, 2026 |
| Goldgroup Mining Inc. |
| · | Lime was blended with the test charge. Lime addition was estimated from a 72-hr agitated cyanidation bottle roll test. |
| · | The initial feed solution was prepared by adding reagent grade lime to Tucson tap water to obtain a solution pH of 11.00, followed by the addition of 1.0 gram of sodium cyanide per litre (g/L) of solution. The columns were irrigated at a flow rate of 10 L/h/m2. |
| · | Column tests were conducted under a locked cycle type of leaching regime, by contacting the pregnant solution with activated carbon to remove gold and silver. The loaded activated carbon in each column test was dried, weighed and saved in sealed and labelled plastic bags. |
| · | The resulting barren solution was recycled as column feed solution after the addition of sodium cyanide and lime to maintain a cyanide solution strength of 1.0 g/L and a pH of between 10.5 to 11.0. |
| 13.3 | On-Site Internal Testwork |
As a past operator, Alio conducted internal column leach testing to obtain a better understanding of the metallurgical response of the mineralization types located on the San Francisco property, and to monitor and optimize gold leach recovery at the operation. Table 13.4 summarizes the 2015 results from these internal metallurgical column leach tests and Table 13.5 presents the preliminary column test results from a series of tests undertaken in 2017.
| 13.3.1 | Discussion of On-Site Column Leach Test Results |
The regular monthly column test results show gold recoveries between 52% and 81% for tests operated for 60 day or more. These test results compare reasonably well with the typical plant gold recovery which, historically, has been approximately 65%. Figure 13.1 presents the cumulative reported recoverable and actual gold recoveries from 2010 to 2017.
Figure 13.1
Historical Cumulative Plant Gold Recoveries2010 to 2017
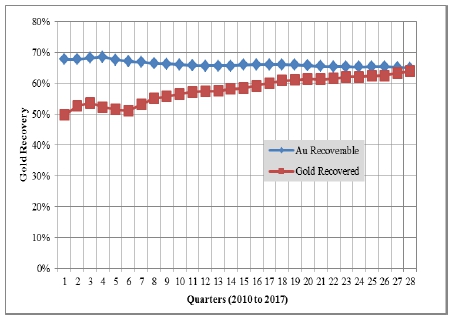
| San Francisco Project | 121 | May 1, 2026 |
| Goldgroup Mining Inc. |
Table 13.4
Summary of Alio’s 2015 Internal Metallurgical Testwork Results
| ID Test | Sample ID | Column Height (m) | Presoak1 (mg/L) |
Solution
Strength (ppm NaCN) |
Au Grade (g/t) | Rock Size (<9.5 mm) |
Days Leached | % Gold Recovery |
| Regular Monthly Composites | ||||||||
| January, 2015 | 1 | 3 | 1,000 | 350 | 0.500 | 85.61% | 90 | 63.59% |
| January, 2015 | 1 A | 3 | 2,000 | 350 | 0.500 | 85.61% | 90 | 63.15% |
| February, 2015 | 2 | 3 | 1,000 | 350 | 0.480 | 83.95% | 90 | 61.91% |
| February, 2015 | 2 A | 3 | 2,000 | 350 | 0.480 | 83.95% | 90 | 59.87% |
| March, 2015 | 3 | 3 | 1,000 | 350 | 0.520 | 81.94% | 90 | 52.00% |
| March, 2015 | 3 A | 3 | 2,000 | 350 | 0.564 | 85.71% | 90 | 53.10% |
| April, 2015 | 4 | 3 | 2,000 | 350 | 0.510 | 85.18% | 90 | 59.95% |
| April, 2015 | 4 A | 3 | 2,000 | 250 | 0.520 | 86.33% | 90 | 59.08% |
| April, 2015 | 4 B | 3 | 2,000 | 350 | 0.510 | 100.00% | 90 | 62.13% |
| April, 2015 | 4 C | 3 | 2,000 | 250 | 0.510 | 100.00% | 90 | 59.17% |
| May, 2015 | 5 | 3 | 2,000 | 350 | 0.530 | 85.18% | 90 | 69.21% |
| May, 2015 | 5A | 3 | 2,000 | 350 | 0.560 | 85.18% | 90 | 68.72% |
| May, 2015 | 5B | 3 | 2,000 | 350 | 0.510 | 85.18% | 90 | 68.70% |
| June, 2015 | 6 | 3 | 2,000 | 350 | 0.450 | 88.01% | 90 | 59.53% |
| June, 2015 | 6A | 3 | 2,000 | 350 | 0.415 | 89.04% | 90 | 59.86% |
| June, 2015 | 6B | 3 | 2,000 | 350 | 0.480 | 88.31% | 90 | 61.17% |
| July, 2015 | 7 | 3 | 2,000 | 500 | 0.502 | 86.99% | 90 | 58.31% |
| July, 2015 | 7A | 3 | 2,000 | 500 | 0.502 | 86.99% | 90 | 56.92% |
| August, 2015 | 8 | 3 | 2,000 | 500 | -- | -- | 15 | 36.18% |
| August, 2015 | 8A | 3 | 2,000 | 500 | -- | -- | 15 | 34.52% |
| September, 2015 | 9 | 3 | 2,000 | 500 | 0.480 | 86.78% | 51 | 52.64% |
| September, 2015 | 9A | 3 | 2,000 | 500 | 0.510 | 85.31% | 51 | 54.28% |
| Variable Rock Types | ||||||||
| Old ore Phase 2 | RPL-01 | 3 | N/A | 250 | 0.412 | 81.00% | 90 | 20.55% |
| Old ore Phase 2 | RPL-02 | 3 | N/A | 250 | 0.412 | 82.00% | 90 | 20.46% |
| Underground ore | 2 SUB 01 | 3 | 2,000 | 300 | 4.400 | 100.00% | 90 | 64.92% |
| Underground ore | 2 SUB 02 | 3 | 2,000 | 500 | 4.400 | 100.00% | 90 | 64.71% |
| Underground ore | 2 SUB 03 | 3 | N/A | 500 | 3.030 | 97.50% | 90 | 69.35% |
| Underground ore | 2 SUB 04 | 3 | N/A | 500 | 3.030 | 97.80% | 90 | 66.74% |
| Metallurgical Research | ||||||||
| Oct-15, with O2 | Col. A | 2.5 | N/A | 400 | 0.370 | 86.25% | 23 | 73.50% |
| Oct-15, without O2 | Col. B | 2.5 | N/A | 400 | 0.370 | 86.25% | 23 | 68.78% |
| Old ore with O2 | Col. C | 2.5 | N/A | 400 | 0.200 | 85.26% | 23 | 23.21% |
| Old ore without O2 | Col. D | 2.5 | N/A | 400 | 0.200 | 85.28% | 23 | 19.37% |
Source: Originally provided by Alio Gold Inc. and taken from the August 2020 Micon Technical Report.
1 Presoak, 7% solution by weight with 1 or 2 g/L sodium cyanide (NaCN) solution.
| San Francisco Project | 122 | May 1, 2026 |
| Goldgroup Mining Inc. |
Table 13.5
Summary of Alio’s 2017 Internal Metallurgical Testwork
| ID Test | Assayed
Head (g/t) |
Calculated
Head (g/t) |
NaCN
Consumed (g/t) |
Crush Size (P80 mm) |
Days Leached | Liquid/Solid Ratio | % Gold Recovery |
| Regular Monthly Composites | |||||||
| December 2016 composite | 0.51 | 0.47 | 250 | 7.97 | 80 | 2.27 | 61.72% |
| January 2017 composite | 0.42 | - | 312 | 7.47 | 73 | 2.16 | 81.07% |
| February 2017 composite | 0.39 | - | 372 | 8.29 | 62 | 1.95 | 76.32% |
| March 2017 composite | 0.44 | - | 180 | 7.89 | 51 | 1.59 | 53.77% |
| April 2017 composite | 0.39 | - | 54 | 7.76 | 19 | 0.49 | 53.63% |
| Variable Rock Types | |||||||
| Low-grade stockpiled | 0.25 | 0.26 | 200 | 7.26 | 58 | 1.64 | 63.55% |
| Low-grade stockpiled + solid peroxide | 0.25 | 0.26 | 150 | 6.97 | 58 | 1.71 | 64.25% |
| Basic gneiss, SF | 0.27 | 0.27 | 120 | 7.24 | 59 | 1.81 | 52.22% |
| Basic gneiss, LCH | 0.49 | 0.45 | 164 | 7.10 | 59 | 1.75 | 69.82% |
| Gabbro, LCH | 0.30 | 0.28 | 177 | 7.28 | 59 | 1.59 | 76.53% |
| Gabbro, SF*1 | 0.17 | 0.16 | 55 | 7.40 | 23 | 0.53 | 46.88% |
| Granite, SF | 0.72 | - | 362 | 6.89 | 105 | 3.504 | 60.84% |
| Las Barajitas ore | 0.66 | - | 54 | 6.70 | 12 | 0.26 | 61.31% |
| Metallurgical Research | |||||||
| December 2016 composite + solid peroxide | 0.51 | 0.47 | 185 | 7.97 | 80 | 2.31 | 62.86% |
| January 2017 composite + solid peroxide | 0.42 | - | 258 | 7.47 | 73 | 2.02 | 84.44% |
| January 2017 composite (P90 -1/4”) | 0.42 | - | 342 | 4.49 | 73 | 1.64 | 81.38% |
| February 2017 composite + solid peroxide | 0.38 | - | 144 | 8.29 | 41 | 1.15 | 73.36% |
| Electronic Initiator ENAEX | 0.24 | - | 67 | 11.06 | 35 | 1.00 | 43.94% |
| Variable Grind Size (dated at March 23, 2017) | |||||||
| OVERLAND P80 9.41 mm | 0.41 | - | 95 | 9.41 | 33 | 1.04 | 44.92% |
| OVERLAND P80 7.87 mm | 0.41 | - | 87 | 7.87 | 33 | 0.93 | 47.29% |
| OVERLAND P80 6.35 mm | 0.39 | - | 131 | 6.35 | 33 | 1.07 | 49.23% |
1 Table originally provided by Alio Gold Inc. and taken from the August 2020 Micon Technical Report.
2 No Presoak.
| San Francisco Project | 123 | May 1, 2026 |
| Goldgroup Mining Inc. |
Of note are the relatively high gold recoveries achieved for the standard 2017 January and February composite tests, which were 81% and 76% after 73 days of leaching, respectively.
The metallurgical test results presented above suggest that the addition of oxygen and/or peroxide improves the kinetics and the overall gold recovery. Also, preliminary results from tests comparing crush sizes have shown improved gold recoveries with finer crushing.
| 13.4 | Micon QP Comments and Conclusions |
The results from on-site metallurgical testwork programs undertaken between 2015 and 2017 compared reasonably well with the average gold extraction achieved during operations, which was approximately 65%. However, column leach testwork completed at an independent laboratory in 2012 suggested potentially higher gold leach extractions of above 70% for both San Francisco and La Chicarra mineralization, respectively.
The samples used for the testwork are considered by the QP to be representative of the different types of mineralization found at the San Francisco and La Chicharra mineral deposits. The testwork completed to date and operating experience between 2010 to 2020 have not highlighted any deleterious elements or minerals that would have any material negative effect on economic extraction.
| San Francisco Project | 124 | May 1, 2026 |
| Goldgroup Mining Inc. |
14 MINERAL RESOURCE ESTIMATES
| 14.1 | Introduction |
The resource estimate for this report is partly based on revising the previous work completed by Magna and Micon for the 2020 Mineral Resource Estimate and completing a new Mineral Resource Estimate for the North Pit area based upon drilling completed by Magna. The Mineral Resource Estimates reported for the San Francisco and La Chicharra deposits are supported by Magna block models and have been depleted to reflect the mining completed by Magna before the mine closure. The resources reported in the North Pit are supported by a 2026 block model developed by Micon. The resource estimate is compliant with the current CIM standards and definitions as specified by NI 43-101 and supersedes all previous mineral resource estimates for the San Francisco Project. The effective date of the current mineral resource estimate is April 30, 2026.
Since the previous 2020 report on the San Francisco Project, drilling campaigns in 2020, 2021, and 2022 resulted in 285 additional drill holes totalling 33,596.5 m added to the drill hole database. The drilling was focused primarily in the northern and eastern parts of San Francisco deposit.
The 2020 block models and a gold price of US$ 3,500 was used for the San Francisco and La Chicharra 2026 mineral resource estimates, maintaining the rest of the pit optimization parameters as they were for the 2020 mineral resource estimate. For the North Pit a gold price of US $3,500 was used, while the costs were maintained the same as for San Francisco and La Chicharra.
The process of mineral resource estimation includes technical information which requires subsequent calculations or estimates to derive sub-totals, totals and weighted averages. Such calculations or estimations inherently involve a degree of rounding and consequently introduce a margin of error. Where these occur, Micon does not consider them to be material.
| 14.2 | CIM Mineral Resource Definitions and Classifications |
All resources and reserves presented in a Technical Report should follow the current CIM definitions and standards for mineral resources and reserves. The latest edition of the CIM definitions and standards was adopted by the CIM council on May 10, 2014, and includes the resource definitions reproduced below:
“Mineral Resources are sub-divided, in order of increasing geological confidence, into Inferred, Indicated and Measured categories. An Inferred Mineral Resource has a lower level of confidence than that applied to an Indicated Mineral Resource. An Indicated Mineral Resource has a higher level of confidence than an Inferred Mineral Resource but has a lower level of confidence than a Measured Mineral Resource.”
“A Mineral Resource is a concentration or occurrence of solid material of economic interest in or on the Earth’s crust in such form, grade or quality and quantity that there are reasonable prospects for eventual economic extraction.”
| San Francisco Project | 125 | May 1, 2026 |
| Goldgroup Mining Inc. |
“The location, quantity, grade or quality, continuity and other geological characteristics of a Mineral Resource are known, estimated or interpreted from specific geological evidence and knowledge, including sampling.”
“Material of economic interest refers to diamonds, natural solid inorganic material, or natural solid fossilized organic material including base and precious metals, coal, and industrial minerals.”
“The term Mineral Resource covers mineralization and natural material of intrinsic economic interest which has been identified and estimated through exploration and sampling and within which Mineral Reserves may subsequently be defined by the consideration and application of Modifying Factors.”
“Inferred Mineral Resource”
“An Inferred Mineral Resource is that part of a Mineral Resource for which quantity and grade or quality are estimated on the basis of limited geological evidence and sampling. Geological evidence is sufficient to imply but not verify geological and grade or quality continuity.”
“An Inferred Mineral Resource has a lower level of confidence than that applying to an Indicated Mineral Resource and must not be converted to a Mineral Reserve. It is reasonably expected that the majority of Inferred Mineral Resources could be upgraded to Indicated Mineral Resources with continued exploration.”
“An Inferred Mineral Resource is based on limited information and sampling gathered through appropriate sampling techniques from locations such as outcrops, trenches, pits, workings and drill holes. Inferred Mineral Resources must not be included in the economic analysis, production schedules, or estimated mine life in publicly disclosed Pre-Feasibility or Feasibility Studies, or in the Life-of-mine plans and cash flow models of developed mines. Inferred Mineral Resources can only be used in economic studies as provided under NI 43-101.”
“Indicated Mineral Resource”
“An Indicated Mineral Resource is that part of a Mineral Resource for which quantity, grade or quality, densities, shape and physical characteristics are estimated with sufficient confidence to allow the application of Modifying Factors in sufficient detail to support mine planning and evaluation of the economic viability of the deposit.”
“Geological evidence is derived from adequately detailed and reliable exploration, sampling and testing and is sufficient to assume geological and grade or quality continuity between points of observation.”
“An Indicated Mineral Resource has a lower level of confidence than that applying to a Measured Mineral Resource and may only be converted to a Probable Mineral Reserve.”
“Mineralization may be classified as an Indicated Mineral Resource by the Qualified Person when the nature, quality, quantity and distribution of data are such as to allow confident interpretation of the geological framework and to reasonably assume the continuity of mineralization. The Qualified Person must recognize the importance of the Indicated Mineral Resource category to the advancement of the feasibility of the project. An Indicated Mineral Resource estimate is of sufficient quality to support a Pre-Feasibility Study which can serve as the basis for major development decisions.”
| San Francisco Project | 126 | May 1, 2026 |
| Goldgroup Mining Inc. |
“Measured Mineral Resource”
“A Measured Mineral Resource is that part of a Mineral Resource for which quantity, grade or quality, densities, shape, and physical characteristics are estimated with confidence sufficient to allow the application of Modifying Factors to support detailed mine planning and final evaluation of the economic viability of the deposit.”
“Geological evidence is derived from detailed and reliable exploration, sampling and testing and is sufficient to confirm geological and grade or quality continuity between points of observation.
A Measured Mineral Resource has a higher level of confidence than that applying to either an Indicated Mineral Resource or an Inferred Mineral Resource. It may be converted to a Proven Mineral Reserve or to a Probable Mineral Reserve.”
“Mineralization or other natural material of economic interest may be classified as a Measured Mineral Resource by the Qualified Person when the nature, quality, quantity and distribution of data are such that the tonnage and grade or quality of the mineralization can be estimated to within close limits and that variation from the estimate would not significantly affect potential economic viability of the deposit. This category requires a high level of confidence in, and understanding of, the geology and controls of the mineral deposit.”
| 14.3 | CIM Estimation of Mineral Resources Best Practices Guidelines |
Micon and its QPs have used the CIM Estimation of Mineral Resources and Mineral Reserves Best Practices Guidelines which were adopted by the CIM Council on November 29, 2019, in conducting the audit of the San Francisco Project. The November, 2019 guidelines supersede the 2003 CIM Best Practices Guidelines which were followed by Micon and its QPs when completing the previous resource estimations and audits.
| 14.4 | April 30, 2026 Mineral Resource Estimate Statement |
The Mineral Resource Estimates which have an effective date of April 30, 2026 are presented in Table 14.1.
Table 14.1
Mineral Resource Estimate for the San Francisco Project as of April 30, 2026
| Area | Cut-off (Au g/t) | Category | K tonnes | Au (g/t) | Gold (K oz) |
| San Francisco Mine OP | 0.09 | Measured | 41,024 | 0.38 | 498.9 |
| Indicated | 38,299 | 0.37 | 456.8 | ||
| Measured and Indicated | 79,323 | 0.37 | 955.7 | ||
| Inferred | 7,464 | 0.39 | 93.3 |
| San Francisco Project | 127 | May 1, 2026 |
| Goldgroup Mining Inc. |
| Area | Cut-off (Au g/t) | Category | K tonnes | Au (g/t) | Gold (K oz) |
| La Chicharra Mine OP | 0.07 | Measured | 7,241 | 0.36 | 82.8 |
| Indicated | 13,892 | 0.32 | 143.8 | ||
| Measured and Indicated | 21,132 | 0.33 | 226.6 | ||
| Inferred | 1,0402,662 | 0.37 | 12.4 | ||
| North Pit Mine OP | 0.08 | Measured | |||
| Indicated | 4,630 | 0.30 | 44.3 | ||
| Measured and Indicated | 4,630 | 0.30 | 44.3 | ||
| Inferred | 8,764 | 0.26 | 72.7 | ||
| Total Resources | Measured | 48,265 | 0.37 | 581.7 | |
| Indicated | 56,821 | 0.35 | 644.9 | ||
| Measured and Indicated | 105,086 | 0.36 | 1,226.6 | ||
| Inferred | 17,268 | 0.32 | 178.4 |
Notes:
| 1. | The effective date of this MRE is April 30, 2026. | |
| 2. | Messrs. William Lewis, P.Geo. and Tudorel Ciuculescu, P.Geo. from Micon International Limited are the Qualified Persons (QPs) responsible for this MRE. | |
| 3. | The MRE has been classified in the Measured, Indicated, and Inferred categories. | |
| 4. | The calculated gold break-even cut-off grade is 0.12 g/t Au for San Francisco Mine, 0.10 g/t Au for La Chicharra Mine, and 0.12 g/t Au for North Pit Mine. Marginal cut-off grade is 0.09 g/t Au for San Francisco Mine, 0.07 g/t Au for La Chicharra Mine, and 0.08 g/t Au for North Pit Mine. | |
| 5. | The mineral resources are constrained by resource shells based on the break-even cut-off grade and reported at the marginal cut-off grade. | |
| 6. | The SG values vary between 2.0 g/cm3 and 2.85 g/cm3 depending on lithology. | |
| 7. | The MRE used economic assumptions for open pit mining. The following economic parameters were used for generating cut-off grades: for San Francisco and La Chicharra a gold price of US$3,500/oz, recovery from 54.5% to 74.4% (64% average recovery), open pit mining cost of US$2.69/t, processing costs of US$5.1/t, general and administration cost of US$1.0/t; for North Pit a gold price of US$3,500/oz, recovery from 54.5% to 73% (67% average recovery), open pit mining cost of US$2.69/t, processing costs of US$5.1/t, general and administration cost of US$1.0/t. | |
| 8. | The open pits used average slope angles of 50° and royalty of 1.5%. | |
| 9. | The block models are orthogonal, and have a parent block size of 5 m x 5 m x 6 m. | |
| 10. | The mineral resources described above have been prepared in accordance with the current Canadian Institute of Mining, Metallurgy and Petroleum Standards and Practices. | |
| 11. | Numbers have been rounded to the nearest thousand tonnes and nearest hundred ounces. Differences may occur in totals due to rounding. | |
| 12. | Mineral Resources are not Mineral Reserves as they do not have demonstrated economic viability. The quantity and grade of reported Inferred Mineral Resources are uncertain in nature and there has been insufficient exploration; however, it is reasonably expected that a significant portion of Inferred Mineral Resources could be upgraded into Indicated Mineral Resources with further exploration. | |
| 13. | Micon’s QPs have not identified any environmental, permitting, legal, title, taxation, socio-economic, marketing or political issues which would adversely affect the mineral resources estimated above. |
The CIM standards and definitions state that mineral resources must meet the condition of “a reasonable prospect for eventual economic extraction”. Goldgroup and Micon developed Lerchs-Grossman pit shells at reasonable gold prices, costs and recovery assumptions, in order to satisfy this condition. The resource estimate presented in Table 14.1 is based on optimized pit shells for a gold price of US$ 3,500 per ounce and additional cost and recovery parameters developed by Magna for San Francisco and La Chicharra. The additional parameters have been also used for the North Pit.
| San Francisco Project | 128 | May 1, 2026 |
| Goldgroup Mining Inc. |
| 14.5 | Mineral Resource Estimation Procedures |
The resource block models are based on 5 m by 5 m by 6 m high blocks. The coordinate limits of the previous model were retained for this current work. The topography was updated to reflect the mined surface as of November 17, 2025. The undisturbed pre-mining topographic surfaces are also available in the model.
Mineralized lenses were manually interpreted, based on the data available in the database. These were used to constrain the gold grade estimation and assign.
This approach allows for more precise geological modelling and mineralization interpretation, which enables the planning of better drilling programs to explore the extent of the mineralization and also the preparation of better engineering designs regarding the ore and waste split in the pit. Overall, the method is similar to the previous method, except that the grade envelopes and geological domains are directly interpreted by geologists using the drilling information they have gathered.
| 14.5.1 | Database |
The database of the San Francisco and La Chicharra deposits consists of 4,862 drill holes with 457,328 sample intervals, mostly 1.5 m in length, of a total database of 719,247 m of drilling for the entire property, including exploration drilling outside the San Francisco and La Chicharra pits. The current database includes 285 new holes drilled from 2020 to 2022, for a total of 33,596.5 m of drilling. Figure 14.1 is a plan view of the San Francisco mine drill hole collar locations.
Approximately 12% of the sampling intervals are greater than or equal to 2 m length, about 85% of the intervals are between 1.5 and 2.0 m in length, and about 3% are less than 1.5 m in length. In the case of duplicate samples, the original sample was used in the database. Figure 14.2 shows a 3D profile of the current topography and the drill holes, looking north. Figure 14.5 shows a 3D profile current topography and the drill holes, looking west.
| 14.5.2 | Capping |
High-grade outlier assays were capped at different gold grades, according to the domains within the San Francisco and La Chicharra pits. The capping values applied to each domain, and the number of composites capped, are summarized in Table 14.2 and Table 14.3.
For the North Pit deposit, assays were capped at 4 g/t Au for mineralization domains and 0.7g/t Au for wall rock. Capping was applied on seven samples in the mineralization domains and three samples in the wall rock.
| 14.5.3 | Compositing |
The assay database was composited to 3-m regular down-hole lengths, which is half the block height of 6 m. Assays were length-weighted for each composite. The relatively short composite length was chosen to unsmooth the resultant block grade distribution and provide a better match between the interpolated block grades and the underlying assay data.
| San Francisco Project | 129 | May 1, 2026 |
| Goldgroup Mining Inc. |
Figure 14.1
Plan View of the Drill Hole Collars at the San Francisco Mine
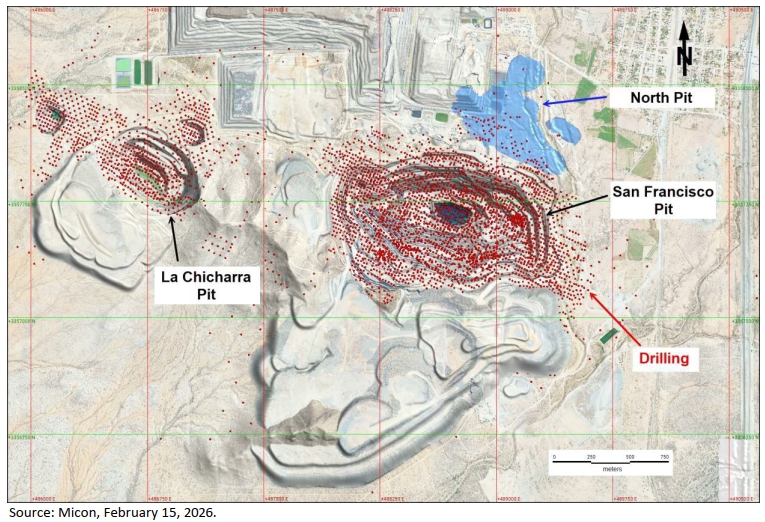
Figure 14.2
3-D Profile of the Topography and the Drill Holes at the San Francisco and La Chicharra Pits
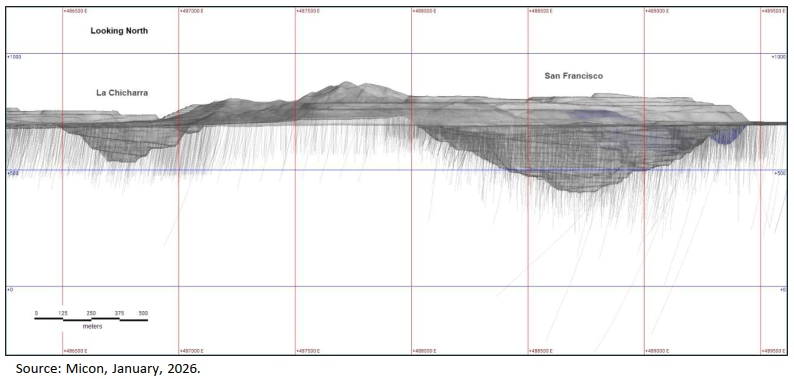
| San Francisco Project | 130 | May 1, 2026 |
| Goldgroup Mining Inc. |
Figure 14.3
3-D Profile of the Topography and the Drill Holes at the San Francisco and North Pit
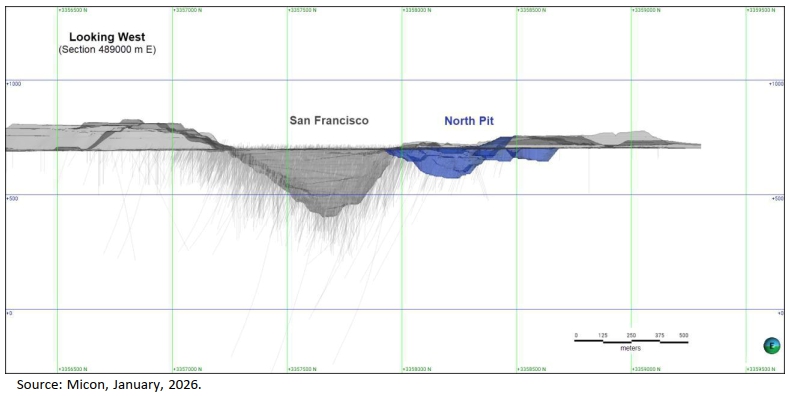
Table 14.2
Applied Grade Capping on 3 m Composites for the San Francisco Resource Model by Rock Type
| Rock | Lithology Codes |
Au
g/t Capping |
#
Capped Composites |
Max
Au g/t Value |
| Diorite | 2 | 3.00 | 10 | 5.063 |
| Gneiss | 4 | 10.00 | 47 | 62.179 |
| Granite | 5 | 10.00 | 32 | 86.600 |
| Schist | 6 | 8.00 | 11 | 16.547 |
| Lamprophyre | 8 | 2.00 | 18 | 8.2515 |
| Pegmatite | 10 | NA | NA | NA |
| Gabbro | 11 | 9.00 | 46 | 42.0554 |
| Conglomerate | 12 | 1.00 | 20 | 18.747 |
Table 14.3
Applied Grade Capping on 3 m Composites for the La Chicharra Resource Model by Resource Area
| Domain | Codes | Au g/t Capping | # Capped Composites | Max Au g/t Value |
| North Pit | 100 | 4.00 | 2 | 6.058 |
| Chicharra Pit N | 200 | 4.00 | 3 | 23.518 |
| Chicharra Pit S | 300 | 5.50 | 8 | 28.595 |
| NW Pit | 400 | 5.00 | 1 | 6.038 |
| West Area | 500 | 2.50 | 6 | 6.668 |
| San Francisco Project | 131 | May 1, 2026 |
| Goldgroup Mining Inc. |
| 14.5.4 | Block Models |
The block models are based on regular 5 m by 5 m by 6 m block and cover an area of 2,560 m by 2,100 m in plan, and 456 m vertically. Table 14.4 gives the coordinate limits and dimensions for each of the mineralized zones. Figure 14.4 is a 3D view of the topography and interpreted mineral constraints at the San Francisco and La Chicharra deposits. For La Chicharra deposit, two temporary block models were prepared for pit optimization purposes. These models are located within the extent of the main La Chicharra block model limits.
Table 14.4
3-D Block Model Limits and Dimensions
| Area | Coordinates | Minimum | Maximum | Block Size | Number |
| San Francisco Pit | Easting | 487500 | 490060 | 5 m | 512 columns |
| Northing | 3356500 | 3358600 | 5 m | 420 rows | |
| Elevation | 158 | 854 | 6 m | 116 levels | |
| No Rotation | |||||
| La Chicharra Pit | Easting | 485000 | 487500 | 5 m | 500 columns |
| Northing | 3357500 | 3359000 | 5 m | 300 rows | |
| Elevation | 302 | 812 | 6 m | 85 levels | |
| No Rotation | |||||
| North Pit | Easting | 488490 | 489590 | 5 m | 220 columns |
| Northing | 3357915 | 3358715 | 5 m | 160 rows | |
| Elevation | 464 | 764 | 6 m | 50 levels | |
| No Rotation | |||||
Figure 14.4
3-D View of the Topography and Interpreted Mineralized Constraints at the San Francisco and La Chicharra Deposits
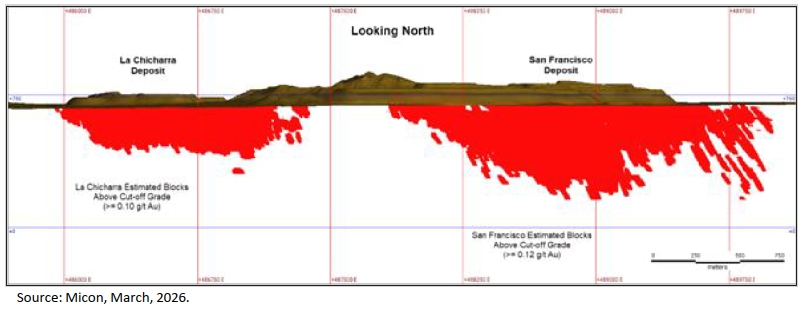
| San Francisco Project | 132 | May 1, 2026 |
| Goldgroup Mining Inc. |
| 14.5.5 | Mineralized Outlines |
For the current resource estimate, the mineralized grade shells were constrained using 3D solids interpreted by geologists, based on the mineralized intercepts intersected by the drill holes. Micon considers this approach to be superior because it allows for appropriate interpretive geological control within the model.
| 14.5.6 | Block Model Rock Domains |
The QPs for this Technical Report have continued to use the rock domain interpretation developed for previous resource estimates. This data was built up over time and as more data became available, the geological domains were interpreted in more detail by past operators. Table 14.5 summarizes the rock domains, with the corresponding codes and specific gravities.
Table 14.5
Rock Domain Code and Specific Gravity for the San Francisco and La Chicharra Pit
| Rock Name | Rock Code | Specific Gravity |
| Diorite | 2 | 2.72 |
| Gneiss, Felsic | 4 | 2.75 |
| Granite | 5 | 2.76 |
| Schist | 6 | 2.75 |
| Gneiss, Mafic | 7 | 2.75 |
| Lamprophyre dike | 8 | 2.76 |
| Pegmatite | 10 | 2.85 |
| Gabbro | 11 | 2.81 |
| Conglomerate | 12 | 2.0 |
Table taken from the August 2020 Technical Report.
At San Francisco and La Chicharra, bench polygons for each rock type were derived from this interpretation and imported into the block model. Blocks were coded based on 12 m bench polygons, projecting 6 m above and 6 m below the bench, in accordance with the principal rock type present in each block.
For North Pit, similar lithologies were grouped and lithological wireframes were modelled. Blocks were flagged with the corresponding wireframe. Densities used in the interpretation for the North Pit were based upon the densities used for the individual rock types found in the San Francisco pit.
Composites were assigned the rock type of the block in which they were located.
| 14.5.7 | Specific Gravity |
A total of 68 specific gravity determinations were made, covering all rock domains. Results range from a high of 2.84 g/cm3 to a low of 2.61 g/cm3, with an arithmetic mean of 2.76 g/cm3. The specific gravity for each rock type, as used in the resource estimate, is summarized in Table 14.5.
| San Francisco Project | 133 | May 1, 2026 |
| Goldgroup Mining Inc. |
| 14.5.8 | Grade Interpolation |
At San Francisco and La Chicharra, all blocks in the model were interpolated using the Ordinary Kriging method. The parameters were derived from the variographic analysis and applied to the different domains and zones accordingly.
The applied search parameters used for the grade interpolation for the San Francisco and La Chicharra pits are summarized in Table 14.6 and Table 14.7, respectively.
Table 14.6
Applied Search Parameters for Ordinary Kriging Grade Interpolation for the San Francisco Pit
| Rock Code(s) |
Pass | Az (°) |
Plunge (°) |
Dip (°) |
Variogram Parameters |
Searching Parameters | ||||||
| Nugget | Sill | Range Major Axis (m) |
Range Minor Axis (m) |
Range Vertical Axis (m) |
Min.
Samples |
Max. Samples |
Max Samples per Hole | |||||
| 2 | 1 | 120 | 0 | -55 | 0.3 | 0.65 | 50 | 50 | 7.5 | 6 | 12 | 2 |
| 4 | 1 | 40 | 0 | 0 | 0.3 | 0.7 | 30 | 30 | 9 | 6 | 12 | 2 |
| 5 | 1 | 110 | 0 | -35 | 0.2 | 0.8 | 40 | 40 | 8.5 | 6 | 12 | 2 |
| 6 | 1 | 110 | 0 | -45 | 0.22 | 0.78 | 45 | 45 | 7 | 6 | 12 | 2 |
| 8 | 1 | 135 | 0 | -40 | 0.143 | 0.87 | 60 | 40 | 10 | 6 | 12 | 2 |
| 11 | 1 | 100 | 0 | -20 | 0.3 | 0.74 | 50 | 50 | 7 | 6 | 12 | 2 |
| 12 | 1 | 55 | 0 | 0 | 0.015 | 0.727 | 30 | 24 | 7.8 | 6 | 12 | 2 |
| 2 | 2 | 120 | 0 | -55 | 0.3 | 0.65 | 100 | 100 | 15 | 6 | 18 | 2 |
| 4 | 2 | 40 | 0 | 0 | 0.3 | 0.7 | 60 | 60 | 18 | 6 | 18 | 2 |
| 5 | 2 | 110 | 0 | -35 | 0.2 | 0.8 | 80 | 80 | 17 | 6 | 18 | 2 |
| 6 | 2 | 110 | 0 | -45 | 0.22 | 0.78 | 90 | 90 | 14 | 6 | 18 | 2 |
| 8 | 2 | 135 | 0 | -40 | 0.143 | 0.87 | 120 | 80 | 20 | 6 | 18 | 2 |
| 11 | 2 | 100 | 0 | -20 | 0.3 | 0.74 | 100 | 100 | 14 | 6 | 18 | 2 |
| 12 | 2 | 55 | 0 | 0 | 0.015 | 0.727 | 60 | 48 | 15.6 | 6 | 18 | 2 |
| 2 | 3 | 120 | 0 | -55 | 0.3 | 0.65 | 200 | 200 | 30 | 2 | 10 | 2 |
| 4 | 3 | 40 | 0 | 0 | 0.3 | 0.7 | 120 | 120 | 36 | 2 | 10 | 2 |
| 5 | 3 | 110 | 0 | -35 | 0.2 | 0.8 | 160 | 160 | 34 | 2 | 10 | 2 |
| 6 | 3 | 110 | 0 | -45 | 0.22 | 0.78 | 180 | 180 | 28 | 2 | 10 | 2 |
| 8 | 3 | 135 | 0 | -40 | 0.143 | 0.87 | 240 | 160 | 40 | 2 | 10 | 2 |
| 11 | 3 | 100 | 0 | -20 | 0.3 | 0.74 | 200 | 200 | 28 | 2 | 10 | 2 |
| 12 | 3 | 55 | 0 | 0 | 0.015 | 0.727 | 120 | 96 | 31.2 | 2 | 10 | 2 |
| San Francisco Project | 134 | May 1, 2026 |
| Goldgroup Mining Inc. |
Table 14.7
Applied Search Parameters for Ordinary Kriging Grade Interpolation for the La Chicharra Pit
| Rock Code(s) |
Pass | Az (°) |
Plunge (°) |
Dip (°) |
Variogram Parameters |
Searching Parameters | ||||||
| Nugget | Sill | Range Major Axis (m) |
Range Minor Axis (m) |
Range Vertical Axis (m) |
Min. Samples |
Max. Samples |
Max Samples per Hole | |||||
| 100 | 1 | 150 | 0 | -45 | 0.1 | 0.97 | 25 | 19 | 4 | 5 | 10 | 2 |
| 200 | 1 | 140 | 0 | -55 | 0.08 | 1.256 | 25 | 25 | 8 | 5 | 10 | 2 |
| 300 | 1 | 130 | 0 | -25 | 0.125 | 0.895 | 45 | 45 | 10 | 5 | 10 | 2 |
| 400 | 1 | 100 | 0 | -30 | 0.05 | 0.95 | 30 | 30 | 4 | 5 | 10 | 2 |
| 500 | 1 | 140 | 0 | -30 | 0.055 | 1.39 | 60 | 60 | 6 | 5 | 10 | 2 |
| 100 | 2 | 150 | 0 | -45 | 0.1 | 0.97 | 50 | 38 | 4 | 5 | 10 | 2 |
| 200 | 2 | 140 | 0 | -55 | 0.08 | 1.256 | 37.5 | 33 | 10 | 5 | 10 | 2 |
| 300 | 2 | 130 | 0 | -25 | 0.125 | 0.895 | 65 | 60 | 13 | 5 | 10 | 2 |
| 400 | 2 | 100 | 0 | -30 | 0.05 | 0.95 | 45 | 45 | 6 | 5 | 10 | 2 |
| 500 | 2 | 140 | 0 | -30 | 0.055 | 1.39 | 90 | 90 | 8 | 5 | 10 | 2 |
| 100 | 3 | 150 | 0 | -45 | 0.1 | 0.97 | 75 | 57 | 6 | 3 | 8 | 2 |
| 200 | 3 | 140 | 0 | -55 | 0.08 | 1.256 | 50 | 41 | 13 | 2 | 7 | 2 |
| 300 | 3 | 130 | 0 | -25 | 0.125 | 0.895 | 90 | 75 | 16 | 2 | 7 | 2 |
| 400 | 3 | 100 | 0 | -30 | 0.05 | 0.95 | 60 | 60 | 8 | 3 | 8 | 2 |
| 500 | 3 | 140 | 0 | -30 | 0.055 | 1.39 | 120 | 120 | 10 | 2 | 7 | 2 |
For the resource estimate in the San Francisco deposit, the interpolation process was relaxed to allow multiple domains to inform blocks on each interpolation run, because the remaining resources are predominantly gabbro (Rock Code 11).
For North Pit, block grades were estimated using the Inverse Distance cubed (ID3) method, in a single pass. In mineralization domains, with relatively thin, vein geometry, a spherical search with 120 m radius was used for sample selection. A minimum of two samples and maximum of 12 samples were used to inform a block, with a maximum of two samples per hole. In the surrounding wall rock domain, grade was estimated the ID3 estimation method, using a search ellipse with radii of 120 m by 120 m by 30 m, oriented along the dip of the mineralization (dip 18°, dip azimuth 25°, pitch 100°). A sample search strategy with minimum of two samples and maximum of 12 samples was used to inform a block, with a maximum of two samples per hole.
| 14.5.9 | Mineral Resource Classification |
Mineralized zones in the San Francisco Project have been classified as a mineral resource according to the CIM definitions. The mineralized zones display good geologic continuity, as demonstrated by the drill results.
| San Francisco Project | 135 | May 1, 2026 |
| Goldgroup Mining Inc. |
The categorization criteria applied for San Francisco and La Chicharra deposits to the resource estimates are as follows:
| · | Blocks within 20 m of a sample are considered measured, based upon a pass finding 3 drill holes with a maximum of 2 samples per hole. |
| · | Blocks between 20 m and 40 m from a sample are considered indicated, based upon a pass finding 2 drill holes with a maximum of 2 samples per hole. |
| · | Any blocks further than 40 m from a sample are considered inferred. |
For the North Pit, blocks in areas with a drill hole spacing of 50 m or less were considered for classification into Indicated category. Estimated blocks within 25 m from a drillhole and informed by at least two drill holes were initially selected, then a wireframe was manually modelled to retain contiguous patches of blocks where the conditions were met. The blocks retained inside the classification wireframe were classified in the Indicated category. The remaining estimated blocks were classified in the Inferred category.
| 14.5.10 | Block Model Validation |
The San Francisco, La Chicharra and North Pit block models were validated using three methods:
| 1. | Statistically – The gold grades of the 3-m composites grouped by domain were compared against the grades of the interpolated blocks. That comparison summarized in Table 14.8, indicates reasonable agreement between the composites grouped by domain and the grades of the interpolated blocks. |
| 2. | Trend Analysis – The interpolated block grades and the average grades of the 3-m composites were compared in swath plots at 50-m intervals in the east-west direction. The results, shown in Figures 14.4-14.7, show reasonable agreement. |
Table 14.8
San Francisco and La Chicharra 3 m Composites vs. Block Model Averages
| Deposit | Zone/Domain | Composites | Blocks | ||
| Count | Au g/t | Count | Au g/t | ||
| San Francisco Model | 2 | 793 | 0.24 | 32,486 | 0.23 |
| 4 | 19,373 | 0.31 | 599,865 | 0.31 | |
| 5 | 4,964 | 0.43 | 117,874 | 0.42 | |
| 8 | 175 | 0.25 | 7,967 | 0.20 | |
| 11 | 12,369 | 0.29 | 740,485 | 0.26 | |
| 12 | 1,025 | 0.17 | 66,465 | 0.16 | |
| Global | 38,699 | 0.32 | 1,565,142 | 0.29 | |
| La Chicharra Model | 100 | 414 | 0.46 | 12,984 | 0.41 |
| 200 | 1,043 | 0.38 | 39,398 | 0.36 | |
| 300 | 4,869 | 0.47 | 108,770 | 0.44 | |
| 400 | 2,524 | 0.35 | 80,404 | 0.36 | |
| 500 | 205 | 0.43 | 9,581 | 0.35 | |
| Global | 9,055 | 0.43 | 251,137 | 0.40 | |
| North Pit Model | Mineralization Lenses | 390 | 0.35 | 640,324 | 0.34 |
| Wall rock | 300 | 0.06 | 573,023 | 0.09 | |
| Global | 690 | 0.23 | 1,197,052 | 0.22 | |
| San Francisco Project | 136 | May 1, 2026 |
| Goldgroup Mining Inc. |
Figure 14.5
San Francisco Block Model Swath Plot
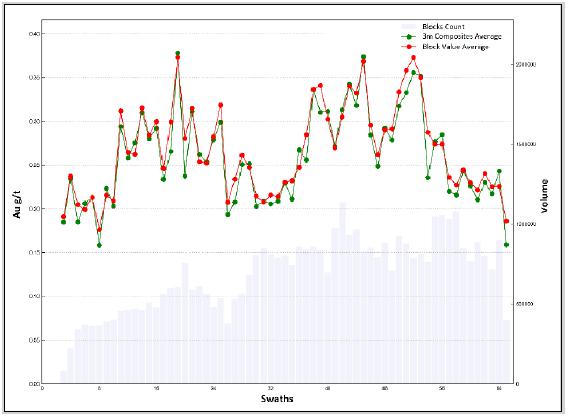
Figure 14.6
La Chicharra Block Model Swath Plot
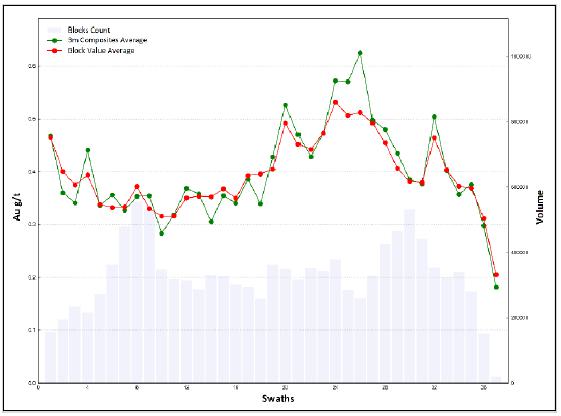
| San Francisco Project | 137 | May 1, 2026 |
| Goldgroup Mining Inc. |
Figure 14.7
North Pit Block Model Swath Plot
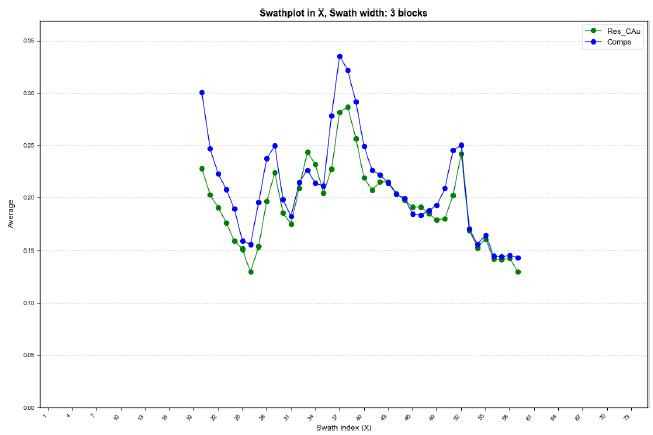
| 3. | Visually – Using Leapfrog Geo, Micon visually examined vertical sections, comparing the drill hole trace samples against the block model grade distribution, to ensure that the original sample grades and the block grades agree and that they are reasonably related in space. |
All three validation procedures gave satisfactory results, sufficient to conclude that the block model can be used with confidence for the estimation of resources and reserves.
| 14.5.11 | Resource Pit Optimization and Economic Parameters |
For the 2020 Magna block models, pit optimization studies were ran in order to estimate the resources. The gold price used for estimating 2020 mineral resources was US$ 1,500 per ounce. This procedure was used to satisfy the criterion that resources must have reasonable prospects of eventual economic extraction. For the San Francisco and La Chicharra pit areas the 2026 update comprised reviewing the models and material mined up to the point Molimentales ceased operations and it was decided to modify the 2020 parameters by adjusting costs with inflation, and change the gold price to US $3,500/oz. An updated open pit resource shell was generated and used for mineral resource reporting. Micon’s QPs recommend that Goldgroup updates the San Francisco and La Chicharra models to incorporate the latest geological information available.
The parameters used in the pit optimization are summarized in Table 14.9. The input operating parameters were derived from actual costs incurred during the San Francisco Project’s production period and escalated to 2026 US dollars using standard inflation indices.
Pit bench heights were set at 6 m (the block height used in the model), and slope angles were based on average overall slope angle of 50° and a minimum operating width of 20 m.
| San Francisco Project | 138 | May 1, 2026 |
| Goldgroup Mining Inc. |
Table 14.9
Pit Optimization Parameters* for the updated April 30, 2026 Mineral Resource Estimate for the San Francisco and La Chicharra Deposits
| Area | Costs | ||
| San Francisco Model | Description | Units | Amount |
| Waste mining cost OP | US$/t | 2.69 | |
| Ore mining cost OP | US$/t | 2.69 | |
| Process cost | US$/t | 5.1 | |
| G & A cost | US$/t | 1.0 | |
| Gold price | US$/oz | 3,500 | |
| Rock Densities and Recoveries | |||
| Name/code | Density (g/cm3) |
Recovery % | |
| Diorite (2) | 2.72 | 54.50 | |
| Gneiss (4) | 2.75 | 71.10 | |
| Granite (5) | 2.76 | 76.00 | |
| Schist (6) | 2.75 | 74.40 | |
| Lamprophyre Dike (8) | 2.76 | 54.50 | |
| Pegmatite (10) | 2.85 | 74.40 | |
| Gabbro (11) | 2.81 | 63.80 | |
| Conglomerate (12) | 2.00 | 64.50 | |
| General Recovery | 64.00 | ||
| La Chicharra Model | Costs | ||
| Description | Units | Amount | |
| Waste mining cost | US$/t | 2.69 | |
| Ore mining cost | US$/t | 2.69 | |
| Process cost | US$/t | 5.1 | |
| G & A cost | US$/t | 1.0 | |
| Gold price | US$/oz | 3,500 | |
| Rock Densities and Recoveries | |||
| Name/code | Density (g/cm3) |
Recovery % | |
| All Rock (100-500) | 2.9 | 78.00 | |
| General Recovery | 78.00 | ||
*Pit optimization parameters for metal prices and costs have been updated from those used in the August, 2020 Technical Report.
For the North Pit deposit, a pit optimization exercise was conducted, using a gold price of US$ 3,500 per ounce. This procedure was used to satisfy the criterion that resources must have reasonable prospects of eventual economic extraction. The parameters used in the pit optimization are summarized in Table 14.10. The costs inputs used were based on operating costs from 2020, but adjusted US dollar to 2026 inflationary indices. Same pit slope parameters as used for the San Francisco pit were assumed for the North Pit.
| San Francisco Project | 139 | May 1, 2026 |
| Goldgroup Mining Inc. |
Table 14.10
Pit Optimization Parameters for the April 30, 2026 Mineral Resource Estimate for the North Pit Deposit
| Area | Costs | ||
| North Pit Model | Description | Units | Amount |
| Waste mining cost OP | US$/t | 2.69 | |
| Ore mining cost OP | US$/t | 2.69 | |
| Process cost | US$/t | 5.1 | |
| G & A cost | US$/t | 1.0 | |
| Gold price | US$/oz | 3,500 | |
| Rock Densities and Recoveries | |||
| Name/code | Density (g/cm3) | Recovery % | |
| Diorite | 2.72 | 54.50 | |
| Gneiss | 2.75 | 71.10 | |
| Granite | 2.76 | 76.00 | |
| Schist | 2.75 | 74.40 | |
| Lamprophyre Dike | 2.76 | 54.50 | |
| Pegmatite | 2.85 | 74.40 | |
| Gabbro | 2.81 | 63.80 | |
| Conglomerate | 2.00 | 64.50 | |
| General Recovery | 64.00 | ||
As can be seen from Table 14.10, not only do the various rock codes have a different density, but the metallurgical recovery varies with the rock code as well.
Previous drilling programs have outlined a number of lenses of higher-grade mineralization beneath the south-wall of the San Francisco pit. Alio investigated these lenses and developed a drift on one of them in 2015-2016 with the objective of mining this material using underground cut and fill methods. Alio later shelved the idea of conducting underground mining in favour of conducting a pit pushback in this area. Magna revived the underground scenario for mining the higher-grade lenses when it operated the mine. However, the current mineral resource estimate is based upon conducting a pit pushback to recover this material, thus no underground resources have been reported.
At North Pit, an average recovery of 64% was used for all the lithological units (Table 14.9).
| 14.5.12 | Mineral Resource Statement |
Micon recommends that Goldgroup use the April 30, 2026 mineral resource estimate contained in Table 14.1 as the stated mineral resource estimate for the San Francisco Project (San Francisco, La Chicharra, and North Pit deposits), as this estimate recognizes the use of 0.12 g/t gold and 0.10 g/t gold, respectively, as the open pit cut-off grades, at which the mineralization would meet the criterion of potential economic extraction.
| San Francisco Project | 140 | May 1, 2026 |
| Goldgroup Mining Inc. |
| 14.6 | San Francisco Project Sensitivity Analysis |
Micon’s QP examined the grade sensitivity of the open pit mineral resources at various gold cut-off grades. Micon’s QP has reviewed the cut-offs used in the sensitivity analysis, and it is the opinion of Micon’s QP that they meet the test for reasonable prospects for eventual economic extraction at varying metal prices and other underlying parameters. Table 14.11, Table 14.12 and Table 14.13 show the sensitivity analysis for the San Francisco pit, the La Chicharra pit and the North pit individually. Table 14.14 shows the sensitivity analysis for the combined pits. Figures 14.8, Figure 14.8 and Figure 14.9 graphically show the sensitivity analysis for the San Francisco pit, the La Chicharra pit and the North pit individually. Figure 14.10 graphically shows the sensitivity analysis for the combined pits.
Table 14.11
Sensitivity Analysis Tabulation for the San Francisco Pit
| Cut-off Grade (g/t) | Tonnage (tonnes) | Gold Grade (g/t) | Gold (ounces) |
| 0.05 | 99,911,229 | 0.34 | 1,078,099 |
| 0.06 | 96,490,344 | 0.35 | 1,072,103 |
| 0.07 | 93,081,266 | 0.36 | 1,065,039 |
| 0.08 | 89,871,066 | 0.37 | 1,057,353 |
| 0.09 | 86,787,632 | 0.38 | 1,048,981 |
| 0.1 | 83,873,307 | 0.39 | 1,040,133 |
| 0.11 | 81,080,516 | 0.40 | 1,030,748 |
| 0.12 | 78,311,427 | 0.41 | 1,020,554 |
| 0.13 | 75,540,383 | 0.42 | 1,009,458 |
| 0.14 | 72,798,869 | 0.43 | 997,607 |
| 0.15 | 70,061,924 | 0.44 | 984,888 |
| 0.16 | 67,399,133 | 0.45 | 971,670 |
| 0.17 | 64,786,116 | 0.46 | 957,848 |
| 0.18 | 62,309,150 | 0.47 | 943,950 |
| 0.19 | 59,924,150 | 0.48 | 929,805 |
| 0.2 | 57,651,645 | 0.49 | 915,594 |
| 0.25 | 47,481,990 | 0.55 | 842,465 |
| 0.3 | 38,959,532 | 0.61 | 767,470 |
| 0.35 | 31,872,564 | 0.68 | 693,726 |
| 0.4 | 26,314,445 | 0.74 | 626,950 |
| 0.45 | 21,938,159 | 0.80 | 567,315 |
| 0.5 | 18,318,384 | 0.87 | 512,222 |
| 0.6 | 13,060,541 | 1.00 | 419,928 |
| 0.7 | 9,496,061 | 1.13 | 345,886 |
| 0.8 | 7,016,277 | 1.27 | 286,369 |
| 0.9 | 5,337,659 | 1.40 | 240,702 |
| 1 | 4,096,107 | 1.54 | 202,914 |
| San Francisco Project | 141 | May 1, 2026 |
| Goldgroup Mining Inc. |
Table 14.12
Sensitivity Analysis Tabulation for the La Chicharra Pit
| Cut-off Grade (g/t) | Tonnage (tonnes) | Gold Grade (g/t) | Gold (ounces) |
| 0.05 | 24,152,940 | 0.31 | 242,737 |
| 0.06 | 23,121,120 | 0.32 | 240,929 |
| 0.07 | 22,171,950 | 0.34 | 238,963 |
| 0.08 | 21,276,285 | 0.35 | 236,820 |
| 0.09 | 20,444,565 | 0.36 | 234,562 |
| 0.1 | 19,652,430 | 0.37 | 232,155 |
| 0.11 | 18,850,290 | 0.38 | 229,459 |
| 0.12 | 18,097,305 | 0.39 | 226,690 |
| 0.13 | 17,393,475 | 0.40 | 223,875 |
| 0.14 | 16,720,530 | 0.41 | 220,967 |
| 0.15 | 16,078,035 | 0.42 | 217,983 |
| 0.16 | 15,439,455 | 0.43 | 214,810 |
| 0.17 | 14,855,250 | 0.44 | 211,717 |
| 0.18 | 14,271,915 | 0.45 | 208,449 |
| 0.19 | 13,705,980 | 0.47 | 205,092 |
| 0.2 | 13,164,405 | 0.48 | 201,706 |
| 0.25 | 10,726,665 | 0.53 | 184,180 |
| 0.3 | 8,857,035 | 0.59 | 167,733 |
| 0.35 | 7,286,250 | 0.65 | 151,387 |
| 0.4 | 6,041,715 | 0.70 | 136,412 |
| 0.45 | 5,036,430 | 0.76 | 122,737 |
| 0.5 | 4,217,325 | 0.81 | 110,261 |
| 0.6 | 3,037,170 | 0.92 | 89,551 |
| 0.7 | 2,191,095 | 1.02 | 71,927 |
| 0.8 | 1,532,940 | 1.14 | 56,152 |
| 0.9 | 1,124,475 | 1.25 | 45,035 |
| 1 | 805,620 | 1.36 | 35,331 |
Table 14.13
Sensitivity Analysis Tabulation for the North Pit
| Cut-off Grade (g/t) | Tonnage (tonnes) | Gold Grade (g/t) | Gold (ounces) |
| 0.05 | 15,873,163 | 0.24 | 121,998 |
| 0.06 | 14,725,216 | 0.25 | 119,991 |
| 0.07 | 14,020,371 | 0.26 | 118,517 |
| 0.08 | 13,394,339 | 0.27 | 117,010 |
| 0.09 | 12,753,111 | 0.28 | 115,250 |
| 0.1 | 12,080,948 | 0.29 | 113,214 |
| 0.11 | 11,528,450 | 0.30 | 111,344 |
| 0.12 | 10,890,626 | 0.31 | 108,991 |
| 0.13 | 10,172,271 | 0.32 | 106,098 |
| 0.14 | 9,450,692 | 0.34 | 102,965 |
| 0.15 | 8,602,282 | 0.36 | 99,013 |
| San Francisco Project | 142 | May 1, 2026 |
| Goldgroup Mining Inc. |
| Cut-off Grade (g/t) | Tonnage (tonnes) | Gold Grade (g/t) | Gold (ounces) |
| 0.16 | 7,924,164 | 0.38 | 95,640 |
| 0.17 | 7,431,084 | 0.39 | 93,025 |
| 0.18 | 6,978,623 | 0.40 | 90,481 |
| 0.19 | 6,591,836 | 0.42 | 88,182 |
| 0.2 | 6,267,685 | 0.43 | 86,152 |
| 0.25 | 4,779,311 | 0.49 | 75,418 |
| 0.3 | 3,539,978 | 0.57 | 64,547 |
| 0.35 | 2,797,564 | 0.63 | 56,837 |
| 0.4 | 2,066,022 | 0.72 | 47,992 |
| 0.45 | 1,735,825 | 0.78 | 43,499 |
| 0.5 | 1,441,511 | 0.84 | 39,052 |
| 0.6 | 1,014,728 | 0.97 | 31,574 |
| 0.7 | 749,270 | 1.08 | 26,027 |
| 0.8 | 583,871 | 1.18 | 22,062 |
| 0.9 | 462,979 | 1.26 | 18,772 |
| 1 | 350,433 | 1.36 | 15,324 |
Table 14.14
Sensitivity Analysis Tabulation for the San Francisco All Pits Combined
| Cut-off Grade (g/t) | Tonnage (tonnes) | Gold Grade (g/t) | Gold (ounces) |
| 0.05 | 139,937,332 | 0.32 | 1,442,834 |
| 0.06 | 134,336,680 | 0.33 | 1,433,023 |
| 0.07 | 129,273,586 | 0.34 | 1,422,518 |
| 0.08 | 124,541,690 | 0.35 | 1,411,184 |
| 0.09 | 119,985,308 | 0.36 | 1,398,794 |
| 0.1 | 115,606,685 | 0.37 | 1,385,502 |
| 0.11 | 111,459,256 | 0.38 | 1,371,551 |
| 0.12 | 107,299,358 | 0.39 | 1,356,236 |
| 0.13 | 103,106,129 | 0.40 | 1,339,431 |
| 0.14 | 98,970,090 | 0.42 | 1,321,539 |
| 0.15 | 94,742,241 | 0.43 | 1,301,884 |
| 0.16 | 90,762,752 | 0.44 | 1,282,120 |
| 0.17 | 87,072,450 | 0.45 | 1,262,590 |
| 0.18 | 83,559,688 | 0.46 | 1,242,879 |
| 0.19 | 80,221,966 | 0.47 | 1,223,080 |
| 0.2 | 77,083,735 | 0.49 | 1,203,452 |
| 0.25 | 62,987,966 | 0.54 | 1,102,063 |
| 0.3 | 51,356,544 | 0.61 | 999,750 |
| 0.35 | 41,956,378 | 0.67 | 901,950 |
| 0.4 | 34,422,182 | 0.73 | 811,354 |
| 0.45 | 28,710,413 | 0.79 | 733,551 |
| 0.5 | 23,977,220 | 0.86 | 661,535 |
| 0.6 | 17,112,439 | 0.98 | 541,053 |
| 0.7 | 12,436,426 | 1.11 | 443,840 |
| 0.8 | 9,133,088 | 1.24 | 364,583 |
| San Francisco Project | 143 | May 1, 2026 |
| Goldgroup Mining Inc. |
| Cut-off Grade (g/t) | Tonnage (tonnes) | Gold Grade (g/t) | Gold (ounces) |
| 0.9 | 6,925,112 | 1.37 | 304,510 |
| 1 | 5,252,160 | 1.50 | 253,568 |
Figure 14.8
Sensitivity Analysis Graph for the San Francisco Pit
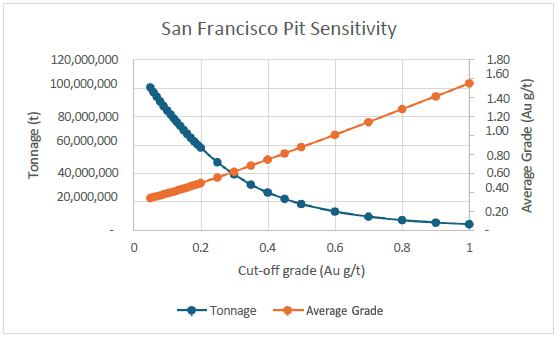
Figure 14.9
Sensitivity Analysis Graph for the La Chicharra Pit
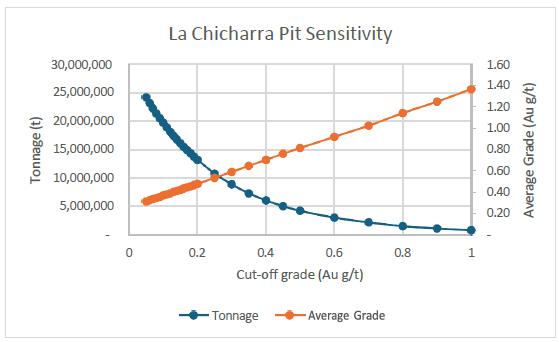
| San Francisco Project | 144 | May 1, 2026 |
| Goldgroup Mining Inc. |
Figure 14.10
Sensitivity Analysis Graph for the North Pit
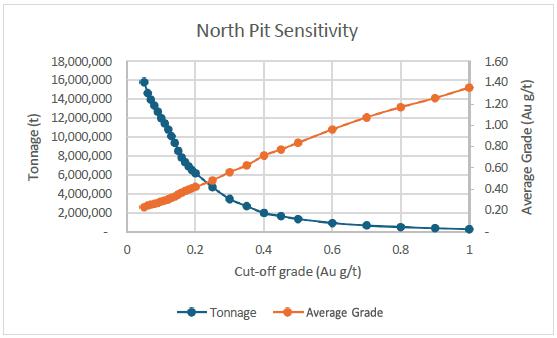
Figure 14.11
Sensitivity Analysis Graph for the San Francisco Project All Pits Combined
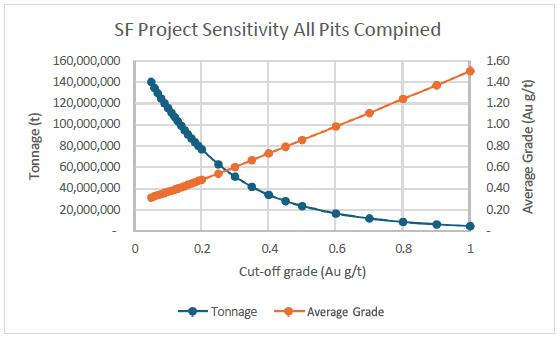
| San Francisco Project | 145 | May 1, 2026 |
| Goldgroup Mining Inc. |
| 14.7 | San Francisco Project Potential Resources |
Scattered exploration drilling east of the San Francisco Pit, in what has been termed the El LIano exploration target area, has indicated that the mineralization identified and mined in the pit could potentially continue to the east towards Mexican State Highway 15 (Pan American Highway), which links Hermosillo to Nogales in the American-Mexican border.
While the drilling at this time is too widely spaced to infer continuity between the individual mineralized intersections identified in the drill holes, the general intersections are similar to those mined in the San Francisco Pit and generally lie in the easterly strike direction of mineralization located in the San Francisco Pit. Therefore, Micon’s QPs believe that the El Llano exploration target area has the potential to host a mineralized zone similar to that found in the San Francisco Pit.
Table 14.15 summarizes Micon’s QP estimated range for the potential mineralization in the El Llano exploration target area.
Table 14.15
Summary of the Estimated Range for the Potential Mineralization in the El Llano Exploration Target Area
| Area | Potential Mineral Target Range* | |||||
| Lower Target Range | Higher Target Range | |||||
| Tonnage (Mt) | Grade (Au g/t) | Ounces Gold (x 1000) | Tonnage (Mt) | Grade (Au g/t) | Ounces Gold (x 1,000) | |
| El Llano Exploration Target Area | 40 | 0.61 | 788 | 78 | 0.38 | 960 |
*Note:
| 1. | The estimated potential is based upon the widespread drilling in the El Llano Exploration Target Area east of the existing San Francisco Pit which could host the eastern extension of the mineralization found in the pit. | |
| 2. | The potential quantity and grade are conceptual in nature, and there has been insufficient exploration to define a mineral resource and that it is uncertain if further exploration will result in the target being delineated as a mineral resource. |
Figure 14.12 shows the location of the EI LIano Exploration Target Area.
Figure 14.12
El LIano Exploration Target Area
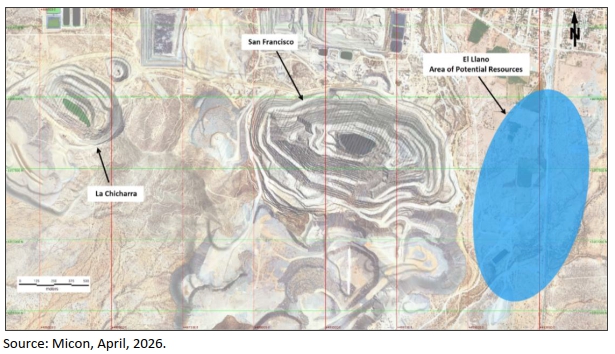
| San Francisco Project | 146 | May 1, 2026 |
| Goldgroup Mining Inc. |
TECHNICAL REPORT SECTIONS NOT REQUIRED
The following sections which form part of the NI 43-101 reporting requirements for advanced projects are not relevant to the Technical Report.
15 MINERAL RESERVE ESTIMATES
16 MINING METHODS
17 RECOVERY METHODS
18 PROJECT INFRASTRUCTURE
19 MARKET STUDIES AND CONTRACTS
20 ENVIRONMENTAL STUDIES, PERMITTING AND SOCIAL OR COMMUNITY IMPACT
21 CAPITAL AND OPERATING COSTS
22 ECONOMIC ANALYSIS
| San Francisco Project | 147 | May 1, 2026 |
| Goldgroup Mining Inc. |
23 ADJACENT PROPERTIES
The San Francisco property exists within the Sierra Madre Occidental metallogenic province and is known to host a number of separate zones or showings of anomalous gold mineralization. There are other metallic mineral deposits in the area, but very little information is available on those properties. There are no immediately adjacent properties which directly affect the interpretation and evaluation of the mineralization or anomalies found at San Francisco. However, the 1995 San Francisco Property Reserve and Resource document by Mine Development Associates of Reno, Nevada, listed a number of exploration possibilities in the immediate area of the mine that are not on the San Francisco property.
Among the targets which remain is the bedrock area surrounding the Arroyo La Perra, a placer deposit located approximately 2 km northwest of the San Francisco pit. The 1995 report mentions that seven holes had been drilled in bedrock to that point and that one of the holes intersected 8 m of 1.6 g/t gold at 42.5 m down-hole, while another intersected 18 m of 0.422 g/t gold at 4 m down-hole. Other targets mentioned with fair to good exploration potential for the discovery of significant gold deposits were La Desconocida, Casa de Piedras Oeste and La Trinchera, all of which are located between 2 km to 5 km northwest of the San Francisco pit.
Micon’s QP has not verified the information regarding the adjacent mineral deposits and showings described above that are outside the immediate area of the San Francisco and La Chicharra pits. The information contained in this section of the report, which was originally provided by Timmins/Alio, is not necessarily indicative of the mineralization at the San Francisco Project.
| San Francisco Project | 148 | May 1, 2026 |
| Goldgroup Mining Inc. |
24 OTHER RELEVANT DATA AND INFORMATION
This section discusses previous mining, processing and environmental aspects of the San Francisco Project which was an operating mine until the previous operator went into insolvency. The majority of the discussions were extracted from the previous 2020 Micon Technical Report and updated where necessary.
| 24.1 | Mining Methods |
Mining at the San Francisco and La Chicharra Pits is conducted by a contractor, using open pit mining methods. At the San Francisco Pit, a small underground mine was exploited during the second half of 2020 in order to accelerate cash flow by targeting some higher-grade mineralization in the block model.
| 24.1.1 | Mining Production to Date |
Alio drew material from the stockpiles intermittently from 2014. Routine processing of the stockpile material began at the end of 2018, when production from the open pits ceased, and continued through to December, 2019. At the beginning of 2020, operations were solely focused on recovery of the residual inventory ounces from the heap leach piles.
In June, 2020, Magna began to reprocess the low-grade stockpile, as well as begin re-starting mining from the La Chicharra and San Francisco pits.
Historical production from the San Francisco Project is summarized in Table 6.2 (1996 to 2002) and Tables 6.3 and 6.4 (2010 to 2019), within Section 6.3 of this Technical Report. Table 16.1 summarizes production from January, 2019 to the end of July, 2020, by quarter. Table 16.2 summarizes the material shipped from the stockpile to the heap leach pads by Alio and Magna from January, 2019 to the end of July, 2020, by quarter.
| 24.1.2 | Open Pit Mine Design |
| 24.1.2.1 | Geotechnical Studies and Slope Design Criteria |
The previous owners of the property, Geomaque de Mexico, retained Golder Associates (Golder) to conduct a geotechnical study on the San Francisco pit in December, 1996. Golder’s scope of work was to carry out site investigations, testing and analysis to develop slope angle recommendations for the pit design.
The recommended overall slope angles ranged from 37° for single 6 m benches along the northeast facing slopes, to a maximum of 56° for double-benching in schist units. Golder presented a table of recommended inter-ramp slope angles and catch bench widths to achieve the recommended overall slope angles.
The pit designs for the San Francisco and La Chicharra pits were completed using Golder’s data as the basis and pit wall angles measured to compare with the recommended maximum angles. The pit wall angles were found not to exceed recommended inter-ramp angles, nor overall pit wall angles.
| San Francisco Project | 149 | May 1, 2026 |
| Goldgroup Mining Inc. |
Examples of the slope wall angles on the north and south walls of the San Francisco Pit are illustrated in Figure 24.1. Examples of the slope wall angles on the south and southeast walls of the La Chicharra Pit are illustrated in Figure 24.2.
Figure 24.1
Pit Wall Angle Measurements: San Francisco Pit
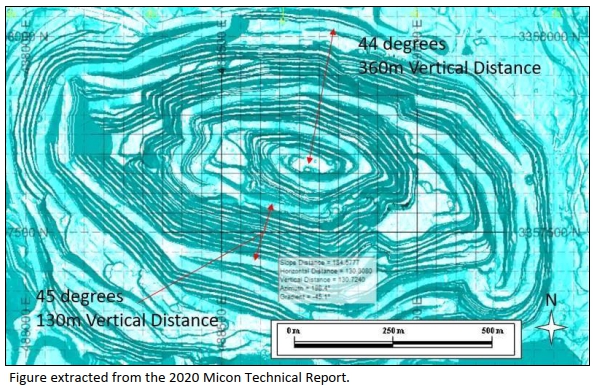
Figure 24.2
Pit Wall Angle Measurements: La Chicharra Pit
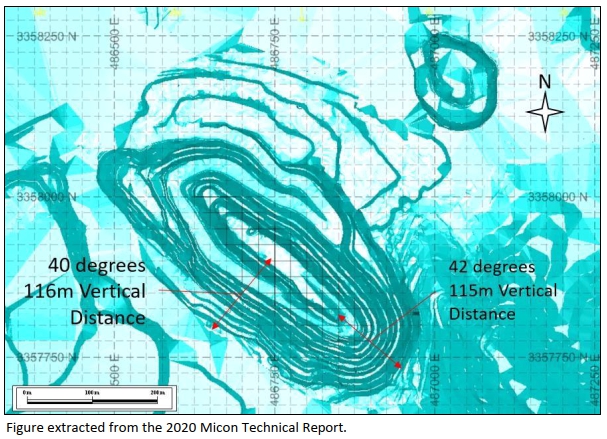
| San Francisco Project | 150 | May 1, 2026 |
| Goldgroup Mining Inc. |
In July, 2012, Timmins received the results of a new geotechnical analysis of the pit that it had commissioned from Call & Nicholas, Inc. (CNI).
The purpose of the study conducted by CNI was:
| 1. | To determine optimum inter-ramp slope angles and bench design parameters for the final San Francisco pit design. |
| 2. | To identify and analyse any potential major instability that would represent a significant cost or interference to the mine operations. |
| 3. | To provide recommendations for slope management over the life of the mine. |
Stability analyses included bench scale Backbreak analysis, from which the expected distribution of bench face angles and reliability schedules were developed. The Backbreak analysis relied on a cell-mapping program conducted along existing pit benches. Average and minimum bench face angles for individual cells were recorded concurrently with the mapping. The bench face angle database confirmed the pit wall geometries that were being achieved at San Francisco. Discrete faults with lengths in excess of 40 m were analysed to determine their potential for forming viable failure geometries along final pit walls.
The inter-ramp slope angles were determined for static seismic conditions. The impact of an earthquake on rock slope stability is considered minimal. The reported slope angles are also based on depressurized pit slopes.
| 24.1.2.2 | Impact of Groundwater on Slope Stability |
CNI’s recommended slope angles assume adequately drained (depressurized) slopes. The Backbreak analysis assumed depressurized conditions on mine benches, and inter-ramp stability analyses were performed for both saturated and depressurized conditions.
Preliminary observations suggest that the final pit walls may be relatively free raining, precluding the development of any excessive pore pressure buildup. It appears that draining will occur mostly through major faults and the more fractured ground surrounding these faults. This assumption should be confirmed once data are available from the piezometer monitoring and from the water seepage record for the pit wall, as the pit deepens.
| 24.1.2.3 | 2016 Southwall Stability |
In December, 2016, the south wall at the San Francisco pit was affected by a transversal failure which could potentially compromise the mining operations in the area.
In March, 2017, Alio started a monitoring program with the assistance of Ground Pro, in order to determinate, in real time, what is occurring in the area of the failure and the extent of the deformation occurring after blast events and rainfall, to identify and determine the extent of the potential risk to the mining operations within the San Francisco pit.
As of the date of this report, there appears to be no further movement in the area of the December, 2016 transversal failure.
| San Francisco Project | 151 | May 1, 2026 |
| Goldgroup Mining Inc. |
| 24.1.2.4 | Hydrological Considerations |
During its earlier 2017 site inspection, Micon observed that the existing pit walls were generally dry, with a few minor seepages along shear zones.
At the end of 2010, a hydrogeological study was conducted by Investigación y Desarrollo de Acuíferos y Ambiente (IDEAS) around the pit, to evaluate the hydrological regime in this area. A number of piezometers were installed to monitor the water flow surrounding the pit (Figure 16.3).
As of August, 2020 there were no report of water infiltration at either the San Francisco or the La Chicharra open pits. As of the December, 2025, Micon site visit both the San Francisco and La Chicharra pit walls were observed to be dry, there was water in the pit bottoms but the majority of this is due to accumulation of water from the rains during the rainy season.
Figure 24.3
Piezometer (PFP-01A) Installed to Monitor Water Flow Surrounding the Pit
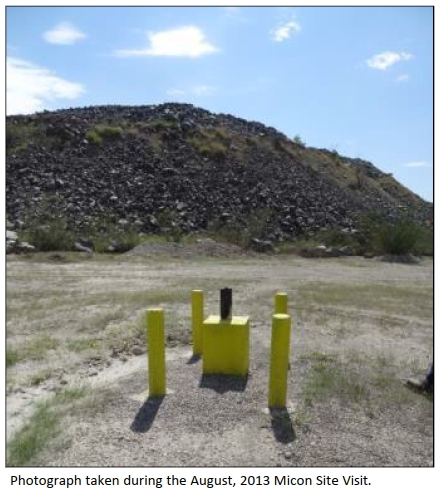
| 24.1.3 | Waste Rock Management |
Existing waste rock dumps are located to the south of the San Francisco open pit, close to the pit rim and cannot be extended to the north. They are also limited to the east by a property boundary and to the west by the natural hills. Accordingly, the existing dumps will be extended further south, where adequate space does exist.
| San Francisco Project | 152 | May 1, 2026 |
| Goldgroup Mining Inc. |
Previously, with the expansion of the reserves, additional waste dump volume was required and a site located northwest of the San Francisco pit was identified that would contain the majority of waste rock produced during the mine life.
The La Chicharra waste dumps are located to the south-southwest of the pit and there is currently room to expand these to the west and south.
| 24.2 | Open Pit Mine Operations |
Prior mining activities have been conducted by the contractor, Peal Mexico, S.A. de C.V., of Navojoa, Mexico. The contractor was obliged to supply and maintain the appropriate principal and auxiliary mining equipment and personnel required to produce the tonnage mandated by the prior companies, in accordance with the mining plan.
Previous operators provided contract supervision, geology, engineering and planning and survey services, using their own employees.
Figure 24.4 illustrates the relationship between the open-pits, waste piles, stockpiles and heap leach pads at the San Franciso Project.
Figure 24.4
Relationship between the San Francisco and La Chicharra Pits, Leach Pads, Waste Piles and Other Infrastructure 2017-Present
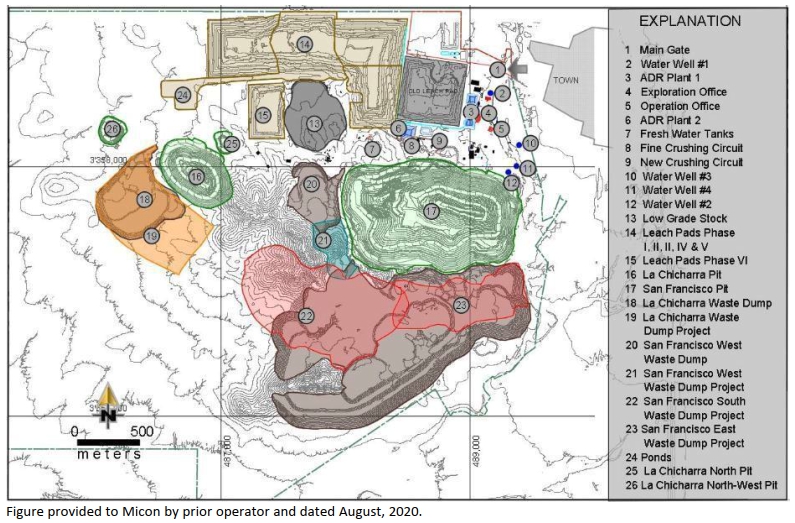
| San Francisco Project | 153 | May 1, 2026 |
| Goldgroup Mining Inc. |
| 24.3 | Underground Operations |
The underground development and mining occurred during the second half of 2020. The underground mine will be accessed through three portals installed in the pit wall at the 640 m, 632 m and 604 m elevations. The 632 m portal and development of that level was conducted in 2015. At the time of this 2026 Technical Report, Micon’s QPs were informed that this material will be extracted via a pushback of the south wall of the pit instead of any further underground mining.
| 24.4 | Recovery Methods |
| 24.4.1 | Processing Description |
The process used at the mine comprises multi-stage crushing and screening to 100% passing 9.5 mm, conveying and stacking of crushed material onto a heap leach pad, cyanide heap leaching and gold recovery from the pregnant solution using carbon columns, Zadra type elution, elecrowinning and smelting to produce a doré product containing over 90% precious metals.
| 24.4.1.1 | Crushing and Conveying |
Mined ore is crushed using two crushing and screening circuits. Crushing circuit 1 is designed to deliver 16,000 t/d of crushed material to the leach pads, but typically operates at 15,000 t/d. The second, newer circuit can process an additional 7,000 t/d for a total current crushing operating rate of 22,000 t/d.
Circuit 1 includes one jaw crusher, a 6,000-t capacity coarse ore stockpile, two secondary crushers, three tertiary crushers, multi-deck vibrating screens, vibrating feeders and conveyors.
Circuit 2 comprises one jaw crusher, two secondary crushers, three tertiary crushers, screens and conveyors.
The minus 9.5 mm undersize product from the screens is delivered to the leach pad using overland conveyors.
| 24.4.1.2 | Leaching |
Product from the crushing plants is transported to the leach pad on overland conveyors and deposited on the pad with a stacker, forming 8 m to 12 m high lifts. A bulldozer is used to level the surface of each lift. The irrigation pipelines are then installed to distribute the leach solution over the entire surface of the lift. The design primary leach time is reported to be 180 days although, in practice, this can be extended when leaching a lift placed on top of a previous lift.
The leach pad has been constructed over the years as 6 different phases, based on the permits granted by the Mexican Environmental Agency (PROFEPA, Procuraduría Federal de Protección al Ambiente) Table 24.1 summarizes the leach pad phases, based upon the permits acquired.
| San Francisco Project | 154 | May 1, 2026 |
| Goldgroup Mining Inc. |
Table 24.1
Summary of the Leach Pad Phases Based Upon the Permits Acquired for the San Francisco Mine
| # Phase | Duration | Area | Nominal
Capacity |
Capacity to date |
Status |
| 1 & 2 | Nov. 2009 to Nov. 2013 | 36 ha | 26 Mt | 25 Mt | Releached |
| 3 | Nov. 2013 to Aug. 2015 | 25 ha | 18 Mt | 18 Mt | On Irrigation |
| 4 | Aug. 2015 to Oct. 2016 | 16 ha | 12 Mt | 12 Mt | On Irrigation |
| 5 | Oct. 2016 to June 2017 | 12 ha | 9 Mt | 7 Mt | On Irrigation |
| 6 | June 2017 to Oct. 2020 | 17 ha | 12 Mt | 5 Mt | Depositing Ore |
| Total | 77 Mt | 67 Mt |
Table taken from the August, 2020, Technical Report, and originally provided by Magna.
The leach solution fed to the heap consists of 0.05% sodium cyanide, with lime addition to obtain a pH of between 10.5 to 11. The solution percolates to the bottom of the lift and flows to the channel that carries the solution to the pregnant solution storage pond, from which it is pumped to the adsorption, desorption and recovery (ADR) plants.
Barren solution exiting the two ADR plants flows to the barren solution storage pond, where fresh water and sodium cyanide are added before being pumped back to the leach pad.
At the time of this 2026 Technical Report no leaching was occurring on the leach pads.
| 24.4.1.3 | Adsorption/Desorption/Recovery Plants |
Pregnant leach solution is fed to two ADR plants. The first adsorption plant consists of 2 parallel lines of carbon columns, each with 5 tanks in series, through which the carbon is advanced counter-currently to the solution flow. One line of columns contains approximately 2.0 t of carbon, and the other 2.5 t. Gold is adsorbed on the carbon to a concentration of approximately 5,000 g/t. Desorption of the carbon is achieved in a Zadra type elution circuit. Gold is recovered by an electrowinning circuit comprising stainless steel electrodes in a stainless-steel electrolytic cell.
Installation of a new line of carbon columns (second ADR plant) with 5 tanks each containing approximately 6 t of carbon, and a design flow of 3,500 USGM (805 m3/h), was completed in August, 2011, to increase the production capacity.
A new stripping circuit with a capacity of 5.5 t of carbon was added to the process in March, 2017.
In March, 2017, a process was initiated to separately deliver the drainage solution from old leach pads (Phases 1 and 2) to an intermediate solution pond, and to continually recirculate this solution until it is enriched enough to be sent to the ADR circuit (minimum average solution grade of 0.13 ppm Au). Additional equipment and piping were added in order to process the 8,000 m3/d of solution from the old leach pads.
An additional carbon tank with a capacity of 6 t of activated carbon was added for capturing the gold from the old leach pads.
| San Francisco Project | 155 | May 1, 2026 |
| Goldgroup Mining Inc. |
| 24.5 | Project Infrastructure |
Figure 24.4 shows the existing San Francisco mine site layout, with the pits, leach pads, waste storage expansion, the low-grade ore stockpile and the area around the La Chicharra pit.
| 24.5.1 | Offices, Workshops and Stores |
Office space is provided in a structure of approximately 450 m2, located southeast of the ADR plant. The building has adequate working space for the on-site mine administration and also provides basic catering and ablution facilities.
A vehicle workshop, south of the ADR plant and north of the open pit, occupies more than 660 m2 and is available for maintenance of the off-road haul trucks, excavators and ancillary vehicles used in the open pit mining operation.
A general warehouse of approximately 200 m2, located north of the ADR plant, accommodates process reagents and mechanical spares. Bulk lime for the heap leach process is stored in a silo near the crushing plant.
A new building was completed in December, 2010, to house the exploration offices. This office space is approximately 150 m2, and provides adequate working space and basic ablution facilities. It is located east of the original ADR plant.
A 1,500 m2 core and sample storage facility, north of the ADR plant, was completed in 2013. This facility provides permanent and secure storage for both the diamond drill core and pulp samples, as well as hosting the new sample preparation facilities for the exploration department. The rear half of the building is currently being used as a secure storage facility for reagents used in the ADR plants.
A 1,500 m2 general warehouse expansion, located north of the ADR plant, was completed in January, 2014. The facility accommodates mechanical spares and other consumables.
| 24.5.2 | Electrical Power Supply |
Electrical power is delivered through a 33 kV overhead line from the utility company, Comisión Federal de Electricidad (CFE). From the main metering point, the power is distributed to the crushing and screening plant and other site infrastructure at 480/220/110 V. However, power for the new crushing circuit is supplied by diesel generators with approximately 2 MW of capacity. At the crushing and screening plant, separate transformers feed the principal equipment. Installed transformer capacity is summarized in Table 24.2.
| San Francisco Project | 156 | May 1, 2026 |
| Goldgroup Mining Inc. |
Table 24.2
Summary of the Installed Transformer Capacity
| Area of Transformer | KVA |
| Primary Crushing (Gyratory Crusher) | 1,000 |
| Fine Crushing Circuit | 3,000 |
| New Crushing Circuit | 1,500 |
| Overland & grasshoppers conveyors | 5,500 |
| Leach solution ponds | 1,500 |
| Pumping Substation | 2,500 |
| ADR Plant | 1,000 |
| Assay & Met Laboratory | 300 |
| Exploration Assay Laboratory | 500 |
| Main office | 75 |
| Exploration office | 45 |
| Water well #1 | 75 |
| Water well #2 | 45 |
| Water well #3 | 150 |
| Water well #4 | 225 |
| Overall lighting | 50 |
| Mining contractor office | 75 |
| Mining contractor workshop | 75 |
| Mechanical maintenance workshop | 75 |
| Washer truck area | 75 |
| Geology warehouse | 75 |
| Liquid cyanide facility | 30 |
| Maintenance contractor office (Inpromine) | 150 |
| Main warehouse | 15 |
| Total | 18,035 |
Table taken from the 2020 Micon Technical Report.
The electrical power supply is sufficient for the full production rate of 22,000 t/d of ore, with some spare capacity.
| 24.5.3 | Water Supply |
At full production capacity, the demand of fresh water is 3,296 m3/d, of which 1,841 m3/d are for the leach area and ADR plants, 988 m3/d for the irrigation of the roads inside both pits, 136 m3/d for crushing and offices, 58 m3/d for the mining contractor office and workshop and 273 m3/d for the irrigation of community roads.
Comisión Nacional del Agua (CONAGUA) has authorized 4 concession titles to exploit and use national water for a grand total of 1,900,000 m3/year. Alio has built and commissioned 4 water wells, with the following capacities:
| · | Water well #1: 300,000 m3/year. |
| · | Water well #2: 300,000 m3/year. |
| · | Water well #3: 400,000 m3/year. |
| · | Water well #4: 900,000 m3/year. |
| San Francisco Project | 157 | May 1, 2026 |
| Goldgroup Mining Inc. |
All fresh water is conducted through pipelines and distributed to each point of usage, as shown in Figure 24.5.
A new water tank and a pressure pump were installed to comply with regulation NOM–002–STPS of the Secretaría del Trabajo y Previsión Social (STPS) regarding the prevention of and protection against fire in the workplace, which states that water pressure for fire control should be at least 7 kg/cm2.
Figure 24.5
Fresh Water Distribution Network at the San Francisco Mine
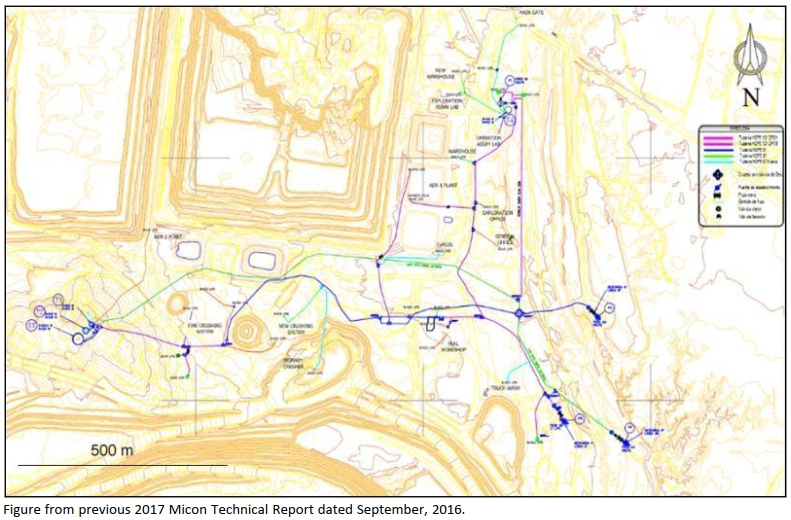
| 24.6 | Environmental Studies, Permitting and Social or Community Impact |
| 24.6.1 | Environmental Conditions |
On March 2, 2012, a request was submitted to the Secretary for the authorization of an additional land use of 70.00 ha for the Chicharra pit, 160.00 ha for a new waste dump, 100.00 ha for the new leach pads, 8.54 ha for a new crushing circuit and 9.18 ha for a new area in the ADR plant, for the increase in production capacity to 25,000 t/d. The Secretary conditionally authorized the additional land on May 02, 2012.
| San Francisco Project | 158 | May 1, 2026 |
| Goldgroup Mining Inc. |
On July 22, 2013, a Technical Justification Study for the Change of Use of Land (Estudio Técnico Justificativo para el Cambio de Uso de Suelo) was submitted to the Secretary to grant authorization for
334.75 ha of new land use areas, based upon the inventory of the natural resources to be affected, and an environmental evaluation of the new areas. The Secretary authorized the additional land on October 16, 2013. At that time, the whole mine site was covered by the authorization.
Modifications to the Environmental Licence (Licencia Ambiental Única), initially authorized on March 17, 2010, were submitted on August 25, 2014, to request the authorization of the Secretary of Environment and Natural Resources to include new equipment and increased production capacity for the operating licence, new inventory and registration of emissions to the atmosphere, new inventory and registration of hazardous waste generation and, also to register modifications to the blasting program. The Secretary conditionally authorized the modifications on October 6, 2014.
Previous operators complied with conditions established by the Secretary of Environment and Natural Resources for all of the previous and newly authorized environmental permits. These conditions include programs for the recovery and relocation of flora, reforestation, recovery and relocation of fauna, monitoring of surface water quality, monitoring of air quality, and hazardous waste management.
Goldgroup will be responsible for continuing to comply with all conditions outlined by the Secretary of Environment and Natural Resources as it works towards re-establishing production at the San Francisco Project.
| San Francisco Project | 159 | May 1, 2026 |
| Goldgroup Mining Inc. |
25 INTERPRETATION AND CONCLUSIONS
| 25.1 | Overview |
Subject to the final approval of the TSX Venture Exchange (the “TSXV”), Goldgroup has acquired all of the issued and outstanding Series “A” shares in the fixed capital and all the issued and outstanding Series “B” shares in the variable capital (collectively the “Molimentales Shares”) of Molimentales del Noroeste, S.A. de C.V. (“Molimentales”) through a Concurso Mercantil process (restructuring proceeding equivalent to Chapter 11 in the United States).
Molimentales holds the mining concessions for the San Francisco Project in the State of Sonora, Mexico. The San Francisco Project is a former producing mine which still contains an economic mineral resource within the San Francisco and La Chicharra pits, the newly defined North Pit area and the potential mineral resources in El Llano area which lies to the east of the San Franciso pit.
| 25.2 | 2026 Mineral Resource Estimate |
| 25.2.1 | General Information |
The resource estimate for this report is partly based on revising the previous work completed by Magna and Micon for the 2020 Mineral Resource Estimate and completing a new Mineral Resource Estimate for the North Pit area based upon drilling completed by Magna. The Mineral Resource Estimates reported for the San Francisco and La Chicharra deposits are supported by Magna block models and have been depleted to reflect the mining completed by Magna before the mine closure. The resources reported in the North Pit are supported by a 2026 block model developed by Micon. The resource estimate is compliant with the current CIM standards and definitions as specified by NI 43-101 and supersedes all previous mineral resource estimates for the San Francisco Project. The effective date of the current mineral resource estimate is April 30, 2026.
Since the previous 2020 report on the San Francisco Project, drilling campaigns in 2020, 2021, and 2022 resulted in 206 additional drill holes totalling 27,269 m added to the drill hole database. The drilling was focused primarily in the northern and eastern parts of San Francisco deposit.
The 2020 mineral resource estimate for the San Francisco and La Chicharra pits used a gold price of US$ 1,500. The current 2026 estimate is based on the 2020 block model and uses an adjusted gold price of US$ 3,500 per ounce for the San Francisco and La Chicharra mineral resource estimates. For the North Pit a gold price of US $3,500 was used, while the costs were maintained the same as for San Francisco and La Chicharra.
The resource block models are based on 5 m by 5 m by 6 m high blocks. The coordinate limits of the previous models were retained for this current work. The topography was updated to reflect the mined surface as of November 17, 2022. The undisturbed pre-mining topographic surfaces are also available in the model.
Mineralized lenses were manually interpreted, based on the data available in the database. These were used to constrain the gold grade estimation and assign density values.
| San Francisco Project | 160 | May 1, 2026 |
| Goldgroup Mining Inc. |
| 25.2.2 | Database |
The database of the San Francisco and La Chicharra deposits consists of 4,862 drill holes with 457,328 sample intervals, mostly 1.5 m in length, of a total database of 719,247 m of drilling for the entire property, including exploration drilling outside the San Francisco and La Chicharra pits. The current database includes 285 new holes drilled from 2020 to 2022, for a total of 33,596.5 m of drilling.
Approximately 12% of the sampling intervals are greater than or equal to 2 m length, about 85% of the intervals are between 1.5 and 2.0 m in length, and about 3% are less than 1.5 m in length. In the case of duplicate samples, the original sample was used in the database.
| 25.2.3 | Capping |
High-grade outlier assays were capped at different gold grades, according to the domains within the San Francisco and La Chicharra pits.
For the North Pit deposit, assays were capped at 4 g/t Au for mineralization domains and 0.7g/t Au for wall rock. Capping was applied on 7 samples in the mineralization domains and three samples in the wall rock.
| 25.2.4 | Compositing |
The assay database was composited to 3-m regular down-hole lengths, which is half the block height of 6 m. Assays were length-weighted for each composite. The relatively short composite length was chosen to unsmooth the resultant block grade distribution and provide a better match between the interpolated block grades and the underlying assay data.
| 25.2.5 | Specific Gravity |
A total of 68 specific gravity determinations were made, covering all rock domains. Results range from a high of 2.84 g/cm3 to a low of 2.61 g/cm3, with an arithmetic mean of 2.76 g/cm3.
| 25.2.6 | Grade Interpolation |
At San Francisco and La Chicharra, all blocks in the model were interpolated using the Ordinary Kriging method. The parameters were derived from the variographic analysis and applied to the different domains and zones accordingly.
For the resource estimate in the San Francisco deposit, the interpolation process was relaxed to allow multiple domains to inform blocks on each interpolation run, because the remaining resources are predominantly gabbro (Rock Code 11).
For North Pit, block grades were estimated using the Inverse Distance cubed (ID3) method, in a single pass. In mineralization domains, with relatively thin, vein geometry, a spherical search with 120 m radius was used for sample selection. A minimum of two samples and maximum of 12 samples were used to inform a block, with a maximum of two samples per hole. In the surrounding wall rock domain, grade was estimated the ID3 estimation method, using a search ellipse with radii of 120 m by 120 m by 30 m, oriented along the dip of the mineralization (dip 18°, dip azimuth 25°, pitch 100°). A sample search strategy with minimum of two samples and maximum of 12 samples was used to inform a block, with a maximum of two samples per hole.
| San Francisco Project | 161 | May 1, 2026 |
| Goldgroup Mining Inc. |
| 25.2.7 | Classification |
Mineralized zones in the San Francisco Project have been classified as a mineral resource according to the CIM definitions. The mineralized zones display good geologic continuity, as demonstrated by the drill results.
The categorization criteria applied to the San Francisco and La Chicharra deposits resource estimates are as follows:
| · | Blocks within 20 m of a sample are considered measured, based upon a pass finding 3 drill holes with a maximum of 2 samples per hole. |
| · | Blocks between 20 m and 40 m from a sample are considered indicated, based upon a pass finding 2 drill holes with a maximum of 2 samples per hole. |
| · | Any blocks further than 40 m from a sample are considered inferred. |
For the North Pit, blocks in areas with a drill hole spacing of 50 m or less were considered for classification into Indicated category. Estimated blocks within 25 m from a drillhole and informed by at least two drill holes were initially selected, then a wireframe was manually modelled to retain contiguous patches of blocks where the conditions were met. The blocks retained inside the classification wireframe were classified in the Indicated category. The remaining estimated blocks were classified in the Inferred category.
| 25.2.8 | Resource Pit Optimization and Economic Parameters |
For the 2020 Magna block models, pit optimization studies were ran in order to estimate the resources. The gold price used for estimating 2020 mineral resources was US$ 1,500 per ounce. This procedure was used to satisfy the criterion that resources must have reasonable prospects of eventual economic extraction. For the San Francisco and La Chicharra pit areas the 2026 update comprised reviewing the models and material mined up to the point Molimentales ceased operations and it was decided to modify the 2020 parameters by adjusting costs with inflation, and change the gold price to US $3,500/oz. An updated open pit resource shell was generated and used for mineral resource reporting. Micon’s QPs recommend that Goldgroup updates the San Francisco and La Chicharra models to incorporate the latest geological information available.
The parameters used in the pit optimization are summarized in Table 25.1. The input operating parameters were derived from actual operating costs incurred during the San Francisco Project’s production period and escalated to 2026 US dollars using standard inflation indices.
Pit bench heights were set at 6 m (the block height used in the model), and slope angles were based on average overall slope angle of 50° and a minimum operating width of 20 m.
For the North Pit deposit, a pit optimization exercise was conducted, using a gold price of US$ 3,500 per ounce. This procedure was used to satisfy the criterion that resources must have reasonable prospects of eventual economic extraction. The parameters used in the pit optimization are summarized in Table 25.2. The costs inputs used were based on operating costs from 2020, but adjusted US dollar to 2026 inflationary indices. Same pit slope parameters as used for the San Francisco pit were assumed for the North Pit.
| San Francisco Project | 162 | May 1, 2026 |
| Goldgroup Mining Inc. |
Table 25.1
Pit Optimization Parameters* for the April 30, 2026, Mineral Resource Estimate for the San Francisco and La Chicharra Deposits
| Area | Costs | ||
San Francisco Model |
Description | Units | Amount |
| Waste mining cost OP | US$/t | 2.69 | |
| Ore mining cost OP | US$/t | 2.69 | |
| Process cost | US$/t | 5.1 | |
| G & A cost | US$/t | 1.0 | |
| Gold price | US$/oz | 3,500 | |
| Rock Densities and Recoveries | |||
| Name/code | Density | Recovery % | |
| Diorite (2) | 2.72 | 54.50 | |
| Gneiss (4) | 2.75 | 71.10 | |
| Granite (5) | 2.76 | 76.00 | |
| Schist (6) | 2.75 | 74.40 | |
| Lamprophyre Dike (8) | 2.76 | 54.50 | |
| Pegmatite (10) | 2.85 | 74.40 | |
| Gabbro (11) | 2.81 | 63.80 | |
| Conglomerate (12) | 2.00 | 64.50 | |
| General Recovery | 64.00 | ||
La Chicharra Model |
Costs | ||
| Description | Units | Amount | |
| Waste mining cost | US$/t | 2.69 | |
| Ore mining cost | US$/t | 2.69 | |
| Process cost | US$/t | 5.1 | |
| G & A cost | US$/t | 1.0 | |
| Gold price | US$/oz | 3,500 | |
| Rock Densities and Recoveries | |||
| Name/code | Density | Recovery % | |
| All Rock (100-500) | 2.9 | 78.00 | |
| General Recovery | 78.00 | ||
*Pit optimization parameters for metal prices and costs have been updated from those used in the August, 2020 Technical Report.
| San Francisco Project | 163 | May 1, 2026 |
| Goldgroup Mining Inc. |
Table 25.2
Pit Optimization Parameters for the April 30, 2026 Mineral Resource Estimate for the North Pit Deposit
| Area | Costs | ||
|
North Pit Model |
Description | Units | Amount |
| Waste mining cost OP | US$/t | 2.69 | |
| Ore mining cost OP | US$/t | 2.69 | |
| Process cost | US$/t | 5.1 | |
| G & A cost | US$/t | 1.0 | |
| Gold price | US$/oz | 3,500 | |
| Rock Densities and Recoveries | |||
| Name/code | Density | Recovery % | |
| Diorite | 2.72 | 54.50 | |
| Gneiss | 2.75 | 71.10 | |
| Granite | 2.76 | 76.00 | |
| Schist | 2.75 | 74.40 | |
| Lamprophyre Dike | 2.76 | 54.50 | |
| Pegmatite | 2.85 | 74.40 | |
| Gabbro | 2.81 | 63.80 | |
| Conglomerate | 2.00 | 64.50 | |
| General Recovery | 64.00 | ||
As can be seen from Table 25.1, not only do the various rock codes have a different density, but the metallurgical recovery varies with the rock code as well.
| 25.2.9 | April 30, 2026 Mineral Resource Estimate Statement |
The Mineral Resource Estimates which have an effective date of April 30, 2026 are presented in Table 25.3.
Table 25.3
Mineral Resource Estimate for the San Francisco Project as of April 30, 2026
Area
|
Cut-off (Au g/t) |
Category |
K tonnes |
Au (g/t) |
Gold (K oz) |
San Francisco Mine OP |
0.09 |
Measured | 41,024 | 0.38 | 498.9 |
| Indicated | 38,299 | 0.37 | 456.8 | ||
| Measured and Indicated | 79,323 | 0.37 | 955.7 | ||
| Inferred | 7,464 | 0.39 | 93.3 | ||
La Chicharra Mine OP |
0.07 |
Measured | 7,241 | 0.36 | 82.8 |
| Indicated | 13,892 | 0.32 | 143.8415.3 | ||
| Measured and Indicated | 21,132 | 0.33 | 226.6 | ||
| Inferred | 1,040 | 0.37 | 12.4 | ||
| North Pit | 0.08 | Measured | |||
| Indicated | 4,630 | 0.30 | 44.3 |
| San Francisco Project | 164 | May 1, 2026 |
| Goldgroup Mining Inc. |
Area
|
Cut-off (Au g/t) |
Category |
K tonnes |
Au (g/t) |
Gold (K oz) |
| Measured and Indicated | 4,630 | 0.30 | 44.3 | ||
| Inferred | 8,764 | 0.26 | 72.7 | ||
Total Resources |
Measured | 48,265 | 0.37 | 581.7 | |
| Indicated | 56,821 | 0.35 | 644.9 | ||
| Measured and Indicated | 105,086 | 0.36 | 1,226.6 | ||
| Inferred | 17,268 | 0.32 | 178.4 |
Notes:
| 1. | The effective date of this MRE is April 30, 2026. | |
| 2. | Messrs. William Lewis, P.Geo. and Tudorel Ciuculescu, P.Geo. from Micon International Limited are the Qualified Persons (QPs) responsible for this MRE. | |
| 3. | The MRE has been classified in the Measured, Indicated, and Inferred categories. | |
| 4. | The calculated gold break-even cut-off grade is 0.12 g/t Au for San Francisco Mine, 0.10 g/t Au for La Chicharra Mine, and 0.12 g/t Au for North Pit Mine. Marginal cut-off grade is 0.09 g/t Au for San Francisco Mine, 0.07 g/t Au for La Chicharra Mine, and 0.08 g/t Au for North Pit Mine. | |
| 5. | The mineral resources are constrained by resource shells based on the break-even cut-off grade and reported at the marginal cut-off grade. | |
| 6. | The SG values vary between 2.0 g/cm3 and 2.85 g/cm3 depending on lithology. | |
| 7. | The MRE used economic assumptions for open pit mining. The following economic parameters were used for generating cut-off grades: for San Francisco and La Chicharra a gold price of US$3,500/oz, recovery from 54.5% to 74.4% (64% average recovery), open pit mining cost of US$2.69/t, processing costs of US$5.1/t, general and administration cost of US$1.0/t; for North Pit a gold price of US$3,500/oz, recovery from 54.5% to 73% (67% average recovery), open pit mining cost of US$2.69/t, processing costs of US$5.1/t, general and administration cost of US$1.0/t. | |
| 8. | The open pits used average slope angles of 50° and royalty of 1.5%. | |
| 9. | The block models are orthogonal and have a parent block size of 5 m x 5 m x 6 m. | |
| 10. | The mineral resources described above have been prepared in accordance with the current Canadian Institute of Mining, Metallurgy and Petroleum Standards and Practices. | |
| 11. | Numbers have been rounded to the nearest thousand tonnes and nearest hundred ounces. Differences may occur in totals due to rounding. | |
| 12. | Mineral Resources are not Mineral Reserves as they do not have demonstrated economic viability. The quantity and grade of reported Inferred Mineral Resources are uncertain in nature and there has been insufficient exploration; however, it is reasonably expected that a significant portion of Inferred Mineral Resources could be upgraded into Indicated Mineral Resources with further exploration. | |
| 13. | Micon’s QPs have not identified any environmental, permitting, legal, title, taxation, socio-economic, marketing or political issues which would adversely affect the mineral resources estimated above. |
| 25.3 | San Francisco Project Potential Mineralization Target |
Scattered exploration drilling east of the San Francisco Pit, in what has been termed the El LIano exploration target area, has indicated that the mineralization identified and mined in the pit could potentially continue to the east towards Mexican State Highway 15 (Pan American Highway) which links Hermosillo to Nogales in the American Mexican border.
While the drilling at this time is too widely spaced to infer continuity between the individual mineralized intersections identified in the drill holes, the general intersections are similar to those mined in the San Francisco Pit and generally lie in the easterly strike direction of mineralization located in the San Francisco Pit. Therefore, Micon’s QPs believe that the El Llano exploration target area has the potential to host a mineralized zone similar to that found in the San Francisco Pit.
| San Francisco Project | 165 | May 1, 2026 |
| Goldgroup Mining Inc. |
Table 25.4 summarizes Micon’s QP estimated range for the potential mineralization in the El Llano exploration target area.
Table 25.4
Summary of the Estimated Range for the Potential Mineralization in the El Llano Exploration Target Area
| Area | Potential Mineral Target Range* | |||||
| Lower Target Range | Higher Target Range | |||||
Tonnage (Mt) |
Grade (Au g/t) |
Ounces Gold (x 1000) |
Tonnage (Mt) |
Grade (Au g/t) |
Ounces Gold (x 1,000) | |
| El Llano Exploration Target Area | 40 | 0.61 | 788 | 78 | 0.38 | 960 |
*Notes:
| 1. | The estimated potential is based upon the widespread drilling in the El Llano Exploration Target Area east of the existing San Francisco Pit which could host the eastern extension of the mineralization found in the pit. |
| 2. | The potential quantity and grade are conceptual in nature, and there has been insufficient exploration to define a mineral resource and that it is uncertain if further exploration will result in the target being delineated as a mineral resource. |
Figure 25.1 shows the location of the EI LIano Exploration Target Area.
Figure 25.1
El LIano Exploration Target Area
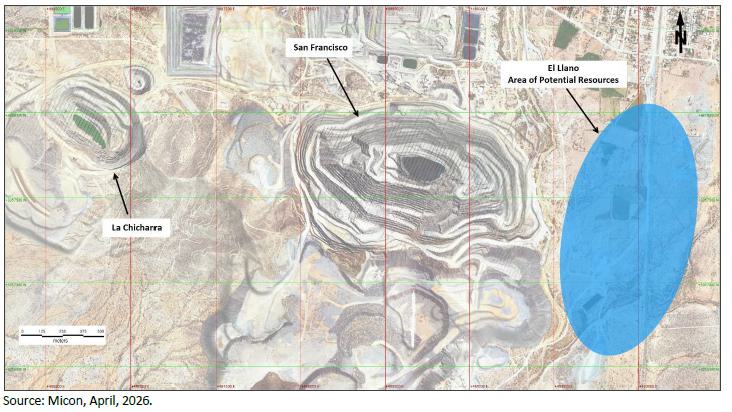
| San Francisco Project | 166 | May 1, 2026 |
| Goldgroup Mining Inc. |
| 25.4 | Conclusions |
Goldgroup is in the process of acquiring Molimentales which holds the mining concessions for the San Francisco Project. While a large amount of mineralization has been extracted from the San Francisco and La Chicharra pits since mining first began at the site, it still contains economic mineralization as well as the potential to discover further mineralization nearly equal to that already extracted. Micon’s QPs recommend that Goldgroup proceeds with a thorough review of the information within the Project database and an exploration program to further define the extent of the remaining mineralization at the San Francisco Project once it has completed acquisition.
| 25.5 | Risks and Opportunities at the San Francisco Project |
Table 25.5 identifies some of the internal risks, potential impacts and possible risk mitigation measures that could affect the economic outcome of the Project. This excludes the external risks that apply to all mining projects (e.g., changes in metal prices, exchange rates, availability of investment capital, change in government regulations, etc.). Significant opportunities that could improve the economics, timing and permitting of the Project are also identified in this table. Further information and evaluation are required before these opportunities can be included in the project economics.
Table 25.5
Risks and Opportunities at the San Francisco Project
| Risk | Potential Impact | Possible Risk Mitigation |
| Mineral Resources Compositing of Assays for Entire Drill Hole | Potential of smearing grade and effect interpretation of mineralized zones on the edges of wire framed mineralized bodies. |
Change to conducting assay compositing only within mineralization wireframe intercepts as this may lead to higher average grades and improve the interpretation results for the San Francisco and La Chicharra pits. |
| Mineral Resource Continuity | Widely spaced drilling in some areas which need further infill drilling in expansion or inferred areas. |
Continue infill drilling to upgrade a larger proportion of the inferred mineral resources to indicated and measured resources. |
| Proximity to the Town of Estación Llano | Possibility that the portions of the population does not accept the continuation of the mining project | Maintain a pro-active and transparent strategy to identify all stakeholders and maintain a communication plan. The main stakeholders have been identified, and their needs/concerns understood. Continue to organize information sessions, publish information on the mining project, and meet with host communities. |
Difficulty in attracting experienced professionals |
Maintenance of the Project to attract and retain experienced professionals | The early search for professionals will help identify and attract critical people. It may be necessary to provide accommodation for key people (not included in project costs). |
| Some of the samples in the North pit area lack duplicate assay repeatability | Potential for a portion of the North Pit resources to be overestimated or underestimated with respect to the grade. |
The use of screen metallic assays on some material is recommended, as well as conducting some mineralogical studies in order to understand why some of the samples exhibit poor repeatability. |
| San Francisco Project | 167 | May 1, 2026 |
| Goldgroup Mining Inc. |
| Opportunities | Explanation | Potential Benefit |
| Mineral Resource Interpretation | Current wireframes may inflate or deflate the extent of the mineralization. |
Change interpretation practices from an extruded flat polygonal model to full 3D wireframes to better define the mineralization. |
| Historical core and sample availability | There is the potential to relog existing drill core to incorporate additional geological information into the existing database. |
Relogging of core allows for increased information added to the database and further defines the extent of the mineralization. Historical pulps and rejects allow for potential re-assaying and confirmation of historical work. |
Surface mapping and sampling programs |
Potential to identify additional zones or deposits of mineralization. |
Adding to the overall mineral potential of the Project and potentially adds exploration and economic value to the Project. |
| Surface definition diamond drilling | Potential to upgrade inferred resources to the indicated category |
Adding indicated resources increases the economic value of the mining Project. |
| Surface exploration drilling | Potential to identify additional inferred resources |
Adding inferred resources increases the economic value of the mining Project. |
| San Francisco Project | 168 | May 1, 2026 |
| Goldgroup Mining Inc. |
26 RECOMMENDATIONS
| 26.1 | Exploration Budget |
To assess the nature of the additional mineralization at the San Francisco Project, Goldgroup will undertake a drilling program in the area identified as the North Pit. In order to develop this pit which will be on the northeast side of the main San Francisco pit, portions of the original infrastructure will need to be removed such as the Truck maintenance shop, office facilities and potentially even a portion of the ADR Plant 1. To assess the economic nature of the North Pit further, Goldgroup has designed a reverse circulation drill program comprised of both infill and exploration holes at specific sites in and around potential location of the North Pit. Goldgroup plans to upgrade a portion of the indicated mineral resources to the measured resources category and to further confirm the mineralized bodies within Phases 9A and 9B of current mine plan of the San Francisco pit. The program is based on the previous drilling information obtained by Alio and Magna. The 2026 drill program consists of a total of 10,000 m of RC drilling and 10,000 m of core drilling.
Table 26.1 summarizes the estimated budget for the 2026 infill and exploration drilling programs located in the projected area of the North Pit at the San Francisco Project.
Table 26.1
Estimated Budget for the 2026 Infill and Exploration Drilling Program at the San Francisco Mine
| Description | Unit | No. Units |
Unit
Cost US $ |
Total
Cost US $ |
| Geology and Exploration | ||||
| Project Management | Month | 6 | 6,000 | 36,000 |
| Exploration Management SF Mine | Month | 6 | 4,500 | 27,000 |
| Geologist (Salaries and Consulting Fees) | Month | 6 | 7,500 | 45,000 |
| Field Hands | Month | 6 | 11,000 | 66,000 |
| Camp, Foods and Accommodation | Month | 6 | 2,500 | 15,000 |
Exploration Supplies (bags, duplicates, CRMs, core boxes, etc.) |
Lump | 2 | 5,000 | 10,000 |
| Reverse Circulation Drilling * | metre | 10,000 | 70 | 700,000 |
| Core Drilling | metre | 10,000 | 120 | 1,200,000 |
| Equipment for core cutting | Rent or Purchase | |||
| Assaying for Gold (External, Prep and Assay) | Samples | 17,333 | 35 | 606,667 |
| Engineering and Feasibility (Micon) | Consultants | 1 | 50,000 | 50,000 |
| Metallurgical Tests North Pit | Consultants | 1 | 50,000 | 50,000 |
| Drafting, Reporting, Reproduction, Maps | Lump | 1 | 2,500 | 2,500 |
| Software Leapfrog | Year | 1 | 25,000 | 25,000 |
| ArcGis PRO Licence | Year | 2 | 1,000 | 2,000 |
| Vehicle Renting | Four | 3 | 2,400 | 7,200 |
| Gasoline and Maintenance | Lump | 3 | 2,400 | 7,200 |
| Travel Expenses | - | |||
| Safety Equipment | Lump | 12 | 100 | 1,200 |
| Social Security and Labour Related Taxes | Estimated | 10% | 147,000 | 14,700 |
| Total Exploration and Administration | 2,865,467 |
| San Francisco Project | 169 | May 1, 2026 |
| Goldgroup Mining Inc. |
Note: *The unit cost of the RC drilling varies from $56 to $78 dollars per metre, included transportation, additives, rent of a gyro or reflex survey tool, etc., in agreement with two quotations.
Table from Micon International Limited.
Micon’s QPs have reviewed the exploration budgets for the area of the North Pit at the San Francisco Project and recommends that Goldgroup proceed with the budget, subject to funding and other operational changes that may arise.
Given the prospective nature of the property, it is the opinion of Micon’s QPs that the San Francisco Project and surrounding property merits further exploration with the objective of identifying additional mineralized zones with the potential to extend Project life.
| 26.2 | Further Recommendations |
Micon agrees with the general direction of Goldgroup’s exploration and development program for the property and makes the following additional recommendations:
| 1. | Goldgroup will need to improve the mineralization wireframes for San Francisco and La Chicharra Pits from being a series of extruded flat polygons to full 3D wireframes which would better define the mineralization boundaries. This will also increase the accuracy of the block modelling interpretation as further drill holes are added to the models since current modelling programs are unable to use the existing format. |
| 2. | Goldgroup needs to conduct the assay compositing for both San Francisco and La Chicharra within the mineralization wireframe intercepts, instead of compositing the entire hole from collar to toe; this will potentially lead to higher average grades within the mineralization wireframes and improve the interpolation results. |
| 3. | Goldgroup should continue the practice of ongoing column leach testwork on-site, using samples that represent future planned mining areas and potential new mineral resources identified during exploration. The data gleaned from this work will improve the understanding of the various mineralization types and help optimize the recovery of gold. This testwork should be completed on material from the area of the North Pit prior to undertaking a mineral resource for this area. |
| 4. | Goldgroup should plan an extensive exploration campaign on the San Francisco Project to identify potential secondary sources of mineralization which can be added to the mineral inventory of the Project. |
| San Francisco Project | 170 | May 1, 2026 |
| Goldgroup Mining Inc. |
27 REFERENCES
| 27.1 | Technical Reports, Papers and Other Sources |
Alio Gold Inc., (November 9, 2017), Press Release: Alio Gold Provides Third Quarter 2017 Update.
Alio Gold Inc., (January 30, 2018), Press Release: Alio Gold Provides 2018 Guidance for San Francisco Mine.
Alio Gold Inc., (April 11, 2018), Press Release: Alio Gold Provides First Quarter 2018 Production from San Francisco with Management and Transaction Updates.
Alio Gold Inc., (May 9, 2018), Press Release: Alio Gold Reports First Quarter 2018 Results.
Alio Gold Inc., (August 10, 2018), Press Release: Alio Gold Reports Second Quarter 2018 Results. Alio Gold Inc., (November 08, 2018), Press Release: Alio Gold Reports Third Quarter 2018 Results. Alio Gold Inc., (January 15, 2019), Press Release: Alio Gold Provides 2018 Gold Production.
Alio Gold Inc., (February 12, 2019), Press Release: Alio Gold Files Technical Report and Provides San Francisco Update.
Alio Gold Inc., (March 13, 2019), Press Release: Alio Gold Reports Fourth Quarter and Full-Year 2018 Results.
Alio Gold Inc., (May 08, 2019), Press Release: Alio Gold Reports First Quarter 2019 Results.
Alio Gold Inc., (November 06, 2019), Press Release: Alio Gold Reports Third Quarter 2019 Results. Alio Gold Inc., (March 06 08, 2020), Press Release: Alio Gold Announces Sale of San Francisco Mine.
Anderson, T.H., and Silver, L.T., (1979), The role of the Mojave-Sonora Megashear in the Tectonic Evolution of Northern Sonora, in Clark, K.F. et al., editors, Geology and Mineral Resources of Northern Sierra Madre Occidental, Mexico, Guidebook for the 1992 Field Conference, El Paso Geological Society, 479 p.
Call & Nicholas Inc., (2012), Geotechnical Evaluation for the San Francisco Final Pit Plan Prepared for Molimentales del Noroeste S.A. de C.V., 304 p.
Calmus, T. et al., (1992), Geology of Estación Llano (Sonora): A New Proterozoic Basement and the San Francisco Gold Deposit, in Clark, K.F. et al., editors, Geology and Mineral Resources of Northern Sierra Madre Occidental, Mexico, Guidebook for the 1992 Field Conference, El Paso Geological Society, p. 313 to 322.
De Jong, K., et al., (1988), Eastward Thrusting, Southwestward Folding and Backsliding in the Sierra La Vibora, Sonora, Mexico: Geology, V. 16.
Defiance Mining Corporation, (2004), Annual Report 2003, 30 p.
| San Francisco Project | 171 | May 1, 2026 |
| Goldgroup Mining Inc. |
Foo, B, (2015), Memorandum, San Francisco Underground Mining Preliminary Review, 3 p. Geomaque Explorations Ltd, (2001), Annual Report 2000, 19 p.
Geomaque Explorations Ltd, (2002), Annual Report 2001, 26 p.
Geomaque Explorations Ltd, (2003), Annual Information Form for the Year Ended December 31, 2002, 68 p.
Geomaque of Mexico, S.A. de C.V., (1994), Presentation by Geomaque de Mexico, S.A. de C.V. for the evaluation of Environmental Impact Report, General Category, for the Geological-Mining Project Named “San Francisco” Mining Project.
Golder and Associates, (1996), Final Pit Wall Stability Evaluation, San Francisco Mine Project Draft Report prepared for Geomaque De Mexico, 39 p.
Hester, M., (2007), San Francisco Mineral Resource, Memo prepared for Timmins Gold Corporation by Independent Mining Consultants Inc., 11 p.
Independent Mining Consultants Inc., (1997), San Francisco Project, Minable Reserves and Geological Resources as of April 30, 1997 prepared for Geomaque Exploration Ltd., 42 p.
Jacques-Ayala, C., et al., (1991), The Interpreted Trace of the Mojave-Sonora Megashear in Northwest Sonora-A Laramide Thrust Front and Middle Tertiary Detachment Zone: Primer Congreso Mexicano Mineralogia, Conv. Evolucion Geologica de Mexico, Memoria.
Lewis, W.J., (2005), Technical Report on the San Francisco Mine Property, Estación Llano, Sonora, Mexico, 68 p.
Lewis, W.J. and Hester, M.G. (2007), NI 43-101 Technical Report and Resource Estimate for the San Francisco Gold Property, Estación Llano, Sonora, Mexico, www.sedar.com 140 p.
Lewis, W.J. et al., (2008), NI 43-101 Technical Report on the Preliminary Feasibility Study for the San Francisco Gold Property, Estación Llano, Sonora, Mexico, 207 p.
Lewis, W.J. et al., (2009), NI 43-101 Technical Report on the Preliminary Feasibility Study for the San Francisco Gold Property, Estación Llano, Sonora, Mexico, Amended 2008 Technical Report, 205 p.
Lewis, W.J. et al., (2010), NI 43-101 Technical Report Updated Resources and Reserves and Mine Plan for the San Francisco Gold Mine, Sonora, Mexico, 217 p. Report Amended 2011.
Lewis, W.J. et al., (2011), NI 43-101 F1 Technical Report Updated Resources and Reserves and Mine Plan for the San Francisco Gold Mine, Sonora, Mexico, 300 p.
Lewis, W.J.et al, (2013), NI 43-101 F1 Technical Report Updated Resources and Reserves and Mine Plan for the San Francisco Gold Project, Sonora, Mexico, 330 p.
| San Francisco Project | 172 | May 1, 2026 |
| Goldgroup Mining Inc. |
Lewis, W.J.et al, (February, 2016), NI 43-101 F1 Technical Report Updated Resources and Reserves and Mine Plan for the San Francisco Gold Project, Sonora, Mexico, 215 p.
Lewis, W.J.et al, (September, 2016 and amended November, 2016), NI 43-101 F1 Technical Report Updated Resources and Reserves and Mine Plan for the San Francisco Gold Project, Sonora, Mexico, 264 p.
Lewis, W.J.et al, (May 25, 2017), NI 43-101 F1 Technical Report Updated Resources and Reserves and Mine Plan for the San Francisco Gold Project, Sonora, Mexico, 261 p.
Lewis, W.J., Gowans, R.M., and Calles-Montijo, R., (June, 2020), NI 43-101 F1 Technical Report for the San Francisco Gold Project, Sonora, Mexico, 277 p.
Lewis, W. J., et al, (August 28, 2020), NI-43-101 F1 Technical Report Pre-Feasibility Study for the San Francisco Gold Project, Sonora, Mexico, 320 p.
Luna, R. and Gastelum, G., (1992), Geology of the San Francisco Prospect, Estación Llano, Sonora in Clark, K.F. et al., editors, Geology and Mineral Resources of Northern Sierra Madre Occidental, Mexico, Guidebook for the 1992 Field Conference, El Paso Geological Society, p. 307 to 312.
Magna Gold Corp., (March 6, 2020), Press Release: Magna Gold Corp. Announces Acquisition of the San Francisco Mine and Private Placement.
Magna Gold Corp., (April 24 2020), Press Release: Magna Gold Corp. Provides Update on Acquisition of the San Francisco Mine and Private Placement.
Magna Gold Corp., (May 6, 2020), Press Release: Magna Gold Corp. Closes Acquisition of the San Francisco Mine and Private Placement.
Magna Gold Corp., (June 16 2020), Press Release: Magna Gold Corp. Provides Corporate Update. Magna Gold Corp., (July 9, 2020), Press Release: Magna Gold Corp. Provides Operating Update.
Magna Gold Corp., (Jun 29, 2021), Press Release: Magna Gold Corp. Magna Gold Achieves Full-Scale Commercial Production at San Francisco on Schedule.
Magna Gold Corp., (May 17, 2022), Drilling Results on the area at the N-NE of the SF Pit and on Phase 8 of the San Francisco Pit, January-April 2022, Internal Memo, 11 p.
Magna Gold Corp., (March 3, 2023), Press Release: Magna Gold Corp. Magna Gold and its Subsidiary Obtain Creditor Protection and Announce Transfer to NEX.
Magna Gold Corp., (March 27, 2023), Press Release: Magna Gold Corp. Magna Gold Obtains Initial Order under Companies' Creditors Arrangement Act (Canada).
Micon International Limited, (2012), Technical Memorandum, San Francisco Mine Reconciliation of Reserves, 16 p. plus appendices.
| San Francisco Project | 173 | May 1, 2026 |
| Goldgroup Mining Inc. |
Medina, Miguel Rangel, (2013), Estudio de Evaluación Hidrogeológica en el Área de Nuevos Patios de Lixiciación, de La Mina San Francisco, Estacion Llano, Sonora, 46 p.
Medina, Miguel Rangel, (2012), Informe Mensual Noviembre "Construcción de Piezómetros en el Área
de la Mina San Francisco, Municipio de Santa Ana, Sonora”, 74 p.
Medina, Miguel Rangel, (2013), Informe Final "Memorias de la Construcción de Piezómetros en el Área
de la Mina San Francisco, Municipio de Santa Ana, Sonora” (Nov-Dic/2012), 45 p.
Medina, Miguel Rangel, (2013), Memorias "Construcción de Piezómetros en el Área de la Mina San
Francisco, Municipio de Santa Ana, Sonora” (Nov-Dic/2012), 127 p.
Perez Segura, E., (1992), The Au-Te Mineralogy of the San Francisco Deposit, Sonora, Mexico, in Clark,
K.F. et al., editors, Geology and Mineral Resources of Northern Sierra Madre Occidental, Mexico, Guidebook for the 1992 Field Conference, El Paso Geological Society, p. 323 to 330.
Prenn, N.B., et al., (1995), San Francisco Property Resource and Reserve Sonora, Mexico prepared by Mine Development Associates for Geomaque Exploration Ltd., 46 p.
Salas, G.P., et al, (1991), Economic Geology, Mexico, Volume P-3 of the Geology of North America, in The Decade of North American Geology Project series by The Geological Society of America, Inc., 438 p.
Silberman, M., (1992), Characteristics and Complex History of Gold-Bearing Quartz veins along the Mojave-Sonora Megashear Zone, northern Sonora, Mexico, in Clark, K.F. et al., editors, Geology and Mineral Resources of Northern Sierra Madre Occidental, Mexico, Guidebook for the 1992 Field Conference, El Paso Geological Society, 479 p.
Silver, L.T., and Anderson, T.H., (1974), Possible Left-lateral Early to Middle Mesozoic Disruption of the Southwestern North American Craton Margin, in Geological Society of America, Abstracts with Programs, v. 6, 955 p.
Sol & Adobe Ingenieros Asociado S.A. de C.V. (2006) San Francisco Scoping Study, 9-1 to 9 7 p.
Telluris Consulting Ltd., (2009), Structural Review of the San Francisco Deposit, Sonora Mexico, Prepared for Timmins Gold Corp. Molimentales del Noroeste S.A. de C.V., 35 p.
Timmins Gold Corp., (January, 2011), Exploration Report, 209 p. Timmins Gold Corp., (January-February, 2012) Exploration report, 229. Timmins Gold Corp., (January, 2013), Report of Exploration, 212 p.
Timmins Gold Corp., (May, 2011), Press Release: Timmins Gold sells 65,784 ounces of gold during first year of commercial operations at the San Francisco Mine.
Timmins Gold Corp., (September, 2011), Press Release: Timmins Gold Corp Announces Updated Reserve and Resource Estimates for the San Francisco Gold Project.
| San Francisco Project | 174 | May 1, 2026 |
| Goldgroup Mining Inc. |
Timmins Gold Corp., (October, 2011), Press Release: Timmins Gold Reports Second Quarter Production Results.
Timmins Gold Corp., (November, 2011), Press Release: Timmins Gold to commence Trading on NYSE Amex on November 4, 2011.
Timmins Gold Corp., (January, 2012), Press Release: Timmins Gold reports record production of 21,524 gold ounces in final quarter of 2011.
Timmins Gold Corp., (March, 2012), Press Release: Timmins Gold Corp Announces Updated Resource Estimate for the San Francisco Gold Project.
Timmins Gold Corp., (April, 2012), Press Release: Timmins Gold Reports Record Gold Production of 21,532 Ounces of Gold and Record Gold Recovery Ratio of 69% during Q1 2012.
Timmins Gold Corp., (July, 2012), Press Release: Timmins Gold reports record production of 23,203 ounces of gold and 14,453 ounces of silver during Q2 2012.
Timmins Gold Corp., (October, 2012), Press Release: Timmins Gold reports record production of 25,153 ounces of gold and 13,857 ounces of silver during Q3 2012.
Timmins Gold Corp., (January, 2013), Press Release: Timmins Gold reports record production of 94,444 ounces of gold for 2012.
Timmins Gold Corp., (April, 2013), Press Release: Timmins Gold reports record production of 28,328 ounces of gold for the first quarter of 2013.
Timmins Gold Corp., (April, 2013), Press Release: Timmins Gold intersects 72 metres of 1.6 gpt gold, 15 metres of 4.2 gpt gold and 14 metres of 3.2 gpt gold at San Francisco Pit.
Timmins Gold Corp., (July, 2013), Press Release: Timmins Gold reports production of 28,024 gold ounces for the second quarter of 2013.
Timmins Gold Corp., (October, 2013), Press Release: Timmins Gold reports record production of 29,139 gold ounces for the third quarter of 2013.
Timmins Gold Corp., (November, 2013), Press Release: Timmins Gold Announces Updated Reserve and Resource Estimates for the San Francisco Gold Mine.
Timmins Gold Corp., (November, 2013), Press Release: Updated Mine Plan for the San Francisco Mine.
Timmins Gold Corp., (December, 2013), Press Release: Timmins Files Updated NI 43-101 Technical Report for its San Francisco Gold Mine.
Timmins Gold Corp., (January, 2014), Press Release: Timmins Gold surpasses guidance with record production of 120,900 AuEq ozs in 2013 and 34,563 ozs for the fourth quarter of 2013.
| San Francisco Project | 175 | May 1, 2026 |
| Goldgroup Mining Inc. |
Timmins Gold Corp., (April, 2014), Press Release: Timmins Gold reports record production of 35,684 AuEq* ounces for the first quarter of 2014.
Timmins Gold Corp., (May, 2014), Press Release: Timmins announces USD 5 million 2014 exploration program focusing on three high potential targets.
Timmins Gold Corp., (July, 2014), Press Release: Timmins Gold reports production of 32,932 gold ounces for the second quarter of 2014.
Timmins Gold Corp., (October, 2014), Press Release: Timmins Gold reports production of 27,013 gold equivalent ounces for the third quarter of 2014.
Timmins Gold Corp., (December, 2014), Press Release: Timmins Gold to Purchase Caballo Blanco Gold Project.
Timmins Gold Corp., (December, 2014), Press Release: Timmins Gold completes acquisition of Caballo Blanco Gold Project.
Timmins Gold Corp., (January, 2015), Press Release: Timmins Gold reports record production of 121,573 AuEq ozs in 2014 and 25,304 AuEq ozs for the fourth quarter of 2014.
Timmins Gold Corp., (February, 2015), Press Release: Timmins Gold Identifies Potential Satellite Deposits North of San Francisco Mine Drills 33.85 m of 1.29 g/t Au and 10.2 m of 5.52 g/t Au.
Timmins Gold Corp., (February, 2015), Press Release: Timmins Gold Corp. Identifies High-grade Mineralization Adjacent to San Francisco Mine; Drills 14 metres of 8.0 g/t gold and 29 metres of 3.5 g/t gold.
Timmins Gold Corp., (February, 2015), Press Release: Timmins Gold to Combine with Newstrike Capital to Create an Emerging, Mexican-Focused Intermediate Gold Producer.
Timmins Gold Corp., (April, 2015), Press Release: Timmins Gold reports production of 24,374 AuEq ounces for the first quarter of 2015.
Timmins Gold Corp., (May, 2015), Press Release: Timmins Gold Completes Acquisition of Newstrike Capital.
Timmins Gold Corp., (July, 2015), Press Release: Timmins Gold Commences Underground Pilot Phase at its San Francisco Mine.
Timmins Gold Corp., (March, 2016), Press Release: Timmins Gold Updates San Francisco Technical Report.
Timmins Gold Corp., (August, 2016), Press Release: Timmins Gold Extends Operations at San Francisco Gold Mine into 2023.
Timmins Gold Corp., (Undated), Exploration Drilling Update on San Francisco Property, Internal Letter Report, unpagenated 19 p.
| San Francisco Project | 176 | May 1, 2026 |
| Goldgroup Mining Inc. |
Timmins Gold Corp., (Undated), In-fill Drilling at San Francisco Gold Mine 2014 – 2015, Exploracion on the San Francisco Mine, Internal Letter Report, unpaginated 18 p.
Timmins Gold Corp., (2005), Promotional Information Brochure, 2 p.
Timmins Gold Corp., (2005), San Francisco Gold Mine, Sonora Mexico, May, 2005, Power Point Presentation, 13 p.
Tosdal, R.M., Haxel, G.B., and Wright, J.E., (1989), Jurassic Geology of the Sonoran Desert Region, Southern Arizona, Southeastern California and Northwestern Sonora: Construction of a Continental-Margin Magmatic Arc, in J.P. Jenny, and S.H. Reynolds (editors), Geological Evolution of Arizona, Tucson, Arizona Geological Society Digest.
Vargas, J.C., et al, (1994), Geological – Mining Monograph of the State of Sonora, M-8E, published by the Consejo de Recursos Minerales, 220 p.
Zonge Engineering and Research Organization Inc., (2007), Processing and Interpretation of High Resolution Aeromagnetic and Radiometric Data for the San Francisco and Pima Project Areas, Sonora, Mexico, for Timmins Gold Corporation, 19 p.
| 27.2 | Internet Sources |
Alio Gold Inc., www.aliogold.com, (2017 to 2020) Press Releases. Goldgroup Mining Inc., www,goldgroupmining.com, website.
Kitco website, www.kitco.com,
Magna Gold Corp., www.magnagoldcorp.com, (2018 to 2023) Press Releases. This website is no longer active in 2025.
SEDAR website, www.sedar.com
SEDAR+ website, www.sedarplus.ca
Timmins Gold Corp., website www.timminsgold.com, (2005 to 2016) Press Releases.
| San Francisco Project | 177 | May 1, 2026 |
| Goldgroup Mining Inc. |
28 DATE AND SIGNATURE PAGE
The independent Qualified Persons for this report are as follows:
MICON INTERNATIONAL LIMITED
“William J. Lewis” {signed and sealed as of the report date}
| William J. Lewis, B.Sc., P.Geo. | Report Date: May 1, 2026. | |
| Principal Geologist | Effective Date: April 30, 2026. | |
| “Tudorel Ciuculescu” {signed and sealed as of the report date} | ||
| Tudorel Ciuculescu, B.Sc., M.Sc., P.Geo. | Report Date: May 1, 2026. | |
| Principal Geologist | Effective Date: April 30, 2026. | |
| “Richard M. Gowans” {signed and sealed as of the report date} | ||
| Richard M. Gowans. P.Eng. | Report Date: May 1, 2026. | |
| Principal Metallurgist | Effective Date: April 30, 2026. |
| San Francisco Project | 178 | May 1, 2026 |
| Goldgroup Mining Inc. |
29 CERTIFICATES OF AUTHORS (QUALIFIED PERSONS)
| San Francisco Project | 179 | May 1, 2026 |
| Goldgroup Mining Inc. |
CERTIFICATE OF AUTHOR
William J. Lewis, B.Sc., P.Geo.
As the co-author of this report for Goldgroup Mining Inc. entitled “NI 43-101 Technical Report for the San Francisco Project, Sonora, Mexico” dated May 1, 2026, with an effective date of April 30, 2026, I, William J. Lewis, do hereby certify that:
| 1. | I am employed as a Principal Geologist by, and carried out this assignment for, Micon International Limited, Suite 501, 212 King St. W, Toronto, Ontario M5H 1K5, tel. (416) 362-5135, e-mail wlewis@micon-international.com. |
| 2. | I hold the following academic qualifications: |
| B.Sc. (Geology) | University of British Columbia | 1985. |
| 3. | I am a registered Professional Geoscientist with the Association of Professional Engineers and Geoscientists of Manitoba (membership # 20480); as well, I am a member in good standing of several other technical associations and societies, including: |
| · | Association of Professional Engineers and Geoscientists of British Columbia (Membership # 20333). |
| · | Association of Professional Engineers, Geologists and Geophysicists of the Northwest Territories (Membership # 1450). |
| · | Professional Association of Geoscientists of Ontario (Membership # 1522). |
| · | Association of Professional Geoscientists of Nova Scotia (Licence to Practice # 167). |
| 4. | I have worked as a geoscientist in the minerals industry for over 40 years. |
| 5. | I am familiar with NI 43-101 and, by reason of education, experience and professional registration, I fulfil the requirements of a Qualified Person as defined in NI 43-101. My work experience includes 4 years as an exploration geologist working primarily on precious and base metal deposits, more than 11 years as a mine geologist in underground mines working with resource and reserve estimations and 25 years as a surficial geologist and consulting geologist on precious and base metals, industrial and speciality minerals overseeing resource and reserve estimations and other aspects of projects. |
| 6. | I have read NI 43-101 and this Technical Report has been prepared in compliance with the instrument. |
| 7. | I visited the San Francisco Project between December 8, 2025 and December 10, 2025 with the December 9, 2025 spent on site. I also visited the Project in 2005, 2007,2008, 2009, 2010, 2011, 2013, 2016 (two visits) and in 2017. |
| 8. | I have co-authored multiple Technical Reports since 2005 for the mineral property that is the subject of this Technical Report. |
| 9. | I am independent of Goldgroup Mining Inc. and its subsidiaries according to the definition described in NI 43-101 and the Companion Policy 43-101 CP. |
| 10. | I am responsible for the preparation of Sections 1.1 to 1.6, 1.9, 1.10, 2 to 11, 12.3, 14.6, 24,25.1, 25.3 to 25.5, 26 and 27 of this Technical Report with Sections 15 through 22 not applicable to this Technical Report. |
| 11. | As of the effective date of this Technical Report, to the best of my knowledge, information and belief, the Technical Report contains all scientific and technical information that is required to be disclosed to make this Technical Report not misleading. |
Report Dated this 1st day of May, 2026 with an effective date of April 30, 2026.
“William J. Lewis” {signed and sealed as of the report date}
William J. Lewis, B.Sc., P.Geo.
Principal Geologist, Micon International Limited
| San Francisco Project | 180 | May 1, 2026 |
| Goldgroup Mining Inc. |
CERTIFICATE OF AUTHOR
Richard M. Gowans, P.Eng.
As the co-author of this report for Goldgroup Mining Inc. entitled “NI 43-101 Technical Report for the San Francisco Project, Sonora, Mexico” dated May 1, 2026, with an effective date of April 30, 2026, I, Richard Gowans do hereby certify that:
| 1. | I am employed as Principal Metallurgist by, and carried out this assignment for, Micon International Limited, Suite 501, 212 King Street West, Toronto, Ontario M5H 1K5, tel. (416) 362-5135, e-mail rgowans@micon-international.com. |
| 2. | I hold the following academic qualifications: |
| B.Sc. (Hons) | Minerals Engineering, The University of Birmingham, U.K. | 1980. |
| 3. | I am a registered Professional Engineer of Ontario (membership number 90529389); as well, I am a member in good standing of the Canadian Institute of Mining, Metallurgy and Petroleum. |
| 4. | I am familiar with NI 43-101 and, by reason of education, experience and professional registration, fulfil the requirements of a Qualified Person as defined in NI 43-101. My work experience includes over 30 years of the management of technical studies and design of numerous metallurgical testwork programs and metallurgical processing plants. |
| 5. | I have read NI 43-101, and this Technical Report has been prepared in compliance with the instrument. |
| 6. | I have not visited the San Francisco Project. |
| 7. | I have not participated in the preparation of prior Technical Reports on the San Francisco Project. |
| 8. | I am independent of Goldgroup Mining Inc. and its related entities, as defined in Section 1.5 of NI 43-101. |
| 9. | I am responsible for Sections 1.7 and 13 of this Technical Report with Sections 15 through 22 not applicable to this Technical Report. |
| 10. | As of the date of this certificate, to the best of my knowledge, information and belief, the Technical Report contains all scientific and technical information that is required to be disclosed to make this Technical Report not misleading. |
Report Dated this 1st day of May, 2026 with an effective date of April 30, 2026.
“Richard M. Gowans” {signed and sealed as of the report date}
Richard Gowans P.Eng.
Principal Metallurgist, Micon International Limited
| San Francisco Project | 181 | May 1, 2026 |
| Goldgroup Mining Inc. |
CERTIFICATE OF AUTHOR
Tudorel Ciuculescu, B.Sc., M.Sc., P.Geo.
As the co-author of this report for Goldgroup Mining Inc. entitled “NI 43-101 Technical Report for the San Francisco Project, Sonora, Mexico” dated May 1, 2026, with an effective date of April 30, 2026, I, Tudorel Ciuculescu, do hereby certify that:
| 1. | I am employed as a Principal Geologist, and carried out this assignment for, Micon International Limited, Suite 501, 212 King St. W, Toronto, Ontario M5H 1K5, tel. (416) 362-5135, e-mail tciuculescu@micon-international.com. |
I am a graduate of University of Bucharest with a B.Sc. degree in Geology in 2000 and University of Toronto with a M.Sc. degree in Geology in 2003.
| 2. | I am registered as a Professional Geologist in the Province of Ontario (Reg. #1882) and in the Province of Newfoundland and Labrador (Reg. #10652). |
| 3. | I have worked as a geoscientist in the minerals industry for over 20 years. |
| 4. | I am familiar with NI 43-101 and, by reason of education, experience and professional registration, I fulfil the requirements of a Qualified Person as defined in NI 43-101. My work experience includes over nine years as an exploration geologist working on precious, base, and specialty metal deposits, and over one year as a consultant managing technical studies, due diligence reviews, and the preparation of Technical Reports in accordance with National Instrument 43-101. |
| 5. | I have read NI 43-101 and this Technical Report has been prepared in compliance with the instrument. |
| 6. | I visited the San Francisco Project between December 8, 2025 and December 10, 2025 with the December 9, 2025 spent on site. |
| 7. | This is the first Technical Report I have co-authored for the mineral property that is the subject of this Technical Report. |
| 8. | I am independent of Goldgroup Mining Inc. and its subsidiaries according to the definition described in NI 43-101 and the Companion Policy 43-101 CP. |
| 9. | I am responsible for the preparation of Sections 1.8, 12.1, 12.2, 14.1 to 14.5, 25.2 of this Technical Report with Sections 15 through 22 not applicable to this Technical Report. |
| 10. | As of the effective date of this Technical Report, to the best of my knowledge, information and belief, the Technical Report contains all scientific and technical information that is required to be disclosed to make this Technical Report not misleading. |
Report Dated this 1st day of May, 2026 with an effective date of April 30, 2026.
“Tudorel Ciuculescu” {signed and sealed as of the report date}
Tudorel Ciuculescu, B.Sc., M.Sc., P.Geo.
Principal Resource Geologist, Micon International Limited
| San Francisco Project | 182 | May 1, 2026 |
| Goldgroup Mining Inc. |
APPENDIX I
GLOSSARY OF MINING AND OTHER RELATED TERMS
| San Francisco Project | 183 | May 1, 2026 |
| Goldgroup Mining Inc. |
The following is a glossary of certain mining terms that may be used in this Technical Report.
A
| Assay | A chemical test performed on a sample of ores or minerals to determine the amount of valuable metals contained. |
B
| Base metal | Any non-precious metal (e.g., copper, lead, zinc, nickel, etc.). |
| Bulk mining | Any large-scale, mechanized method of mining involving many thousands of tonnes of ore being brought to surface per day. |
| Bulk sample | A large sample of mineralized rock, frequently hundreds of tonnes, selected in such a manner as to be representative of the potential orebody being sampled. The sample is usually used to determine metallurgical characteristics. |
| By-product | A secondary metal or mineral product recovered in the milling process. |
C
| Channel sample | A sample composed of pieces of vein or mineral deposit that have been cut out of a small trench or channel, usually about 10 cm wide and 2 cm deep. |
| Chip sample | A method of sampling a rock exposure whereby a regular series of small chips of rock is broken off along a line across the face. |
| CIM Standards | The CIM Definition Standards on Mineral Resources and Mineral Reserves adopted by CIM Council from time to time. The most recent update adopted by the CIM Council is effective as of May 10, 2014. |
| CIM | The Canadian Institute of Mining, Metallurgy and Petroleum. |
| Concentrate | A fine, powdery product of the milling process containing a high percentage of valuable metal. |
| Contact | A geological term used to describe the line or plane along which two different rock formations meet. |
| Core | The long cylindrical piece of rock, about an inch in diameter, brought to surface by diamond drilling. |
| Core sample | One or several pieces of whole or split parts of core selected as a sample for analysis or assay. |
| Cross-cut | A horizontal opening driven from a shaft and (or near) right angles to the strike of a vein or other orebody. The term is also used to signify that a drill hole is crossing the mineralization at or near right angles to it. |
| Cut-off grade | The lowest grade of mineralized rock that qualifies as ore grade in a given deposit, and is also used as the lowest grade below which the mineralized rock currently cannot be profitably exploited. Cut-off grades vary between deposits and commodity types depending upon the amenability of the mineralization to extraction and upon production costs. |
| San Francisco Project | 184 | May 1, 2026 |
| Goldgroup Mining Inc. |
D
| Deposit | An informal term for an accumulation of mineralization or other valuable earth material of any origin. |
| Development drilling | Drilling to establish accurate estimates of mineral resources or reserves usually in an operating mine or advanced project. |
| Dilution | Rock that is, by necessity, removed along with the ore in the mining process, subsequently lowering the grade of the ore. |
| Dip | The angle at which a vein, structure or rock bed is inclined from the horizontal as measured at right angles to the strike. |
E
| Epithermal | Hydrothermal mineral deposit formed within one kilometre of the earth’s surface, in the temperature range of 50 to 200°C. |
| Epithermal deposit | A mineral deposit consisting of veins and replacement bodies, usually in volcanic or sedimentary rocks, containing precious metals or, more rarely, base metals. |
| Exploration | Prospecting, sampling, mapping, diamond drilling and other work involved in searching for ore. |
F
| Face | The end of a drift, cross-cut or stope in which work is taking place. |
| Fault | A break in the Earth's crust caused by tectonic forces which have moved the rock on one side with respect to the other. |
| Flotation | A milling process in which valuable mineral particles are induced to become attached to bubbles and float as others sink. |
| Fold | Any bending or wrinkling of rock strata. |
| Footwall | The rock on the underside of a vein or mineralized structure or deposit. |
| Fracture | A break in the rock, the opening of which allows mineral-bearing solutions to enter. A "cross-fracture" is a minor break extending at more-or-less right angles to the direction of the principal fractures. |
| San Francisco Project | 185 | May 1, 2026 |
| Goldgroup Mining Inc. |
G
| Grade | Term used to indicate the concentration of an economically desirable mineral or element in its host rock as a function of its relative mass. With gold, this term may be expressed as grams per tonne (g/t) or ounces per tonne (opt). |
H
| Hangingwall | The rock on the upper side of a vein or mineral deposit. |
| High grade | Rich mineralization or ore. As a verb, it refers to selective mining of the best ore in a deposit. |
| Host rock | The rock surrounding an ore deposit. |
| Hydrothermal | Processes associated with heated or superheated water, especially mineralization or alteration. |
I
| Indicated Mineral Resource | An Indicated Mineral Resource is that part of a Mineral Resource for which quantity, grade or quality, densities, shape and physical characteristics are estimated with sufficient confidence to allow the application of Modifying Factors in sufficient detail to support mine planning and evaluation of the economic viability of the deposit. Geological evidence is derived from adequately detailed and reliable exploration, sampling and testing and is sufficient to assume geological and grade or quality continuity between points of observation. An Indicated Mineral Resource has a lower level of confidence than that applying to a Measured Mineral Resource and may only be converted to a Probable Mineral Reserve. |
| Inferred Mineral Resource | An Inferred Mineral Resource is that part of a Mineral Resource for which quantity and grade or quality are estimated on the basis of limited geological evidence and sampling. Geological evidence is sufficient to imply but not verify geological and grade or quality continuity. An Inferred Mineral Resource has a lower level of confidence than that applying to an Indicated Mineral Resource and must not be converted to a Mineral Reserve. It is reasonably expected that the majority of Inferred Mineral Resources could be upgraded to Indicated Mineral Resources with continued exploration. |
| Intrusive | A body of igneous rock formed by the consolidation of magma intruded into other |
K
| km | Abbreviation for kilometre(s). One kilometre is equal to 0.62 miles. |
L
| Leaching | The separation, selective removal or dissolving-out of soluble constituents from a rock or ore body by the natural actions of percolating solutions. |
| Level | The horizontal openings on a working horizon in a mine; it is customary to work mines from a shaft, establishing levels at regular intervals, generally about 50 m or more apart. |
| San Francisco Project | 186 | May 1, 2026 |
| Goldgroup Mining Inc. |
M
| m | Abbreviation for metre(s). One metre is equal to 3.28 feet. |
| Measured Mineral Resource | A Measured Mineral Resource is that part of a Mineral Resource for which quantity, grade or quality, densities, shape, and physical characteristics are estimated with confidence sufficient to allow the application of Modifying Factors to support detailed mine planning and final evaluation of the economic viability of the deposit. Geological evidence is derived from detailed and reliable exploration, sampling and testing and is sufficient to confirm geological and grade or quality continuity between points of observation. A Measured Mineral Resource has a higher level of confidence than that applying to either an Indicated Mineral Resource or an Inferred Mineral Resource. It may be converted to a Proven Mineral Reserve or to a Probable Mineral Reserve. |
| Metallurgy | The science and art of separating metals and metallic minerals from their ores by mechanical and chemical processes. |
| Metamorphic | Affected by physical, chemical, and structural processes imposed by depth in the earth’s crust. |
| Mill | A plant in which ore is treated and metals are recovered or prepared for smelting also, a revolving drum used for the grinding of ores in preparation for treatment. |
| Mine | An excavation beneath the surface of the ground from which mineral matter of value is extracted. |
| Mineral | A naturally occurring homogeneous substance having definite physical properties and chemical composition and, if formed under favourable conditions, a definite crystal form. |
| Mineral Claim/Concession | That portion of public mineral lands which a party has staked or marked out in accordance with federal or state mining laws to acquire the right to explore for and exploit the minerals under the surface. |
| Mineralization | The process or processes by which mineral or minerals are introduced into a rock, resulting in a valuable or potentially valuable deposit. |
| Mineral Resource | A Mineral Resource is a concentration or occurrence of solid material of economic interest in or on the Earth’s crust in such form, grade or quality and quantity that there are reasonable prospects for eventual economic extraction. The location, quantity, grade or quality, continuity and other geological characteristics of a Mineral Resource are known, estimated or interpreted from specific geological evidence and knowledge, including sampling. Material of economic interest refers to diamonds, natural solid inorganic material, or natural solid fossilized organic material including base and precious metals, coal, and industrial minerals. The term mineral resource used in this report is a Canadian mining term as defined in accordance with NI 43-101 – Standards of Disclosure for Mineral Projects under the guidelines set out in the Canadian Institute of Mining, Metallurgy and Petroleum (the CIM), Standards on Mineral Resource and Mineral Reserves Definitions and guidelines adopted by the CIM Council on December 11, 2005 and recently updated as of May 10, 2014 (the CIM Standards). |
| San Francisco Project | 187 | May 1, 2026 |
| Goldgroup Mining Inc. |
| Mineral Reserve | A Mineral Reserve is the economically mineable part of a Measured and/or Indicated Mineral Resource. It includes diluting materials and allowances for losses, which may occur when the material is mined or extracted and is defined by studies at Pre-Feasibility or Feasibility level as appropriate that include application of Modifying Factors. Such studies demonstrate that, at the time of reporting, extraction could reasonably be justified. The reference point at which Mineral Reserves are defined, usually the point where the ore is delivered to the processing plant, must be stated. It is important that, in all situations where the reference point is different, such as for a saleable product, a clarifying statement is included to ensure that the reader is fully informed as to what is being reported. The public disclosure of a Mineral Reserve must be demonstrated by a Pre-Feasibility Study or Feasibility Study. |
N
| NI 43-101 | National Instrument 43-101 is a national instrument for the Standards of Disclosure for Mineral Projects within Canada. The Instrument is a codified set of rules and guidelines for reporting and displaying information related to mineral properties owned by, or explored by, companies which report these results on stock exchanges within Canada. This includes foreign-owned mining entities who trade on stock exchanges overseen by the Canadian Securities Administrators (CSA), even if they only trade on Over-The-Counter (OTC) derivatives or other instrumented securities. The NI 43-101 rules and guidelines were updated as of June 30, 2011. |
O
| Open Pit/Cut | A form of mining operation designed to extract minerals that lie near the surface. Waste or overburden is first removed, and the mineral is broken and loaded for processing. The mining of metalliferous ores by surface-mining methods is commonly designated as open-pit mining as distinguished from strip mining of coal and the quarrying of other non-metallic materials, such as limestone and building stone. |
| Outcrop | An exposure of rock or mineral deposit that can be seen on surface, that is, not covered by soil or water. |
| Oxidation | A chemical reaction caused by exposure to oxygen that results in a change in the chemical composition of a mineral. |
P
| Plant | A building or group of buildings in which a process or function is carried out; at a mine site it will include warehouses, hoisting equipment, compressors, maintenance shops, offices and the mill or concentrator. |
| San Francisco Project | 188 | May 1, 2026 |
| Goldgroup Mining Inc. |
| Plunge | Plunge refers to the downward angle and direction of a linear structure. Most commonly it is used to measure the direction and angle of the plunge of a fold axis or hinge. |
| Probable Reserve | A Probable Mineral Reserve is the economically mineable part of an Indicated, and in some circumstances, a Measured Mineral Resource. The confidence in the Modifying Factors applying to a Probable Mineral Reserve is lower than that applying to a Proven Mineral Reserve. |
| Proven Reserve | A Proven Mineral Reserve is the economically mineable part of a Measured Mineral Resource. A Proven Mineral Reserve implies a high degree of confidence in the Modifying Factors. |
| Pyrite | A common, pale-bronze or brass-yellow, mineral composed of iron and sulphur. Pyrite has a brilliant metallic luster and has been mistaken for gold. Pyrite is the most wide-spread and abundant of the sulphide minerals and occurs in all kinds of rocks. |
Q
| Qualified Person | Conforms to that definition under NI 43-101 for an individual: (a) to be an engineer or geoscientist with a university degree, or equivalent accreditation, in an area of geoscience, or engineering, related to mineral exploration or mining; (b) has at least five years' experience in mineral exploration, mine development or operation or mineral project assessment, or any combination of these, that is relevant to his or her professional degree or area of practice; (c) to have experience relevant to the subject matter of the mineral project and the Technical Report; (d) is in good standing with a professional association; and (e) in the case of a professional association in a foreign jurisdiction, has a membership designation that (i) requires attainment of a position of responsibility in their profession that requires the exercise of independent judgement; and (ii) requires (A.) a favourable confidential peer evaluation of the individual’s character, professional judgement, experience, and ethical fitness; or (B.) a recommendation for membership by at least two peers, and demonstrated prominence or expertise in the field of mineral exploration or mining. |
R
| Reclamation | The restoration of a site after mining or exploration activity is completed. |
S
| Shoot | A concentration of mineral values; that part of a vein or zone carrying values of ore grade. |
| Stockpile | Broken ore heaped on surface, pending treatment or shipment. |
| Strike | The direction, or bearing from true north, of a vein or rock formation measure on a horizontal surface. |
| Stringer | A narrow vein or irregular filament of a mineral or minerals traversing a rock mass. |
| San Francisco Project | 189 | May 1, 2026 |
| Goldgroup Mining Inc. |
T
| Terrain | A terrain in geology, in full a tectonostratigraphic terrain, is a fragment of crustal material formed on, or broken off from, one tectonic plate and accreted or "sutured" to crust lying on another plate. |
| Tonne | A metric ton of 1,000 kilograms (2,205 pounds). |
U
| Underground Mining | Is the process of extracting rock from underground using a network of tunnels and openings, often called stopes. This mining is generally more expensive with lower production rates due to the use of smaller equipment than open pit/ open cast mining at the surface. |
V
| Vein | A fissure, fault or crack in a rock filled by minerals that have travelled upwards from some deep source. |
| Volcanogenic | Formed by processes directly connected with volcanism: specif., said of mineral deposits (massive sulphides, exhalites, banded iron formations) considered to have been produced through volcanic agencies and demonstrably associated with volcanic phenomena. |
W
| Wall rocks | Rock units on either side of an orebody. The hanging wall and footwall rocks of a mineral deposit or orebody. |
| Waste | Unmineralized, or sometimes mineralized, rock that is not minable at a profit. |
| Working(s) | May be a shaft, quarry, level, open-cut, open pit, or stope etc. Usually noted in the plural. |
Z
| Zone | An area of distinct mineralization. |
| San Francisco Project | 190 | May 1, 2026 |